Attached files
| file | filename |
|---|---|
| 8-K - 8-K - DUNKIN' BRANDS GROUP, INC. | a8kjan2014.htm |
| EX-99.1 - PRESS RELEASE - DUNKIN' BRANDS GROUP, INC. | exhibit991.htm |
Investor Presentation Dunkin’ Brands Group, Inc. 1 ICR XChange Conference
Forward-Looking Statements • Certain information contained in this presentation, particularly information regarding future economic performance, finances, and expectations and objectives of management constitutes forward-looking statements. Forward-looking statements can be identified by the fact that they do not relate strictly to historical or current facts and are generally contain words such as “believes,” “expects,” “may,” “will,” “should,” “seeks,” “approximately,” “intends,” “plans,” “estimates” or “anticipates” or similar expressions. Our forward-looking statements are subject to risks and uncertainties, which may cause actual results to differ materially from those projected or implied by the forward-looking statement. • Forward-looking statements are based on current expectations and assumptions and currently available data and are neither predictions nor guarantees of future events or performance. You should not place undue reliance on forward-looking statements, which speak only as of the date hereof. We do not undertake to update or revise any forward-looking statements after they are made, whether as a result of new information, future events, or otherwise, except as required by applicable law. For discussion of some of the important factors that could cause these variations, please consult the “Risk Factors” section of the Company’s most recent Annual Report on Form 10-K. Nothing in this presentation should be regarded as a representation by any person that these targets will be achieved and the Company undertakes no duty to update its targets. • Regulation G This presentation contains certain non-GAAP measures which are provided to assist in an understanding of the Dunkin’ Brands Group, Inc. business and its performance. These measure should always be considered in conjunction with the appropriate GAAP measure. Reconciliations of non-GAAP amounts to the relevant GAAP amount are available on www.investor.dunkinbrands.com. 2
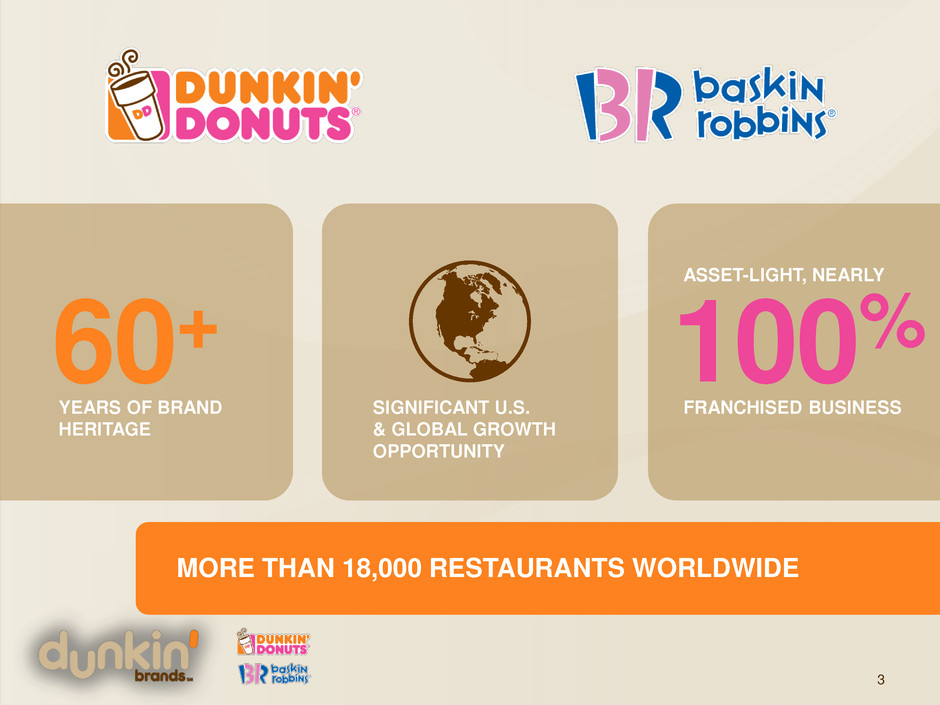
3 YEARS OF BRAND HERITAGE SIGNIFICANT U.S. & GLOBAL GROWTH OPPORTUNITY ASSET-LIGHT, NEARLY 60+ 100% FRANCHISED BUSINESS MORE THAN 18,000 RESTAURANTS WORLDWIDE
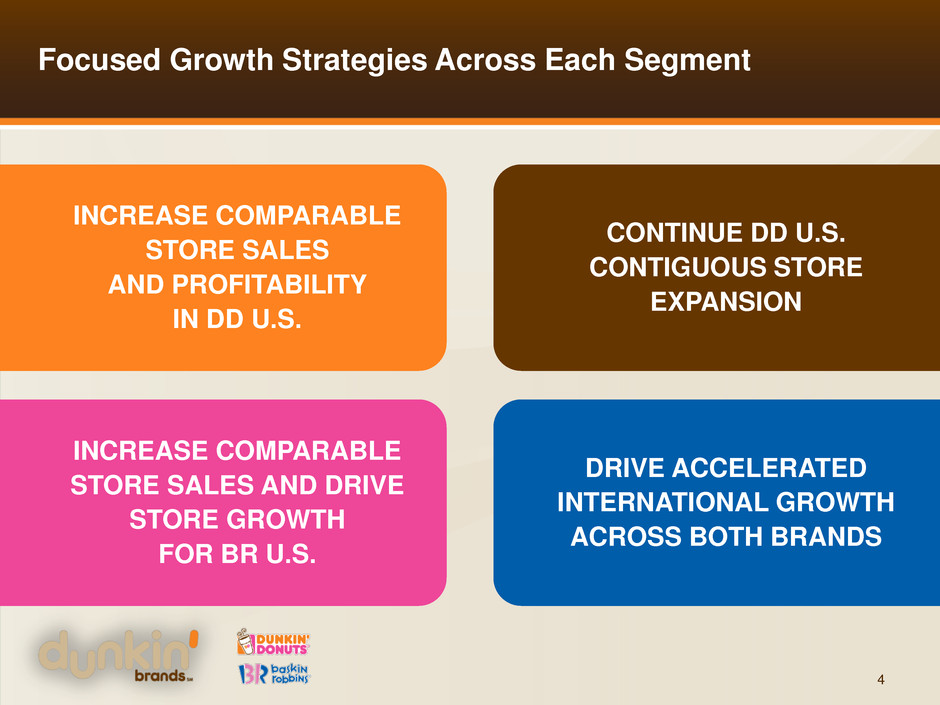
Focused Growth Strategies Across Each Segment 4 INCREASE COMPARABLE STORE SALES AND PROFITABILITY IN DD U.S. INCREASE COMPARABLE STORE SALES AND DRIVE STORE GROWTH FOR BR U.S. CONTINUE DD U.S. CONTIGUOUS STORE EXPANSION DRIVE ACCELERATED INTERNATIONAL GROWTH ACROSS BOTH BRANDS
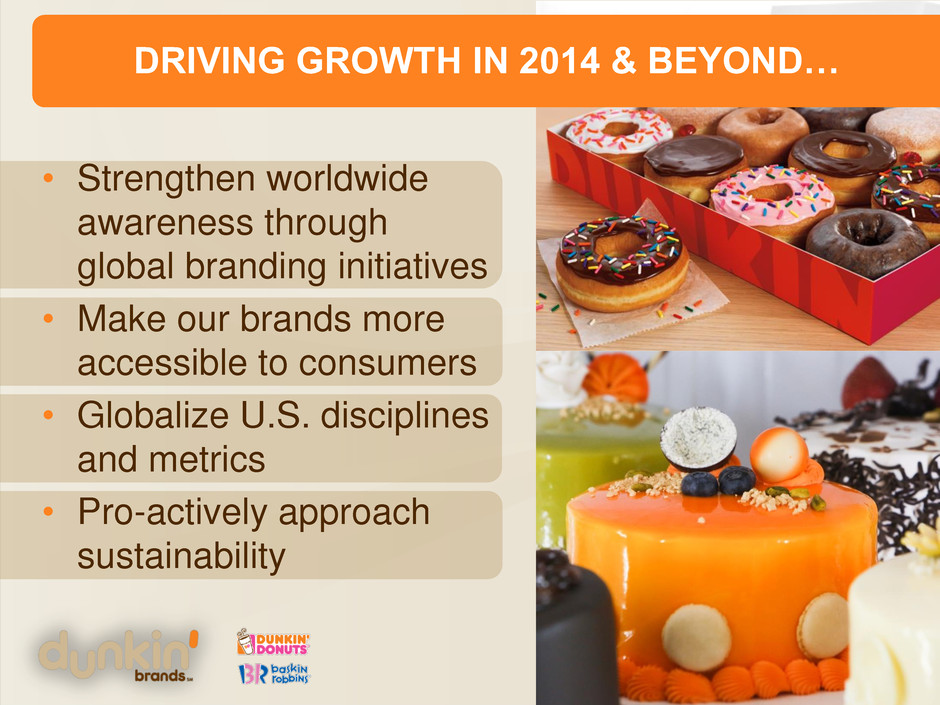
5 DRIVING GROWTH IN 2014 & BEYOND… • Strengthen worldwide awareness through global branding initiatives • Make our brands more accessible to consumers • Globalize U.S. disciplines and metrics • Pro-actively approach sustainability
6 INCREASE COMPARABLE STORE SALES AND PROFITABILITY IN DD U.S.
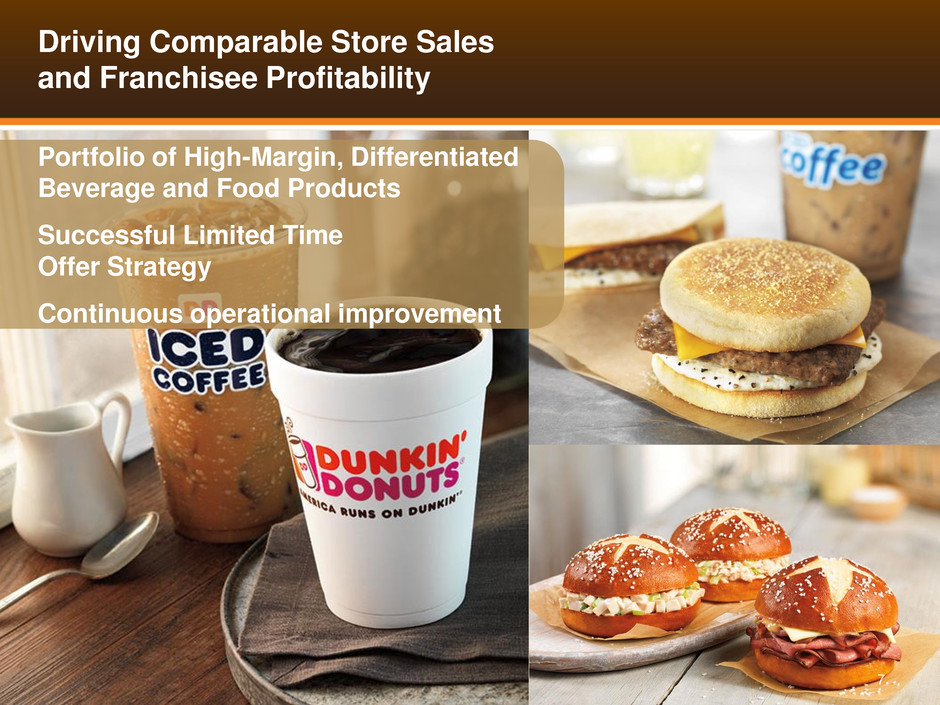
Driving Comparable Store Sales and Franchisee Profitability 7 Portfolio of High-Margin, Differentiated Beverage and Food Products Successful Limited Time Offer Strategy Continuous operational improvement
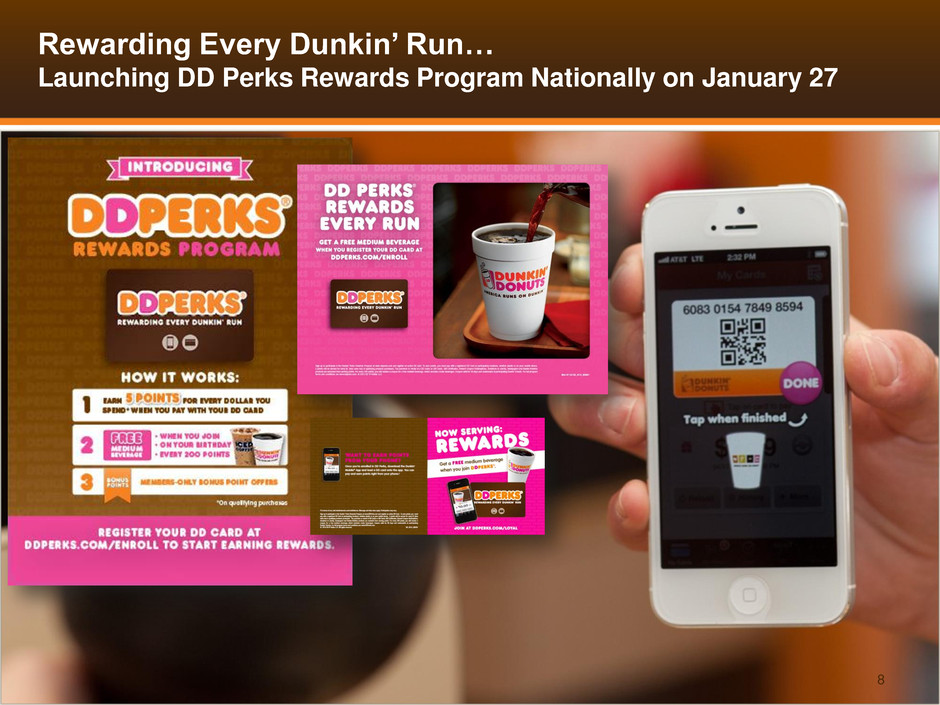
Rewarding Every Dunkin’ Run… Launching DD Perks Rewards Program Nationally on January 27 8
9 CONTINUE DD U.S. CONTIGUOUS STORE EXPANSION
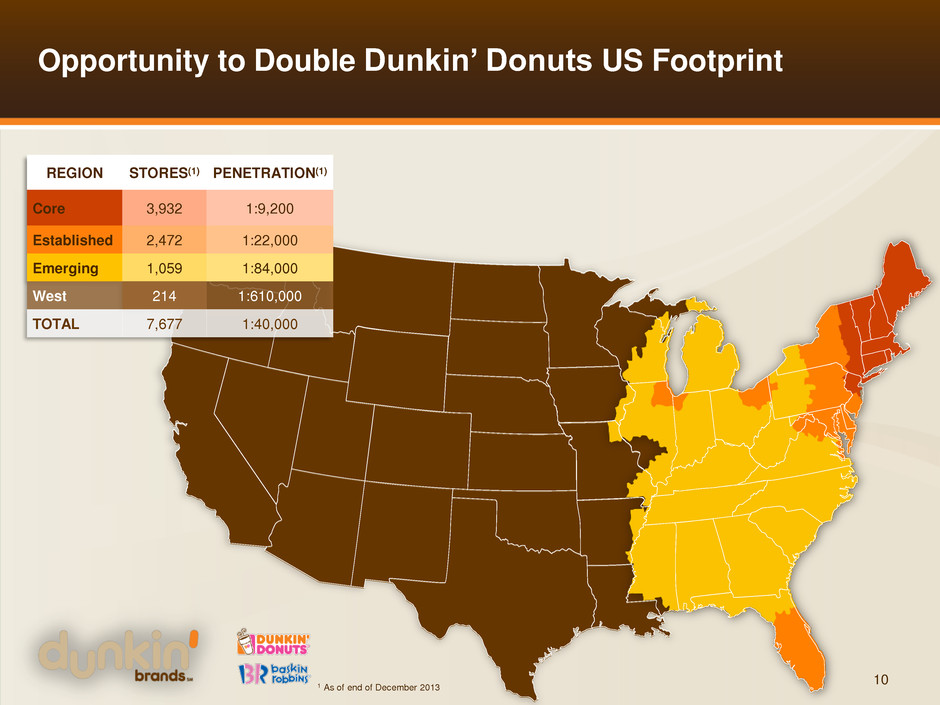
Opportunity to Double Dunkin’ Donuts US Footprint 10 REGION STORES(1) PENETRATION(1) Core 3,932 1:9,200 Established 2,472 1:22,000 Emerging 1,059 1:84,000 West 214 1:610,000 TOTAL 7,677 1:40,000 1 As of end of December 2013
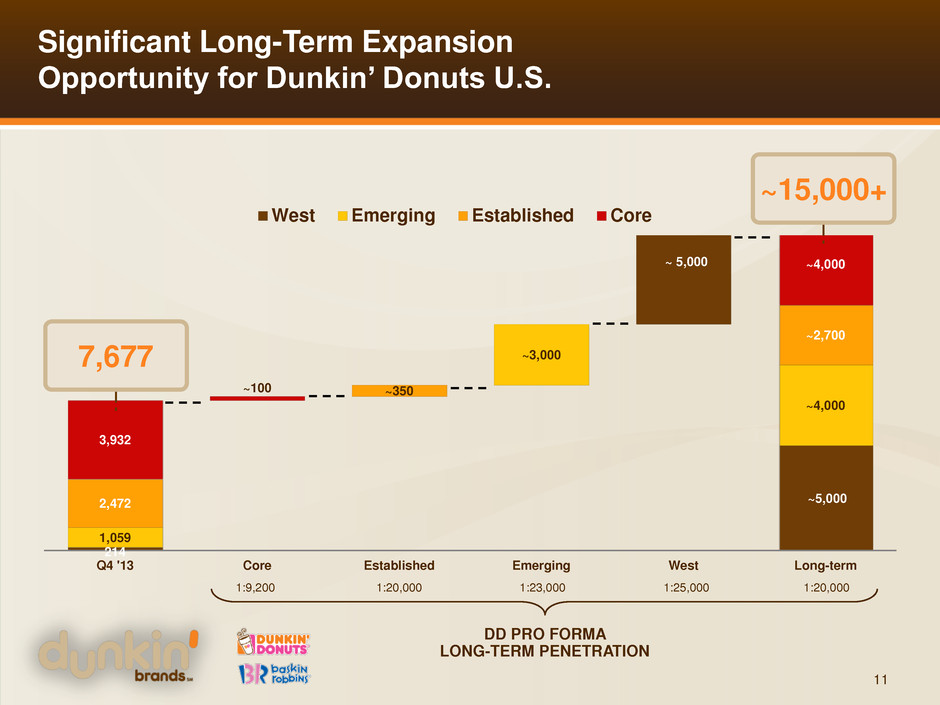
214 ~5,000 1,059 ~4,000 2,472 ~2,700 3,932 ~4,000 ~100 ~350 ~3,000 ~ 5,000 Q4 '13 Core Established Emerging West Long-term West Emerging Established Core 7,677 ~15,000+ Significant Long-Term Expansion Opportunity for Dunkin’ Donuts U.S. 11 1:9,200 1:20,000 1:23,000 1:25,000 1:20,000 DD PRO FORMA LONG-TERM PENETRATION
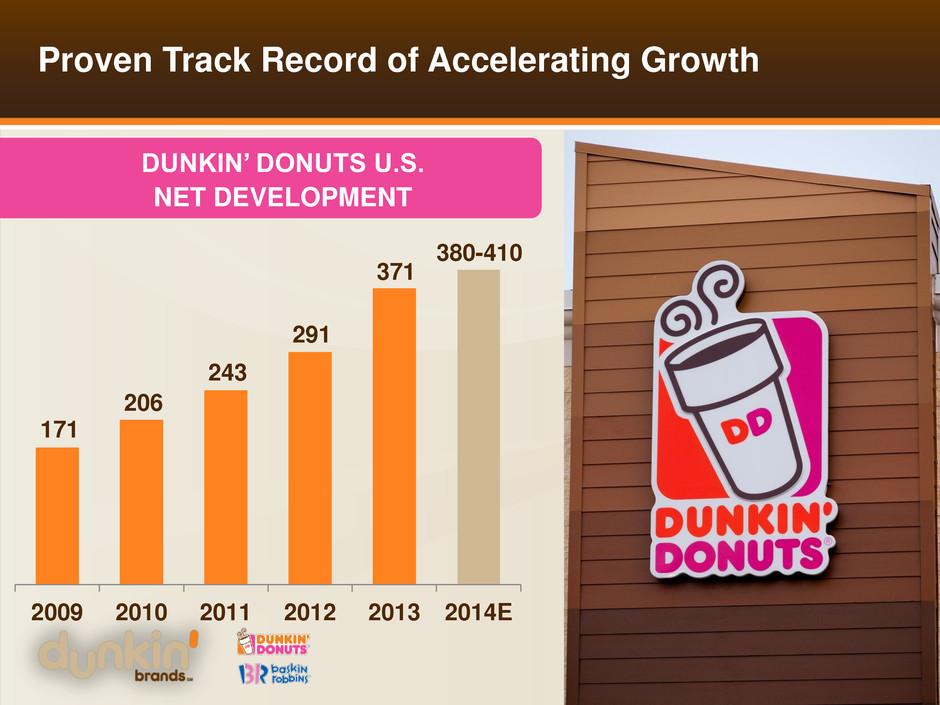
Proven Track Record of Accelerating Growth 12 2009 2010 2011 2012 2013 2014E 171 206 243 291 371 380-410 DUNKIN’ DONUTS U.S. NET DEVELOPMENT
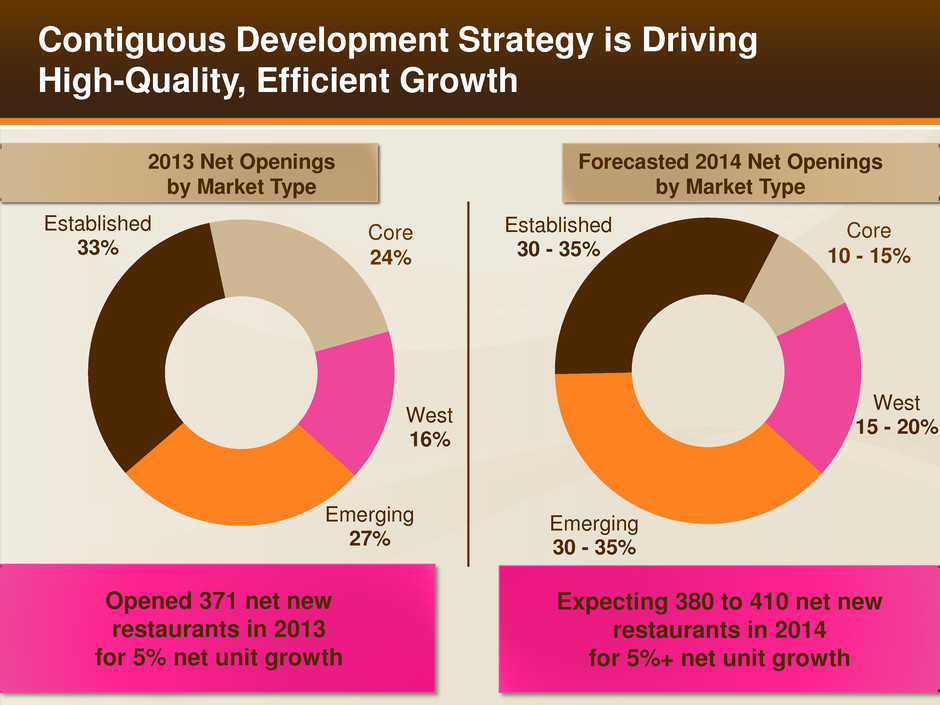
Contiguous Development Strategy is Driving High-Quality, Efficient Growth Emerging 27% Established 33% West 16% Core 24% 2013 Net Openings by Market Type 13 Emerging 30 - 35% Established 30 - 35% West 15 - 20% Core 10 - 15% Forecasted 2014 Net Openings by Market Type Opened 371 net new restaurants in 2013 for 5% net unit growth Expecting 380 to 410 net new restaurants in 2014 for 5%+ net unit growth
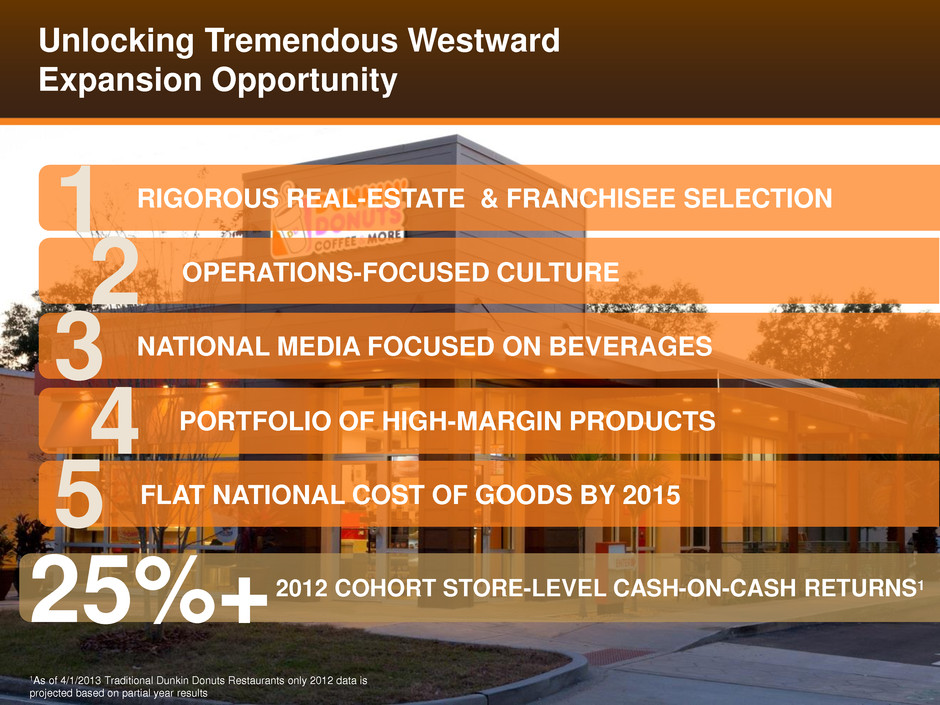
Unlocking Tremendous Westward Expansion Opportunity 14 2012 COHORT STORE-LEVEL CASH-ON-CASH RETURNS1 25%+ 1As of 4/1/2013 Traditional Dunkin Donuts Restaurants only 2012 data is projected based on partial year results RIGOROUS REAL-ESTATE & FRANCHISEE SELECTION OPERATIONS-FOCUSED CULTURE NATIONAL MEDIA FOCUSED ON BEVERAGES 1 2 3 4 5 PORTFOLIO OF HIGH-MARGIN PRODUCTS FLAT NATIONAL COST OF GOODS BY 2015
15 DRIVE ACCELERATED INTERNATIONAL GROWTH ACROSS BOTH BRANDS
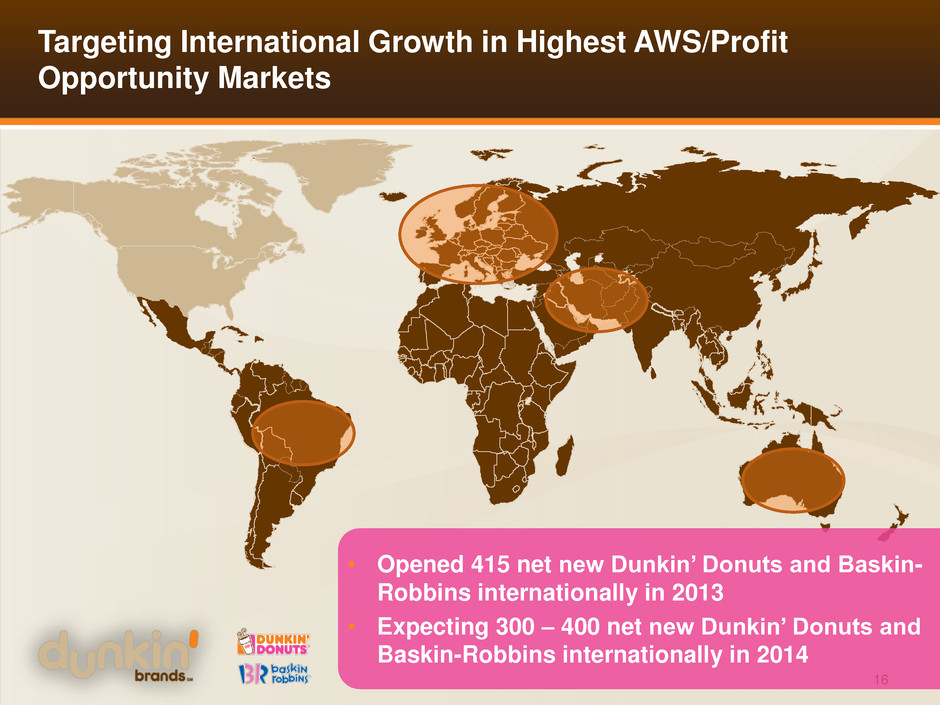
Targeting International Growth in Highest AWS/Profit Opportunity Markets 16 • Opened 415 net new Dunkin’ Donuts and Baskin- Robbins internationally in 2013 • Expecting 300 – 400 net new Dunkin’ Donuts and Baskin-Robbins internationally in 2014
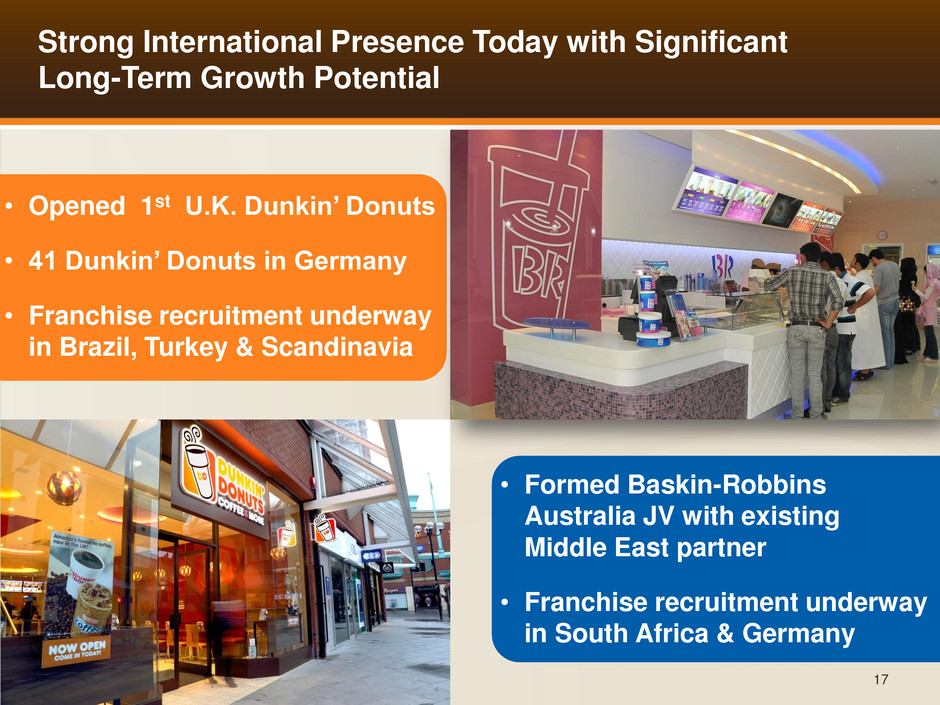
Strong International Presence Today with Significant Long-Term Growth Potential 17 • Opened 1st U.K. Dunkin’ Donuts • 41 Dunkin’ Donuts in Germany • Franchise recruitment underway in Brazil, Turkey & Scandinavia • Formed Baskin-Robbins Australia JV with existing Middle East partner • Franchise recruitment underway in South Africa & Germany
18 INCREASE COMPARABLE STORE SALES AND DRIVE STORE GROWTH FOR BR U.S.
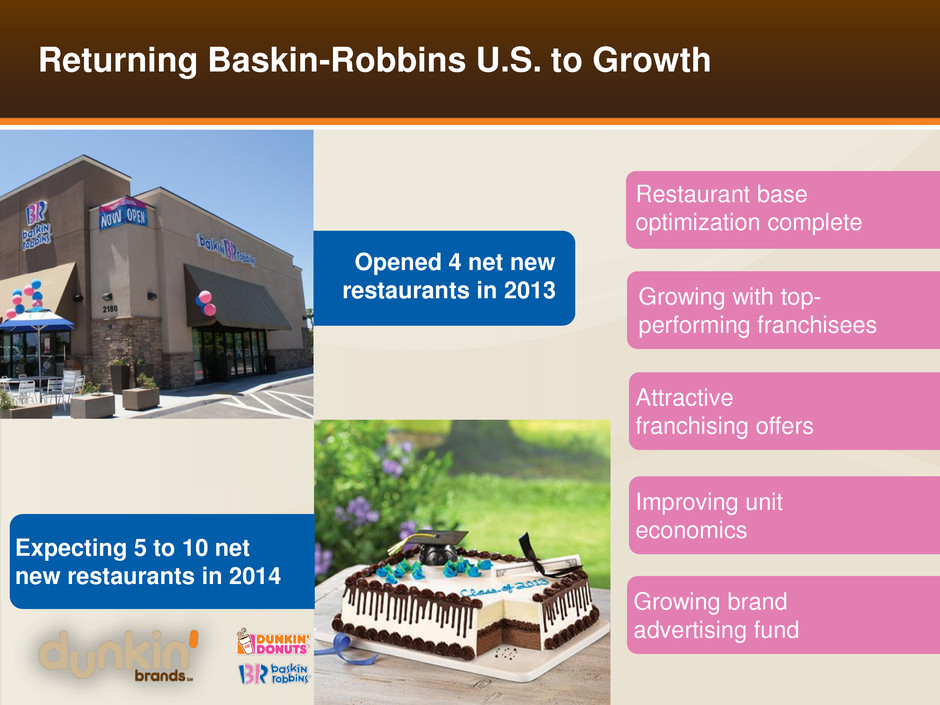
Returning Baskin-Robbins U.S. to Growth Restaurant base optimization complete Improving unit economics Attractive franchising offers 19 Opened 4 net new restaurants in 2013 Expecting 5 to 10 net new restaurants in 2014 Growing with top- performing franchisees Growing brand advertising fund
Long-Term Earnings Targets 20 STRONG, CONSISTENT REVENUE GROWTH U.S. consolidated comps in the 2 – 4% range Total net unit development of approximately 4 – 6% with opportunity to accelerate HIGHLY LEVERAGEABLE COST STRUCTURE Drives margin expansion of 150 – 200 bps per year STRONG FREE CASH FLOW Facilitates earnings growth through deleveraging or shareholder payout DRIVERS LONG-TERM TARGETS 6 – 8% revenue growth 10 – 12% adjusted operating income growth 15%+ adjusted EPS growth
21 Brands have unique mix of heritage and consumer buzz Track record of driving strong comps Domestic and international growth opportunities Focused on driving disciplined, profitable growth by franchisees Asset-light business model generating strong cash flow Key ingredients in place to drive sustainable long- term growth EXPECT TO OPEN 685 TO 800 NET NEW RESTAURANTS GLOBALLY IN 2014
22
