Attached files
| file | filename |
|---|---|
| EX-4.1 - EX-4.1 - Santander Consumer USA Holdings Inc. | d629853dex41.htm |
| EX-23.1 - EX-23.1 - Santander Consumer USA Holdings Inc. | d629853dex231.htm |
Table of Contents
As filed with the Securities and Exchange Commission on January 6, 2014
Registration No. 333-189807
UNITED STATES
SECURITIES AND EXCHANGE COMMISSION
Washington, D.C. 20549
Amendment No. 4
to
FORM S-1
REGISTRATION STATEMENT
UNDER
THE SECURITIES ACT OF 1933
SANTANDER CONSUMER USA HOLDINGS INC.
(Exact Name of Registrant as Specified in Its Charter)
| Delaware | 6141 | 32-0414408 | ||
| (State or other jurisdiction of incorporation or organization) |
(Primary Standard Industrial Classification Code Number) |
(I.R.S. Employer Identification Number) |
8585 North Stemmons Freeway Suite 1100-N
Dallas, Texas 75247
(214) 634-1110
(Address, including zip code, and telephone number, including area code, of Registrant’s principal executive offices)
Jason Kulas
President and Chief Financial Officer
8585 North Stemmons Freeway, Suite 1100-N
Dallas, Texas 75247
(214) 634-1110
(Name, address, including zip code, and telephone number, including area code, of agent for service)
Copies to:
| Richard K. Kim, Esq. Benjamin M. Roth, Esq. Mark F. Veblen, Esq. Wachtell, Lipton, Rosen & Katz 51 West 52nd Street New York, New York 10019 Telephone: (212) 403-1000 Facsimile: (212) 403-2000 |
Jeffrey D. Karpf, Esq. Cleary Gottlieb Steen & Hamilton LLP One Liberty Plaza New York, New York 10006 Telephone: (212) 225-2000 Facsimile: (212) 225-3999 |
Approximate date of commencement of proposed sale to the public: As soon as practicable after this Registration Statement becomes effective.
If any of the securities being registered on this Form are to be offered on a delayed or continuous basis pursuant to Rule 415 under the Securities Act of 1933, check the following box. ¨
If this Form is filed to register additional securities for an offering pursuant to Rule 462(b) under the Securities Act, please check the following box and list the Securities Act registration statement number of the earlier effective registration statement for the same offering. ¨
If this Form is a post-effective amendment filed pursuant to Rule 462(c) under the Securities Act, check the following box and list the Securities Act registration statement number of the earlier effective registration statement for the same offering. ¨
If this Form is a post-effective amendment filed pursuant to Rule 462(d) under the Securities Act, check the following box and list the Securities Act registration statement number of the earlier effective registration statement for the same offering. ¨
Indicate by check mark whether the registrant is a large accelerated filer, an accelerated filer, a non-accelerated filer, or a smaller reporting company. See the definitions of “large accelerated filer,” “accelerated filer” and “smaller reporting company” in Rule 12b-2 of the Exchange Act.
| Large accelerated filer | ¨ | Accelerated filer | ¨ | |||
| Non-accelerated filer | x (Do not check if a smaller reporting company) | Smaller reporting company | ¨ | |||
The Registrant hereby amends this Registration Statement on such date as may be necessary to delay its effective date until the Registrant shall file a further amendment which specifically states that this Registration Statement shall thereafter become effective in accordance with Section 8(a) of the Securities Act of 1933, or until this Registration Statement shall become effective on such date as the Securities and Exchange Commission, acting pursuant to said Section 8(a), may determine.
Table of Contents
The information in this preliminary prospectus is not complete and may be changed. We may not sell these securities until the registration statement filed with the Securities and Exchange Commission is effective. This preliminary prospectus is not an offer to sell these securities and it is not soliciting an offer to buy these securities in any jurisdiction where the offer or sale is not permitted.
Subject to Completion, Dated January 6, 2014.
PROSPECTUS
Shares

Santander Consumer USA Holdings Inc.
Common Stock
This is the initial public offering of our common stock. The selling stockholders named in this prospectus are selling shares of our common stock. We are not selling any shares of our common stock under this prospectus and will not receive any proceeds from the sale of the shares by the selling stockholders. We currently expect the initial public offering price to be between $ and $ per share of common stock.
Some of the selling stockholders have granted the underwriters an option to purchase up to additional shares of common stock.
We have applied to have the common stock listed on the New York Stock Exchange under the symbol “ .”
Investing in our common stock involves risks. See “Risk Factors” beginning on page 13.
Neither the Securities and Exchange Commission nor any state securities commission has approved or disapproved of these securities or determined if this prospectus is truthful or complete. Any representation to the contrary is a criminal offense.
| Per Share | Total | |||
| Public offering price |
||||
| Underwriting discounts |
||||
| Proceeds, to the selling stockholders (before expenses) |
The underwriters expect to deliver the shares to purchasers on or about , 2014 through the book-entry facilities of The Depository Trust Company, New York.
Global Coordinators and Joint Book-Running Managers
| Citigroup | J.P. Morgan |
Joint Book-Running Managers
| BofA Merrill Lynch | Deutsche Bank Securities | Santander |
| Barclays | Goldman, Sachs & Co. |
Morgan Stanley |
RBC Capital Markets |
| BMO Capital Markets | Credit Suisse | UBS Investment Bank | Wells Fargo Securities | |||||
Co-Managers
| KKR | Sandler O’Neill + Partners, L.P. |
Stephens Inc. | LOYAL3 Securities | |||
Prospectus dated , 2014
Table of Contents
We are responsible for the information contained in this prospectus and in any free writing prospectus we prepare or authorize. We have not authorized anyone to provide you with different information, and we take no responsibility for any other information others may give you. We are not, and the underwriters are not, making an offer to sell these securities in any jurisdiction where the offer or sale is not permitted. You should not assume that the information contained in this prospectus is accurate as of any date other than its date.
| Page | ||||
| 1 | ||||
| 13 | ||||
| 32 | ||||
| 33 | ||||
| 34 | ||||
| 35 | ||||
| 36 | ||||
| 37 | ||||
| 38 | ||||
| Management’s Discussion and Analysis of Financial Condition and Results Of Operations |
41 | |||
| 81 | ||||
| 99 | ||||
| 106 | ||||
| Security Ownership of Certain Beneficial Owners, Management and Selling Stockholders |
133 | |||
| 136 | ||||
| 144 | ||||
| 150 | ||||
| 152 | ||||
| 155 | ||||
| 158 | ||||
| 162 | ||||
| 162 | ||||
| 163 | ||||
| F-1 | ||||
Unless otherwise indicated, the information presented in this prospectus assumes (i) an initial public offering price of $ per share, which represents the midpoint of the range set forth on the cover page of this prospectus, and (ii) that the underwriters’ over-allotment option is not exercised.
Santander Consumer USA Holdings Inc. is a newly-formed Delaware corporation that has not, to date, conducted any activities other than those incident to its formation and the preparation of this registration statement. Unless we state otherwise or the context otherwise requires, references in this prospectus to “SCUSA,” “we,” “our,” “us,” and the “Company” for all periods after the reorganization transactions described in the section entitled “Reorganization” (which will be completed in connection with this offering) refer to Santander Consumer USA Holdings Inc. and its consolidated subsidiaries after giving effect to such reorganization transactions. For all periods before the completion of such reorganization transactions, these terms refer to Santander Consumer USA Inc., an Illinois corporation, and its predecessors and their respective consolidated subsidiaries.
i
Table of Contents
About this Prospectus
Market Data
Market data used in this prospectus has been obtained from independent industry sources and publications, such as the Federal Reserve Bank of New York; the Federal Reserve Bank of Philadelphia; the Board of Governors of the Federal Reserve System; The Conference Board; the Consumer Financial Protection Bureau; Equifax Inc.; Experian Automotive; Chrysler Group LLC; Fair Isaac Corporation; FICO® Banking Analytics Blog; Polk Automotive; the United States Department of Commerce: Bureau of Economic Analysis; J.D. Power; and Ward’s Automotive Reports. Forward-looking information obtained from these sources is subject to the same qualifications and the additional uncertainties regarding the other forward-looking statements in this prospectus.
For purposes of this prospectus, we categorize the prime segment as borrowers with FICO® scores of 660 and above, the super prime segment as a portion of borrowers within the prime segment with FICO® scores of 720 and above, and the nonprime segment as borrowers with FICO® scores below 660. FICO® is a registered trademark of Fair Isaac Corporation. FICO® scores are provided by Fair Isaac Corporation and are designed to measure the likelihood that a consumer will pay his or her credit obligations as agreed.
Glossary of Selected Terms
Below is a list of additional terms and their respective meanings which we use throughout this prospectus.
Advance Rate
The maximum percentage of the value of collateral that a lender is willing to extend for a loan. The advance rate helps a borrower determine what kind of collateral to provide in order to secure the desired loan amount, and helps minimize a lender’s loss exposure when accepting collateral that can fluctuate in value.
Clean-Up Call
The action of an issuer of a debt instrument (such as a bond) requiring early redemption of the instrument before it is fully amortized.
Credit/Warehouse Facility (Line of Credit)
Any credit source extended to a business by a bank or other financial institution. A line of credit is effectively a source of funds that can readily be tapped at the borrower’s discretion. Interest is paid only on money actually withdrawn. However, the borrower may be required to pay an unused line fee, often an annualized percentage fee on the money not withdrawn. Lines of credit can be secured by collateral, or may be unsecured.
Credit Enhancement
Through credit enhancement, the lender is provided with reassurance that the borrower will honor the obligation through additional collateral, insurance, or a third-party guarantee. Credit enhancement reduces credit/default risk of a debt, thereby increasing the overall credit rating and lowering interest rates.
Dealer Loans
Floorplan lines of credit, real estate loans, and working capital loans to automotive dealers.
FICO®
A type of credit score that makes up a substantial portion of the credit report that lenders use to assess an applicant’s credit risk and whether to extend a loan.
ii
Table of Contents
FICO® is an acronym for the Fair Isaac Corporation, the creator of the FICO® score.
Using mathematical models, the FICO® score takes into account various factors in each of these five areas to determine credit risk: payment history, current level of indebtedness, types of credit used, length of credit history, and new credit. A person’s FICO® score will range between 300 and 850.
Floorplan Lines of Credit
A revolving line of credit that allows the borrower to obtain financing for retail goods. These loans are made against a specific piece of collateral (e.g., auto, recreational vehicle, manufactured home). When each piece of collateral is sold by the dealer, the loan advance against that piece of collateral is repaid.
Impairment Reserves
Loan loss reserves recorded on a portfolio of loans acquired with credit deterioration to cover losses incremental to those expected at the time of acquisition.
Loans That We Acquired and/or Convert
Loans that are included in pools of loans that we acquired as a portfolio from a third party.
Loans That We Originate
(i) Loans that we originate directly, (ii) individual retail installment contracts that we acquire from dealers immediately after origination by a dealer, and (iii) unsecured consumer loans, which includes point-of-sale financing, personal loans, and private label credit cards.
Nonaccretable Difference
The difference between the undiscounted contractual cash flows and the undiscounted expected cash. The nonaccretable difference represents an estimate of the credit risk in the loan portfolio at the acquisition date.
Non-captive Vehicle Lender
A lender that is not owned by a vehicle manufacturing company.
Off-Lease
A vehicle which was once leased, but now has been returned to the lessor due to contractual or early lease termination.
Origination Channels
The specific business relationship or channel through which a loan is made to a customer.
Overcollateralization
The process of posting more collateral than is needed to obtain or secure financing. Overcollateralization is often used as a method of credit enhancement by lowering the creditor’s exposure to default risk.
Perfected Security Interest
Security interest in an asset protected from claims by other parties. A lien is perfected by registering it with appropriate statutory authority so that it is made legally enforceable and any subsequent claim on that asset is given a junior status. Also called a perfected lien.
iii
Table of Contents
Private-Label Loans/Leases
Financings branded in the name of the product manufacturer rather than in the name of the finance company.
Remarketing
Vehicle remarketing is the controlled disposal of fleet and leasing vehicles that have reached the end of their fixed term or the process to resell repossessed vehicles.
Residual Values
Residual value describes the future value of a good at the end of the lease term based upon the percentage of depreciation of its initial value.
Subordinate Financing
Debt financing that is ranked behind that held by secured lenders in terms of the order in which the debt is repaid.
Subvention Program
Reimbursement to the finance company by a manufacturer for the difference between a market loan or lease rate and the below-market rate granted to the customer.
iv
Table of Contents
The following is a summary of selected information contained elsewhere in this prospectus. It does not contain all of the information that you should consider before deciding to purchase shares of common stock. You should read this entire prospectus carefully, particularly the section entitled “Risk Factors” immediately following this summary, the historical financial statements, and the related notes thereto and management’s discussion and analysis thereof included elsewhere in this prospectus, before making an investment decision to purchase our common stock.
Background
Overview
We are a full-service, technology-driven consumer finance company focused on vehicle finance and unsecured consumer lending products. We believe that, since our founding in 1995, we have achieved strong brand recognition in the nonprime vehicle finance space and have recently increased our presence in the prime space. We leverage our knowledge of consumer behavior via our sophisticated, proprietary software, which allows us to effectively price, manage, and monitor risk. As a result of our deep understanding of the market, we have consistently produced controlled growth and robust profitability in both economic expansions and downturns.
We believe our extensive data and advanced analytics tools enhance our proprietary loan origination, servicing and risk management platforms. We believe that these platforms are technologically sophisticated, readily expandable, and easily adaptable to a diverse set of consumer finance products. Led by our experienced and disciplined management team, we have rapidly grown our asset base since 2008 through originations and acquisitions without having to significantly invest in new infrastructure or compromise our credit performance. Our originations are sourced through many different channels, and we continue to grow our network of relationships in order to maximize our opportunities for growth. Our technologically-driven platform has enabled us to add over $34 billion of assets to our lending platform since 2008, and we continue to evaluate opportunities for additional acquisitions. Moreover, we service loans for others, which provides us with an additional and stable fee income stream.
Historically, we have originated loans primarily through franchised automotive dealers for manufacturers such as Chrysler, Ford, General Motors, and Toyota in connection with the sale of new and used vehicles to retail consumers. We currently have active relationships with over 14,000 such dealers throughout the United States. In February 2013, we entered into a ten-year agreement with Chrysler Group LLC (“Chrysler”) whereby we originate private-label loans and leases under the Chrysler Capital brand (“Chrysler Capital”) to facilitate Chrysler vehicle retail sales. We also originate loans through selected independent automobile dealers, such as CarMax, through national and regional banks as well as through relationships with other original equipment manufacturers (“OEMs”). Additionally, we directly originate and refinance vehicle loans via our branded online platform, RoadLoans.com, which is available through major online affiliates including Cars.com, AutoTrader.com, Kelley Blue Book, and eBay Motors. Moreover, we periodically purchase retail vehicle loan portfolios from other lenders.
We also provide unsecured consumer loans. Recently, we have entered into relationships with Bluestem Brands (“Bluestem”), a retailer, and LendingClub Corporation (“LendingClub”), a peer-to-peer lending platform, to acquire and, in certain circumstances, service unsecured consumer loans. In addition, we are utilizing our deep understanding of consumer finance to expand into private label credit cards and other unsecured consumer finance products.
We derive significant benefits from our relationship with Banco Santander, S.A. (“Santander”), a leader in the banking and consumer finance industries and, as of September 30, 2013, the largest bank in the Eurozone by
Table of Contents
market capitalization. Santander has demonstrated its continuing commitment to us by extending $4.5 billion in credit facilities with terms of three and five years, and annual renewal mechanisms, as well as a $0.5 billion letter of credit facility. Santander also provided us with financing to opportunistically acquire and/or convert several large portfolios of loans and certain operations from CitiFinancial Auto, Triad Financial, HSBC Auto, and GE Capital (recreational vehicle/marine portfolio), among others.
We have significant access to the capital markets: we have issued and sold over $26 billion in securitization transactions since 2010, obtained approximately $13.7 billion in committed credit lines and privately issued amortizing notes from large commercial banks, and entered into material flow agreements with large commercial banks. In 2011, funds managed by three of the world’s leading private equity investment firms, Centerbridge Partners, L.P., Kohlberg Kravis Roberts & Co. L.P., and Warburg Pincus LLC, purchased $1.0 billion of newly issued common stock.
Our Markets
The consumer finance industry in the United States has approximately $2.5 trillion of outstanding borrowings and includes vehicle loans and leases, credit cards, home equity lines of credit, private student loans, and personal loans. As economic conditions continue to recover from the 2008-2009 downturn, there has been significant demand from consumers for loans and leases, particularly to finance the purchase of vehicles.
Our primary focus is the vehicle finance segment of the U.S. consumer finance industry. Vehicle finance includes loans and leases taken out by consumers to fund the purchase of new and used automobiles, motorcycles, recreational vehicles (“RVs”), and watercraft. The automobile finance segment comprises the significant majority of the vehicle finance market in the United States. As of September 30, 2013, there were approximately $850 billion of such loans and leases outstanding. Most new and used car purchases in the U.S. are financed with either loans or leases. Historically, used car financing has made up a majority of our business. Most loans in the used car space, which is substantially fragmented, are made to nonprime borrowers and we believe we are a leader in nonprime auto loan originations. We compete with large national and regional banks, which are the biggest lenders in the used car finance space. Through Chrysler Capital and other relationships, we have been increasing, and expect to continue to increase, the proportion of loans and leases that we originate to finance consumer purchases of new automobiles and, by extension, to prime consumers.
We also participate in the unsecured consumer lending market, which includes credit cards, private student loans, point-of-sale financing, and personal loans. This market continues to represent an attractive opportunity for us. Consumers have faced declining access to traditional sources of consumer credit such as credit cards and home equity lines of credit over the past several years, while improving economic conditions have increased consumer demand for access to new sources of financing. We have recently entered into several agreements with other participants in the unsecured consumer lending space to originate point-of-sale financing and personal loans.
In both the vehicle finance and unsecured consumer lending markets, we generate originations indirectly and directly. The indirect model requires relationships with third parties who are generally active in the market, are looking for an additional source of financing for their customers, and agree to direct certain customers to SCUSA. The direct model requires an internally managed platform through which consumers are able to make requests for credit directly to SCUSA. While we have historically focused on the indirect model, we are broadening our presence in the direct vehicle finance market through our RoadLoans.com platform and we are currently building out our direct unsecured consumer lending platform. Additionally, we continue to develop new relationships with third parties to further broaden our origination channels within these markets.
2
Table of Contents
Our Strengths
Technology-Driven Platforms Drive Superior Credit and Operational Performance. We have internally developed proprietary software applications that we believe are highly effective and leverage nearly 20 years of consumer behavior across the full credit spectrum. These systems enable us to effectively monitor, price and manage risk on a real-time basis and at a highly granular level, including by vintage, origination channel, brand, and location where the loan or lease was originated. This technology also allows us to expand our existing relationships and explore new relationships at a low marginal cost. Our internally generated data, acquired historical credit data, and extensive third-party data are utilized to continuously adapt our origination, servicing and risk management platforms to evolving consumer behavior and product performance. The strength of our platforms is demonstrated by our proactive decision to tighten credit standards prior to the recent economic downturn and by our successful acquisition and/or conversion of over $34 billion of assets onto our platform since 2008. Another benefit of our technology-driven platform is that it allows us to move quickly. For example, in 2010 we onboarded a portfolio of $14.4 billion in assets in just four months.
Growth-Oriented Business Model. We have demonstrated the ability to grow and diversify within the consumer finance industry. We have successfully built mutually beneficial relationships with Chrysler, CarMax, other national automotive dealer groups, national and regional banks, and others. With Chrysler Capital, we expect to significantly grow our vehicle finance portfolio, which we believe will more than offset the run-off of previously acquired portfolios, diversify our vehicle finance products, and continue to increase the volume of new vehicle financings. As of the month ended September 30, 2013, new vehicle financings as a percentage of our originations increased from approximately 10%-20% historically to over 40%. Additionally, our wide range of origination channels complements our granular risk management, allowing us to reduce growth in channels with pricing or risk concerns and supplement that volume with more attractive channels at that time. We have also entered into committed flow agreements with leading commercial banks under which we retain certain servicing rights that will provide us with additional and stable fee income. We believe we can quickly and efficiently provide similar or expanded offerings for others, including OEMs and consumer lenders, and we are actively developing these offerings. Further, our platforms will continue to facilitate our expansion into unsecured consumer lending and servicing.
Robust Financial Performance. We have been profitable every year for the last ten years, including throughout the most recent economic downturn. We believe this consistent profitability can be attributed to our credit analysis, pricing discipline, and efficient low-cost structure. In addition, while portions of our nonprime customer base produce relatively high losses, we structure and apply risk-adjusted pricing to these loans to produce attractive risk-adjusted yields that result in a consistent return on capital. As evidence of this, we delivered an average return on assets of 3.9% from 2009 to 2012 and a return on total common equity of more than 30% in each of those years and have continued to deliver similar levels of return on assets and equity year-to-date in 2013, which we believe provides us with the ability to support our growth organically and return capital to our shareholders.
Deep Access to Committed Funding. We have access to diverse and stable financing sources, including in the broader capital markets. We have issued and sold over $26 billion of asset-backed securities (“ABS”) since 2010, were the largest U.S. issuer of retail auto ABS in 2011, 2012, and 2013. We have significant bank funding relationships, with third-party banks and Santander currently providing approximately $13.7 billion and $4.5 billion, respectively, in committed financing. We also have a $17 billion retail flow agreement in place with Bank of America and a dealer lending flow agreement in place with Santander Bank N.A. (“SBNA,” formerly Sovereign Bank), which is wholly owned by Santander. We provide servicing, for a fee, on all loans originated under these arrangements. Further, we have been able to attract a substantial amount of third-party capital from our private equity sponsors.
3
Table of Contents
Strong Relationship with Santander. Santander, operating through Santander Consumer Finance’s pan-European platform, is one of the top three consumer lending companies and is a leading non-captive vehicle lender in twelve European countries. Santander Consumer Finance’s eleven global OEM relationships and large vehicle loan portfolio provide future opportunities for us. Santander, a deposit-funded lender, also has provided us with significant funding support, both through existing committed liquidity and opportunistic extensions of credit. Because of our relationship with Santander, we are subject to the regulatory oversight of the Federal Reserve System (the “Federal Reserve”). This oversight has led us to develop and maintain extensive risk management and reporting procedures and has helped us to continually adapt to the evolving regulatory requirements for consumer finance in the United States.
Experienced Management Team. Our management team has ably steered the company through economic expansions as well as downturns, as evidenced by our strong financial performance in 2008 and 2009. Thomas G. Dundon, our Chief Executive Officer and one of our founders, has approximately 20 years of experience in the consumer finance industry. In addition, Jason Kulas, our President and Chief Financial Officer, has approximately 18 years of experience in the financial services industry and seven years of experience as our Chief Financial Officer. Further, our senior management team has an average of over 16 years of experience across the financial services and consumer industries. Our management will also hold meaningful stakes in the company after giving effect to the offering. Mr. Dundon will own approximately % of our outstanding common stock as well as options to purchase an additional %, and the remainder of our senior management team in aggregate will own approximately % of our common stock and options to purchase an additional %.
Our Business Strategy
Our primary goal is to create stockholder value by leveraging our systems, data, liquidity and management. Our growth strategy is to increase market penetration in the consumer finance industry either by increasing share in existing channels or by broadening the number of origination channels while deploying our capital and funding efficiently.
Expand Our Vehicle Finance Franchise
Organic Growth in Indirect Auto Finance. We have a deep knowledge of consumer behavior across the full credit spectrum and are a key player in the U.S. vehicle finance market. We have the ability to continue to increase our market penetration in the vehicle finance market, subject to attractive market conditions, via the number and depth of our relationships. We plan to achieve this in part through rolling out alliance programs with national vehicle dealer groups and financial institutions, including banks, credit unions, and other lenders, in both the prime and nonprime vehicle finance markets. Our technology-based platform enables us to integrate seamlessly with other originators and thereby benefit from their channels and brands.
Strategic Alliances with OEMs. We plan to expand our existing OEM relationships and develop future relationships with other OEMs to drive incremental origination volume. The loans and leases originated through Chrysler Capital should provide us with the majority of our near-term expected growth. In addition, the experience gained in lease and dealer financing can be applied to improve origination volume through the rest of our dealer base. Our relationship with Chrysler has accelerated our transformation into a full-service vehicle finance company that provides financial products and services to consumers and automotive dealers.
Growth in Direct-to-Consumer Exposure. We are working to further diversify our vehicle finance product offerings by expanding our web-based, direct-to-consumer offerings. Our RoadLoans.com program is a preferred finance resource for many major vehicle shopping websites, including Cars.com, AutoTrader.com, Kelley Blue Book, and eBay Motors. In addition, we are working to integrate our direct-to-consumer offerings with many of the major vehicle brands in the United States, including Chrysler, Jeep, Dodge, Ram, and Fiat. We will continue to focus on securing relationships with additional vehicle-related websites.
4
Table of Contents
Expansion of Fee-Based Income Opportunities. We seek out opportunities to leverage our sophisticated and adaptable servicing platform for both prime and nonprime loans, as well as other vehicle finance and unsecured consumer lending products. We collect fees to originate and service loan portfolios for third parties, and we handle both secured and unsecured loan products across the full credit spectrum. Loans sold to or sourced to third-party banks through flow agreements also provide additional opportunities to service large vehicle loan pools. We believe our loan servicing business is scalable and provides an attractive return on equity, and we intend to continue to develop new third-party relationships to increase its size. In 2013, as of September 30, we have added over $1 billion of assets to our portfolio of assets serviced for others.
Continue to Grow Our Unsecured Consumer Lending Platform
We are further diversifying our business through our strategic relationships in the unsecured consumer lending space, which is a rapidly growing segment of the consumer finance market in the United States. Our ability to offer these products is derived from our expertise in originating nonprime vehicle retail loans, our data on consumers across the credit spectrum, and Santander’s expertise in the unsecured consumer lending industry. One of our principal strategic consumer finance relationships is with Bluestem. Bluestem’s customers rely on Bluestem proprietary credit products at point of sale to make purchases, and we have the option to purchase certain loans through April 2020. We also have a strategic relationship with LendingClub, pursuant to which we invest in or purchase personal loans. Furthermore, we have a pipeline of private label credit card initiatives we expect to pursue, including several through our relationship with a point-of-sale lending technology company.
Risks Associated with Our Business and Growth Strategy
Participating in this offering involves substantial risk. Although we have set forth our competitive strengths and growth strategy above, our ability to execute our strategy and grow our business is subject to certain challenges and risks. The vehicle finance industry is a competitive and highly fragmented industry, with no individual lender capturing more than 10% of the market. We may be at a competitive disadvantage with regard to certain of our competitors who are able to provide financing on more favorable terms or who have more beneficial relationships with automobile manufacturers and dealerships. This competition could reduce our market share or cause us to be unable to successfully execute all or part of our strategy. Some of the more significant challenges and risks include the following:
Adverse economic conditions in the United States and worldwide may negatively impact our results. We are subject to changes in general economic conditions that are beyond our control, such as periods of economic slowdown, increased unemployment rates and disruptions in the global financial markets, which could decrease consumer demand for automobiles and other consumer products and increase our delinquencies, defaults, repossessions and losses.
Our business could be negatively impacted if our access to funding is reduced. We rely upon our ability to sell securities in the ABS market and upon our ability to access various credit facilities to fund our operations, and the continued availability of these funding sources depends, in part, on factors outside of our control. If these sources of funding become unavailable to us, we may have to curtail our loan acquisition and organization activities.
We face significant risks implementing our growth strategy, some of which are outside our control. Our ability to execute a growth strategy of expanding our vehicle finance franchise and growing our unsecured consumer lending platform is subject to risks such as the inherent uncertainty regarding general economic conditions, our ability to obtain adequate financing for our expansion plans, changes in the applicable laws and regulatory environment, the degree of competition in new markets and our ability to recruit qualified personnel.
5
Table of Contents
Our recent agreement with Chrysler may not result in currently anticipated levels of growth and is subject to certain performance conditions that could result in termination of the agreement. The loans and leases originated through Chrysler Capital are expected to provide us with the majority of our projected growth over the next several years. If we are unable to realize the expected benefits of our relationship with Chrysler, or if our agreement with Chrysler were to terminate for failure to meet certain milestones and performance metrics, our future growth would be negatively impacted.
Our business could be negatively impacted if we are unsuccessful in developing and maintaining relationships with automobile dealerships. Our ability to acquire loans and automotive leases is reliant on our relationships with reputable automotive dealers that direct consumers to our offices or originate loans at the point-of-sale, which we subsequently purchase. None of our relationships are exclusive, and they may be terminated at any time.
Our financial condition, liquidity, and results of operations depend on the credit performance of our loans. Nonprime receivables, which comprise more than 80% of our consumer loans, experience higher default rates than prime receivables, which subjects us to a higher risk of losses on those receivables. In addition, our prime portfolio, for which we have less ability to make risk adjustments to pricing compared to our nonprime loan portfolio, is rapidly growing. As a result, a larger proportion of our business will consist of loans with respect to which we have less flexibility to adjust pricing to absorb losses.
The above list is not exhaustive, and we face additional challenges and risks. Before you participate in this offering, you should carefully consider all of the information in this prospectus, including matters set forth under the section entitled “Risk Factors.”
Reorganization
In July 2013, Santander Consumer USA Inc., an Illinois corporation (“SCUSA Illinois”), formed Santander Consumer USA Holdings Inc., a Delaware corporation (“SCUSA Delaware”), and SCUSA Merger Sub Inc., an Illinois corporation and a wholly owned subsidiary of SCUSA Delaware (“SCUSA Merger Sub”). Both SCUSA Delaware and SCUSA Merger Sub were formed solely for the purpose of effecting this offering. Neither SCUSA Delaware nor SCUSA Merger Sub has engaged in any business or other activities except in connection with their respective formations and effecting this offering, and, except for SCUSA Delaware holding the stock of SCUSA Merger Sub, neither holds any assets and, except for SCUSA Merger Sub being a wholly owned subsidiary of SCUSA Delaware, neither has any subsidiaries. Prior to the consummation of this offering, SCUSA Merger Sub will merge with and into SCUSA Illinois, with SCUSA Illinois surviving the merger as a wholly owned subsidiary of SCUSA Delaware, the registrant. In the merger, all of the outstanding shares of common stock of SCUSA Illinois will be converted into shares of SCUSA Delaware common stock on a for basis. We refer to these transactions as the “Reorganization.”
Principal Stockholders
The majority of our common stock is held collectively by (1) Santander Holdings USA, Inc. (“SHUSA”), a wholly owned subsidiary of Santander; (2) Sponsor Auto Finance Holdings Series LP (“Auto Finance Holdings”), an investment vehicle owned by (i) funds managed by Centerbridge Partners, L.P., Kohlberg Kravis Roberts & Co. L.P., and Warburg Pincus LLC; (ii) DFS Sponsor Investments LLC, an entity affiliated with Mr. Dundon; and (iii) our President and Chief Financial Officer; and (3) DDFS LLC, an entity owned by Mr. Dundon. We refer to these three stockholders, collectively, as our “Principal Stockholders.”
SHUSA is a bank holding company with total assets of $77 billion as of September 30, 2013. SHUSA’s primary assets include our common stock and all of the stock of SBNA, whose primary business consists of attracting deposits from its network of over 700 retail branches and originating small business loans, middle
6
Table of Contents
market commercial loans, multi-family loans, residential mortgage loans, home equity loans and lines of credit, and vehicle and other consumer loans in the communities served by its branches.
Centerbridge Partners, L.P. is a private investment firm based in New York City and has approximately $20 billion in capital under management as of September 2013. The firm focuses on private equity and credit investments. The firm is dedicated to partnering with world-class management teams across targeted industry sectors to help companies achieve their operating and financial objectives.
Kohlberg Kravis Roberts & Co. L.P., together with its affiliates (“KKR”), is a leading global investment firm with approximately $90 billion in assets under management as of September 30, 2013. KKR offers a broad range of investment management services to fund investors and provides capital markets services for the firm, its portfolio companies, and third parties. KKR has over 80 portfolio companies in its private equity funds.
Warburg Pincus is a leading global private equity firm focused on growth investing. Founded more than 40 years ago, the firm has remained true to a unique and enduring strategy of investing in growth businesses in partnership with entrepreneurs and superior management teams. As of September 30, 2013, the firm has more than $35 billion of assets under management and an active private equity portfolio of more than 125 companies globally.
Our management will also hold meaningful stakes in the company after giving effect to the offering. Mr. Dundon will own approximately % of our common stock as well as options to purchase an additional %, and the remainder of our senior management team in aggregate will own approximately % of our common stock and options to purchase an additional %. See “Certain Relationships and Related Party Transactions” and “Security Ownership of Certain Beneficial Owners, Management and Selling Stockholders” and the documents referred to herein for more information with respect to our relationship with our Principal Stockholders.
The December 2011 equity transaction whereby Auto Finance Holdings became a stockholder in SCUSA is referred to in this document as the “Equity Transaction.”
Additional Information
Our principal executive offices are located at 8585 North Stemmons Freeway, Suite 1100-N, Dallas, Texas 75247, and our telephone number is (214) 634-1110. Our Internet address is www.santanderconsumerusa.com. Information on, or accessible through, our website is not part of this prospectus.
7
Table of Contents
The Offering
| Issuer |
Santander Consumer USA Holdings Inc. |
| Common stock offered by the selling stockholders |
shares of common stock. |
| Underwriters’ over-allotment option to purchase additional shares |
shares of common stock from the selling stockholders. |
| Common stock to be outstanding immediately after this offering |
shares of common stock.(1) |
| Use of proceeds |
We will not receive any proceeds from the sale of shares of common stock by the selling stockholders. |
| Voting rights |
One vote per share. |
| Dividend policy |
It has been our policy to pay a dividend to all common stockholders. Following the completion of this offering, we currently intend to pay dividends on a quarterly basis at an initial amount of approximately $ per share. Our board of directors may also change or eliminate the payment of future dividends at its discretion, without prior notice to our stockholders, and our dividend policy and practice may change at any time and from time to time in the future. Any future determination to pay dividends to our stockholders will be dependent upon our financial condition, results of operations, capital requirements, government regulations, and any other factors that our board of directors may deem relevant at such time and from time to time. For information regarding our recent dividends, see “Dividend Policy.” |
| Listing |
We have applied to list our common stock on the New York Stock Exchange (which we refer to as “NYSE”) under the trading symbol “ .” |
| Risk factors |
Please read the section entitled “Risk Factors” beginning on page 13 for a discussion of some of the factors you should consider before buying our common stock. |
| (1) | Based on shares of common stock issued and outstanding as of , after giving effect to the Reorganization. As of , there were holders of our common stock. Unless otherwise indicated, information contained in this prospectus regarding the number of shares of our common stock outstanding does not include an aggregate of up to shares of common stock comprised of: |
| • | shares of common stock issuable upon exercise of outstanding stock options with a weighted average exercise price of $ per share, of which shares were vested as of ; and |
| • | shares of common stock reserved for issuance under our 2011 Management Equity Plan. |
8
Table of Contents
| Directed Share Program |
At our request, the underwriters have reserved up to 3% of the shares of common stock being offered by this prospectus for sale at the initial public offering price to our directors, officers, employees and other individuals associated with us and members of their families. See “Underwriting.” |
| LOYAL3 Platform |
At our request, the underwriters have reserved up to 2% of the shares of common stock offered by this prospectus to be offered through the LOYAL3 platform at the initial public offering price. See “Underwriting.” |
| Conflict of Interest |
Because Santander Investment Securities Inc. and KKR Capital Markets LLC, underwriters for this offering, are under common control with us, a conflict of interest under Financial Industry Regulatory Authority (“FINRA”) Rule 5121 is deemed to exist. Accordingly, this offering will be conducted in accordance with that rule. See “Underwriting — Conflict of Interest.” |
9
Table of Contents
Summary Historical Consolidated Financial Data
The following summary consolidated financial data should be read in conjunction with, and are qualified by reference to, “Selected Historical Consolidated Financial Information,” “Management’s Discussion and Analysis of Financial Condition and Results of Operations,” and the consolidated financial statements and notes thereto included elsewhere in this prospectus. The summary consolidated statement of income data for the years ended December 31, 2012, 2011, and 2010 and the summary consolidated balance sheet data at December 31, 2012 and 2011 has been derived from, and is qualified by reference to, our audited consolidated financial statements included elsewhere in this prospectus and should be read in conjunction with those consolidated financial statements and notes thereto. The summary consolidated statement of income data for the years ended December 31, 2009 and 2008 and the summary consolidated balance sheet data at December 31, 2010, 2009, and 2008 has been derived from audited consolidated financial statements that are not included in this prospectus. The summary consolidated statement of income data for the quarterly and year-to-date periods ended September 30, 2013 and 2012 and the summary consolidated balance sheet data at September 30, 2013 are derived from, and qualified by reference to, our unaudited interim consolidated financial statements included elsewhere in this prospectus and should be read in conjunction with those consolidated financial statements and notes thereto.
Santander Consumer USA Holdings Inc. has not engaged in any operations or conducted any activities other than those incidental to its formation and to preparations for the Reorganization and this offering. It will have only nominal assets and no liabilities prior to the consummation of the Reorganization and this offering. Upon closing, its assets will include shares in Santander Consumer USA Inc., its wholly owned subsidiary and operating company, and the cash proceeds of this offering. See “Reorganization.” Accordingly, this prospectus includes, and the discussion below is based solely on, the historical financial statements of Santander Consumer USA Inc.
| Three Months Ended | Nine Months Ended | Year Ended | ||||||||||||||||||||||||||||||||||
| September 30, 2013 |
September 30, 2012 |
September 30, 2013 |
September 30, 2012 |
December 31, 2012 |
December 31, 2011 |
December 31, 2010 |
December 31, 2009 |
December 31, 2008 |
||||||||||||||||||||||||||||
| (Dollar amounts in thousands, except per share data) | ||||||||||||||||||||||||||||||||||||
| Income Statement Data |
||||||||||||||||||||||||||||||||||||
| Income from individually acquired retail installment contracts |
$ | 879,628 | $ | 580,360 | $ | 2,333,857 | $ | 1,600,054 | $ | 2,223,833 | $ | 1,695,538 | $ | 1,308,728 | $ | 1,281,515 | $ | 1,396,610 | ||||||||||||||||||
| Income from purchased receivables portfolios |
87,237 | 161,753 | 327,712 | 545,819 | 704,770 | 870,257 | 734,634 | 218,240 | 105,229 | |||||||||||||||||||||||||||
| Other financing income |
44,627 | 2,845 | 62,205 | 7,416 | 19,899 | 28,718 | 33,216 | 10,485 | 5,333 | |||||||||||||||||||||||||||
|
|
|
|
|
|
|
|
|
|
|
|
|
|
|
|
|
|
|
|||||||||||||||||||
| Interest and fees on finance receivables and loans |
1,011,492 | 744,958 | 2,723,774 | 2,153,289 | 2,948,502 | 2,594,513 | 2,076,578 | 1,510,240 | 1,507,172 | |||||||||||||||||||||||||||
| Interest expense |
120,589 | 98,774 | 291,062 | 293,238 | 374,027 | 418,526 | 316,486 | 235,031 | 256,356 | |||||||||||||||||||||||||||
| Net other finance and interest income |
9,643 | 2,950 | 17,486 | 9,423 | — | — | — | — | — | |||||||||||||||||||||||||||
| Net interest margin |
900,546 | 649,134 | 2,450,198 | 1,869,474 | 2,574,475 | 2,175,987 | 1,760,092 | 1,275,209 | 1,250,816 | |||||||||||||||||||||||||||
| Provision for loan losses on individually acquired retail installment contracts |
447,565 | 243,698 | 1,074,487 | 683,000 | 1,119,074 | 741,559 | 750,625 | 720,938 | 823,024 | |||||||||||||||||||||||||||
| Incremental increase (decrease) in allowance related to purchased receivables portfolios |
93,718 | (57,823 | ) | 51,654 | (22,798 | ) | 3,378 | 77,662 | 137,600 | — | — | |||||||||||||||||||||||||
| Other provisions for loan losses |
56,918 | — | 97,664 | — | — | — | — | — | — | |||||||||||||||||||||||||||
|
|
|
|
|
|
|
|
|
|
|
|
|
|
|
|
|
|
|
|||||||||||||||||||
| Provision for loan losses |
598,201 | 185,875 | 1,223,805 | 660,202 | 1,122,452 | 819,221 | 888,225 | 720,938 | 823,024 | |||||||||||||||||||||||||||
| Profit sharing |
27,238 | — | 34,802 | — | — | — | — | — | — | |||||||||||||||||||||||||||
| Other income |
78,340 | 74,291 | 208,878 | 238,890 | 295,689 | 452,529 | 249,028 | 48,096 | 43,120 | |||||||||||||||||||||||||||
| Costs and expenses |
176,140 | 183,730 | 496,312 | 464,192 | 559,163 | 557,083 | 404,840 | 249,012 | 209,315 | |||||||||||||||||||||||||||
| Income tax expense |
65,486 | 141,261 | 322,413 | 372,266 | 453,615 | 464,034 | 277,944 | 143,834 | 87,472 | |||||||||||||||||||||||||||
| Net income |
111,821 | 212,559 | 581,744 | 611,704 | 734,934 | 788,178 | 438,111 | 209,521 | 174,125 | |||||||||||||||||||||||||||
| Net income attributable to Santander Consumer USA Inc shareholders |
111,245 | 168,467 | 583,565 | 595,846 | 715,003 | 768,197 | 438,111 | 209,521 | 174,125 | |||||||||||||||||||||||||||
| Share Data |
||||||||||||||||||||||||||||||||||||
| Weighted-average common shares outstanding |
||||||||||||||||||||||||||||||||||||
| Basic |
129,822,780 | 129,819,883 | 129,821,712 | 129,819,883 | 129,819,883 | 92,277,053 | 92,173,913 | 92,173,913 | 92,173,913 | |||||||||||||||||||||||||||
| Diluted |
129,822,780 | 129,819,883 | 129,821,712 | 129,819,883 | 129,819,883 | 92,277,053 | 92,173,913 | 92,173,913 | 92,173,913 | |||||||||||||||||||||||||||
10
Table of Contents
| Three Months Ended | Nine Months Ended | Year Ended | ||||||||||||||||||||||||||||||||||
| September 30, 2013 |
September 30, 2012 |
September 30, 2013 |
September 30, 2012 |
December 31, 2012 |
December 31, 2011 |
December 31, 2010 |
December 31, 2009 |
December 31, 2008 |
||||||||||||||||||||||||||||
| (Dollar amounts in thousands, except per share data) | ||||||||||||||||||||||||||||||||||||
| Earnings per share attributable to Santander Consumer USA Inc shareholders |
||||||||||||||||||||||||||||||||||||
| Basic |
$ | 0.86 | $ | 1.30 | $ | 4.50 | $ | 4.59 | $ | 5.51 | $ | 8.32 | $ | 4.75 | $ | 2.27 | $ | 1.89 | ||||||||||||||||||
| Diluted |
$ | 0.86 | $ | 1.30 | $ | 4.50 | $ | 4.59 | $ | 5.51 | $ | 8.32 | $ | 4.75 | $ | 2.27 | $ | 1.89 | ||||||||||||||||||
| Net tangible book value per common share at period end |
||||||||||||||||||||||||||||||||||||
| Excluding other comprehensive income (loss) |
$ | 18.85 | $ | 18.85 | $ | 16.04 | $ | 16.20 | $ | 6.95 | $ | 6.37 | $ | 4.49 | ||||||||||||||||||||||
| Including other comprehensive income (loss) |
$ | 18.80 | $ | 18.80 | $ | 15.97 | $ | 16.11 | $ | 6.95 | $ | 6.24 | $ | 4.06 | ||||||||||||||||||||||
| Dividends declared per share of common stock |
||||||||||||||||||||||||||||||||||||
| Basic |
$ | — | $ | 1.12 | $ | 2.24 | $ | 3.67 | $ | 5.66 | $ | 5.05 | $ | 4.34 | — | — | ||||||||||||||||||||
| Diluted |
$ | — | $ | 1.12 | $ | 2.24 | $ | 3.67 | $ | 5.66 | $ | 5.05 | $ | 4.34 | — | — | ||||||||||||||||||||
| Balance Sheet Data (1) |
||||||||||||||||||||||||||||||||||||
| Finance receivables and loans |
$ | 21,238,684 | $ | 21,238,684 | $ | 16,265,820 | $ | 16,715,703 | $ | 15,032,046 | $ | 7,466,267 | $ | 5,600,102 | ||||||||||||||||||||||
| Goodwill and intangible assets |
128,573 | 128,573 | 126,700 | 125,427 | 126,767 | 142,198 | 105,643 | |||||||||||||||||||||||||||||
| Total assets |
25,608,280 | 25,608,280 | 18,741,644 | 19,404,371 | 16,773,021 | 8,556,177 | 6,044,454 | |||||||||||||||||||||||||||||
| Total borrowings |
22,683,397 | 22,683,397 | 16,227,995 | 16,790,518 | 15,065,635 | 7,525,930 | 5,432,338 | |||||||||||||||||||||||||||||
| Total liabilities |
23,039,122 | 23,039,122 | 16,502,178 | 17,167,686 | 16,005,404 | 7,838,862 | 5,564,986 | |||||||||||||||||||||||||||||
| Total equity |
2,569,158 | 2,569,158 | 2,239,466 | 2,236,685 | 767,617 | 717,315 | 479,468 | |||||||||||||||||||||||||||||
| Allowance for loan losses |
2,355,087 | 2,355,087 | 1,774,002 | 1,208,475 | 840,599 | 384,396 | 347,302 | |||||||||||||||||||||||||||||
| Other Information |
||||||||||||||||||||||||||||||||||||
| Charge-offs, net of recoveries |
$ | 371,396 | $ | 272,692 | $ | 772,187 | $ | 710,002 | $ | 1,008,454 | $ | 1,025,133 | $ | 709,367 | $ | 683,844 | $ | 679,172 | ||||||||||||||||||
| End of period Delinquent principal over 60 days |
969,886 | 969,886 | 865,917 | 767,838 | 579,627 | 502,254 | 477,141 | |||||||||||||||||||||||||||||
| End of period Gross finance receivables and loans |
24,201,063 | 24,201,063 | 18,655,497 | 18,754,938 | 16,843,774 | 8,309,153 | 6,360,982 | |||||||||||||||||||||||||||||
| Average gross individually acquired retail installment contracts |
19,790,033 | 12,704,563 | 17,180,908 | 11,527,698 | 12,082,026 | 8,843,036 | 6,631,231 | 5,690,833 | 5,396,355 | |||||||||||||||||||||||||||
| Average gross purchased receivables portfolios |
2,676,906 | 5,706,495 | 3,325,260 | 6,798,200 | 6,309,497 | 7,270,080 | 4,978,727 | 975,080 | 320,903 | |||||||||||||||||||||||||||
|
|
|
|
|
|
|
|
|
|
|
|
|
|
|
|
|
|
|
|||||||||||||||||||
| Average Gross finance receivables and loans |
23,246,772 | 18,539,064 | 21,396,754 | 18,454,847 | 18,501,710 | 16,282,215 | 12,111,969 | 7,266,079 | 5,728,599 | |||||||||||||||||||||||||||
| Average Total assets |
24,352,346 | 18,530,771 | 21,514,270 | 18,300,123 | 18,411,012 | 16,067,623 | 11,984,997 | 6,930,260 | 5,520,652 | |||||||||||||||||||||||||||
| Average Debt |
21,451,420 | 15,781,659 | 18,681,703 | 15,528,709 | 15,677,522 | 14,557,370 | 10,672,331 | 6,083,953 | 4,989,280 | |||||||||||||||||||||||||||
| Average Total equity |
2,525,997 | 2,365,722 | 2,453,782 | 2,334,008 | 2,312,781 | 916,219 | 850,219 | 594,097 | 406,680 | |||||||||||||||||||||||||||
| Ratios (2) |
||||||||||||||||||||||||||||||||||||
| Yield on individually acquired retail installment contracts |
17.8 | % | 18.3 | % | 18.1 | % | 18.5 | % | 18.4 | % | 19.2 | % | 19.7 | % | 22.5 | % | 25.9 | % | ||||||||||||||||||
| Yield on purchased receivables portfolios |
13.0 | 11.3 | 13.1 | 10.7 | 11.2 | 12.0 | 14.8 | 22.4 | 32.8 | |||||||||||||||||||||||||||
| Yield on interest-earning assets |
17.4 | 16.1 | 17.0 | 15.6 | 15.9 | 15.9 | 17.1 | 20.8 | 26.3 | |||||||||||||||||||||||||||
| Cost of interest-bearing liabilities |
2.2 | 2.5 | 2.1 | 2.5 | 2.4 | 2.9 | 3.0 | 3.9 | 5.1 | |||||||||||||||||||||||||||
| Efficiency ratio |
18.0 | 25.4 | 18.7 | 22.0 | 19.5 | 21.2 | 20.2 | 18.8 | 16.2 | |||||||||||||||||||||||||||
| Return on average assets |
1.8 | 4.6 | 3.6 | 4.5 | 4.0 | 4.9 | 3.7 | 3.0 | 3.2 | |||||||||||||||||||||||||||
| Return on average equity |
17.7 | 35.9 | 31.6 | 34.9 | 31.8 | 86.0 | 51.5 | 35.3 | 42.8 | |||||||||||||||||||||||||||
| Net chargeoff ratio |
6.4 | 5.9 | 4.6 | 5.1 | 5.5 | 6.3 | 5.9 | 9.4 | 11.9 | |||||||||||||||||||||||||||
| Delinquency ratio |
4.0 | 4.0 | 4.6 | 4.1 | 3.4 | 6.0 | 7.5 | |||||||||||||||||||||||||||||
| Tangible common equity to tangible assets |
9.6 | 9.6 | 11.3 | 11.0 | 3.8 | 6.8 | 6.3 | |||||||||||||||||||||||||||||
| Common stock dividend payout ratio |
0.0 | 86.3 | 49.8 | 80.0 | 102.8 | 60.6 | 91.3 | 0.0 | 0.0 | |||||||||||||||||||||||||||
11
Table of Contents
| (1) | Balance sheet data as of September 30, 2012 has been excluded. |
| (2) | “Yield on interest-earning assets” is defined as the ratio of Interest and fees on finance receivables and loans to Average gross finance receivables and loans. |
| “Cost of interest-bearing liabilities” is defined as the ratio of Interest expense to Average debt during the period. |
| “Efficiency ratio” is defined as the ratio of Costs and expenses to the sum of Net interest margin and Other income. |
| “Return on average assets” is defined as the ratio of Net income to Average total assets. |
| “Return on average equity” is defined as the ratio of Net income to Average total equity. |
| “Net charge-off ratio” is defined as the ratio of Charge offs, net of recoveries, to Average gross finance receivables and loans. |
| “Delinquency ratio” is defined as the ratio of Delinquent principal over 60 days, end of period to Gross finance receivables and loans, end of period. |
| “Tangible common equity to total tangible assets ratio” is defined as the ratio of Total equity, excluding Goodwill and intangible assets, to Total assets excluding Goodwill and intangible assets. |
| “Common stock dividend ratio” is defined as the ratio of Dividends declared per share of common stock during the period to Net income attributable to Santander Consumer USA Inc. shareholders. |
| Activity-based ratios for the periods ending September 30, 2013 and 2012 are presented on an annualized basis. |
12
Table of Contents
Investing in our common stock involves a high degree of risk. You should carefully consider the following risk factors, as well as all of the other information contained in this prospectus including our consolidated financial statements, and the related notes thereto, before deciding to invest in our common stock. The occurrence of any of the following risks could materially and adversely affect our business, prospects, financial condition, results of operations, and cash flow. In such case, the trading price of our common stock could decline and you could lose all or part of your investment.
Risks Relating to Our Business
Adverse economic conditions in the United States and worldwide may negatively impact our results.
We are subject to changes in general economic conditions that are beyond our control. During periods of economic slowdown such as the recent economic downturn, delinquencies, defaults, repossessions, and losses generally increase while proceeds from auction sales decrease. These periods may also be accompanied by increased unemployment rates, decreased consumer demand for automobiles and other consumer products, and declining values of automobiles and other consumer products securing outstanding accounts, which weaken collateral coverage and increase the amount of a loss in the event of default. Additionally, higher gasoline prices, unstable real estate values, reset of adjustable rate mortgages to higher interest rates, general availability of consumer credit, or other factors that impact consumer confidence or disposable income could increase loss frequency and decrease consumer demand for automobiles and other consumer products as well as weaken collateral values on certain types of automobiles and other consumer products. Because our historical focus has been predominantly on nonprime consumers, the actual rates of delinquencies, defaults, repossessions, and losses on these loans could be more dramatically affected by a general economic downturn. In addition, during an economic slowdown or recession, our servicing costs may increase without a corresponding increase in our finance charge income. Furthermore, our business is significantly affected by monetary and regulatory policies of the U.S. federal government and its agencies. Changes in any of these policies are influenced by macroeconomic conditions and other factors that are beyond our control and could have a material adverse effect on us through interest rate changes, costs of compliance with increased regulation, and other factors.
Although market conditions have improved, unemployment in the United States continues to remain at elevated levels, and conditions remain challenging for financial institutions. Furthermore, certain Eurozone member countries have fiscal outlays that exceed their fiscal revenue, which has raised concerns about such countries’ abilities to continue to service their debt and foster economic growth. A weakened European economy could undermine investor confidence in European financial institutions and the stability of European member economies. Notwithstanding its geographic diversification, this could adversely impact Santander, with whom we have a significant relationship. Such events could also negatively affect U.S.-based financial institutions, counterparties with which we do business, and the stability of the global financial markets. Disruptions in the global financial markets have also adversely affected the corporate bond markets, debt and equity underwriting, and other elements of the financial markets. In recent years, downgrades of the sovereign debt of some European countries have resulted in increased volatility in capital markets and have caused some lenders and institutional investors to reduce and, in some cases, cease to provide funding to certain borrowers, including other financial institutions. The impact on available credit, increased volatility in the financial markets, and reduced business activity has adversely affected, and may continue to adversely affect, our businesses, capital, liquidity, or other financial conditions and results of operations, and access to credit.
The process we use to estimate losses inherent in our credit exposure requires complex judgments, including forecasts of economic conditions and how those economic conditions might impair the ability of our borrowers to repay their loans. The degree of uncertainty concerning economic conditions may adversely affect the accuracy of our estimates, which may, in turn, impact the reliability of the process and the quality of our assets.
13
Table of Contents
Our business could be negatively impacted if our access to funding is reduced.
We rely upon our ability to sell securities in the ABS market and upon our ability to access various credit facilities to fund our operations. The ABS market, along with credit markets in general, experienced unprecedented disruptions during the recent economic downturn. Although market conditions have improved since 2009, for a number of years following the economic downturn, certain issuers experienced increased risk premiums while there was a relatively lower level of investor demand for certain ABS (particularly those securities backed by nonprime collateral). In addition, the risk of volatility surrounding the global economic system and uncertainty surrounding regulatory reforms such as the Dodd-Frank Wall Street Reform and Consumer Protection Act of 2010 (the “Dodd-Frank Act”) continue to create uncertainty around access to the capital markets. As a result, there can be no assurance that we will continue to be successful in selling securities in the ABS market. Adverse changes in our ABS program or in the ABS market generally could materially adversely affect our ability to securitize loans on a timely basis or upon terms acceptable to us. This could increase our cost of funding, reduce our margins or cause us to hold assets until investor demand improves.
We also depend on various credit facilities and flow agreements to fund our future liquidity needs. We cannot guarantee that these financing sources will continue to be available beyond the current maturity dates, on reasonable terms, or at all. As our volume of loan acquisitions and originations increases, especially due to our recent relationship with Chrysler, we will require the expansion of our borrowing capacity on our existing credit facilities and flow agreements or the addition of new credit facilities and flow agreements. The availability of these financing sources depends, in part, on factors outside of our control, including regulatory capital treatment for unfunded bank lines of credit, the financial strength and strategic objectives of Santander and the other banks that participate in our credit facilities and flow agreements, and the availability of bank liquidity in general. We may also experience the occurrence of events of default or breach of financial covenants, which could reduce our access to bank funding. In the event of a sudden or unexpected shortage of funds in the banking system, we cannot be sure that we will be able to maintain necessary levels of funding without incurring high funding costs, a reduction in the term of funding instruments, or the liquidation of certain assets.
We have not experienced a significant increase in risk premiums or cost of funding to date, but we are not isolated from general market conditions that may affect issuers of ABS and other borrowers and we could experience increased risk premiums or funding costs in the future. In addition, if the sources of funding described above are not available to us on a regular basis for any reason, we may have to curtail or suspend our loan acquisition and origination activities. Downsizing the scale of our business would have a material adverse effect on our financial position, liquidity, and results of operations.
We face significant risks in implementing our growth strategy, some of which are outside our control.
We intend to continue our growth strategy to (i) expand our vehicle finance franchise by increasing market penetration via the number and depth of our relationships in the vehicle finance market, pursuing additional relationships with OEMs, and expanding our direct-to-consumer footprint and (ii) grow our unsecured consumer lending platform. Our ability to execute this growth strategy is subject to significant risks, some of which are beyond our control, including:
| • | the inherent uncertainty regarding general economic conditions; |
| • | our ability to obtain adequate financing for our expansion plans; |
| • | the prevailing laws and regulatory environment of each state in which we operate or seek to operate, and, to the extent applicable, federal laws and regulations, which are subject to change at any time; |
| • | the degree of competition in new markets and its effect on our ability to attract new customers; |
| • | our ability to recruit qualified personnel, in particular in areas where we face a great deal of competition; and |
| • | our ability to obtain and maintain any regulatory approvals, government permits, or licenses that may be required on a timely basis. |
14
Table of Contents
Our recent agreement with Chrysler may not result in currently anticipated levels of growth and is subject to certain performance conditions that could result in termination of the agreement.
In February 2013, we entered into a ten-year Master Private Label Financing Agreement (the “Chrysler Agreement”) with Chrysler whereby we launched the Chrysler Capital brand, which originates private-label loans and leases to facilitate the purchase of Chrysler vehicles by consumers and Chrysler-franchised automotive dealers. The financing services that we provide under the Chrysler Agreement, which launched May 1, 2013, include credit lines to finance Chrysler-franchised dealers’ acquisitions of vehicles and other products that Chrysler sells or distributes, automotive loans and leases to finance consumer acquisitions of new and used vehicles at Chrysler-franchised dealerships, financing for commercial and fleet customers, and ancillary services. In addition, we will offer dealers dealer loan financing, construction loans, real estate loans, working capital loans, and revolving lines of credit. In accordance with the terms of the Chrysler Agreement, in May 2013 we paid Chrysler a $150 million upfront, nonrefundable payment, which will be amortized over ten years but would be recognized as expense immediately if the Chrysler Agreement is terminated in accordance with its terms.
As part of the Chrysler Agreement, we received limited exclusivity rights to participate in specified minimum percentages of certain of Chrysler’s financing incentive programs, which include loan rate subvention and automotive lease residual support subvention. We have committed to certain revenue sharing arrangements, as well as to considering future revenue sharing opportunities. We will bear the risk of loss on loans originated pursuant to the Chrysler Agreement, but Chrysler will share in any residual gains and losses in respect of automotive leases, subject to specific provisions in the Chrysler Agreement, including limitations on our participation in gains and losses. In addition, under the Chrysler Agreement, Chrysler has the option to acquire, for fair market value, an equity participation in an operating entity through which the financial services contemplated by the Chrysler Agreement are offered and provided, through either an equity interest in the new entity or participation in a joint venture or other similar business relationship or structure. There is no maximum limit on the size of Chrysler’s potential equity participation. Although the Chrysler Agreement contains provisions that are designed to address a situation in which the parties disagree on the fair market value of the equity participation interest, there is a risk that we ultimately receive less than what we believe to be the fair market value for such interest.
Under the Chrysler Agreement, we have agreed to specific transition milestones, including market penetration rates, approval rates, and staffing and service milestones for the initial year following launch. If the transition milestones are not met in the first year, the agreement will terminate and we will lose the ability to operate as Chrysler Capital. If the transition milestones are met, the Chrysler Agreement will have a ten-year term, subject to early termination in certain circumstances, including the failure by either party to comply with certain of their ongoing obligations under the Chrysler Agreement. In addition, Chrysler may also terminate the agreement, among other circumstances, if (i) we fail to meet certain performance metrics, including certain penetration and approval rate targets, during the term of the agreement, (ii) a person other than Santander and its affiliates or our other stockholders owns 20% or more of our common stock and Santander and its affiliates own fewer shares of common stock than such person, (iii) we become, control, or become controlled by, an OEM that competes with Chrysler or (iv) if certain of our credit facilities become impaired.
The loans and leases originated through Chrysler Capital are expected to provide us with the majority of our projected growth over the next several years. Our ability to realize the full strategic and financial benefits of our relationship with Chrysler depends in part on the successful development of our Chrysler Capital business, which will require a significant amount of management’s time and effort. If we are unable to realize the expected benefits of our relationship with Chrysler, or if the Chrysler Agreement were to terminate, our ability to generate or grow revenues could be reduced, and we may not be able to implement our business strategy, which would negatively impact our future growth.
15
Table of Contents
Our business could be negatively impacted if we are unsuccessful in developing and maintaining relationships with automobile dealerships.
Our ability to acquire loans and automotive leases is reliant on our relationships with automotive dealers. In particular, our automotive finance operations depend in large part upon our ability to establish and maintain relationships with reputable automotive dealers that direct customers to our offices or originate loans at the point-of-sale, which we subsequently purchase. Although we have relationships with certain automotive dealers, none of our relationships are exclusive and some of them are newly established and they may be terminated at any time. As a result of the recent economic downturn and contraction of credit to both dealers and their customers, there was an increase in dealership closures and our existing dealer base experienced decreased sales and loan volume in the past and may experience decreased sales and loan volume in the future, which may have an adverse effect on our business, results of operations, and financial condition.
A reduction in demand for our products and failure by us to adapt to such reduction could adversely affect our business, results of operations, and financial condition.
The demand for the products we offer may be reduced due to a variety of factors, such as demographic patterns, changes in customer preferences or financial conditions, regulatory restrictions that decrease customer access to particular products, or the availability of competing products. Should we fail to adapt to significant changes in our customers’ demand for, or access to, our products, our revenues could decrease significantly and our operations could be harmed. Even if we do make changes to existing products or introduce new products to fulfill customer demand, customers may resist such changes or may reject such products. Moreover, the effect of any product change on the results of our business may not be fully ascertainable until the change has been in effect for some time, and, by that time, it may be too late to make further modifications to such product without causing further harm to our business, results of operations, and financial condition.
Our financial condition, liquidity, and results of operations depend on the credit performance of our loans.
As of September 30, 2013, over 80% of our consumer loans are nonprime receivables with obligors who do not qualify for conventional automotive finance products as a result of, among other things, a lack of or adverse credit history, low income levels, and/or the inability to provide adequate down payments. While underwriting guidelines were designed to establish that, notwithstanding such factors, the obligor would be a reasonable credit risk, the receivables nonetheless will experience higher default rates than a portfolio of obligations of prime obligors. In the event of such a default on an auto loan, generally the most practical alternative is repossession of the financed vehicle, although the collateral value of the vehicle usually does not cover the outstanding account balance and costs of recovery. Repossessions and foreclosure sales that do not yield sufficient proceeds to repay the receivables in full could result in losses on those receivables. We repossessed 175,665 vehicles, incurring $1.0 billion in net losses, during the year ended December 31, 2012, of which 164,625 repossessions and $946 million of net losses were on nonprime receivables. We experienced a default rate of 5.62% for nonprime receivables and 2.68% for prime receivables during the year ended December 31, 2012.
From time to time we are the subject of unfavorable news or editorial coverage and we, like many peer companies, are the subject of various complaint websites in connection with our repossession and collection activities. Regardless of merit, this type of negative publicity could damage our reputation and lead consumers to choose other consumer finance companies. This could, in turn, lead to decreased business which could have a material adverse impact on our financial position. We do not believe we have experienced any such impact as our lending is primarily indirect, with the end consumer interacting directly with a dealer rather than the finance company.
In addition, our prime portfolio is rapidly growing. While prime portfolios typically have lower default rates than nonprime portfolios, we have less ability to make risk adjustments to the pricing of prime loans compared to nonprime loans. As a result, a larger proportion of our business will consist of loans with respect to which we have less flexibility to adjust pricing to absorb losses. As a result of these factors, we may sustain higher losses than anticipated in our prime portfolio.
16
Table of Contents
We depend on the accuracy and completeness of information about borrowers and counterparties and any misrepresented information could adversely affect our business, results of operations, and financial condition.
In deciding whether to approve loans or to enter into other transactions with borrowers and counterparties in our retail lending and commercial lending businesses, we may rely on information furnished to us by or on behalf of borrowers and counterparties, including financial statements and other financial information. We also may rely on representations of borrowers and counterparties as to the accuracy and completeness of that information and, with respect to financial statements, on reports of independent auditors. If any of this information is intentionally or negligently misrepresented and such misrepresentation is not detected prior to loan funding, the value of the loan may be significantly lower than expected. Whether a misrepresentation is made by the loan applicant, another third party, or one of our employees, we generally bear the risk of loss associated with the misrepresentation. Our controls and processes may not have detected or may not detect all misrepresented information in our loan originations or from our business clients. Any such misrepresented information could adversely affect our business, financial condition, and results of operations.
Loss of our key management or other personnel, or an inability to attract such management and other personnel, could negatively impact our business.
The successful implementation of our growth strategy depends in part on our ability to retain our experienced management team and key employees and on our ability to attract appropriately qualified new personnel as well as have an effective succession planning framework in place. For instance, our Chief Executive Officer is one of the founders of SCUSA and has extensive experience in the vehicle finance industry. He has a proven track record of successfully operating our business, including by leading us through the recent economic downturn. The loss of any key member of our management team or other key employees could hinder or delay our ability to implement our growth strategy effectively. Further, if we are unable to attract appropriately qualified new personnel as we expand, we may not be successful in implementing our growth strategy. In either instance, our profitability and financial performance could be adversely affected. See “Management” for more detail on our executive officers.
Future changes in our relationship with Santander may adversely affect our operations.
Santander, through SHUSA, owns 84,339,130.70 shares (approximately 65%) of our common stock. We rely on our relationship with Santander, through SHUSA, for several competitive advantages including relationships with OEMs and regulatory best practices. Santander also provides us with significant funding support, through both committed liquidity and opportunistic extensions of credit. During the recent financial downturn, Santander and its affiliates provided us with over $6 billion in financing that enabled us to pursue several acquisitions and/or conversions of vehicle loan portfolios at a time when most major banks were curtailing or eliminating their commercial lending activities. If, after this offering, Santander or SHUSA elects not to provide such support or provide it to the same degree, we may not be able to replace such support ourselves or to obtain substitute arrangements with third parties. We may be unable to obtain such support because of financial or other constraints or be unable to implement substitute arrangements on a timely basis on terms that are comparable, or at all, which could adversely affect our operations.
Furthermore, subject to certain limitations in a shareholders agreement to be entered into among SCUSA, the Principal Stockholders, and Mr. Dundon in connection with consummation of this offering (the “Shareholders Agreement”), which will replace the existing shareholders agreement among these parties, Santander is permitted to sell its interest in us. If Santander reduces its equity interest in us, it may be less willing to provide us with the support it has provided in the past. In addition, our right to use the Santander name is on the basis of a non-exclusive, royalty-free, and non-transferable license from Santander, and further only extends to uses in connection with our current and future operations within the United States. Santander may terminate such license at any time Santander ceases to own, directly or indirectly, 50% or more of our common stock. If we were required to change our name, we would incur the administrative costs and time associated with revising legal
17
Table of Contents
documents and marketing materials, and also may experience loss of brand and loss of business or loss of funding due to consumers’ and banks’ relative lack of familiarity with our new name. Additionally, Chrysler may terminate the Chrysler Agreement if a person other than Santander and its affiliates or our other stockholders owns 20% or more of our common stock and Santander and its affiliates own fewer shares of common stock than such person.
Santander has provided guarantees on the covenants, agreements, and our obligations under the governing documents of our warehouse facilities and privately issued amortizing notes. These guarantees are limited to our obligations as servicer.
Some terms of our credit agreements are influenced by, among other things, the credit ratings of Santander. If Santander were to suffer credit ratings downgrades or other adverse financial developments, we could be negatively impacted, either directly or indirectly. Santander’s short-term credit ratings downgrades in 2012, from A-1 to A-2 (Standard & Poor’s) and from P-1 to P-2 (Moody’s), did not directly impact our cost of funds. However, due to the contractual terms of certain of our debt agreements, these downgrades resulted in the loss of our ability to commingle funds. The loss of commingling increased the amount of funds we were required to borrow, thereby indirectly raising our cost of funds by approximately $1 million per month. In addition, because of the methodologies applied by credit ratings agencies, our securitization ratings in our ABS offerings are indirectly tied to Santander’s credit ratings.
Santander applies certain standardized banking policies, procedures and standards across its affiliated entities, including with respect to internal audit credit approval, governance risk management, and compensation practices. We currently follow certain of these Santander policies and may in the future become subject to additional Santander policies, procedures and standards, which could result in changes to our practices.
It is also possible that our continuing relationship with Santander or SHUSA after the consummation of this offering could reduce the willingness of other banks to develop relationships with us due to general competitive dynamics among such banks.
Negative changes in the business of the OEMs with which we have strategic relationships, including Chrysler, could adversely affect our business.
A significant adverse change in Chrysler’s or other automotive manufacturers’ business, including (i) significant adverse changes in their respective liquidity position and access to the capital markets, (ii) the production or sale of Chrysler or other automotive manufacturers’ vehicles (including the effects of any product recalls), (iii) the quality or resale value of Chrysler or other vehicles, (iv) the use of marketing incentives, (v) Chrysler’s or other automotive manufacturers’ relationships with their key suppliers, or (vi) Chrysler’s or other automotive manufacturers’ respective relationships with the United Auto Workers and other labor unions and other factors impacting automotive manufacturers or their employees could have a material adverse effect on our profitability and financial condition.
Under the Chrysler Agreement, we originate private-label loans and leases to facilitate the purchase of Chrysler vehicles by consumers and Chrysler-franchised automotive dealers. In the future, it is possible that Chrysler or other automotive manufacturers with whom we have relationships could utilize other companies to support their financing needs, including offering products or terms that we would not or could not offer, which could have a material adverse impact on our business and operations. Furthermore, Chrysler or other automotive manufacturers could expand or establish or acquire captive finance companies to support their financing needs thus reducing their need for our services.
There is no assurance that the global automotive market, or Chrysler’s or our other OEM partners’ share of that market, will not suffer downturns in the future, and any negative impact could in turn have a material adverse effect on our business, results of operations, and financial position.
18
Table of Contents
Our information technology may not support our future volumes and business strategies.
We rely on our proprietary origination and servicing platforms that utilize database-driven software applications, including nearly 20 years of internal historical credit data and extensive third-party data, to continuously adapt our origination and servicing operations to evolving consumer behavior and to new vehicle finance and consumer loan products. We employ an extensive team of engineers, information technology analysts, and website designers to ensure that our information technology systems remain on the cutting edge. However, due to the continued rapid changes in technology, there can be no assurance that our information technology solutions will continue to be adequate for the business or to provide a competitive advantage.
Our network and information systems are important to our operating activities and any network and information system shutdowns could disrupt our ability to process loan applications, originate loans, or service our existing loan portfolios, which could have a material adverse impact on our operating activities. Shutdowns may be caused by unforeseen catastrophic events, including natural disasters, terrorist attacks, large-scale power outages, software or hardware defects, computer viruses, cyber attacks, external or internal security breaches, acts of vandalism, misplaced or lost data, programming or human errors, difficulties in migrating technology facilities from one location to another, or other similar events. Although we maintain, and regularly assess the adequacy of, a disaster recovery plan designed to effectively manage the effects of such unforeseen events, we cannot be certain that such plan will function as intended, or otherwise resolve or compensate for such effects. Such a failure of our disaster recovery plan, if and when experienced, may have a material adverse effect on our revenue and ability to support and service our customer base.
We are required to make significant estimates and assumptions in the preparation of our financial statements and our estimates and assumptions may not be accurate.
The preparation of our consolidated financial statements in conformity with generally accepted accounting principles in the United States of America (“GAAP”) requires our management to make significant estimates and assumptions that affect the reported amounts of assets and liabilities and disclosures of contingent assets and liabilities at the date of the consolidated financial statements, and the reported amounts of income and expense during the reporting periods. We also use estimates and assumptions in determining the residual values of leased vehicles. Critical estimates are made by management in determining, among other things, the allowance for loan losses, amounts of impairment, and valuation of income taxes. If our underlying estimates and assumptions prove to be incorrect, our financial condition and results of operations may be materially adversely affected.
Our allowance for loan losses and impairments may prove to be insufficient to absorb probable losses inherent in our loan portfolio.
We maintain an allowance for loan losses, a reserve established through a provision for loan losses charged to expense, that we believe is appropriate to provide for probable losses inherent in our originated loan portfolio. For receivables portfolios purchased from other lenders at a discount to the aggregate principal balance of the receivables, the portion of the discount that was attributable to credit deterioration since origination of the loans is recorded as a nonaccretable difference. Any deterioration in the performance of the purchased portfolios after acquisition results in incremental impairment reserves. Our allowance for loan losses has increased from $347 million, or 5.5% of outstanding principal balance, at December 31, 2008, to $2.4 billion, or 9.7% of outstanding principal balance, at September 30, 2013. The determination of the appropriate level of the allowance for loan losses, impairment reserves, and nonaccretable difference inherently involves a high degree of subjectivity and requires us to make significant estimates of current credit risks and future trends, all of which are subject to change. Changes in economic conditions affecting borrowers, new information regarding our loans, and other factors, both within and outside of our control, may require an increase in the allowance for loan losses. Furthermore, growth in our loan portfolio generally would lead to an increase in the provision for loan losses. Some of our planned growth is in lending areas other than vehicle loans, and we are not experienced in estimating loan and credit losses in those other areas. In addition, if net charge-offs in future periods exceed the
19
Table of Contents
allowance for loan losses, we will need to make additional provisions to increase the allowance for loan losses. There is no accurate method for predicting loan and credit losses, and we cannot assure you that our loan loss reserves will be sufficient to cover actual losses. Any increases in the allowance for loan losses will result in a decrease in net income and capital and may have a material adverse effect on us.
Our profitability and financial condition could be materially adversely affected if the value of used cars declines, resulting in lower residual values of our vehicle leases and lower recoveries in sales of repossessed vehicles.
General economic conditions, the supply of off-lease and other used vehicles to be sold, new vehicle market prices and marketing programs, vehicle brand image and strength, perceived vehicle quality, general consumer preference and confidence levels, overall price, and volatility of gasoline or diesel fuel, among other factors, heavily influence used vehicle prices and thus the residual value of our leased vehicles and the amount we recover in remarketing repossessed vehicles. We expect our financial results to be more sensitive to used auto prices as leases become a larger part of our business.
Our expectation of the residual value of a leased vehicle is a critical input in determining the amount of the lease payments at the inception of a lease contract. Our lease customers are responsible only for any deviation from expected residual value that is caused by excess mileage or excess wear and tear, while we retain the obligation to absorb any general market changes in the value of the vehicle. Therefore, our operating lease expense is increased when we have to take an impairment on our residual values or when the realized residual value of a vehicle at lease termination is less than the expected residual value for the vehicle at lease inception. In addition, the timeliness, effectiveness, and quality of our remarketing of off-lease vehicles affects the net proceeds realized from the vehicle sales. While we have elected not to purchase residual value insurance, our exposure is somewhat lessened by Chrysler’s residual subvention programs and the sharing of losses over a specified threshold. However, we take the first portion of loss on any vehicle, and such losses could have a negative impact on our profitability and financial condition.
Lower used vehicle prices also reduce the amount we can recover when remarketing repossessed vehicles that serve as collateral underlying loans. As a result, declines in used vehicle prices could have a negative impact on our profitability and financial condition.
Poor portfolio performance may trigger credit enhancement provisions in our revolving credit facilities or secured structured financings.
Our revolving credit facilities generally have net spread, delinquency, and net loss ratio limits on the receivables pledged to each facility that, if exceeded, would increase the level of credit enhancement requirements for that facility and redirect all excess cash to the credit providers. Generally, these limits are calculated based on the portfolio collateralizing the respective credit line; however, for two of our warehouse lines, delinquency and net loss ratios are calculated with respect to our serviced portfolio as a whole. Our facility used to finance vehicle lease originations also has a residual loss ratio limit calculated with respect to our serviced lease portfolio as a whole.
The documents that govern our secured structured financings also contain cumulative net loss ratio limits on the receivables included in each securitization trust. If, at any measurement date, a cumulative net loss trigger with respect to any financing were to exceed the specified limits, provisions of the financing agreements would increase the level of credit enhancement requirements for that financing and redirect all excess cash to the holders of the ABS. During this period, excess cash flow, if any, from the facility would be used to fund the increased credit enhancement levels rather than being distributed to us. Once an impacted trust reaches the new requirement, we would return to receiving a residual distribution from the trust.
20
Table of Contents
Future significant loan, lease, or unsecured consumer loan repurchase requirements could harm our profitability and financial condition.
We have repurchase obligations in our capacity as servicer in securitizations and whole-loan sales. If a servicer breaches a representation, warranty, or servicing covenant with respect to the loans sold, the servicer may be required by the servicing provisions to repurchase that asset from the purchaser or otherwise compensate one or more classes of investors for losses caused by the breach. If significant repurchases of assets or other payments are required under our responsibility as servicer, it could have a material adverse effect on our financial condition, liquidity, and results of operations.
We apply financial leverage to our operations, which may materially adversely affect our business, results of operations, and financial condition.
We currently apply financial leverage, pledging most of our assets to credit facilities and securitization trusts, and we intend to continue to apply financial leverage in our retail lending operations. Our debt-to-assets ratio is 89% as of September 30, 2013. Unlike banks, we are not subject to regulatory restrictions on the amount of our leverage. Our total borrowings are only restricted by covenants in our credit facilities and market conditions, and our board of directors may change our target borrowing levels at any time without the approval of our stockholders. Incurring substantial debt subjects us to the risk that our cash flow from operations may be insufficient to service our outstanding debt.
Our indebtedness and other obligations are significant and impose restrictions on our business.
We have a significant amount of indebtedness. At September 30, 2013 and December 31, 2012, we had approximately $22.7 billion and $16.2 billion, respectively, in principal amount of indebtedness outstanding (including approximately $22.0 billion and $15.9 billion, respectively, in secured indebtedness). Interest expense on our indebtedness constituted approximately 12% and 11%, respectively, of our total financing revenue and other interest income for the three and nine months ended September 30, 2013.
Our debt reduces operational flexibility and creates default risks. Our revolving credit facilities contain a borrowing base or advance rate formula which requires us to pledge finance contracts in excess of the amounts which we can borrow under the facilities. We are also required to hold certain funds in restricted cash accounts to provide additional collateral for borrowings under the credit facilities. In addition, certain facilities require the replacement of delinquent or defaulted collateral, and the finance contracts pledged as collateral in securitizations must be less than 31 days delinquent at the time the securitization is issued. Accordingly, increases in delinquencies or defaults resulting from weakened economic conditions would require us to pledge additional finance contracts to support the same borrowing levels and may cause us to be unable to securitize loans to the extent we desire. These outcomes would adversely impact our financial position, liquidity, and results of operations.
Additionally, the credit facilities generally contain various covenants requiring in certain cases minimum financial ratios, asset quality, and portfolio performance ratios (portfolio net loss and delinquency ratios, and pool level cumulative net loss ratios) as well as limits on deferral levels. Generally, these limits are calculated based on the portfolio collateralizing the respective line; however, for certain of our third-party credit facilities, delinquency and net loss ratios are calculated with respect to our serviced portfolio as a whole. Covenants on our debts also limit our ability to:
| • | incur or guarantee additional indebtedness; |
| • | purchase large loan portfolios in bulk; |
| • | pay dividends or make distributions on our capital stock or make certain other restricted payments; |
| • | sell assets, including our loan portfolio or the capital stock of our subsidiaries; |
21
Table of Contents
| • | enter into transactions without affiliates; |
| • | create or incur liens; and |
| • | consolidate, merge, sell, or otherwise dispose of all or substantially all of our assets. |
Additionally, one of our private ABS facilities contains a minimum tangible net worth requirement, and two of our revolving credit facilities contain key man provisions.
Failure to meet any of these covenants could result in an event of default under these agreements. If an event of default occurs under these agreements, the lenders could elect to declare all amounts outstanding under these agreements to be immediately due and payable, enforce their interests against collateral pledged under these agreements, restrict our ability to obtain additional borrowings under these agreements and/or remove us as servicer.
We currently have the ability to pledge retained residuals and create additional unsecured indebtedness on our credit facilities provided by Santander. After this offering, Santander may elect not to renew these facilities, causing us to have to find other funding sources prior to the maturity of the Santander Credit Facilities.
If our debt service obligations increase, whether due to the increased cost of existing indebtedness or the incurrence of additional indebtedness, we may be required to dedicate a significant portion of our cash flow from operations to the payment of principal of, and interest on, our indebtedness, which would reduce the funds available for other purposes. Our indebtedness also could limit our ability to withstand competitive pressures and reduce our flexibility in responding to changing business and economic conditions.
In addition, certain of our funding arrangements may require us to make payments to third parties if losses exceed certain thresholds, including, for example, our flow agreements with Bank of America and SBNA and arrangements with certain third-party loan originators of loans that we purchase on a periodic basis.
Competition with other lenders could adversely affect us.
The vehicle finance market is served by a variety of entities, including the captive finance affiliates of major automotive manufacturers, banks, savings and loan associations, credit unions, and independent finance companies. The market is highly fragmented, with no individual lender capturing more than 10% of the market. Our competitors often provide financing on terms more favorable to automobile purchasers or dealers than we offer. Many of these competitors also have long-standing relationships with automobile dealerships and may offer dealerships or their customers other forms of financing that we do not offer.
We anticipate that we will encounter greater competition as we expand our operations and as the economy continues to emerge from recession. In addition, certain of our competitors are not subject to the same regulatory regimes that we are. As a result, these competitors may have advantages in conducting certain businesses and providing certain services, and may be more aggressive in their loan origination activities. Increasing competition could also require us to lower the rates we charge on loans in order to maintain loan origination volume, which could also have a material adverse effect on our business, including our profitability.
Changes in interest rates may adversely impact our profitability and risk profile.
Our profitability may be directly affected by interest rate levels and fluctuations in interest rates. As interest rates change, our gross interest rate spread on new originations either increases or decreases because the rates charged on the contracts originated or purchased from dealers are limited by market and competitive conditions, restricting our ability to pass on increased interest costs to the consumer. Additionally, although the majority of our borrowers are nonprime and are not highly sensitive to interest rate movement, increases in interest rates may
22
Table of Contents
reduce the volume of loans we originate. While we monitor the interest rate environment and employ hedging strategies designed to mitigate the impact of increased interest rates, we cannot provide assurance that hedging strategies will fully mitigate the impact of changes in interest rates.
We are subject to market, operational, and other related risks associated with our derivative transactions that could have a material adverse effect on us.
We enter into derivative transactions for economic hedging purposes. We are subject to market and operational risks associated with these transactions, including basis risk, the risk of loss associated with variations in the spread between the asset yield and the funding and/or hedge cost, credit or default risk, the risk of insolvency, or other inability of the counterparty to a particular transaction to perform its obligations thereunder, including providing sufficient collateral. Additionally, certain of our derivative agreements require us to post collateral when the fair value of the derivative is negative. Our ability to adequately monitor, analyze, and report derivative transactions continues to depend, to a great extent, on our information technology systems. This factor further increases the risks associated with these transactions and could have a material adverse effect on us.
Adverse outcomes to current and future litigation against us may negatively impact our financial position, liquidity, and results of operations.
As a consumer finance company, we are subject to various consumer claims and litigation seeking damages and statutory penalties. Some litigation against us could take the form of class action complaints by consumers. As the assignee of loans originated by automotive dealers, we also may be named as a co-defendant in lawsuits filed by consumers principally against automotive dealers.
We are party to various litigation claims and legal proceedings. We evaluate these litigation claims and legal proceedings to assess the likelihood of unfavorable outcomes and to estimate, if possible, the amount of potential losses. Based on these assessments and estimates, we establish reserves or disclose the relevant litigation claims or legal proceedings, as appropriate. These assessments and estimates are based on the information available to management at the time and involve a significant amount of management judgment. Actual outcomes or losses may differ materially from our current assessments and estimates and any adverse resolution of litigation pending or threatened against us could negatively impact our financial position, liquidity, and results of operations.
A security breach or a cyber attack could adversely affect our business.
In the normal course of business, we collect, process and retain sensitive and confidential consumer information and may, subject to applicable law, share that information with our third-party service providers. Despite the security measures we have in place, our facilities and systems, and those of third-party service providers, could be vulnerable to external or internal security breaches, acts of vandalism, computer viruses, misplaced or lost data, programming or human errors, or other similar events. A security breach or cyber attack of our computer systems could interrupt or damage our operations or harm our reputation. If third parties or our employees are able to penetrate our network security or otherwise misappropriate our customers’ personal information or contract information, or if we give third parties or our employees improper access to consumers’ personal information or contract information, we could be subject to liability. This liability could include investigations, fines, or penalties imposed by state or federal regulatory agencies, including the loss of necessary permits or licenses. This liability could also include identity theft or other similar fraud-related claims, claims for other misuses, or losses of personal information, including for unauthorized marketing purposes or claims alleging misrepresentation of our privacy and data security practices.
We rely on encryption and authentication technology licensed from third parties to provide the security and authentication necessary to effect secure online transmission of confidential consumer information. Advances in computer capabilities, new discoveries in the field of cryptography, or other events or developments may result in a compromise or breach of the algorithms that we use to protect sensitive consumer transaction data. A party
23
Table of Contents
who is able to circumvent our security measures could misappropriate proprietary information or cause interruptions in our operations. We may be required to expend capital and other resources to protect against such security breaches or cyber attacks or to alleviate problems caused by such breaches or attacks. Our security measures are designed to protect against security breaches and cyber attacks, but our failure to prevent such security breaches and cyber attacks, whether due to an external cyber-security incident, a programming error, or other cause, could damage our reputation, expose us to mitigation costs and the risks of private litigation and government enforcement, disrupt our business, or otherwise have a material adverse effect on our sales and results of operations.
We partially rely on third parties to deliver services, and failure by those parties to provide these services or meet contractual requirements could have a material adverse effect on our business.
We depend on third-party service providers for many aspects of our business operations. For example, we depend on third parties like Experian to obtain data related to our market that we use in our origination and servicing platforms. In addition, we rely on third-party servicing centers for a portion of our servicing activities and on third-party repossession agents. If a service provider fails to provide the services that we require or expect, or fails to meet contractual requirements, such as service levels or compliance with applicable laws, the failure could negatively impact our business by adversely affecting our ability to process customers’ transactions in a timely and accurate manner, otherwise hampering our ability to service our customers, or subjecting us to litigation or regulatory risk for poor vendor oversight. Such a failure could adversely affect the perception of the reliability of our networks and services, and the quality of our brands, and could have a material and adverse effect on our financial condition and results of operations.
Catastrophic events may negatively affect our business, financial condition, and results of operations.
Natural disasters, acts of war, terrorist attacks, and the escalation of military activity in response to these attacks or otherwise may have negative and significant effects, such as imposition of increased security measures, changes in applicable laws, market disruptions, and job losses. These events may have an adverse effect on the economy in general. Moreover, the potential for future terrorist attacks and the national and international responses to these threats could affect our business in ways that cannot be predicted. The effect of any of these events or threats could have a material adverse effect on our business, results of operations, and financial condition.
The obligations associated with being a public company will require significant resources and management attention, which will increase our costs of operations and may divert focus from our business operations.
We have not been required in the past to comply with Securities and Exchange Commission (“SEC”) requirements to file periodic reports with the SEC. As a publicly traded company following completion of this offering, we will be required to file periodic reports containing our consolidated financial statements with the SEC within a specified time following the completion of quarterly and annual periods. As a public company, we will also incur significant legal, accounting, insurance, and other expenses. Compliance with these reporting requirements and other rules of the SEC and the rules of the NYSE will increase our legal and financial compliance costs and make some activities more time consuming and costly. Furthermore, the need to establish the corporate infrastructure demanded of a public company may divert management’s attention from implementing our growth strategy, which could prevent us from successfully implementing our strategic initiatives and improving our business, results of operations, and financial condition. Among other things, we will be required to: prepare and distribute periodic reports and other stockholder communications in compliance with our obligations under the federal securities laws and applicable stock exchange rules; appoint new independent members to our board of directors and committees; create or expand the roles and duties of our board of directors and committees of the board; institute more comprehensive compliance and internal audit functions; evaluate and maintain our system of internal control over financial reporting, and report on management’s assessment thereof, in compliance with the requirements of Section 404 of the Sarbanes-Oxley
24
Table of Contents
Act and the related rules and regulations of the SEC and the Public Company Accounting Oversight Board; involve and retain outside legal counsel and accountants in connection with the activities listed above; enhance our investor relations function; and maintain internal policies, including those relating to disclosure controls and procedures. We have made, and will continue to make, changes to our internal controls and procedures for financial reporting and accounting systems to meet our reporting obligations as a public company. However, we cannot predict or estimate the amount of additional costs we may incur in order to comply with these requirements. We anticipate that these costs will materially increase our total costs and expenses.
Internal controls over financial reporting may not prevent or detect all errors or acts of fraud.
We maintain disclosure controls and procedures designed to ensure that we timely report information as specified in the rules and regulations of the SEC. We also maintain a system of internal control over financial reporting. However, these controls may not achieve their intended objectives. Control processes that involve human diligence and compliance, such as our disclosure controls and procedures and internal control over financial reporting, are subject to lapses in judgment and breakdowns resulting from human failures. Controls can also be circumvented by collusion or improper management override. Because of such limitations, there are risks that material misstatements due to error or fraud may not be prevented or detected and that information may not be reported on a timely basis. If our controls are not effective, it could have a material adverse effect on our financial condition, results of operations, and market for our common stock, and could subject us to regulatory scrutiny.
Regulatory Risks
In addition to the Risk Factors below, please also refer to the section of this prospectus entitled “Business —Supervision and Regulation” for more information on the regulatory regimes to which we are subject.
We operate in a highly regulated industry and continually changing federal, state, and local laws and regulations could materially adversely affect our business.
Due to the highly regulated nature of the consumer finance industry, we are required to comply with a wide array of federal, state, and local laws and regulations that regulate, among other things, the manner in which we conduct our origination and servicing operations. These regulations directly impact our business and require constant compliance, monitoring, and internal and external audits. Although we have an extensive enterprise-wide compliance framework structured to continuously monitor our activities, compliance with applicable law is costly, and may create operational constraints.
These laws and their implementing regulations include, among others, usury laws, Anti-Money Laundering requirements (Bank Secrecy Act and USA PATRIOT Act), Equal Credit Opportunity Act (“ECOA”), Fair Debt Collection Practices Act, Fair Credit Reporting Act, Privacy Regulations (Gramm-Leach Bliley Act and Right to Financial Privacy Act), Electronic Funds Transfer Act, Servicemembers’ Civil Relief Act, Telephone Consumer Protection Act, Truth in Lending Act, and requirements related to unfair, deceptive, or abusive acts or practices.
Many states and local jurisdictions have consumer protection laws analogous to, or in addition to, those listed above. These federal, state, and local laws regulate the manner in which financial institutions deal with customers when making loans or conducting other types of financial transactions.
New legislation and regulation may include changes with respect to consumer financial protection measures and systematic risk oversight authority. Such changes present the risk of financial loss due to regulatory fines or penalties, restrictions or suspensions of business, or costs associated with mandatory corrective action as a result of failure to adhere to applicable laws, regulations, and supervisory guidance. Failure to comply with these laws and regulations could also give rise to regulatory sanctions, customer rescission rights, action by state and local attorneys general, civil or criminal liability, or damage to our reputation, which could materially and adversely affect our business, financial condition, and results of operations.
25
Table of Contents
In connection with the SEC’s review of the Annual Reports on Form 10-K filed by Santander Drive Auto Receivables Trust 2010-1 and Santander Drive Auto Receivables Trust 2010-2 (together, the “2010 Trusts”) for the fiscal year ended December 31, 2012, the 2010 Trusts received a comment from the SEC regarding the applicability to SCUSA, as the servicer of the 2010 Trusts, of certain servicing criteria set forth in Regulation AB relating to the safeguarding of pool assets and related documentation of the 2010 Trusts. We completed our final response to this comment letter, including amendments to the Form 10-K filings by the 2010 Trusts, in September 2013 and believe there has been no adverse impact on our business.
The Dodd-Frank Act and the creation of the CFPB in addition to recently issued rules and guidance will likely increase our regulatory compliance burden and associated costs.
The Dodd-Frank Act introduced a substantial number of reforms that continue to reshape the structure of the regulation of the financial services industry. In particular, the Dodd-Frank Act includes, among other things, the creation of the Consumer Financial Protection Bureau (“CFPB”), which is authorized to promulgate and enforce consumer protection regulations relating to financial products and services.
In March 2013, the CFPB issued a bulletin recommending that indirect vehicle lenders, a class that includes us, take steps to monitor and impose controls over dealer markup policies where dealers charge consumers higher interest rates, with the markup shared between the dealer and the lender.
The CFPB is also conducting supervisory audits of large vehicle lenders and has indicated it intends to study and take action with respect to possible ECOA “disparate impact” credit discrimination in indirect vehicle finance. If the CFPB enters into a consent decree with one or more lenders on disparate impact claims, it could negatively impact the business of the affected lenders, and potentially the business of dealers and other lenders in the vehicle finance market. This impact on dealers and lenders could increase our regulatory compliance requirements and associated costs.
Unlike competitors that are banks, we are subject to the licensing and operational requirements of states and other jurisdictions and our business would be adversely affected if we lost our licenses.
Because we are not a depository institution, we do not benefit from exemptions to state loan servicing or debt collection licensing and regulatory requirements. To the extent that they exist, we must comply with state licensing and various operational compliance requirements in all 50 states and the District of Columbia. These include, among others, form and content of contracts, other documentation, collection practices and disclosures, and record keeping requirements. We are sensitive to regulatory changes that may increase our costs through stricter licensing laws, disclosure laws, or increased fees. Currently, we have all required licenses as applicable to do business in all 50 states and the District of Columbia.
In addition, we are subject to periodic examinations by state and other regulators. The states that currently do not provide extensive regulation of our business may later choose to do so. The failure to comply with licensing or permit requirements and other local regulatory requirements could result in significant statutory civil and criminal penalties, monetary damages, attorneys’ fees and costs, possible review of licenses, and damage to reputation, brand, and valued customer relationships.
We may be subject to certain banking regulations that may limit our business activities.
Because our largest shareholder is a bank holding company and because we provide third-party services to banks, we are subject to certain banking regulations, including oversight by the Federal Reserve, the Office of the Comptroller of the Currency, and the Bank of Spain. Such banking regulations could limit the activities and the types of businesses that we may conduct. The Federal Reserve has broad enforcement authority over bank holding companies and their subsidiaries. The Federal Reserve could exercise its power to restrict SHUSA from having a non-bank subsidiary that is engaged in any activity that, in the Federal Reserve’s opinion, is
26
Table of Contents
unauthorized or constitutes an unsafe or unsound business practice, and could exercise its power to restrict us from engaging in any such activity. The Federal Reserve may also impose substantial fines and other penalties for violations that we may commit. Additionally, the Federal Reserve has the authority to approve or disallow acquisitions we may contemplate, which may limit our future growth plans. To the extent that we are subject to banking regulation, we could be at a competitive disadvantage because some of our competitors are not subject to these limitations.
Risks Related to Our Common Stock
You will incur immediate dilution as a result of this offering.
If you purchase our common stock in this offering, you will pay more for your shares than the pro forma net tangible book value of your shares. As a result, you will incur immediate dilution of $ per share, assuming an initial offering price of $ per share, the midpoint of the range set forth on the cover page of this prospectus, after deducting estimated underwriting discounts and commissions and estimated offering expenses, and based on our net tangible book value per share of $ as of September 30, 2013 after giving effect to the Reorganization, representing the difference between such assumed offering price and our net tangible book value per share. Accordingly, if we are liquidated at our book value, you would not receive the full amount of your investment. If Chrysler elects to exercise its option to purchase an equity participation in the Chrysler Capital portion of our business through an equity interest directly in SCUSA, its new interest could dilute the interests of the then-existing shareholders. See “Dilution” and “Business — Our Relationship with Chrysler.”
There is currently no market for our common stock and a market for our common stock may not develop, which could adversely affect the liquidity and price of our common stock.
Before this offering, there has been no established public market for our common stock. An active, liquid trading market for our common stock may not develop or be sustained following this offering. If an active trading market does not develop, you may have difficulty selling your shares of common stock at an attractive price, or at all. An inactive market may also impair our ability to raise capital by selling our common stock and may impair our ability to acquire other companies, products or technologies by using our common stock as consideration. We have applied to have our common stock listed on the NYSE, but our application may not be approved. In addition, the liquidity of any market that may develop or the price that our stockholders may obtain for their shares of common stock cannot be predicted. The initial public offering price for our common stock will be determined by negotiations between us, the selling stockholders, and the representative of the underwriters and may not be indicative of prices that will prevail in the open market following this offering. See “Underwriting.” Consequently, you may not be able to sell your common stock at or above the initial public offering price or at any other price or at the time that you would like to sell.
The market price of our common stock could decline due to the large number of outstanding shares of our common stock eligible for future sale.
Sales of substantial amounts of our common stock in the public market following this offering or in future offerings, or the perception that these sales could occur, could cause the market price of our common stock to decline. These sales could also make it more difficult for us to sell equity or equity-related securities in the future, at a time and price that we deem appropriate.
Upon completion of this offering and the Reorganization, we will have shares of common stock. Of the outstanding shares of common stock, all of the shares sold in this offering, other than any shares that may be purchased in this offering by a holder that is subject to an agreement, will be freely tradable, except that any shares purchased by “affiliates” (as that term is defined in Rule 144 under the Securities Act of 1933, as amended (the “Securities Act”)), may only be sold in compliance with the limitations described in the section of this prospectus entitled “Shares Eligible for Future Sale.” Taking into consideration the effect of the lock-up
27
Table of Contents
agreements described below and the provisions of Rule 144 under the Securities Act, the remaining shares of our common stock may be eligible for resale in the public market under Rule 144 under the Securities Act subject to applicable restrictions under Rule 144.
We, our Principal Stockholders, our directors and certain of our officers have agreed to customary lock-up agreements with the underwriters in connection with this offering. See “Underwriting.” Shareholder agreements that we have entered into with certain of our officers in connection with the Equity Transaction and certain of our employees (“Management Shareholder Agreements”) also provide that these officers and employees may not sell or otherwise dispose of our common stock for customary periods before and after an underwritten offering of shares of our common stock. See “Certain Relationships and Related Party Transactions — 2011 Investment.” An aggregate of shares of our common stock are subject to these lock-up arrangements. In addition, the Management Shareholder Agreements provide for certain repurchase rights and restrictions, including that shares acquired in the Equity Transaction may not be transferred until December 31, 2016 and that certain shares acquired through the exercise of stock options may not be transferred for certain periods.
In addition, we intend to file a registration statement on Form S-8 under the Securities Act to register an aggregate of approximately shares of common stock for issuance under our 2011 Management Equity Plan. Any shares issued in connection with acquisitions, the exercise of stock options, or otherwise would dilute the percentage ownership held by investors who purchase our shares in this offering. See “Shares Eligible for Future Sale.”
Substantially all of the shares of common stock existing prior to this offering are subject to registration rights pursuant to the Shareholders Agreement. In addition, we have granted certain of our officers and employees piggyback registration rights in the Management Shareholder Agreements pursuant to which they may require us to include their shares in future offerings that involve, in whole or in part, a secondary offering of our shares, provided that Auto Finance Holdings is selling shares in such offering. See “Certain Relationships and Related Party Transactions — Shareholders Agreement — Registration Rights” and “Certain Relationships and Related Party Transactions — 2011 Investment.”
The market price of our common stock may be volatile, which could cause the value of an investment in our common stock to decline.
The market price of our common stock may fluctuate substantially due to a variety of factors, many of which are beyond our control, including:
| • | general market conditions; |
| • | domestic and international economic factors unrelated to our performance; |
| • | actual or anticipated fluctuations in our quarterly operating results; |
| • | changes in or failure to meet publicly disclosed expectations as to our future financial performance; |
| • | downgrades in securities analysts’ estimates of our financial performance or lack of research and reports by industry analysts; |
| • | changes in market valuations or earnings of similar companies; |
| • | any future sales of our common stock or other securities; and |
| • | additions or departures of key personnel. |
The stock markets in general have experienced substantial volatility that has often been unrelated to the operating performance of particular companies. These types of broad market fluctuations may adversely affect the trading price of our common stock. In the past, stockholders have sometimes instituted securities class action litigation against companies following periods of volatility in the market price of their securities. Any similar
28
Table of Contents
litigation against us could result in substantial costs, divert management’s attention and resources, and harm our business or results of operations. For example, we are currently operating in, and have benefited from, a protracted period of historically low interest rates that will not be sustained indefinitely, and future fluctuations in interest rates could cause an increase in volatility of the market price of our common stock.
Certain provisions of our amended and restated certificate of incorporation and amended and restated bylaws may have anti-takeover effects, which could limit the price investors might be willing to pay in the future for our common stock. In addition, Delaware law may inhibit takeovers of us and could limit our ability to engage in certain strategic transactions our board of directors believes would be in the best interests of stockholders.
Certain provisions of our amended and restated certificate of incorporation and amended and restated bylaws that will be effective upon completion of this offering could discourage unsolicited takeover proposals that stockholders might consider to be in their best interests. Among other things, our amended and restated certificate of incorporation and amended and restated bylaws will include provisions that:
| • | do not permit cumulative voting in the election of directors, which would otherwise allow less than a majority of stockholders to elect director candidates; |
| • | fix the number of directors and provide that the number of directors may only be changed by an amendment to our bylaws; |
| • | limit the ability of our stockholders to nominate candidates for election to our board of directors; |
| • | authorize the issuance of “blank check” preferred stock without any need for action by stockholders; |
| • | limit the ability of stockholders to call special meetings of stockholders or to act by written consent in lieu of a meeting; and |
| • | establish advance notice requirements for nominations for election to our board of directors or for proposing matters that may be acted on by stockholders at stockholder meetings. |
The foregoing factors, as well as the significant common stock ownership by our Principal Stockholders, could impede a merger, takeover, or other business combination or discourage a potential investor from making a tender offer for our common stock, which, under certain circumstances, could reduce the market value of our common stock. See “Description of Capital Stock.”
In addition, Section 203 of the Delaware General Corporation Law (the “DGCL”), generally affects the ability of an “interested stockholder” to engage in certain business combinations, including mergers, consolidations, or acquisitions of additional shares, for a period of three years following the time that the stockholder becomes an “interested stockholder.” An “interested stockholder” is defined to include persons owning directly or indirectly 15% or more of the outstanding voting stock of a corporation. We currently intend to elect in our amended and restated certificate of incorporation not to be subject to Section 203 of the DGCL. However, our amended and restated certificate of incorporation will contain provisions that have the same effect as Section 203, except that they provide that SHUSA and Auto Finance Holdings will not be deemed to be “interested stockholders,” regardless of the percentage of our voting stock owned by them and, accordingly, will not be subject to such restrictions.
Our common stock is and will be subordinate to all of our existing and future indebtedness and any preferred stock, and effectively subordinated to all indebtedness and preferred equity claims against our subsidiaries.
Shares of our common stock are common equity interests in us and, as such, will rank junior to all of our existing and future indebtedness and other liabilities. Additionally, holders of our common stock may become subject to the prior dividend and liquidation rights of holders of any classes or series of preferred stock that our board of directors may designate and issue without any action on the part of the holders of our common stock. Furthermore, our right to participate in a distribution of assets upon any of our subsidiaries’ liquidation or reorganization is subject to the prior claims of that subsidiary’s creditors and preferred stockholders.
29
Table of Contents
Our Principal Stockholders will continue to have significant influence over us after this offering, including control over decisions that require the approval of stockholders, which could limit your ability to influence the outcome of key transactions, including a change of control.
Our Principal Stockholders exert, and after this offering will continue to exert, significant influence over us, including pursuant to the terms of the Shareholders Agreement. As set forth under “Security Ownership of Certain Beneficial Owners, Management and Selling Stockholders,” the Principal Stockholders will continue to own approximately % of our common stock after the completion of this offering, assuming the underwriters do not exercise any of their over-allotment option to purchase additional shares. If the underwriters exercise in full their option to purchase additional shares, the Principal Stockholders will own approximately % of our common stock. Pursuant to the Shareholders Agreement, the Principal Stockholders will have the right to nominate all of our directors from and after this offering, provided certain minimum share ownership thresholds are maintained. See “Certain Relationships and Related Party Transactions — Shareholders Agreement.” Through our board of directors, our Principal Stockholders will control our policies and operations, including, among other things, the appointment of management, future issuances of our common stock or other securities, the payment of dividends, if any, on our common stock, the incurrence of debt by us, and the entering into of extraordinary transactions.
In addition, the Shareholders Agreement provides our Principal Stockholders with approval rights in their capacity as stockholders over certain specific actions taken by SCUSA, provided certain minimum share ownership thresholds are maintained. These actions include, among other things, mergers and sales of all or substantially all of our assets. The Principal Stockholders may have interests that do not align with the interests of our other stockholders, including with regard to pursuing acquisitions, divestitures, and other transactions that, in their judgment, could enhance their equity investment, even though such transactions might involve risks to our other stockholders. For example, our Principal Stockholders could cause us to make acquisitions that increase our indebtedness or to sell revenue-generating assets. The Principal Stockholders will have effective control over our decisions to enter into such corporate transactions regardless of whether others believe that the transaction is in our best interests. Such control may have the effect of delaying, preventing, or deterring a change of control of SCUSA, could deprive stockholders of an opportunity to receive a premium for their common stock as part of a sale of SCUSA, and might ultimately affect the market price of our common stock. See “Certain Relationships and Related Party Transactions — Shareholders Agreement” and “Description of Capital Stock.”
Certain of our Principal Stockholders or their respective investors are also in the business of making investments in companies and may from time to time acquire and hold interests in businesses that compete directly or indirectly with us. Certain of our Principal Stockholders or their respective investors may also pursue acquisition opportunities that are complementary to our business and, as a result, those acquisition opportunities may not be available to us. None of our Principal Stockholders nor any of their affiliates will be obligated to present any particular investment or business opportunity to us, even if such opportunity is of a character that could be pursued by us, and may pursue it for their own account or recommend to any other person any such investment opportunity. See “Description of our Capital Stock — Renunciation of Corporate Opportunities.”
We are a “controlled company” within the meaning of the NYSE rules and, as a result, will qualify for, and intend to rely on, exemptions from certain corporate governance requirements. You will not have the same protections afforded to stockholders of companies that are subject to such requirements.
After completion of this offering, the Principal Stockholders will continue to own a majority of the voting power of our outstanding common stock. As a result, we are a “controlled company” within the meaning of the corporate governance standards. Under these rules, a company of which more than 50% of the voting power is held by an individual, group, or another company is a “controlled company” and may elect not to comply with certain corporate governance requirements, including:
| • | the requirement that a majority of the board of directors consist of independent directors; |
30
Table of Contents
| • | the requirement that we have a separate nominating and corporate governance committee that is composed entirely of independent directors with a written charter addressing the committee’s purpose and responsibilities; |
| • | the requirement that we have a separate compensation committee that is composed entirely of independent directors with a written charter addressing the committee’s purpose and responsibilities; and |
| • | the requirement for an annual performance evaluation of the nominating and corporate governance and compensation committees. |
Following this offering, we intend to utilize these exemptions. As a result, we will not have a majority of independent directors and we will not have a nominating and corporate governance committee or a compensation committee. Accordingly, you will not have the same protections afforded to stockholders of companies that are subject to all of the corporate governance requirements of the NYSE.
31
Table of Contents
CAUTIONARY NOTE REGARDING FORWARD-LOOKING STATEMENTS
This prospectus contains forward-looking statements. Any statements about our expectations, beliefs, plans, predictions, forecasts, objectives, assumptions, or future events or performance are not historical facts and may be forward-looking. These statements are often, but not always, made through the use of words or phrases such as “anticipate,” “believes,” “can,” “could,” “may,” “predicts,” “potential,” “should,” “will,” “estimate,” “plans,” “projects,” “continuing,” “ongoing,” “expects,” “intends,” and similar words or phrases. Accordingly, these statements are only predictions and involve estimates, known and unknown risks, assumptions, and uncertainties that could cause actual results to differ materially from those expressed in them. Our actual results could differ materially from those anticipated in such forward-looking statements as a result of several factors more fully described under the caption “Risk Factors” and elsewhere in this prospectus, including the exhibits hereto.
Any or all of our forward-looking statements in this prospectus may turn out to be inaccurate. The inclusion of this forward-looking information should not be regarded as a representation by us, the selling stockholders, the underwriters, or any other person that the future plans, estimates, or expectations contemplated by us will be achieved. We have based these forward-looking statements largely on our current expectations and projections about future events and financial trends that we believe may affect our financial condition, results of operations, business strategy, and financial needs. There are important factors that could cause our actual results, level of activity, performance, or achievements to differ materially from the results, level of activity, performance, or achievements expressed or implied by the forward-looking statements, including, but not limited to, statements regarding (i) our asset growth and sources of funding; (ii) our expansion into different consumer segments; (iii) our financing plans; (iv) the impact of regulations on us; (v) our exposure to market risks, including interest rate risk and equity price risk; (vi) our exposure to credit risks, including credit default risk and settlement risk; (vii) our competition; (viii) our projected capital expenditures; (ix) our capitalization requirements and level of reserves; (x) our liquidity; (xi) trends affecting the economy generally; (xii) and trends affecting our financial condition and our results of operations. Examples of these important factors, in addition to those discussed elsewhere in this prospectus, that could cause our actual results to differ substantially from those anticipated in our forward-looking statements, include, among others:
| • | adverse economic conditions in the United States and worldwide may negatively impact our results; |
| • | our business could suffer if our access to funding is reduced; |
| • | we face significant risks implementing our growth strategy, some of which are outside our control; |
| • | our recent agreement with Chrysler may not result in currently anticipated levels of growth and is subject to certain performance conditions that could result in termination of the agreement; |
| • | our business could suffer if we are unsuccessful in developing and maintaining relationships with automobile dealerships; |
| • | our financial condition, liquidity, and results of operations depend on the credit performance of our loans; |
| • | loss of our key management or other personnel, or an inability to attract such management and personnel, could negatively impact our business; |
| • | future changes in our relationship with Santander could adversely affect our operations; and |
| • | we operate in a highly regulated industry and continually changing federal, state, and local laws and regulations could materially adversely affect our business. |
All forward-looking statements are necessarily only estimates of future results, and actual results may differ materially from expectations. You are, therefore, cautioned not to place undue reliance on such statements which should be read in conjunction with the other cautionary statements that are included elsewhere in this prospectus. In particular, you should consider the numerous risks described in the “Risk Factors” section of this prospectus. Further, any forward-looking statement speaks only as of the date on which it is made and we undertake no obligation to update or revise any forward-looking statement to reflect events or circumstances after the date on which the statement is made or to reflect the occurrence of unanticipated events.
32
Table of Contents
We will not receive any proceeds from the sale of shares of common stock by our selling stockholders.
33
Table of Contents
In July 2013, Santander Consumer USA Inc., an Illinois corporation (“SCUSA Illinois”), formed Santander Consumer USA Holdings Inc., a Delaware corporation (“SCUSA Delaware”), and SCUSA Merger Sub Inc., an Illinois corporation and a wholly owned subsidiary of SCUSA Delaware (“SCUSA Merger Sub”). SCUSA Delaware is the registrant in this offering. Both SCUSA Delaware and SCUSA Merger Sub were formed solely for the purpose of effecting this offering. Neither SCUSA Delaware nor SCUSA Merger Sub has engaged in any business or other activities except in connection with their respective formations and effecting this offering, and, except for SCUSA Delaware holding the stock of SCUSA Merger Sub, neither holds any assets and, except for SCUSA Merger Sub being a wholly owned subsidiary of SCUSA Delaware, neither has any subsidiaries. Prior to the closing of this offering, SCUSA Merger Sub will merge with and into SCUSA Illinois, with SCUSA Illinois continuing as the surviving corporation and a wholly owned subsidiary of SCUSA Delaware, the registrant. In the merger, all of the outstanding shares of common stock of SCUSA Illinois will be converted into shares of SCUSA Delaware common stock on a for basis.
The Reorganization will not result in any change of the business, management, jobs, fiscal year, assets, liabilities, or location of the principal facilities of SCUSA Illinois.
34
Table of Contents
It has been our policy in recent years to pay a dividend to all common stockholders. Following the completion of this offering, we currently intend to pay dividends on a quarterly basis at an initial amount of approximately $ per share. Our board of directors may also change or eliminate the payment of future dividends at its discretion, without prior notice to our stockholders, and our dividend policy and practice may change at any time and from time to time in the future. Any future determination to pay dividends to our stockholders will be dependent upon our financial condition, results of operation, capital needs, government regulations, and any other factors that our board of directors may deem relevant at such time and from time to time.
Our recent dividends have been as follows:
| Outstanding Shares on Date of Record |
Dividend per Share | |||||||||||||||||||
| Dividend Declared |
Declared on Earnings for |
Dividend Amount |
Actual | (Adjusted for Reorganization) |
Actual | (Adjusted for Reorganization) | ||||||||||||||
| December 2010 |
2010 | $ | 400,000,000 | 92,173,913 | $ | 4.34 | ||||||||||||||
| March 2011 |
2010 | 247,632,000 | 92,173,913 | 2.69 | ||||||||||||||||
| April 2011 |
2011 | 217,681,200 | 92,173,913 | 2.36 | ||||||||||||||||
| April 2012 |
2011 | 243,643,727 | 129,819,883 | 1.88 | ||||||||||||||||
| April 2012 |
2012 | 86,356,273 | 129,819,883 | 0.67 | ||||||||||||||||
| September 2012 |
2012 | 145,000,000 | 129,819,883 | 1.12 | ||||||||||||||||
| October 2012 |
2012 | 200,000,000 | 129,819,883 | 1.54 | ||||||||||||||||
| December 2012 |
2012 | 60,000,000 | 129,819,883 | 0.46 | ||||||||||||||||
| April 2013 |
2013 | 290,401,495 | 129,821,447 | 2.24 | ||||||||||||||||
35
Table of Contents
The following table sets forth our cash and cash equivalents and our capitalization as of September 30, 2013 on a historical basis.
Amounts included in this table are derived from unaudited financial statements included elsewhere in this registration statement. This table should be read in conjunction with “Selected Historical Consolidated Financial Information,” “Management’s Discussion and Analysis of Financial Condition and Results of Operations,” and the consolidated financial statements and the related notes thereto appearing elsewhere in this prospectus.
| At September 30, 2013 |
||||
| (Dollars in thousands, except per share data) |
||||
| Cash and cash equivalents |
$ | 27,351 | ||
|
|
|
|||
| Liabilities: |
||||
| Notes payable — credit facilities |
7,407,526 | |||
| Notes payable — secured structured financings |
15,275,871 | |||
| Equity: |
||||
| Common stock, no par value: 250,000,000 shares authorized, 129,824,195 shares issued, 129,823,012 shares outstanding (1) |
1,265,764 | |||
| Additional paid-in capital |
147,161 | |||
| Accumulated other comprehensive loss |
(6,595 | ) | ||
| Retained earnings |
1,162,828 | |||
|
|
|
|||
| Total equity |
2,569,158 | |||
|
|
|
|||
| Total capitalization |
$ | 25,252,555 | ||
|
|
|
|||
| (1) | Excludes all shares reserved for issuance under our 2011 Management Equity Plan. |
36
Table of Contents
If you invest in our common stock in this offering, your ownership interest will be immediately diluted to the extent of the difference between the initial public offering price per share and the net tangible book value per share of our common stock after this offering. Dilution results from the fact that the initial public offering price per share of common stock is substantially in excess of the net tangible book value per share of our common stock attributable to existing stockholders for our presently outstanding shares of common stock. As of September 30, 2013, net tangible book value attributable to our stockholders was $2,440,585,000, or $ per share of common stock based on shares of common stock issued and outstanding after giving effect to the Reorganization. Net tangible book value per share equals total consolidated tangible assets minus total consolidated liabilities divided by the number of outstanding shares of common stock.
This offering will result in an immediate dilution in the net tangible book value of $ per share to the investors who purchase our common stock in this offering.
The following table illustrates the per share dilution after giving pro forma effect to this offering:
| Initial public offering price per share |
$ | |||||||
| Net tangible book value per share as of September 30, 2013 |
$ | |||||||
|
|
|
|||||||
| Dilution per share to new investors |
$ |
The following table summarizes, as of September 30, 2013, the difference between existing stockholders and new investors with respect to the number of shares of common stock purchased, the total consideration paid or to be paid for these shares, and the average price per share paid by our existing stockholders and to be paid by the new investors in this offering. The calculation below reflecting the effect of shares purchased by new investors is based on the initial public offering price of $ per share, the midpoint of the range set forth on the cover page of this prospectus after deducting underwriting discounts and commissions and estimated offering expenses payable by us.
| Shares Purchased | Total Consideration | Average Price Per Share |
||||||||||||||||
| Number |
Percent | Amount | Percent | |||||||||||||||
| Existing stockholders |
% | $ | % | $ | ||||||||||||||
| New investors (1) |
||||||||||||||||||
| Total |
100.0 | 100.0 | ||||||||||||||||
| (1) | The selling stockholders identified in this prospectus are offering all of the shares of common stock in this offering. We are not offering any shares of common stock in this offering and we will not receive any of the proceeds from the sale of shares in this offering. |
The number of shares purchased is based on shares of common stock outstanding as of September 30, 2013 after giving effect to the Reorganization. The discussion and table above exclude shares of common stock issuable upon exercise of outstanding options issued. If the underwriters were to fully exercise their option to purchase additional shares of our common stock, the percentage of shares of our common stock held by existing stockholders would be %, and the percentage of shares of our common stock held by new investors would be %. To the extent any outstanding options are exercised, new investors will experience further dilution. To the extent all outstanding options had been exercised as of September 30, 2013, the net tangible book value per share after this offering would be $ and total dilution per share to new investors would be $ .
37
Table of Contents
SELECTED HISTORICAL CONSOLIDATED FINANCIAL INFORMATION
The following selected consolidated financial data should be read in conjunction with, and are qualified by reference to, “Management’s Discussion and Analysis of Financial Condition and Results of Operations” and the consolidated financial statements and notes thereto included elsewhere in this prospectus. The consolidated statement of income data for the years ended December 31, 2012, 2011, and 2010 and the consolidated balance sheet data at December 31, 2012 and 2011 has been derived from, and is qualified by reference to, our audited consolidated financial statements included elsewhere in this prospectus and should be read in conjunction with those consolidated financial statements and notes thereto. The consolidated statement of income data for the years ended December 31, 2009 and 2008 and the consolidated balance sheet data at December 31, 2010, 2009, and 2008 has been derived from audited consolidated financial statements that are not included in this prospectus. The consolidated statement of income data for the quarterly and year-to-date periods ended September 30, 2013 and 2012 and the consolidated balance sheet data at September 30, 2013 are derived from, and qualified by reference to, our unaudited interim consolidated financial statements included elsewhere in this prospectus and should be read in conjunction with those consolidated financial statements and notes thereto.
Santander Consumer USA Holdings Inc. has not engaged in any operations or conducted any activities other than those incidental to its formation and to preparations for the Reorganization and this offering. It will have only nominal assets and no liabilities prior to the consummation of the Reorganization and this offering. Upon closing, its assets will include shares in Santander Consumer USA Inc., its wholly owned subsidiary and operating company, and the cash proceeds of this offering. See “Reorganization.” Accordingly, this prospectus includes, and the discussion below is based solely on, the historical financial statements of Santander Consumer USA Inc.
| Three Months Ended | Nine Months Ended | Year Ended | ||||||||||||||||||||||||||||||||||
| September 30, 2013 |
September 30, 2012 |
September 30, 2013 |
September 30, 2012 |
December 31, 2012 |
December 31, 2011 |
December 31, 2010 |
December 31, 2009 |
December 31, 2008 |
||||||||||||||||||||||||||||
| (Dollar amounts in thousands, except per share data) | ||||||||||||||||||||||||||||||||||||
| Income Statement Data |
||||||||||||||||||||||||||||||||||||
| Income from individually acquired retail installment contracts |
$ | 879,628 | $ | 580,360 | $ | 2,333,857 | $ | 1,600,054 | $ | 2,223,833 | $ | 1,695,538 | $ | 1,308,728 | $ | 1,281,515 | $ | 1,396,610 | ||||||||||||||||||
| Income from purchased receivables portfolios |
87,237 | 161,753 | 327,712 | 545,819 | 704,770 | 870,257 | 734,634 | 218,240 | 105,229 | |||||||||||||||||||||||||||
| Other financing income |
44,627 | 2,845 | 62,205 | 7,416 | 19,899 | 28,718 | 33,216 | 10,485 | 5,333 | |||||||||||||||||||||||||||
|
|
|
|
|
|
|
|
|
|
|
|
|
|
|
|
|
|
|
|||||||||||||||||||
| Interest and fees on finance receivables and loans |
1,011,492 | 744,958 | 2,723,774 | 2,153,289 | 2,948,502 | 2,594,513 | 2,076,578 | 1,510,240 | 1,507,172 | |||||||||||||||||||||||||||
| Interest expense |
120,589 | 98,774 | 291,062 | 293,238 | 374,027 | 418,526 | 316,486 | 235,031 | 256,356 | |||||||||||||||||||||||||||
| Net other finance and interest income |
9,643 | 2,950 | 17,486 | 9,423 | — | — | — | — | — | |||||||||||||||||||||||||||
| Net interest margin |
900,546 | 649,134 | 2,450,198 | 1,869,474 | 2,574,475 | 2,175,987 | 1,760,092 | 1,275,209 | 1,250,816 | |||||||||||||||||||||||||||
| Provision for loan losses on individually acquired retail installment contracts |
447,565 | 243,698 | 1,074,487 | 683,000 | 1,119,074 | 741,559 | 750,625 | 720,938 | 823,024 | |||||||||||||||||||||||||||
| Incremental increase (decrease) in allowance related to purchased receivables portfolios |
93,718 | (57,823 | ) | 51,654 | (22,798 | ) | 3,378 | 77,662 | 137,600 | — | — | |||||||||||||||||||||||||
| Other provisions for loan losses |
56,918 | — | 97,664 | — | — | — | — | — | — | |||||||||||||||||||||||||||
|
|
|
|
|
|
|
|
|
|
|
|
|
|
|
|
|
|
|
|||||||||||||||||||
| Provision for loan losses |
598,201 | 185,875 | 1,223,805 | 660,202 | 1,122,452 | 819,221 | 888,225 | 720,938 | 823,024 | |||||||||||||||||||||||||||
| Profit sharing |
27,238 | — | 34,802 | — | — | — | — | — | — | |||||||||||||||||||||||||||
| Other income |
78,340 | 74,291 | 208,878 | 238,890 | 295,689 | 452,529 | 249,028 | 48,096 | 43,120 | |||||||||||||||||||||||||||
| Costs and expenses |
176,140 | 183,730 | 496,312 | 464,192 | 559,163 | 557,083 | 404,840 | 249,012 | 209,315 | |||||||||||||||||||||||||||
| Income tax expense |
65,486 | 141,261 | 322,413 | 372,266 | 453,615 | 464,034 | 277,944 | 143,834 | 87,472 | |||||||||||||||||||||||||||
| Net income |
111,821 | 212,559 | 581,744 | 611,704 | 734,934 | 788,178 | 438,111 | 209,521 | 174,125 | |||||||||||||||||||||||||||
| Net income attributable to Santander Consumer USA Inc shareholders |
111,245 | 168,467 | 583,565 | 595,846 | 715,003 | 768,197 | 438,111 | 209,521 | 174,125 | |||||||||||||||||||||||||||
| Share Data |
||||||||||||||||||||||||||||||||||||
| Weighted-average common shares outstanding |
||||||||||||||||||||||||||||||||||||
| Basic |
129,822,780 | 129,819,883 | 129,821,712 | 129,819,883 | 129,819,883 | 92,277,053 | 92,173,913 | 92,173,913 | 92,173,913 | |||||||||||||||||||||||||||
| Diluted |
129,822,780 | 129,819,883 | 129,821,712 | 129,819,883 | 129,819,883 | 92,277,053 | 92,173,913 | 92,173,913 | 92,173,913 | |||||||||||||||||||||||||||
| Earnings per share attributable to Santander Consumer USA Inc shareholders |
||||||||||||||||||||||||||||||||||||
| Basic |
$ | 0.86 | $ | 1.30 | $ | 4.50 | $ | 4.59 | $ | 5.51 | $ | 8.32 | $ | 4.75 | $ | 2.27 | $ | 1.89 | ||||||||||||||||||
| Diluted |
$ | 0.86 | $ | 1.30 | $ | 4.50 | $ | 4.59 | $ | 5.51 | $ | 8.32 | $ | 4.75 | $ | 2.27 | $ | 1.89 | ||||||||||||||||||
38
Table of Contents
| Three Months Ended | Nine Months Ended | Year Ended | ||||||||||||||||||||||||||||||||||
| September 30, 2013 |
September 30, 2012 |
September 30, 2013 |
September 30, 2012 |
December 31, 2012 |
December 31, 2011 |
December 31, 2010 |
December 31, 2009 |
December 31, 2008 |
||||||||||||||||||||||||||||
| (Dollar amounts in thousands, except per share data) | ||||||||||||||||||||||||||||||||||||
| Net tangible book value per common share at period end |
||||||||||||||||||||||||||||||||||||
| Excluding other comprehensive income (loss) |
$ | 18.85 | $ | 18.85 | $ | 16.04 | $ | 16.20 | $ | 6.95 | $ | 6.37 | $ | 4.49 | ||||||||||||||||||||||
| Including other comprehensive income (loss) |
$ | 18.80 | $ | 18.80 | $ | 15.97 | $ | 16.11 | $ | 6.95 | $ | 6.24 | $ | 4.06 | ||||||||||||||||||||||
| Dividends declared per share of common stock |
||||||||||||||||||||||||||||||||||||
| Basic |
$ | — | $ | 1.12 | $ | 2.24 | $ | 3.67 | $ | 5.66 | $ | 5.05 | $ | 4.34 | — | — | ||||||||||||||||||||
| Diluted |
$ | — | $ | 1.12 | $ | 2.24 | $ | 3.67 | $ | 5.66 | $ | 5.05 | $ | 4.34 | — | — | ||||||||||||||||||||
| Balance Sheet Data (1) |
||||||||||||||||||||||||||||||||||||
| Finance receivables and loans |
$ | 21,238,684 | $ | 21,238,684 | $ | 16,265,820 | $ | 16,715,703 | $ | 15,032,046 | $ | 7,466,267 | $ | 5,600,102 | ||||||||||||||||||||||
| Goodwill and intangible assets |
128,573 | 128,573 | 126,700 | 125,427 | 126,767 | 142,198 | 105,643 | |||||||||||||||||||||||||||||
| Total assets |
25,608,280 | 25,608,280 | 18,741,644 | 19,404,371 | 16,773,021 | 8,556,177 | 6,044,454 | |||||||||||||||||||||||||||||
| Total borrowings |
22,683,397 | 22,683,397 | 16,227,995 | 16,790,518 | 15,065,635 | 7,525,930 | 5,432,338 | |||||||||||||||||||||||||||||
| Total liabilities |
23,039,122 | 23,039,122 | 16,502,178 | 17,167,686 | 16,005,404 | 7,838,862 | 5,564,986 | |||||||||||||||||||||||||||||
| Total equity |
2,569,158 | 2,569,158 | 2,239,466 | 2,236,685 | 767,617 | 717,315 | 479,468 | |||||||||||||||||||||||||||||
| Allowance for loan losses |
2,355,087 | 2,355,087 | 1,774,002 | 1,208,475 | 840,599 | 384,396 | 347,302 | |||||||||||||||||||||||||||||
| Other Information |
||||||||||||||||||||||||||||||||||||
| Charge-offs, net of recoveries |
$ | 371,396 | $ | 272,692 | $ | 772,187 | $ | 710,002 | $ | 1,008,454 | $ | 1,025,133 | $ | 709,367 | $ | 683,844 | $ | 679,172 | ||||||||||||||||||
| End of period Delinquent principal over 60 days |
969,886 | 969,886 | 865,917 | 767,838 | 579,627 | 502,254 | 477,141 | |||||||||||||||||||||||||||||
| End of period Gross finance receivables and loans |
24,201,063 | 24,201,063 | 18,655,497 | 18,754,938 | 16,843,774 | 8,309,153 | 6,360,982 | |||||||||||||||||||||||||||||
| Average gross individually acquired retail installment contracts |
19,790,033 | 12,704,563 | 17,180,908 | 11,527,698 | 12,082,026 | 8,843,036 | 6,631,231 | 5,690,833 | 5,396,355 | |||||||||||||||||||||||||||
| Average gross purchased receivables portfolios |
2,676,906 | 5,706,495 | 3,325,260 | 6,798,200 | 6,309,497 | 7,270,080 | 4,978,727 | 975,080 | 320,903 | |||||||||||||||||||||||||||
|
|
|
|
|
|
|
|
|
|
|
|
|
|
|
|
|
|
|
|||||||||||||||||||
| Average Gross finance receivables and loans |
23,246,772 | 18,539,064 | 21,396,754 | 18,454,847 | 18,501,710 | 16,282,215 | 12,111,969 | 7,266,079 | 5,728,599 | |||||||||||||||||||||||||||
| Average Total assets |
24,352,346 | 18,530,771 | 21,514,270 | 18,300,123 | 18,411,012 | 16,067,623 | 11,984,997 | 6,930,260 | 5,520,652 | |||||||||||||||||||||||||||
| Average Debt |
21,451,420 | 15,781,659 | 18,681,703 | 15,528,709 | 15,677,522 | 14,557,370 | 10,672,331 | 6,083,953 | 4,989,280 | |||||||||||||||||||||||||||
| Average Total equity |
2,525,997 | 2,365,722 | 2,453,782 | 2,334,008 | 2,312,781 | 916,219 | 850,219 | 594,097 | 406,680 | |||||||||||||||||||||||||||
| Ratios (2) |
||||||||||||||||||||||||||||||||||||
| Yield on individually acquired retail installment contracts |
17.8 | % | 18.3 | % | 18.1 | % | 18.5 | % | 18.4 | % | 19.2 | % | 19.7 | % | 22.5 | % | 25.9 | % | ||||||||||||||||||
| Yield on purchased receivables portfolios |
13.0 | 11.3 | 13.1 | 10.7 | 11.2 | 12.0 | 14.8 | 22.4 | 32.8 | |||||||||||||||||||||||||||
| Yield on interest-earning assets |
17.4 | 16.1 | 17.0 | 15.6 | 15.9 | 15.9 | 17.1 | 20.8 | 26.3 | |||||||||||||||||||||||||||
| Cost of interest-bearing liabilities |
2.2 | 2.5 | 2.1 | 2.5 | 2.4 | 2.9 | 3.0 | 3.9 | 5.1 | |||||||||||||||||||||||||||
| Efficiency ratio |
18.0 | 25.4 | 18.7 | 22.0 | 19.5 | 21.2 | 20.2 | 18.8 | 16.2 | |||||||||||||||||||||||||||
| Return on average assets |
1.8 | 4.6 | 3.6 | 4.5 | 4.0 | 4.9 | 3.7 | 3.0 | 3.2 | |||||||||||||||||||||||||||
| Return on average equity |
17.7 | 35.9 | 31.6 | 34.9 | 31.8 | 86.0 | 51.5 | 35.3 | 42.8 | |||||||||||||||||||||||||||
| Net chargeoff ratio |
6.4 | 5.9 | 4.6 | 5.1 | 5.5 | 6.3 | 5.9 | 9.4 | 11.9 | |||||||||||||||||||||||||||
| Delinquency ratio |
4.0 | 4.0 | 4.6 | 4.1 | 3.4 | 6.0 | 7.5 | |||||||||||||||||||||||||||||
| Tangible common equity to tangible assets |
9.6 | 9.6 | 11.3 | 11.0 | 3.8 | 6.8 | 6.3 | |||||||||||||||||||||||||||||
| Common stock dividend payout ratio |
0.0 | 86.3 | 49.8 | 80.0 | 102.8 | 60.6 | 91.3 | 0.0 | 0.0 | |||||||||||||||||||||||||||
39
Table of Contents
| (1) | Balance sheet data as of September 30, 2012 has been excluded. |
| (2) | “Yield on interest-earning assets” is defined as the ratio of Interest and fees on finance receivables and loans to Average gross finance receivables and loans. |
“Cost of interest-bearing liabilities” is defined as the ratio of Interest expense to Average debt during the period.
“Efficiency ratio” is defined as the ratio of Costs and expenses to the sum of Net interest margin and Other income.
“Return on average assets” is defined as the ratio of Net income to Average total assets.
“Return on average equity” is defined as the ratio of Net income to Average total equity.
“Net charge-off ratio” is defined as the ratio of Charge-offs, net of recoveries, to Average finance receivables and loans.
“Delinquency ratio” is defined as the ratio of Delinquent principal over 60 days, end of period to Gross finance receivables and loans, end of period.
“Tangible common equity to total tangible assets ratio” is defined as the ratio of Total equity, excluding Goodwill and intangible assets, to Total assets excluding Goodwill and intangible assets.
“Common stock dividend ratio” is defined as the ratio of Dividends declared per share of common stock during the period to Net income attributable to Santander Consumer USA Inc. shareholders.
Activity-based ratios for the periods ending September 30, 2013 and 2012 are presented on an annualized basis.
40
Table of Contents
MANAGEMENT’S DISCUSSION AND ANALYSIS OF FINANCIAL CONDITION AND RESULTS OF OPERATIONS
The following Management’s Discussion and Analysis of Financial Condition and Results of Operations (“MD&A”), as well as other portions of this prospectus, may contain certain statements that constitute forward-looking statements within the meaning of the federal securities laws. The words “expect,” “anticipate,” “estimate,” “forecast,” “plan,” “project,” “outlook,” “intend,” “evaluate,” “pursue,” “seek,” “may,” “would,” “could,” “should,” “believe,” “potential,” “continue,” or the negatives of any of these words or similar expressions are intended to identify forward-looking statements. All statements herein, other than statements of historical fact, including, without limitation, statements about future events and financial performance, are forward-looking statements that involve certain risks and uncertainties. You should not place undue reliance on any such forward-looking statement and should consider all uncertainties and risks discussed in this prospectus, including those under “Risk Factors.” Forward-looking statements apply only as of the date they are made, and we undertake no obligation to update any forward-looking statement to reflect events or circumstances that arise after the date the forward-looking statement is made.
Background and Overview
We are a full-service, technology-driven consumer finance company focused on vehicle finance and unsecured consumer lending products. We believe that, since our founding in 1995, we have achieved strong brand recognition in the nonprime vehicle finance space. We mainly originate loans indirectly through manufacturer-franchised and selected independent automotive dealers, as well as through relationships with national and regional banks and OEMs. We also directly originate and refinance vehicle loans online. In February 2013, we entered into a ten-year agreement with Chrysler whereby we originate private-label loans and leases under the Chrysler Capital brand. With this agreement, we are now the preferred financing provider for all of Chrysler’s retail consumers, including both prime and nonprime customers. From May 1, 2013, the effective date of the agreement, through September 30, 2013, 30% of our retail installment contract origination volume has been prime, as compared to only 14% in 2012, the last full year prior to our entry into the agreement. In addition, we have several relationships through which we provide unsecured consumer loans, and we have recently expanded into private label credit cards and other consumer finance products. We generate revenues and cash flows through interest and other finance charges on our loans and leases. We also earn servicing fee income on our serviced for others portfolios, which consist of loans that we service but do not own and do not report on our balance sheet.
We have demonstrated significant access to the capital markets by funding our operations through securitization transactions and committed credit lines. We have raised over $26 billion of ABS since 2010, we were the largest issuer of retail auto ABS in 2011, 2012, and 2013. We have significant bank funding relationships, with third-party banks and Santander currently providing approximately $13.7 billion and $4.5 billion, respectively, in committed financing. In addition, we have flow agreements in place with Bank of America and SBNA to fund Chrysler Capital business. We have produced consistent, controlled growth and robust profitability in both growth periods and economic downturns. We have been profitable every year for the past ten years, we delivered an average return on assets of 3.9% from 2009 to 2012 and a return on total common equity of more than 30% in each of those years, and we have continued to deliver similar levels of return on assets and equity as of the end of 2013.
How We Assess Our Business Performance
Net income attributable to our shareholders, and the associated return on equity, are the primary metrics by which we judge the performance of our business. Accordingly, we closely monitor the primary drivers of net income:
| • | Net financing income — We track the spread between the interest and finance charge income earned on our assets and the interest expense incurred on our liabilities, and continually monitor the components of our yield and our cost of funds. In addition, we monitor external rate trends, including the Treasury swap curve and spot and forward rates. |
41
Table of Contents
| • | Net credit losses — Each of our loans and leases is priced using our risk-based proprietary models. The profitability of a loan is directly connected to whether or not the actual net credit losses are consistent with forecasted losses; therefore, we closely analyze credit performance. We perform this analysis at the vintage level for individually acquired retail installment contracts and at the pool level for purchased portfolios, enabling us to pinpoint drivers of any unusual or unexpected trends. We also monitor recovery rates, both industry-wide and our own, because of their contribution to the severity of our charge offs. Additionally, because delinquencies are an early indicator of future net credit losses, we analyze delinquency trends, adjusting for seasonality, to determine whether or not our loans are performing in line with our original estimation. |
| • | Costs and expenses — We assess our operational efficiency using our cost-to-income ratio. We perform extensive analysis to determine whether observed fluctuations in cost and expense levels indicate a trend or are the nonrecurring impact of large projects. Our cost and expense analysis also includes a loan- and portfolio-level review of origination and servicing costs to assist us in assessing profitability by pool and vintage. |
Because volume and portfolio size determine the magnitude of the impact of each of the above factors on our earnings, we also closely monitor new business volume along with annual percentage rate (“APR”) and discounts (including subvention and net of dealer participation).
Recent Developments and Other Factors Affecting Our Results of Operations
Preliminary Unaudited 2013 Results
The following information is estimated in good faith based on our preliminary unaudited financial results as of and for the year ended December 31, 2013, which are derived from preliminary internal financial reports and accordingly are subject to completion of our normal year-end closing procedures and audit by our independent registered public accounting firm. As a result, our preliminary unaudited financial results set forth below may be subject to change and those differences could be material.
| Year Ended December 31, 2013 |
Year Ended December 31, 2012 |
|||||||
| Income Statement Data |
||||||||
| Net interest margin |
$3.4 billion | $2.6 billion | ||||||
| Net income |
$696 million | $735 million | ||||||
| Net income attributable to Santander Consumer USA Inc. shareholders |
$697 million | $715 million | ||||||
| Balance Sheet Data |
||||||||
| Total assets |
$26.7 billion | $18.7 billion | ||||||
| Total equity |
$2.7 billion | $2.2 billion | ||||||
| Ratios (1) |
||||||||
| Net chargeoff ratio |
5.7 | % | 5.5 | % | ||||
| Delinquency ratio |
4.5 | % | 4.6 | % | ||||
| Other Information |
||||||||
| Serviced for others portfolio |
$4.5 billion | $2.5 billion | ||||||
| Originations |
$20.5 billion | $8.6 billion | ||||||
| (1) | “Net charge-off ratio” is defined as the ratio of Charge offs, net of recoveries, to Average gross finance receivables and loans. |
“Delinquency ratio” is defined as the ratio of Delinquent principal over 60 days, end of period to Gross finance receivables and loans, end of period.
42
Table of Contents
Our total assets and originations increased as of and for the year ended December 31, 2013 as compared to December 31, 2012 due to the launch of Chrysler Capital as well as our entry into unsecured lending in 2013. This increase in assets and originations drove the increase in net interest margin, while net income was down from 2012 to 2013 due to the impact of provision for loan losses on the new business.
Equity increased as of December 31, 2013 as compared to December 31, 2012 due to net income for the year ended December 31, 2013 exceeding dividends paid during that period, as we paid a dividend of 100% of our first quarter 2013 net income but no further dividends during the year.
Our serviced for others portfolio increased due to the new servicing contracts entered into in 2013 with SBNA and Bank of America, as well as with the Chrysler Capital securitization trusts.
Chrysler Capital
Effective May 1, 2013, we became the preferred provider for Chrysler’s consumer loans and leases and dealer loans under terms of a ten-year Master Private Label Financing Agreement (“Chrysler Agreement”). Business generated under terms of the Chrysler Agreement is branded as Chrysler Capital. In connection with entering into the Chrysler Agreement, we paid Chrysler a $150 million upfront, nonrefundable fee, which is being amortized over the ten-year term as an adjustment to finance and other interest income. We have also executed an Equity Option Agreement with Chrysler, whereby Chrysler may elect to purchase an equity participation of any percentage in the Chrysler Capital portion of our business at fair market value.
Under the Chrysler Agreement, we have agreed to specific transition milestones related to market penetration rates, approval rates, dedicated staffing, and service-level standards for the initial year following launch. If the transition milestones are not met in the first year, the agreement may terminate and we may lose the ability to operate as Chrysler Capital. Subsequent to the first year, we must continue to meet penetration and approval rate targets and maintain service-level standards or the agreement can be terminated. Our penetration rate targets, which are cumulative rates measured as of the end of each year of the Chrysler Agreement (April 30), for years one through five of the Chrysler Agreement are 31%, 44%, 54%, 64% and 65%, respectively. During the period from the May 1, 2013 launch of the Chrysler Capital business through November 30, 2013, we originated over $6.7 billion of Chrysler Capital retail installment contracts and over $2.0 billion of Chrysler Capital vehicle leases, resulting in a penetration rate of 26.5% as of November 30, 2013, and we expect to meet and exceed our penetration rate target for year one of the agreement. We expect these volumes to continue and that we will achieve the targets in the Chrysler Agreement. The Chrysler Agreement could also be terminated in the event of a change in control of SCUSA, which, as defined in the agreement, would occur if both a single shareholder acquired more than 20% of our outstanding shares of common stock and SHUSA owned fewer shares than that shareholder.
The Chrysler Agreement requires that we maintain $5.0 billion in funding available for certain dealer inventory financing. To meet this requirement, we are party to a flow agreement with SBNA whereby we provide SBNA with the first right to review and assess Chrysler dealer lending opportunities and, if SBNA elects, SBNA provides the proposed financing. We provide servicing on all loans originated under this arrangement.
The Chrysler Agreement also requires that we maintain at least $4.5 billion of retail financing capacity exclusively for our Chrysler Capital business. To meet this requirement, we maintain a credit facility with seven banks providing an aggregate commitment of $4.55 billion of retail funding exclusively for our Chrysler Capital business.
We also have a committed forward flow agreement with Bank of America, pursuant to which we are committed to sell up to $300 million per month of the prime loans that Chrysler Capital originates through May 2018. We retain servicing on all loans sold under this agreement.
43
Table of Contents
In addition, we may periodically provide certain automotive dealers, primarily Chrysler-franchised dealerships, with real estate loans and working capital revolving lines of credit. Generally, a dealer must have a floorplan loan with us in order to be eligible for real estate loans and working capital revolving lines of credit from us.
As of September 30, 2013, substantially all of the dealer floorplan loans originated under Chrysler Capital were held by our affiliate, SBNA, under the terms of either of two agreements, a flow agreement entered into in June 2013 and a sale agreement entered into in August 2013. In November 2013, we entered into an additional sale agreement to sell substantially all of the non-floorplan dealer loans to SBNA.
LendingClub
In March 2013, we entered into and began purchasing receivables under certain agreements with LendingClub, a peer-to-peer unsecured lending technology company. The agreements allow us to purchase up to 25% of LendingClub’s total prime originations through March 2016.
In July 2013, we executed additional agreements with LendingClub whereby we are committed to purchase at least the lesser of $30 million per month or 75% of LendingClub’s near-prime originations through July 2015, and the lesser of $30 million per month or 50% of the lending platform company’s near-prime originations thereafter through July 2017.
LendingClub continues to service the receivables we purchase.
Bluestem
In April 2013, we entered into and began purchasing loans under certain agreements with Bluestem, a retailer that provides unsecured revolving financing to its customers through a relationship with a third party credit issuer. The terms of the agreements include a commitment by us to purchase certain new advances originated by Bluestem, along with existing balances on accounts with new advances, through April 2020. Bluestem continues to service the loans we purchase. We also are required to make a profit-sharing payment to Bluestem each month.
Lending Technology Company
In December 2012, we entered into an agreement with a point-of-sale lending technology company that enables us to review credit applications of certain retail store customers. We began originating unsecured consumer loans under this agreement in October 2013.
LLC Consolidation
Our consolidated financial statements include the results of two limited liability companies, Auto Loan Acquisition 2011-A and Auto Loan Acquisition 2011-B (collectively, the “ALAs”) formed to purchase two retail installment contract portfolios totaling $3.8 billion in the fourth quarter of 2011. Two of the investors in Auto Finance Holdings were the equity investors in the ALAs from the time of their formation until the investors abandoned their interests in the ALAs on August 30, 2013. The ALAs were determined to be variable interest entities (“VIEs”) of which we were the primary beneficiary due to our role as servicer of the portfolios and our potential to absorb losses due to our investment in bonds issued by the ALAs. Accordingly, we included the ALAs in our consolidated financial statements. However, as we had no equity interest in the ALAs prior to the abandonment, the entire comprehensive income and net assets of the ALAs were reported as noncontrolling interests. As a result of the abandonment, we have full ownership of the ALAs and continue to include them in our consolidated financial statements, but no longer report noncontrolling interests related to their activities.
44
Table of Contents
Stock Compensation
Beginning in 2012, we granted stock options to certain executives and other employees under the Santander Consumer USA Inc. 2011 Management Equity Plan (the “Management Equity Plan”). The Management Equity Plan is administered by our board of directors and enables us to make stock awards up to a total of approximately 11 million common shares, or 8.5% of our equity as of December 31, 2011. Stock options granted have an exercise price based on the estimated fair market value of our common stock on the grant date. The stock options expire after ten years and include both time vesting and performance vesting options. Generally, no shares obtained through exercise of stock options may be transferred until the later of December 31, 2016 or our completion of an initial public offering (“IPO”); however, our board of directors has approved the amendment of option award agreements with respect to options previously granted under the Management Equity Plan (the “Amended Options”) and the amendment of the Management Shareholders Agreements effective as of and subject to the occurrence of the offering to remove certain of these transfer restrictions with respect to shares underlying a portion of such outstanding options and provide for additional transfer restrictions with respect to shares underlying another portion of such outstanding options.
The fair value of the stock options is amortized into income over the vesting period as time and performance vesting conditions are met. Until the later of an IPO or December 31, 2016, if an employee leaves, we have the right to repurchase any or all of the stock obtained by the employee through option exercise. If the employee is terminated for cause or voluntarily leaves the Company without good reason, the repurchase price is the lower of the strike price or fair market value at the date of repurchase. If the employee is terminated without cause or voluntarily leaves the Company with good reason, the repurchase price is the fair market value at the date of repurchase. We believe that our repurchase right causes the IPO to constitute an implicit vesting condition and therefore have not recorded any stock compensation expense related to the Management Equity Plan. As of September 30, 2013, there was approximately $144 million of unrecognized compensation cost related to stock options granted but for which the IPO implicit vesting condition had not been met. We expect to recognize approximately $118 million of this expense on a pre-tax basis upon occurrence of an IPO, with the remainder to be recognized over the remaining vesting period.
Beginning in December 2013, we granted restricted shares to certain executives under the Santander Consumer USA Inc. Omnibus Incentive Plan (the “Omnibus Incentive Plan”). The Omnibus Incentive Plan is administered by our board of directors and enables us to grant awards of nonqualified and incentive stock options, stock appreciation rights (“SARs”), restricted stock awards, restricted stock units and other awards that may be settled in or based upon the value of our common stock up to a total of 1,947,362 common shares. The value of restricted shares is based on the estimated fair market value of our common stock on the grant date. The restricted shares vest ratably over five years, subject to continued employment.
The fair value of any instruments issued under the Omnibus Incentive Plan is amortized into income over the vesting period as time and performance vesting conditions are met. Because no instruments had yet been issued under the Omnibus Incentive Plan as of September 30, 2013, no expense was recorded for the period then ended. Total compensation cost related to the restricted shares granted in December 2013 is expected to be approximately $12 million on a pre-tax basis and will be recognized over the five-year vesting period of the shares.
Our Reportable Segment
We have one reportable segment, Vehicle Finance. It includes our vehicle financial products and services, including retail installment contracts, vehicle leases, and dealer loans. We also include in this segment financial products and services related to motorcycles, RVs, and watercraft, as well as our unsecured personal loan and point-of-sale financing operations.
45
Table of Contents
Originations and Acquisitions
Our volume of individually acquired loans and leases, including net balance increases on revolving loans, average “APR” and average discount during the three and nine months ended September 30, 2013 and 2012 have been as follows:
| Three Months Ended | Nine Months Ended | |||||||||||||||
| September 30, 2013 |
September 30, 2012 |
September 30, 2013 |
September 30, 2012 |
|||||||||||||
| (Dollar amounts in thousands) | ||||||||||||||||
| Retail installment contracts |
$ | 5,130,372 | $ | 2,264,824 | $ | 12,539,393 | $ | 6,416,131 | ||||||||
| Average APR (%). |
13.8 | % | 16.8 | % | 15.1 | % | 17.3 | % | ||||||||
| Average Discount (%). |
1.9 | 4.0 | 2.8 | 4.2 | ||||||||||||
| Unsecured consumer loans |
$ | 276,265 | — | $ | 665,166 | — | ||||||||||
| Average APR (%) |
23.5 | % | — | 22.9 | % | — | ||||||||||
| Average Discount (%) |
8.3 | — | 9.0 | — | ||||||||||||
| Receivables from dealers |
$ | 167,487 | $ | 8,080 | $ | 350,231 | $ | 8,080 | ||||||||
| Average APR (%) |
3.3 | % | 3.8 | % | 3.2 | % | 3.8 | % | ||||||||
| Average Discount (%) |
— | — | — | — | ||||||||||||
| Leases |
$ | 928,301 | — | $ | 1,419,605 | — | ||||||||||
We record interest income from individually acquired retail installment contracts, unsecured consumer loans and receivables from dealers in accordance with the terms of the loans, generally discontinuing and reversing accrued income once a loan becomes more than 60 days past due, except in the case of revolving unsecured loans, for which we continue to accrue interest until charge off at 180 days past due. Receivables from dealers and term unsecured consumer loans generally are not acquired at a discount. We amortize discounts, subvention payments from manufacturers, and origination costs as adjustments to income from individually acquired retail installment contracts using the effective yield method. We amortize the discount, if applicable, on revolving unsecured consumer loans straight-line over the estimated period over which the receivables are expected to be outstanding.
For individually acquired retail installment contracts, unsecured consumer loans and receivables from dealers, we also establish a loan loss allowance for the estimated losses inherent in the portfolio. We estimate probable losses based on contractual delinquency status, historical loss experience, expected recovery rates from sale of repossessed collateral, bankruptcy trends, and general economic conditions such as unemployment rates.
We classify our vehicle leases as operating leases. The net capitalized cost of each lease is recorded as an asset, which is depreciated straight-line over the contractual term of the lease to the expected residual value. Lease payments due from customers are recorded as income until and unless a customer becomes more than 60 days delinquent, at which time the accrual of revenue is discontinued and reversed. The accrual is resumed and reinstated if a delinquent account subsequently becomes 60 days or less past due. Subvention payments from the manufacturer, down payments from the customer, and initial direct costs incurred in connection with originating the lease are amortized straight-line over the contractual term of the lease.
Historically, our primary means of acquiring retail installment contracts was through individual acquisitions immediately after origination by a dealer. We also periodically purchase pools of receivables and had significant volumes of these purchases during the credit crisis. While we continue to pursue such opportunities when available, we did not purchase any material pools during the three and nine months ended September 30, 2013 and 2012. All of the retail installment contracts acquired during these periods were acquired individually. For our existing purchased receivables portfolios, which were acquired at a discount partially attributable to credit deterioration since origination, we estimate the expected yield on each portfolio at acquisition and record monthly accretion income based on this expectation. We periodically re-evaluate performance expectations and
46
Table of Contents
may increase the accretion rate if a pool is performing better than expected. If a pool is performing worse than expected, we are required to continue to record accretion income at the previously established rate and to record a loan loss provision to account for the worsening performance.
Results of Operations
This MD&A should be read in conjunction with the consolidated financial statements and the accompanying notes included elsewhere in this prospectus. Santander Consumer USA Holdings Inc. has not engaged in any operations or conducted any activities other than those incidental to its formation and to preparations for the Reorganization and this offering. It will have only nominal assets and no liabilities prior to the consummation of the Reorganization and this offering. Upon closing, its assets will include shares of Santander Consumer USA Inc., which will be its wholly owned subsidiary and operating company, and the cash proceeds of this offering. See “Reorganization.” Accordingly, this prospectus includes and the discussion below is based solely on the historical financial statements of Santander Consumer USA Inc.
47
Table of Contents
The following table presents our results of operations for the three and nine months ended September 30, 2013 and 2012:
| For the Three Months Ended September 30, |
For the Nine Months Ended September 30, |
|||||||||||||||
| 2013 | 2012 | 2013 | 2012 | |||||||||||||
| (Dollar amounts in thousands) | ||||||||||||||||
| Interest and fees on finance receivables and loans |
$ | 1,011,492 | $ | 744,958 | $ | 2,723,774 | $ | 2,153,289 | ||||||||
| Leased vehicle income |
50,099 | — | 60,129 | — | ||||||||||||
| Other finance and interest income |
1,029 | 2,950 | 5,870 | 9,423 | ||||||||||||
|
|
|
|
|
|
|
|
|
|||||||||
| Total finance and other interest income |
1,062,620 | 747,908 | 2,789,773 | 2,162,712 | ||||||||||||
| Interest expense |
120,589 | 98,774 | 291,062 | 293,238 | ||||||||||||
| Leased vehicle expense |
41,485 | — | 48,513 | — | ||||||||||||
|
|
|
|
|
|
|
|
|
|||||||||
| Net interest margin |
900,546 | 649,134 | 2,450,198 | 1,869,474 | ||||||||||||
| Provision for loan losses |
598,201 | 185,875 | 1,223,805 | 660,202 | ||||||||||||
|
|
|
|
|
|
|
|
|
|||||||||
| Net interest margin after provision for loan losses |
302,345 | 463,259 | 1,226,393 | 1,209,272 | ||||||||||||
| Profit sharing |
27,238 | — | 34,802 | — | ||||||||||||
|
|
|
|
|
|
|
|
|
|||||||||
| Net interest margin after provision for loan losses and profit sharing |
275,107 | 463,259 | 1,191,591 | 1,209,272 | ||||||||||||
| Total other income |
78,340 | 74,291 | 208,878 | 238,890 | ||||||||||||
| Total costs and expenses |
176,140 | 183,730 | 496,312 | 464,192 | ||||||||||||
|
|
|
|
|
|
|
|
|
|||||||||
| Income before income taxes |
177,307 | 353,820 | 904,157 | 983,970 | ||||||||||||
| Income tax expense |
65,486 | 141,261 | 322,413 | 372,266 | ||||||||||||
|
|
|
|
|
|
|
|
|
|||||||||
| Net income |
111,821 | 212,559 | 581,744 | 611,704 | ||||||||||||
| Noncontrolling interests |
(576 | ) | (44,092 | ) | 1,821 | (15,858 | ) | |||||||||
|
|
|
|
|
|
|
|
|
|||||||||
| Net income attributable to Santander |
||||||||||||||||
| Consumer USA Inc shareholders |
$ | 111,245 | $ | 168,467 | $ | 583,565 | $ | 595,846 | ||||||||
|
|
|
|
|
|
|
|
|
|||||||||
| Net income |
$ | 111,821 | $ | 212,559 | $ | 581,744 | $ | 611,704 | ||||||||
|
|
|
|
|
|
|
|
|
|||||||||
| Change in unrealized gains (losses) on cash flow hedges, net of tax |
986 | 1,330 | 5,821 | 3,718 | ||||||||||||
| Change in unrealized gains (losses) on investments available for sale, net of tax |
(629 | ) | (569 | ) | (3,252 | ) | (3,273 | ) | ||||||||
|
|
|
|
|
|
|
|
|
|||||||||
| Other comprehensive income, net |
357 | 761 | 2,569 | 445 | ||||||||||||
|
|
|
|
|
|
|
|
|
|||||||||
| Comprehensive income |
112,178 | 213,320 | 584,313 | 612,149 | ||||||||||||
| Comprehensive (income) loss attributable to noncontrolling interests |
(624 | ) | (44,359 | ) | 953 | (17,369 | ) | |||||||||
|
|
|
|
|
|
|
|
|
|||||||||
| Comprehensive income attributable to |
||||||||||||||||
| Santander Consumer USA Inc. shareholders |
$ | 111,554 | $ | 168,961 | $ | 585,266 | $ | 594,780 | ||||||||
|
|
|
|
|
|
|
|
|
|||||||||
48
Table of Contents
Three and Nine Months Ended September 30, 2013 Compared to Three and Nine Months Ended September 30, 2012
Interest and Fees on Finance Receivables and Loans
| Three Months Ended | Nine Months Ended | |||||||||||||||||||||||||||||||
| September 30, | September 30, | Increase (Decrease) | September 30, | September 30, | Increase (Decrease) | |||||||||||||||||||||||||||
| 2013 | 2012 | Amount | Percent | 2013 | 2012 | Amount | Percent | |||||||||||||||||||||||||
| (Dollar amounts in thousands) | (Dollar amounts in thousands) | |||||||||||||||||||||||||||||||
| Income from individually acquired retail installment contracts |
$ | 879,628 | $ | 580,360 | $ | 299,268 | 52 | % | $ | 2,333,857 | $ | 1,600,054 | $ | 733,803 | 46 | % | ||||||||||||||||
| Income from purchased receivables portfolios |
87,237 | 161,753 | (74,516 | ) | (46 | %) | 327,712 | 545,819 | (218,107 | ) | (40 | %) | ||||||||||||||||||||
| Income from receivables from dealers |
2,180 | 2,845 | (665 | ) | (23 | %) | 4,915 | 7,416 | (2,501 | ) | (34 | %) | ||||||||||||||||||||
| Income from unsecured consumer loans |
42,447 | — | 42,447 | 57,290 | — | 57,290 | ||||||||||||||||||||||||||
|
|
|
|
|
|
|
|
|
|
|
|
|
|||||||||||||||||||||
| Total interest and fees on finance receivables and loans |
$ | 1,011,492 | $ | 744,958 | $ | 266,534 | 36 | % | $ | 2,723,774 | $ | 2,153,289 | $ | 570,485 | 26 | % | ||||||||||||||||
|
|
|
|
|
|
|
|
|
|
|
|
|
|||||||||||||||||||||
Income from individually acquired retail installment contracts increased $299 million, or 52%, from the third quarter of 2012 to the third quarter of 2013, and $734 million, or 46%, from the nine months ended September 30, 2012 to the nine months ended September 30, 2013, slightly less than the growth in the average outstanding balance of our portfolio of these contracts by 56% and 49%, respectively, due to the larger proportion of lower-yielding prime assets in our portfolio in 2013.
Income from purchased receivables portfolios decreased $75 million, or 46%, from the third quarter of 2012 to the third quarter of 2013, and $218 million, or 40%, from the nine months ended September 30, 2012 to the nine months ended September 30, 2013, due to the continued runoff of the portfolios, as we have made no significant portfolio acquisitions since 2011. The average balance of the portfolios decreased from $5.7 billion and $6.8 billion, respectively, for the three and nine months ended September 30, 2012, to $2.7 billion and $3.3 billion, respectively, for the three and nine months ended September 30, 2013. The impact of the decrease in portfolio size was partially offset by increased accretion income due to improved performance on certain acquired pools.
Income from receivables from dealers decreased from prior year, despite the origination of Chrysler Capital dealer loans for the first time in 2013, due to the higher proportion in 2013 of collateralized loans, which bear a lower interest rate.
Income from unsecured consumer loans includes interest and fees earned on our unsecured revolving and term consumer loans, all of which were acquired in 2013. It also includes accretion of discount on our unsecured revolving consumer loans.
49
Table of Contents
Leased Vehicle Income and Expense
| Three Months Ended | Nine Months Ended | |||||||||||||||
| September 30, 2013 |
September 30, 2012 |
September 30, 2013 |
September 30, 2012 |
|||||||||||||
| (Dollar amounts in thousands) | ||||||||||||||||
| Leased vehicle income |
$ | 50,099 | $ | — | $ | 60,129 | $ | — | ||||||||
| Leased vehicle expense |
41,485 | — | 48,513 | — | ||||||||||||
|
|
|
|
|
|
|
|
|
|||||||||
| $ | 8,614 | $ | — | $ | 11,616 | $ | — | |||||||||
|
|
|
|
|
|
|
|
|
|||||||||
The Company began originating vehicle leases in 2013 due to the Chrysler Capital agreement. Leased vehicle revenue includes customer payments and the accretion of manufacturer incentive payments and discounts, net of amortization of initial direct costs incurred in connection with origination of the leases and amortization of dealer participation. Leased vehicle expense includes depreciation of the leased vehicle and gains and losses on sale of vehicle upon lease termination.
Interest Expense
| Three Months Ended | Nine Months Ended | |||||||||||||||||||||||||||||||
| September 30, | September 30, | Increase (Decrease) | September 30, | September 30, | Increase (Decrease) | |||||||||||||||||||||||||||
| 2013 | 2012 | Amount | Percent | 2013 | 2012 | Amount | Percent | |||||||||||||||||||||||||
| (Dollar amounts in thousands) | (Dollar amounts in thousands) | |||||||||||||||||||||||||||||||
| Interest expense on notes payable |
$ | 104,156 | $ | 83,172 | $ | 20,984 | 25 | % | $ | 268,466 | $ | 236,225 | $ | 32,241 | 14 | % | ||||||||||||||||
| Interest expense on derivatives |
16,433 | 15,759 | 674 | 4 | % | 22,596 | 56,002 | (33,406 | ) | (60 | %) | |||||||||||||||||||||
| Other interest expense |
— | (157 | ) | 157 | (100 | %) | — | 1,011 | (1,011 | ) | (100 | %) | ||||||||||||||||||||
|
|
|
|
|
|
|
|
|
|
|
|
|
|||||||||||||||||||||
| Total interest expense |
$ | 120,589 | $ | 98,774 | $ | 21,815 | 22 | % | $ | 291,062 | $ | 293,238 | $ | (2,176 | ) | (1 | %) | |||||||||||||||
|
|
|
|
|
|
|
|
|
|
|
|
|
|||||||||||||||||||||
Interest expense on notes payable increased $21 million, or 25%, from the third quarter of 2012 to the third quarter of 2013, and $32 million, or 14%, from the nine months ended September 30, 2012 to the nine months ended September 30, 2013, less than the growth in average debt outstanding of 36% and 20%, due to the more favorable interest rates on our most recent secured structured financings.
Interest expense on derivatives decreased $33 million, or 60%, from the nine months ended September 30, 2012 to the nine months ended September 30, 2013, primarily due to the $16 million positive impact of mark-to-market adjustments on trading derivatives in the 2013 year-to-date period as compared to the $1 million negative impact in the 2012 year-to-date period, as interest rates moved more favorably on our positions. We also incurred approximately $16 million less interest expense on our derivatives, despite an increasing notional balance outstanding, due to the more favorable interest rate environment.
50
Table of Contents
Provision for Loan Losses
| Three Months Ended | Nine Months Ended | |||||||||||||||||||||||||||||||
| September 30, | September 30, | Increase (Decrease) | September 30, | September 30, | Increase (Decrease) | |||||||||||||||||||||||||||
| 2013 | 2012 | Amount | Percent | 2013 | 2012 | Amount | Percent | |||||||||||||||||||||||||
| (Dollar amounts in thousands) | (Dollar amounts in thousands) | |||||||||||||||||||||||||||||||
| Provision for loan losses on individually acquired retail installment contracts |
$ | 447,565 | $ | 243,698 | $ | 203,867 | 84 | % | $ | 1,074,487 | $ | 683,000 | $ | 391,487 | 57 | % | ||||||||||||||||
| Incremental increase (decrease) in allowance related to purchased receivable portfolios |
93,718 | (57,823 | ) | 151,541 | (262 | %) | 51,654 | (22,798 | ) | 74,452 | (327 | %) | ||||||||||||||||||||
| Provision for loan losses on receivables from dealers |
103 | — | 103 | 1,593 | — | 1,593 | ||||||||||||||||||||||||||
| Provision for loan losses on unsecured consumer loans |
56,815 | — | 56,815 | 96,071 | — | 96,071 | ||||||||||||||||||||||||||
|
|
|
|
|
|
|
|
|
|
|
|
|
|||||||||||||||||||||
| Provision for loan losses |
$ | 598,201 | $ | 185,875 | $ | 412,326 | 222 | % | $ | 1,223,805 | $ | 660,202 | $ | 563,603 | 85 | % | ||||||||||||||||
|
|
|
|
|
|
|
|
|
|
|
|
|
|||||||||||||||||||||
Provision for loan losses on our individually acquired retail installment contracts increased $204 million, or 84%, from the third quarter of 2012 to the third quarter of 2013, driven by faster portfolio growth. Provision for loan losses on our individually acquired retail installment contracts increased $391 million, or 57%, from the nine months ended September 30, 2012 to the nine months ended September 30, 2013, driven by faster portfolio growth. Our portfolio of individually acquired retail installment contracts grew by 14% and 47% for the three and nine months ended September 30, 2013, respectively, up from 9% and 32% for the three and nine months ended September 30, 2012, respectively, due to the higher current year origination volume, primarily driven by Chrysler Capital business. Our net charge off rate increased from prior year due to increased competition having made it more difficult for lenders, including us, to price for incremental risk.
The allowance on purchased receivables changed from a credit for the three and nine months ended September 30, 2012, to an expense for the three and nine months ended September 30, 2013, due to worsening performance in the current year as compared to overall improving performance in 2012.
We began recording provision on other loans and receivables in 2013 due to our entry into the Chrysler dealer loan business and the unsecured lending business.
Profit Sharing
| Three Months Ended | Nine Months Ended | |||||||||||||||
| September 30, 2013 |
September 30, 2012 |
September 30, 2013 |
September 30, 2012 |
|||||||||||||
| (Dollar amounts in thousands) | ||||||||||||||||
| Profit sharing |
$ | 27,238 | $ | — | $ | 34,802 | $ | — | ||||||||
Profit sharing includes revenue sharing payments due to Chrysler Group based on a portion of net interest income on consumer loans and leased vehicle income originated under the Chrysler Capital business since May 1, 2013. Payments are accrued as incurred and paid quarterly in arrears, beginning in July 2013. Profit sharing also includes profit sharing payments due to the originator and servicer of the Company’s unsecured revolving loan portfolio. Payments are accrued as incurred and paid monthly in arrears, beginning in June 2013.
51
Table of Contents
Other Income
| Three Months Ended | Nine Months Ended | |||||||||||||||||||||||||||||||
| September 30, 2013 |
September 30, 2012 |
Increase (Decrease) | September 30, 2013 |
September 30, 2012 |
Increase (Decrease) | |||||||||||||||||||||||||||
| Amount | Percent | Amount | Percent | |||||||||||||||||||||||||||||
| (Dollar amounts in thousands) | (Dollar amounts in thousands) | |||||||||||||||||||||||||||||||
| Gain on sale of loans |
$ | 7,678 | $ | — | $ | 7,678 | $ | 8,950 | $ | — | $ | 8,950 | ||||||||||||||||||||
| Servicing fee income |
7,384 | 7,979 | (595 | ) | (7 | %) | 21,010 | 26,843 | (5,833 | ) | (22 | %) | ||||||||||||||||||||
| Fees, commissions and other |
63,278 | 66,312 | (3,034 | ) | (5 | %) | 178,918 | 212,047 | (33,129 | ) | (16 | %) | ||||||||||||||||||||
|
|
|
|
|
|
|
|
|
|
|
|
|
|||||||||||||||||||||
| Total other income |
$ | 78,340 | $ | 74,291 | $ | 4,049 | 5 | % | $ | 208,878 | $ | 238,890 | $ | (30,012 | ) | (13 | %) | |||||||||||||||
|
|
|
|
|
|
|
|
|
|
|
|
|
|||||||||||||||||||||
| Average serviced for others portfolio |
$ | 2,576,706 | $ | 2,814,864 | ($ | 238,158 | ) | (8 | %) | $ | 2,616,868 | $ | 3,102,469 | $ | (485,601 | ) | (16 | %) | ||||||||||||||
|
|
|
|
|
|
|
|
|
|
|
|
|
|||||||||||||||||||||
Gain on sale of loans is primarily comprised of the gains on sales of loans to Bank of America under terms of a forward flow agreement. The Company sold $739 million and $897 million, respectively, of loans to Bank of America for the three and nine months ended September 30, 2013. Gain on sale of loans also includes an approximately $1 million gain on the non-recurring sale of approximately $205 million in dealer floorplan loans to SBNA in August 2013.
We record servicing fee income on loans that we service but do not own and do not report on our balance sheet. Servicing fee income for the three and nine months ended September 30, 2013 decreased 7% and 22%, respectively, as compared to the corresponding prior year periods, consistent with the decline in our average third-party serviced portfolio. Our serviced for others portfolios continued to run off as we entered into no new servicing contracts during 2012 and the new servicing contracts entered into in 2013 with Bank of America and SBNA did not begin to have volume until June and August, respectively.
Fees, commissions, and other decreased $3 million, or 5%, from the third quarter of 2012 to the third quarter of 2013, and $33 million, or 16%, from the nine months ended September 30, 2012 to the nine months ended September 30, 2013, despite the increase in total owned and serviced portfolio size. The decreases were driven by a decline in deficiency income (proceeds on loans that were charged off prior to our acquiring them) from $25 million and $83 million for the three and nine months ended September 30, 2012 to $7 million and $37 million for the three and nine months ended September 30, 2013.
Costs and Expenses
| Three Months Ended | Nine Months Ended | |||||||||||||||||||||||||||||||
| September 30, 2013 |
September 30, 2012 |
Increase (Decrease) | September 30, 2013 |
September 30, 2012 |
Increase (Decrease) | |||||||||||||||||||||||||||
| Amount | Percent | Amount | Percent | |||||||||||||||||||||||||||||
| (Dollar amounts in thousands) | (Dollar amounts in thousands) | |||||||||||||||||||||||||||||||
| Salary and benefits expense |
$ | 79,293 | $ | 55,402 | $ | 23,891 | 43 | % | $ | 217,172 | $ | 164,701 | $ | 52,471 | 32 | % | ||||||||||||||||
| Servicing and repossession expense |
36,091 | 27,956 | 8,135 | 29 | % | 103,231 | 101,329 | 1,902 | 2 | % | ||||||||||||||||||||||
| Other operating costs |
60,756 | 100,372 | (39,616 | ) | (39 | %) | 175,909 | 198,162 | (22,253 | ) | (11 | %) | ||||||||||||||||||||
|
|
|
|
|
|
|
|
|
|
|
|
|
|||||||||||||||||||||
| Total costs and expenses |
$ | 176,140 | $ | 183,730 | $ | (7,590 | ) | (4 | %) | $ | 496,312 | $ | 464,192 | $ | 32,120 | 7 | % | |||||||||||||||
|
|
|
|
|
|
|
|
|
|
|
|
|
|||||||||||||||||||||
Total costs and expenses declined slightly from the third quarter of 2012 to the third quarter of 2013, and increased 7% from the nine months ended September 30, 2012 to the nine months ended September 30, 2013, as
52
Table of Contents
the increases in headcount and incentive compensation and servicing and repossession expense driven by growth in our portfolio were offset by the impact of nonrecurring indemnification payments to two of the investors in Auto Finance Holdings in relation to tax payments resulting from their investments in the ALAs. Indemnification expense, all of which was recorded in the third quarter of 2012 and was based on actual and expected payments, totaled $49 million, substantially all of which was subsequently reversed in the fourth quarter of 2012 upon the investors’ declaration of worthlessness of their investments in the ALAs. Even excluding the impact of this nonrecurring item, our efficiency ratio improved from prior year as revenues from the new lines of business exceeded the increase in costs.
Income Tax Expense
| Three Months Ended | Nine Months Ended | |||||||||||||||||||||||||||||||
| September 30, 2013 |
September 30, 2012 |
Increase (Decrease) | September 30, 2013 |
September 30, 2012 |
Increase (Decrease) | |||||||||||||||||||||||||||
| Amount | Percent | Amount | Percent | |||||||||||||||||||||||||||||
| (Dollar amounts in thousands) | (Dollar amounts in thousands) | |||||||||||||||||||||||||||||||
| Income tax expense |
$ | 65,486 | $ | 141,261 | $ | (75,775 | ) | (54 | %) | $ | 322,413 | $ | 372,266 | $ | (49,853 | ) | (13 | %) | ||||||||||||||
| Income before income taxes |
177,307 | 353,820 | (176,513 | ) | (50 | %) | 904,157 | 983,970 | (79,813 | ) | (8 | %) | ||||||||||||||||||||
| Effective tax rate |
36.9 | % | 39.9 | % | 35.7 | % | 37.8 | % | ||||||||||||||||||||||||
Our effective tax rate decreased from 39.9% and 37.8% for the three and nine months ended September 30, 2012 to 36.9% and 35.7% for the three and nine months ended September 30, 2013, primarily due to partial releases in 2013 of a valuation allowance established in 2012 for capital loss carryforwards for which we did not have a plan to recognize offsetting capital gains, enabling recognition of the losses before their expiration in 2017. Deficiency balance sales in 2013 resulted in the realization for tax purposes of capital gains that partially offset the capital losses carried forward from the prior year.
Other Comprehensive Income (Loss)
| Three Months Ended | Nine Months Ended | |||||||||||||||||||||||||||||||
| September 30, 2013 |
September 30, 2012 |
Increase (Decrease) | September 30, 2013 |
September 30, 2012 |
Increase (Decrease) | |||||||||||||||||||||||||||
| Amount | Percent | Amount | Percent | |||||||||||||||||||||||||||||
| (Dollar amounts in thousands) | (Dollar amounts in thousands) | |||||||||||||||||||||||||||||||
| Change in unrealized gains (losses) on cash flow hedges, net of tax |
$ | 986 | $ | 1,330 | $ | (344 | ) | (26 | %) | $ | 5,821 | $ | 3,718 | $ | 2,103 | 57 | % | |||||||||||||||
| Change in unrealized gains (losses) on investments available for sale, net of tax |
(629 | ) | (569 | ) | (60 | ) | 11 | % | (3,252 | ) | (3,273 | ) | 21 | (1 | %) | |||||||||||||||||
|
|
|
|
|
|
|
|
|
|
|
|
|
|||||||||||||||||||||
| Other comprehensive income (loss), net |
357 | $ | 761 | $ | (404 | ) | (53 | %) | $ | 2,569 | $ | 445 | $ | 2,124 | 477 | % | ||||||||||||||||
|
|
|
|
|
|
|
|
|
|
|
|
|
|||||||||||||||||||||
The positive changes in unrealized gain (loss) on cash flow hedges for the three and nine months ended September 30, 2013 and 2012 were driven by the maturity of hedges and the resulting recognition in income of losses previously accumulated in other comprehensive income (loss).
53
Table of Contents
Year Ended December 31, 2012 Compared to Year Ended December 31, 2011
Finance and Other Interest Income
| Year Ended | Increase (Decrease) | |||||||||||||||
| December 31, 2012 |
December 31, 2011 |
Amount | Percent | |||||||||||||
| (Dollar amounts in thousands) | ||||||||||||||||
| Income from individually acquired retail installment contracts |
$ | 2,223,833 | $ | 1,695,538 | $ | 528,295 | 31 | % | ||||||||
| Income from purchased receivables portfolios |
704,770 | 870,257 | (165,487 | ) | (19 | %) | ||||||||||
| Other financing income |
19,899 | 28,718 | (8,819 | ) | (31 | %) | ||||||||||
|
|
|
|
|
|
|
|||||||||||
| Total finance and other interest income |
$ | 2,948,502 | $ | 2,594,513 | $ | 353,989 | 14 | % | ||||||||
|
|
|
|
|
|
|
|||||||||||
Income from individually acquired retail installment contracts increased by $528 million, or 31%, driven by the 37% increase in the average outstanding balance of our portfolio of individually acquired loans (from $8.8 billion in 2011 to $12.1 billion in 2012). This increase was in turn driven by strong origination volume, as originations increased from $5.7 billion in 2011 to $8.6 billion in 2012.
Income from purchased receivables portfolios decreased $165 million, or 19%, as a result of the 13% decrease in the average outstanding balance of our purchased receivables portfolios, from $7.3 billion in 2011 to $6.3 billion in 2012. This decrease was driven by the runoff of the purchased pools, most of which were purchased prior to 2011, with the exception of two pools totaling $3.8 billion that were previously serviced for a third party but were consolidated beginning in December 2011.
Other financing income includes income from receivables from dealers and interest on our available-for-sale investments. We had no unsecured consumer loans in 2012 or 2011.
Interest Expense
| Year Ended | Increase (Decrease) | |||||||||||||||
| December 31, 2012 |
December 31, 2011 |
Amount | Percent | |||||||||||||
| (Dollar amounts in thousands) | ||||||||||||||||
| Interest expense on notes payable |
$ | 311,132 | $ | 289,513 | $ | 21,619 | 7 | % | ||||||||
| Interest expense on derivatives |
61,644 | 122,257 | (60,613 | ) | (50 | %) | ||||||||||
| Other interest expense |
1,251 | 6,756 | (5,505 | ) | (81 | %) | ||||||||||
|
|
|
|
|
|
|
|||||||||||
| Total interest expense |
$ | 374,027 | $ | 418,526 | $ | (44,499 | ) | (11 | %) | |||||||
|
|
|
|
|
|
|
|||||||||||
Interest expense on notes payable increased 7.5%, due to the 7.7% increase in average debt outstanding.
Interest expense on derivatives decreased $60.6 million, primarily due to the $8.3 million positive impact of mark-to-market adjustments on trading derivatives in 2012 versus the $37.0 million negative impact of mark-to-market adjustments on these derivatives in 2011, as interest rates moved more favorably on our positions in 2012 versus 2011. We also incurred approximately $15.3 million less interest expense on our derivatives in 2012, despite maintaining a consistent notional balance outstanding, due to the more favorable interest rate environment.
54
Table of Contents
Provision for Loan Losses
| Year Ended | Increase (Decrease) | |||||||||||||||
| December 31, 2012 |
December 31, 2011 |
Amount | Percent | |||||||||||||
| (Dollar amounts in thousands) | ||||||||||||||||
| Provision for loan losses on individually acquired retail installment contracts |
$ | 1,119,074 | $ | 741,559 | $ | 377,515 | 51 | % | ||||||||
| Incremental increase in allowance related to purchased receivables portfolios |
3,378 | 77,662 | (74,284 | ) | (96 | %) | ||||||||||
|
|
|
|
|
|
|
|||||||||||
| Provision for loan losses on retail installment contracts |
$ | 1,122,452 | $ | 819,221 | $ | 303,231 | 37 | % | ||||||||
|
|
|
|
|
|
|
|||||||||||
Total provision for loan losses on our individually acquired loans increased $378 million, or 51%, primarily as a result of the 37% increase in the average balance of our organic loan portfolio. We also increased loan loss reserve coverage from 9.9% at December 31, 2011 to 11.0% at December 31, 2012 as we observed an increase in the average time period between the first sign of events that may result in delinquency and actual charge off.
The allowance on purchased receivables increased $3.4 million in 2012 as compared to $77.7 million in 2011 due to the run off of the portfolios and overall less deterioration in performance.
We did not record a provision for loan losses on receivables from dealers in 2012 or 2011 due to the immateriality of projected losses. We had no unsecured consumer loans in 2012 or 2011.
Other Income
| Year Ended | Increase (Decrease) | |||||||||||||||
| December 31, 2012 |
December 31, 2011 |
Amount | Percent | |||||||||||||
| (Dollar amounts in thousands) | ||||||||||||||||
| Servicing fee income |
$ | 34,135 | $ | 251,394 | $ | (217,259 | ) | (86 | %) | |||||||
| Fees, commissions, and other |
261,554 | 201,135 | 60,419 | 30 | % | |||||||||||
|
|
|
|
|
|
|
|||||||||||
| Total other income |
$ | 295,689 | $ | 452,529 | $ | (156,840 | ) | (35 | %) | |||||||
|
|
|
|
|
|
|
|||||||||||
| Average serviced for others portfolio |
$ | 2,973,711 | $ | 7,833,390 | $ | (4,859,679 | ) | (62 | %) | |||||||
|
|
|
|
|
|
|
|||||||||||
Servicing fee income decreased $217 million, or 86%, as compared to prior year, primarily reflecting the 62% decline in our average third-party serviced portfolio. In December 2011, the results of two LLCs formed to purchase two retail installment contract portfolios totaling $3.8 billion previously serviced by us under a third-party agreement were consolidated in our financial statements. As a result, we now earn finance and other income from this portfolio instead of servicing fee income. This portfolio had a higher average servicing fee than the remaining serviced portfolios due to servicer incentive payments earned, resulting in a larger percentage decline in servicing fee income than in average assets serviced. We remain the servicer of the portfolio but do not report the servicing fee as income as it is eliminated against servicing fee expense in consolidation. Serviced portfolios continue to run off and we entered into no new servicing contracts.
Fees, commissions, and other increased $60.4 million, or 30%, primarily attributable to higher customer fees on our owned portfolio, as well as a $15.0 million increase in income from purchased deficiencies.
55
Table of Contents
Costs and Expenses
| Year Ended | Increase (Decrease) | |||||||||||||||
| December 31, 2012 |
December 31, 2011 |
Amount | Percent | |||||||||||||
| (Dollar amounts in thousands) | ||||||||||||||||
| Salary and benefits expense |
$ | 225,159 | $ | 213,688 | $ | 11,471 | 5 | % | ||||||||
| Servicing and repossession expense |
136,554 | 155,857 | (19,303 | ) | (12 | %) | ||||||||||
| Other operating expenses |
197,450 | 187,538 | 9,912 | 5 | % | |||||||||||
|
|
|
|
|
|
|
|||||||||||
| Total costs and expenses |
$ | 559,163 | $ | 557,083 | $ | 2,080 | 0 | % | ||||||||
|
|
|
|
|
|
|
|||||||||||
Total costs and expenses remained flat to prior year, totaling $559 million in 2012 compared to $557 million in 2011. Salary and benefits expense growth reflects an increase in headcount and incentive compensation year-over-year to support our originations growth. Servicing and repossession expenses decreased due to lower repossession costs during 2012. Other operating expenses increased, reflecting additional investment in IT infrastructure. Our efficiency ratio decreased from 21.2% in 2011 to 19.5% in 2012, primarily due to the lower servicing expenses in 2012 as our cost structure permits us to increase our serviced portfolio without a directly corresponding increase in cost.
Income Tax Expense
| Year Ended | Increase (Decrease) | |||||||||||||||
| December 31, 2012 |
December 31, 2011 |
Amount | Percent | |||||||||||||
| (Dollar amounts in thousands) | ||||||||||||||||
| Income tax expense |
$ | 453,615 | $ | 464,034 | $ | (10,419 | ) | (2 | %) | |||||||
| Income before income taxes |
1,188,549 | 1,252,212 | (63,663 | ) | (5 | %) | ||||||||||
| Effective tax rate |
38.2 | % | 37.1 | % | ||||||||||||
Our effective tax rate increased from 37.1% for the year ended December 31, 2011 to 38.2% for the year ended December 31, 2012, primarily driven by a $22.4 million valuation allowance established in 2012 for capital loss carryforwards for which we did not have a plan to recognize offsetting capital gains enabling recognition of the losses before their expiration in 2017.
Other Comprehensive Income
| Year Ended | Increase (Decrease) | |||||||||||||||
| December 31, 2012 |
December 31, 2011 |
Amount | Percent | |||||||||||||
| (Dollar amounts in thousands) | ||||||||||||||||
| Change in unrealized gains (losses) on cash flow hedges, net of tax |
$ | 7,271 | $ | (5,677 | ) | $ | 12,948 | (228 | %) | |||||||
| Change in unrealized gains (losses) on investments available for sale, net of tax |
(4,939 | ) | (6,340 | ) | 1,401 | (22 | %) | |||||||||
|
|
|
|
|
|
|
|||||||||||
| Other comprehensive income (loss), net |
$ | 2,332 | $ | (12,017 | ) | $ | 14,349 | (119 | %) | |||||||
|
|
|
|
|
|
|
|||||||||||
Unrealized gains (losses) on cash flow hedges are affected by interest rate movements. The positive change in unrealized gains (losses) on cash flow hedges in 2012 as compared to the negative change in 2011 was driven by more favorable interest rate movements on our cash flow hedges, consistent with the trend in mark-to-market impact we experienced on our trading hedges as described in “— Interest Expense.”
56
Table of Contents
The negative change in unrealized gains (losses) on investments available for sale in 2012 and 2011 represents the decline in gross unrealized gains on our investments in securitization bonds issued by an automobile retail company as the bonds are amortized. Additionally, the market price at December 31, 2012 was lower than the price at December 31, 2011. The bonds maintained a market price above par value throughout 2012 and 2011.
Year Ended December 31, 2011 Compared to Year Ended December 31, 2010
Finance and Other Interest Income
| Year Ended | Increase (Decrease) | |||||||||||||||
| December 31, 2011 |
December 31, 2010 |
Amount | Percent | |||||||||||||
| (Dollar amounts in thousands) | ||||||||||||||||
| Income from individually acquired retail installment contracts |
$ | 1,695,538 | $ | 1,308,728 | $ | 386,810 | 30 | % | ||||||||
| Income from purchased receivables portfolios |
870,257 | 734,634 | 135,623 | 18 | % | |||||||||||
| Other financing income |
28,718 | 33,216 | (4,498 | ) | (14 | %) | ||||||||||
|
|
|
|
|
|
|
|||||||||||
| Total finance and other interest income |
$ | 2,594,513 | $ | 2,076,578 | $ | 517,935 | 25 | % | ||||||||
|
|
|
|
|
|
|
|||||||||||
Income from individually acquired retail installment contracts increased $387 million, or 30%, driven by the 33% increase in the average outstanding balance of our portfolio of individually acquired loans (from $6.6 billion in 2010 to $8.8 billion in 2011).
Income from purchased receivables portfolios increased $136 million, or 19%, driven by an increase in average earning assets due to our several large portfolio purchases in the second half of 2010. The average balance of purchased receivables for the years ended 2011 and 2010 was $7.3 billion and $5.0 billion, respectively. Portfolios purchased during 2010 reflect a full year of income in 2011 as compared to a partial year in 2010. In addition, during the fourth quarter of 2011, we consolidated two pools totaling $3.8 billion that previously had been serviced for a third party.
Other financing income includes income from receivables from dealers and interest on our available-for-sale investments. We had no unsecured consumer loans in 2011 or 2010.
Interest Expense
| Year Ended | Increase (Decrease) | |||||||||||||||
| December 31, 2011 |
December 31, 2010 |
Amount | Percent | |||||||||||||
| (Dollar amounts in thousands) | ||||||||||||||||
| Interest expense on notes payable |
$ | 289,513 | $ | 208,166 | $ | 81,347 | 39 | % | ||||||||
| Interest expense on derivatives |
122,257 | 98,295 | 23,962 | 24 | % | |||||||||||
| Other interest expense |
6,756 | 10,025 | (3,269 | ) | (33 | %) | ||||||||||
|
|
|
|
|
|
|
|||||||||||
| Total interest expense |
$ | 418,526 | $ | 316,486 | $ | 102,040 | 32 | % | ||||||||
|
|
|
|
|
|
|
|||||||||||
Interest expense on notes payable increased 39% due to the 36% increase in average debt outstanding.
Interest expense on derivatives increased $24.0 million, primarily due to the disqualification of certain of our interest rate swap agreements from hedge accounting effective in 2011, in addition to our entry during 2011 into new hedges for which we did not apply hedge accounting and which declined in value during the year, resulting in negative mark-to-market adjustments recorded through earnings.
57
Table of Contents
Provision for Loan Losses
| Year Ended | Increase (Decrease) | |||||||||||||||
| December 31, 2011 |
December 31, 2010 |
Amount | Percent | |||||||||||||
| (Dollar amounts in thousands) | ||||||||||||||||
| Provision for loan losses on individually acquired retail installment contracts |
$ | 741,559 | $ | 750,625 | $ | (9,066 | ) | (1 | %) | |||||||
| Incremental increase in allowance related to purchased receivables portfolios |
77,662 | 137,600 | (59,938 | ) | (44 | %) | ||||||||||
|
|
|
|
|
|
|
|||||||||||
| Provision for loan losses on retail installment contracts |
$ | 819,221 | $ | 888,225 | $ | (69,004 | ) | (8 | %) | |||||||
|
|
|
|
|
|
|
|||||||||||
Total provision for loan losses decreased from 2010 to 2011, primarily due to a lower provision related to purchased receivables portfolios. The higher impairment charges in 2010 were due to the actual and expected performance of certain portfolios worsening more in 2010 than in 2011.
We did not record a provision for loan losses on receivables from dealers in 2011 or 2010 due to the immateriality of projected losses. We had no unsecured consumer loans in 2011 and 2010.
Other Income
| Year Ended | Increase (Decrease) | |||||||||||||||
| December 31, 2011 |
December 31, 2010 |
Amount | Percent | |||||||||||||
| (Dollar amounts in thousands) | ||||||||||||||||
| Servicing fee income |
$ | 251,394 | $ | 173,882 | $ | 77,512 | 45 | % | ||||||||
| Fees, commissions, and other |
201,135 | 75,146 | 125,989 | 168 | % | |||||||||||
|
|
|
|
|
|
|
|||||||||||
| Total other income |
$ | 452,529 | $ | 249,028 | $ | 203,501 | 82 | % | ||||||||
|
|
|
|
|
|
|
|||||||||||
| Average serviced for others portfolio |
$ | 7,833,390 | $ | 6,480,801 | $ | 1,352,589 | 21 | % | ||||||||
|
|
|
|
|
|
|
|||||||||||
Servicing fee income increased $77.5 million, or 45%, as compared to prior year, driven by the 21% increase in our average third-party serviced portfolio and the recording in 2011 of a full year of income from two large serviced portfolios that we began servicing in September 2010 and that had higher average servicing fees than our other serviced portfolios as a result of servicer incentive payments earned. In December 2011, two LLCs formed to purchase these portfolios were consolidated into our financial statements.
Fees, commissions, and other increased $126 million, including a $79 million increase in income from purchased deficiency balances as the result of our purchase of several large deficiency portfolios and a $53 million increase in customer fees related to the 39% increase in average loan portfolio balance.
Costs and Expenses
| Year Ended | Increase (Decrease) | |||||||||||||||
| December 31, 2011 |
December 31, 2010 |
Amount | Percent | |||||||||||||
| (Dollar amounts in thousands) | ||||||||||||||||
| Salary and benefits expense |
$ | 213,688 | $ | 151,528 | $ | 62,160 | 41 | % | ||||||||
| Servicing and repossession expense |
155,857 | 98,275 | 57,582 | 59 | % | |||||||||||
| Other operating expenses |
187,538 | 155,037 | 32,501 | 21 | % | |||||||||||
|
|
|
|
|
|
|
|||||||||||
| Total costs and expenses |
$ | 557,083 | $ | 404,840 | $ | 152,243 | 38 | % | ||||||||
|
|
|
|
|
|
|
|||||||||||
58
Table of Contents
Total costs and expenses increased $152 million year-over-year. Salary and benefits expense reflects an increase in headcount and overtime expenses related to two major purchased receivables portfolio acquisitions. Servicing and repossession expenses increased due to greater owned assets driven by the purchased portfolio acquisitions as well as organic growth. Other operating expenses increased, reflecting additional investment in IT infrastructure and overall cost increases to support the growth of the portfolio. These combined factors drove an increase in our efficiency ratio from 20.2% in 2010 to 21.2% in 2011.
Income Tax Expense
| Year Ended | Increase (Decrease) | |||||||||||||||
| December 31, 2011 |
December 31, 2010 |
Amount | Percent | |||||||||||||
| (Dollar amounts in thousands) | ||||||||||||||||
| Income tax expense |
$ | 464,034 | $ | 277,944 | $ | 186,090 | 67 | % | ||||||||
| Income before income taxes |
1,252,212 | 716,055 | 536,157 | 75 | % | |||||||||||
| Effective tax rate |
37.1 | % | 38.8 | % | ||||||||||||
Income tax expense increased $186.1 million as a result of increased income in 2012. Our effective tax rate decreased from 38.8% in 2010 to 37.1% in 2011, primarily due to higher expense related to reserves for unrecognized tax benefits in 2010.
Other Comprehensive Income
| Year Ended | Increase (Decrease) | |||||||||||||||
| December 31, 2011 |
December 31, 2010 |
Amount | Percent | |||||||||||||
| (Dollar amounts in thousands) | ||||||||||||||||
| Change in unrealized gains (losses) on cash flow hedges, net of tax |
$ | (5,677 | ) | $ | 7,958 | $ | (13,635 | ) | (171 | %) | ||||||
| Change in unrealized gains (losses) on investments available for sale, net of tax |
(6,340 | ) | 4,233 | (10,573 | ) | (250 | %) | |||||||||
|
|
|
|
|
|
|
|||||||||||
| Other comprehensive income (loss), net |
$ | (12,017 | ) | $ | 12,191 | $ | (24,208 | ) | (199 | %) | ||||||
|
|
|
|
|
|
|
|||||||||||
The negative change in unrealized gains (losses) on cash flow hedges in 2011 as compared to the positive change in 2010 was due to unfavorable interest rate movements on our cash flow hedges, consistent with the negative mark-to-market impact we experienced on our trading hedges as described in “— Interest Expense.” The negative change in unrealized gains (losses) on investments available for sale was due to the amortization of bonds issued by an automobile retail company in 2011 as compared to a positive change in 2010, despite the amortization, due to interest rate movements. The bonds maintained a market price above par value throughout 2011 and 2010.
Credit Quality
Loans and Other Finance Receivables
Nonprime loans decreased from 86% of our held for investment retail installment contract portfolio as of December 31, 2012 to 83% of our portfolio as of September 30, 2013. We record an allowance for loan losses to cover expected losses on our individually acquired retail installment contracts and other loans and receivables. For retail installment contracts we acquired in pools subsequent to their origination, we anticipate the expected
59
Table of Contents
credit losses at purchase and record income thereafter based on the expected effective yield, recording a provision for loan losses only if performance is worse than expected at purchase.
| September 30, 2013 | ||||||||||||||||||||
| Retail Installment Contracts Held for Investment | ||||||||||||||||||||
| Loans Acquired Individually |
Purchased Receivable Portfolios |
Total | Receivables from Dealers |
Unsecured Consumer Loans |
||||||||||||||||
| (Dollar amounts in thousands) | ||||||||||||||||||||
| Unpaid principal balance |
$ | 20,897,405 | $ | 2,409,538 | $ | 23,306,943 | $ | 178,518 | $ | 715,602 | ||||||||||
| Loan loss allowance |
(1,987,950 | ) | (270,294 | ) | (2,258,244 | ) | (1,593 | ) | (95,250 | ) | ||||||||||
| Discount |
(527,254 | ) | (136,869 | ) | (664,123 | ) | — | (50,853 | ) | |||||||||||
| Capitalized origination costs |
33,977 | — | 33,977 | — | 282 | |||||||||||||||
|
|
|
|
|
|
|
|
|
|
|
|||||||||||
| Net carrying balance |
$ | 18,416,178 | $ | 2,002,375 | $ | 20,418,553 | $ | 176,925 | $ | 569,781 | ||||||||||
|
|
|
|
|
|
|
|
|
|
|
|||||||||||
| Allowance and discount as a percentage of unpaid principal balance |
12 | % | 17 | % | 13 | % | 1 | % | 20 | % | ||||||||||
| December 31, 2012 | ||||||||||||||||
| Retail Installment Contracts Held for Investment | ||||||||||||||||
| Loans Acquired Individually |
Purchased Receivable Portfolios |
Total | Receivables from Dealers |
|||||||||||||
| (Dollar amounts in thousands) | ||||||||||||||||
| Unpaid principal balance |
$ | 14,186,712 | $ | 4,406,891 | $ | 18,593,603 | $ | 61,894 | ||||||||
| Loan loss allowance |
(1,555,362 | ) | (218,640 | ) | (1,774,002 | ) | — | |||||||||
| Discount |
(348,571 | ) | (293,097 | ) | (641,668 | ) | — | |||||||||
| Capitalized origination costs |
25,993 | — | 25,993 | — | ||||||||||||
|
|
|
|
|
|
|
|
|
|||||||||
| Net carrying balance |
$ | 12,308,772 | $ | 3,895,154 | $ | 16,203,926 | $ | 61,894 | ||||||||
|
|
|
|
|
|
|
|
|
|||||||||
| Allowance and discount as a percentage of unpaid principal balance |
13 | % | 12 | % | 13 | % | 0 | % | ||||||||
| December 31, 2011 | ||||||||||||||||
| Retail Installment Contracts Held for Investment | ||||||||||||||||
| Loans Acquired Individually |
Purchased Receivable Portfolios |
Total | Receivables from Dealers |
|||||||||||||
| (Dollar amounts in thousands) | ||||||||||||||||
| Unpaid principal balance |
$ | 10,007,312 | $ | 8,613,488 | $ | 18,620,800 | $ | 134,138 | ||||||||
| Loan loss allowance |
(993,213 | ) | (215,262 | ) | (1,208,475 | ) | — | |||||||||
| Discount |
(439,217 | ) | (415,701 | ) | (854,918 | ) | — | |||||||||
| Capitalized origination costs |
24,158 | — | 24,158 | — | ||||||||||||
|
|
|
|
|
|
|
|
|
|||||||||
| Net carrying balance |
$ | 8,599,040 | $ | 7,982,525 | $ | 16,581,565 | $ | 134,138 | ||||||||
|
|
|
|
|
|
|
|
|
|||||||||
| Allowance and discount as a percentage of unpaid principal balance |
14 | % | 7 | % | 11 | % | 0 | % | ||||||||
Delinquency
An account is considered delinquent if a substantial portion of a scheduled payment has not been received by the date such payment was contractually due. Delinquencies may vary from period to period based upon the average age or seasoning of the portfolio, seasonality within the calendar year, and economic factors. Historically, our delinquencies have been highest in the period from November through January due to consumers’ holiday spending.
60
Table of Contents
The following is a summary of retail installment contracts held for investment that are (i) 31-60 days delinquent and (ii) more than 60 days delinquent but not yet in repossession:
| September 30, 2013 | December 31, 2012 | |||||||||||||||||||||||
| Retail Installment Contracts Held for Investment |
Unsecured Consumer Loans | Retail Installment Contracts Held for Investment |
||||||||||||||||||||||
| Dollars (in thousands) |
Percent | Dollars (in thousands) |
Percent | Dollars (in thousands) |
Percent | |||||||||||||||||||
| Principal 31-60 days past due |
$ | 1,898,845 | 8.1 | % | $ | 18,825 | 2.6 | % | $ | 1,824,955 | 9.8 | % | ||||||||||||
| Delinquent principal over 60 days |
945,766 | 4.1 | % | 24,120 | 3.4 | % | 865,917 | 4.7 | % | |||||||||||||||
|
|
|
|
|
|
|
|
|
|
|
|
|
|||||||||||||
| Total delinquent contracts |
$ | 2,844,611 | 12.2 | % | $ | 42,945 | 6.0 | % | $ | 2,690,872 | 14.5 | % | ||||||||||||
|
|
|
|
|
|
|
|
|
|
|
|
|
|||||||||||||
All of our receivables from dealers and all of our retail installment contracts held for sale were current as of September 30, 2013.
Credit Loss Experience
The following is a summary of our net losses and repossession activity on our retail installment contracts for the three and nine months ended September 30, 2013 and 2012 and the years ended December 31, 2012, 2011, and 2010.
| For the Nine Months Ended September 30, |
For the Year Ended December 31, |
|||||||||||||||||||
| 2013 | 2012 | 2012 | 2011 | 2010 | ||||||||||||||||
| (Dollar amounts in thousands) | ||||||||||||||||||||
| Principal outstanding at period end |
$ | 23,306,943 | $ | 18,531,519 | $ | 18,593,603 | $ | 18,620,800 | $ | 16,613,774 | ||||||||||
| Average principal outstanding during the period |
$ | 20,506,168 | $ | 18,325,898 | $ | 18,391,523 | $ | 16,113,117 | $ | 11,609,958 | ||||||||||
| Number of receivables outstanding at period end |
1,652,837 | 1,580,810 | 1,548,944 | 1,683,628 | 1,334,298 | |||||||||||||||
| Average number of receivables outstanding during the period |
1,580,233 | 1,618,617 | 1,605,211 | 1,333,231 | 843,292 | |||||||||||||||
| Number of repossessions (1) |
125,930 | 130,304 | 175,665 | 144,299 | 116,100 | |||||||||||||||
| Number of repossessions as a percent of average number of receivables |
10.63 | % | 10.73 | % | 10.94 | % | 10.82 | % | 13.77 | % | ||||||||||
| Net losses |
$ | 729,504 | $ | 710,002 | $ | 1,008,454 | $ | 1,025,133 | $ | 709,367 | ||||||||||
| Net losses as a percent of average principal amount outstanding (2) |
4.74 | % | 5.17 | % | 5.48 | % | 6.36 | % | 6.11 | % | ||||||||||
| (1) | Repossessions are net of redemptions. The number of repossessions includes repossessions from the outstanding portfolio and from accounts already charged off. |
| (2) | The percentages for the nine months ended September 30, 2013 and 2012 are annualized and are not necessarily indicative of a full year’s actual results. |
Because all of our unsecured consumer loans were newly originated during 2013, there have been less than $1.0 million in chargeoffs in this portfolio as of September 30, 2013. We have had no charge offs on our receivables from dealers.
61
Table of Contents
Deferrals and Troubled Debt Restructurings
In accordance with our policies and guidelines, we, at times, offer payment deferrals to borrowers on our retail installment contracts, whereby the consumer is allowed to move up to three delinquent payments to the end of the loan. Our policies and guidelines limit the number and frequency of deferrals that may be granted to one every six months and eight over the life of a loan. Additionally, we generally limit the granting of deferrals on new accounts until a requisite number of payments has been received. During the deferral period, we continue to accrue and collect interest on the loan in accordance with the terms of the deferral agreement.
At the time a deferral is granted, all delinquent amounts may be deferred or paid, resulting in the classification of the loan as current and therefore not considered a delinquent account. Thereafter, such account is aged based on the timely payment of future installments in the same manner as any other account.
The following is a summary of deferrals on our retail installment contracts held for investment as of the dates indicated:
| September 30, 2013 |
December 31, 2012 |
December 31, 2011 |
||||||||||||||||||||||
| (Dollar amounts in thousands) | ||||||||||||||||||||||||
| Never deferred |
$ | 17,987,970 | 77.2 | % | $ | 13,133,195 | 70.6 | % | $ | 12,593,162 | 67.6 | % | ||||||||||||
| Deferred once |
2,585,152 | 11.1 | % | 2,665,768 | 14.3 | % | 3,376,506 | 18.1 | % | |||||||||||||||
| Deferred twice |
1,372,943 | 5.9 | % | 1,506,115 | 8.1 | % | 1,789,918 | 9.6 | % | |||||||||||||||
| Deferred 3-4 times |
1,304,659 | 5.6 | % | 1,255,805 | 6.8 | % | 848,128 | 4.6 | % | |||||||||||||||
| Deferred greater than 4 times |
56,219 | 0.2 | % | 32,720 | 0.2 | % | 13,086 | 0.1 | % | |||||||||||||||
|
|
|
|
|
|
|
|||||||||||||||||||
| Total |
$ | 23,306,943 | $ | 18,593,603 | $ | 18,620,800 | ||||||||||||||||||
|
|
|
|
|
|
|
|||||||||||||||||||
We evaluate the results of our deferral strategies based upon the amount of cash installments that are collected on accounts after they have been deferred versus the extent to which the collateral underlying the deferred accounts has depreciated over the same period of time. Based on this evaluation, we believe that payment deferrals granted according to our policies and guidelines are an effective portfolio management technique and result in higher ultimate cash collections from the portfolio.
Changes in deferral levels do not have a direct impact on the ultimate amount of consumer finance receivables charged off by us. However, the timing of a charge-off may be affected if the previously deferred account ultimately results in a charge-off. To the extent that deferrals impact the ultimate timing of when an account is charged off, historical charge-off ratios, loss confirmation periods, and cash flow forecasts for loans classified as troubled debt restructurings (“TDRs”) used in the determination of the adequacy of our allowance for loan losses are also impacted. Increased use of deferrals may result in a lengthening of the loss confirmation period, which would increase expectations of credit losses inherent in the portfolio and therefore increase the allowance for loan losses and related provision for loan losses. Changes in these ratios and periods are considered in determining the appropriate level of allowance for loan losses and related provision for loan losses.
If a customer’s financial difficulty is not temporary, we may agree, or be required by a bankruptcy court, to grant a modification involving one or a combination of the following: a reduction in interest rate, a reduction in loan principal balance, or an extension of the maturity date. The servicer also may grant concessions on our unsecured consumer loans in the form of principal or interest rate reductions or payment plans. The following is
62
Table of Contents
a summary of the principal balance as of September 30, 2013 and December 31, 2012 of loans that have received these modifications and concessions:
| September 30, 2013 | December 31, 2012 | |||||||||||
| Retail Installment Contracts |
Unsecured Consumer Loans |
Retail Installment Contracts |
||||||||||
| (Dollar amounts in thousands) | ||||||||||||
| Temporary reduction of monthly payment |
$ | 999,691 | $ | — | $ | 895,557 | ||||||
| Bankruptcy-related accounts |
127,967 | 1,143 | 138,257 | |||||||||
| Extension of maturity date |
107,707 | — | 38,520 | |||||||||
| Interest rate reduction |
74,736 | 3,380 | 36,045 | |||||||||
| Other |
51,372 | — | 69,750 | |||||||||
|
|
|
|
|
|
|
|||||||
| Total modified loans |
$ | 1,361,473 | $ | 4,523 | $ | 1,178,129 | ||||||
|
|
|
|
|
|
|
|||||||
As a result of our adoption on January 1, 2012 of the Financial Accounting Standards Board’s (“FASB”) Accounting Standards Update (“ASU”) 2011-02, Receivables (Topic 310): A Creditor’s Determination of Whether a Restructuring is a Troubled Debt Restructuring (“ASU 2011-12”), which clarified the FASB’s guidance on a creditor’s evaluation of whether it has granted a concession and of whether the borrower is experiencing financial difficulty, management changed its definition of TDRs to include all individually acquired retail installment contracts that have been modified at least once or deferred at least twice or for a period of 90 days or more. Additionally, management believes that releases of liability in a bankruptcy proceeding represent TDRs. Our purchased receivables portfolios are excluded from the scope of the applicable guidance.
In 2011 and 2010, we classified only certain loans that had been modified as TDRs, excluding certain other modifications and all deferrals. The disclosures of unpaid principal balance, recorded investment, number of contracts, and subsequent defaults as of and for the years ended December 31, 2011 and 2010, have not been retrospectively adjusted. Because our standard loan loss provision methodology results in an allowance not significantly different from the amount required for TDRs, the adoption of ASU 2011-02 did not have a material impact on the provision for credit losses or the allowance for loan losses.
A summary of our recorded investment in TDRs as of the dates indicated is as follows:
| September 30, 2013 | December 31, 2012 | |||||||||||
| Retail Installment Contracts |
Unsecured Consumer Loans |
Retail Installment Contracts |
||||||||||
| (Dollar amounts in thousands) | ||||||||||||
| Total TDR principal |
$ | 2,371,581 | $ | 4,136 | $ | 1,483,080 | ||||||
| Accrued interest |
64,289 | 387 | 43,813 | |||||||||
| Discount |
(59,836 | ) | (375 | ) | (36,440 | ) | ||||||
| Origination costs |
3,856 | 2 | 2,717 | |||||||||
|
|
|
|
|
|
|
|||||||
| Outstanding recorded investment |
2,379,890 | 4,150 | 1,493,170 | |||||||||
| Allowance for loan losses |
(469,311 | ) | (1,396 | ) | (251,187 | ) | ||||||
|
|
|
|
|
|
|
|||||||
| Outstanding recorded investment, net of allowance |
$ | 1,910,579 | $ | 2,754 | $ | 1,241,983 | ||||||
|
|
|
|
|
|
|
|||||||
63
Table of Contents
A summary of the principal balance on our performing and non-performing TDRs as of the dates indicated is as follows:
| September 30, 2013 | December 31, 2012 | |||||||||||
| Retail Installment Contracts |
Unsecured Consumer Loans |
Retail Installment Contracts |
||||||||||
| (Dollar amounts in thousands) | ||||||||||||
| Current |
$ | 1,554,056 | $ | 3,343 | $ | 860,385 | ||||||
| 31-60 days past due |
499,206 | 345 | 383,255 | |||||||||
| Greater than 60 days past due (non-performing) |
318,319 | 448 | 239,440 | |||||||||
|
|
|
|
|
|
|
|||||||
| Total TDRs |
$ | 2,371,581 | $ | 4,136 | $ | 1,483,080 | ||||||
|
|
|
|
|
|
|
|||||||
As of September 30, 2013 and December 31, 2012, we did not have any dealer loans classified as TDRs and had not granted deferrals or modifications on any of these loans.
Liquidity and Capital Resources
We require a significant amount of liquidity to originate and acquire loans and leases and to service debt. We fund our operations primarily through securitization in the ABS market and committed credit lines from third-party banks and Santander. In addition, we utilize large flow agreements. We seek to issue debt that appropriately matches the cash flows of the assets that we originate. We have over $2 billion of stockholders’ equity that supports our access to the securitization markets, credit facilities, and flow agreements.
In the second quarter of 2013, launches of our Chrysler Capital brand and our unsecured lending program drove a significant increase in origination volume to a company-record quarterly production of approximately $5.7 billion for the second quarter, followed by originations totaling approximately $6.7 billion for the third quarter. We are executing more frequent securitization transactions, as well as continuing to add additional credit facilities and flow agreements, to fund the increased origination volume from our Chrysler Capital and unsecured lending business.
64
Table of Contents
As of September 30, 2013, our revolving credit facilities consisted of the following:
| September 30, 2013 | ||||||||||||||||||||||
| (Dollar amounts in thousands) | ||||||||||||||||||||||
| Maturity Date(s) | Utilized Balance |
Committed Amount |
Effective Rate | Assets Pledged | Restricted Cash Pledged |
|||||||||||||||||
| Warehouse line |
June 2014 | $ | 252,138 | $ | 500,000 | 1.07 | % | $ | 382,864 | $ | — | |||||||||||
| Warehouse line |
Various(a) | — | 1,210,260 | 3.77 | % | — | — | |||||||||||||||
| Warehouse line (b) |
April 2015 | 1,059,700 | 4,550,000 | 1.48 | % | 1,217,403 | 26,713 | |||||||||||||||
| Warehouse line |
June 2015 | 1,541,570 | 2,000,000 | 0.93 | % | 1,895,659 | 39,674 | |||||||||||||||
| Warehouse line |
July 2015 | 302,486 | 500,000 | 0.94 | % | 371,892 | 8,223 | |||||||||||||||
| Warehouse line (c) |
September 2015 | 57,800 | 200,000 | 3.25 | % | 66,418 | 240 | |||||||||||||||
| Repurchase facility (d) |
Various(c) | 898,832 | 898,832 | 1.62 | % | — | — | |||||||||||||||
|
|
|
|
|
|
|
|
|
|||||||||||||||
| Total facilities with third parties (e) |
4,112,526 | 9,859,092 | 3,934,236 | 74,850 | ||||||||||||||||||
|
|
|
|
|
|
|
|
|
|||||||||||||||
| Lines of credit with Santander and related subsidiaries (f): |
||||||||||||||||||||||
| Line of credit (g) |
December 2015 | 500,000 | 500,000 | 2.48 | % | 16,299 | — | |||||||||||||||
| Line of credit (g) |
December 2017 | — | 500,000 | 3.10 | % | — | — | |||||||||||||||
| Line of credit |
December 2015 | 1,750,000 | 1,750,000 | 2.05 | % | 1,570 | — | |||||||||||||||
| Line of credit |
December 2017 | 1,045,000 | 1,750,000 | 2.55 | % | 124,608 | — | |||||||||||||||
|
|
|
|
|
|
|
|
|
|||||||||||||||
| Total facilities with Santander and related subsidiaries |
3,295,000 | 4,500,000 | 142,477 | — | ||||||||||||||||||
|
|
|
|
|
|
|
|
|
|||||||||||||||
| Total revolving credit facilities |
$ | 7,407,526 | $ | 14,359,092 | $ | 4,076,713 | $ | 74,850 | ||||||||||||||
|
|
|
|
|
|
|
|
|
|||||||||||||||
| (a) | One-fourth of any outstanding balance on this facility would mature in each of the following months: March 2014, November 2014, March 2015, and November 2015 |
| (b) | This line is held exclusively for Chrysler Capital retail loan and lease financing, with lease financing comprising no more than 50% of the outstanding balance upon advance. |
| (c) | This line is held exclusively for unsecured consumer term loans. |
| (d) | The repurchase facility is collateralized by securitization bonds and residuals retained by the Company. No portion of this facility is unsecured. This facility has rolling 30-day and 90-day maturities. |
| (e) | On November 25, 2013, we entered into a $175 million credit facility with a third party to finance residuals retained in our securitizations. On December 19, 2013, we entered into a $750 million credit facility with a third party to finance vehicle retail installment contracts. |
| (f) | As of September 30, 2013, $754,927 of the outstanding balances on credit facilities were unsecured. |
| (g) | These lines are also collateralized by securitization notes payable and residuals retained by the Company |
65
Table of Contents
Our secured structured financings primarily consist of public, SEC-registered securitizations. We also execute private securitizations under Rule 144A of the Securities Act and privately issue amortizing notes. As of September 30, 2013, our secured structured financings consisted of the following:
| September 30, 2013 | ||||||||||||||||||||
| (Dollar amounts in thousands) | ||||||||||||||||||||
| Original Estimated Maturity Date(s) |
Balance | Initial Note Amounts Issued |
Initial Weighted Average Interest Rate |
Collateral | Restricted Cash |
|||||||||||||||
| 2010 Securitizations |
October 2016 — November 2017 | $ | 771,599 | $ | 4,671,749 | 1.04%-1.44% | $ | 1,361,897 | $ | 213,458 | ||||||||||
| 2011 Securitizations |
October 2015 — September 2017 | 1,477,673 | 5,605,609 | 1.21%-2.80% | 1,628,140 | 188,297 | ||||||||||||||
| 2012 Securitizations |
November 2017 — December 2018 | 4,623,776 | 8,023,840 | 0.92%-1.68% | 5,656,807 | 402,113 | ||||||||||||||
| 2013 Securitizations (a) |
January 2019 — January 2021 | 4,532,017 | 5,228,770 | 0.89%-1.59% | 5,270,014 | 270,475 | ||||||||||||||
|
|
|
|
|
|
|
|
|
|||||||||||||
| Public securitizations |
11,405,065 | 23,529,968 | 13,916,858 | 1,074,343 | ||||||||||||||||
|
|
|
|
|
|
|
|
|
|||||||||||||
| 2010 Private issuance |
June 2011 | 240,385 | 516,000 | 1.29% | 397,553 | 9,141 | ||||||||||||||
| 2011 Private issuances (b) |
December 2018 | 987,297 | 4,856,525 | 1.46%-1.80% | 1,697,858 | 122,767 | ||||||||||||||
| 2012 Private issuance |
May 2016 | 39,740 | 70,308 | 1.07% | 46,047 | 3,635 | ||||||||||||||
| 2013 Private issuances (c) |
September 2018 — September 2020 | 2,603,384 | 2,693,754 | 1.13%-1.38% | 2,547,754 | 69,925 | ||||||||||||||
|
|
|
|
|
|
|
|
|
|||||||||||||
| Privately issued amortizing notes |
3,870,806 | 8,136,587 | 4,689,212 | 205,468 | ||||||||||||||||
|
|
|
|
|
|
|
|
|
|||||||||||||
| Total secured structured financings |
$ | 15,275,871 | $ | 31,666,555 | $ | 18,606,070 | $ | 1,279,811 | ||||||||||||
|
|
|
|
|
|
|
|
|
|||||||||||||
| (a) | On November 20, 2013, we issued $1.5 billion in notes in a public securitization. |
| (b) | On November 27, 2013, we executed clean-up calls on two of our 2011 private issuances. On December 4, 2013, we advanced an additional $70,304 on a third. |
| (c) | One of these issuances is secured by leased vehicles. This issuance had initial notes issued of $507,028 and a balance of $499,624 as of September 30, 2013. On October 31, 2013, we advanced an additional $492,921 on this structured facility. |
In addition to our credit facilities and secured structured financings, we have flow agreements in place with Bank of America and SBNA.
Credit Facilities
Third-party Revolving Credit Facilities
Warehouse Lines
Warehouse lines are used to fund new originations. Each line specifies the required collateral characteristics, collateral concentrations, credit enhancement, and advance rates. Our warehouse lines generally are backed by auto retail installment contracts and, in the case of the Chrysler Capital dedicated facility described below, leases. These credit lines generally have one- or two-year commitments, staggered maturities and floating interest rates. We maintain daily funding forecasts for originations, acquisitions, and other large outflows such as tax payments in order to balance the desire to minimize funding costs with our liquidity needs.
Our warehouse lines generally have net spread, delinquency, and net loss ratio limits. Generally, these limits are calculated based on the portfolio collateralizing the respective line; however, for one of our warehouse lines, delinquency and net loss ratios are calculated with respect to our serviced portfolio as a whole. Failure to meet any of these covenants could trigger increased overcollateralization requirements or, in the case of limits calculated with respect to the specific portfolio underlying certain credit lines, result in an event of default under these agreements. If an event of default occurs under one of these agreements, the lenders could elect to declare all amounts outstanding under the impacted agreement to be immediately due and payable, enforce their interests against collateral pledged under the agreement, restrict our ability to obtain additional borrowings under the agreement, and/or remove us as servicer. None of our warehouse lines currently have any ratios above their
66
Table of Contents
limits, and we have never had a warehouse line terminated due to failure to comply with any ratio or a failure to meet any covenant. A default under one of these agreements can be enforced only with respect to the impacted warehouse line.
In order to comply with the Chrysler Agreement’s requirement that SCUSA maintain at least $4.5 billion of financing reserved for the exclusive use of providing short-term liquidity needs to support Chrysler retail financing, we entered into a credit facility on April 29, 2013 with seven banks providing an aggregate commitment of $4.55 billion. The facility has an initial term of two years and can be used for both loan and lease financing (with lease financing comprising no more than 50% of the outstanding balance upon advance). The facility requires reduced advance rates in the event of delinquency, net loss, or residual loss ratios exceeding specified thresholds.
Repurchase Facility
We also obtain financing through an investment management agreement whereby we pledge retained subordinate bonds on our own securitizations as collateral for repurchase agreements with various borrowers and at renewable terms ranging from 30 to 90 days. These repurchase agreements provide an aggregate commitment of approximately $1 billion.
Our equity interests in certain of our subsidiaries have been pledged as collateral under certain of our revolving credit facilities.
Santander Credit Facilities
Santander historically has provided, and continues to provide our business with significant funding support in the form of committed credit facilities. Through its New York branch, Santander provides us with $4.5 billion of long-term committed revolving credit facilities (the “Santander Credit Facilities”).
The Santander Credit Facilities are structured as three and five year floating rate facilities, with current maturity dates of December 31, 2015 and 2017. Santander has the option to allow us to continue to renew the term of these facilities annually going forward, thereby maintaining the three and five year maturities. These facilities currently permit unsecured borrowing but generally are collateralized by retail installment contracts and retained residuals. Any secured balances outstanding under the Santander Credit Facilities at the time of the facilities’ maturity will amortize to match the maturities and expected cash flows of the corresponding collateral.
There was an average outstanding balance of approximately $2.4 billion, $1.2 billion, and $3.0 billion under the Santander Credit Facilities during the nine months ended September 30, 2013 and the years ended December 31, 2012 and 2011, respectively. The maximum outstanding balance during each period was $4.3 billion, $2.2 billion, and $4.9 billion, respectively.
Santander also has provided a $500 million letter of credit facility with a maturity date of December 31, 2014 that we can use as credit enhancement to support increased borrowings on certain third-party credit facilities. We have not used this facility since December 2012. Santander also serves as the counterparty for many of our derivative financial instruments.
Secured Structured Financings
We obtain long-term funding for our receivables through securitization in the ABS market. ABS provides an attractive source of funding due to the cost efficiency of the market, a large and deep investor base, and tenors that appropriately match the cash flows of the debt to the cash flows of the underlying assets. The term structure of a securitization locks in fixed rate funding for the life of the underlying fixed rate assets, and the matching amortization of the assets and liabilities provides committed funding for the collateralized loans throughout their terms. Because of prevailing market rates, we did not issue ABS transactions in 2008 and 2009, but we began
67
Table of Contents
issuing ABS again in 2010. We were the largest issuer of retail auto ABS in 2011, 2012, and 2013. Since 2010, SCUSA has issued over $25 billion in retail auto ABS.
We execute each securitization transaction by selling receivables to securitization trusts (“Trusts”) that issue ABS to investors. In order to attain specified credit ratings for each class of bonds, these securitization transactions have credit enhancement requirements in the form of subordination, restricted cash accounts, excess cash flow, and overcollateralization, whereby more receivables are transferred to the Trusts than the amount of ABS issued by the Trusts.
Excess cash flows result from the difference between the finance and interest income received from the obligors on the receivables and the interest paid to the ABS investors, net of credit losses and expenses. Initially, excess cash flows generated by the Trusts are used to pay down outstanding debt in the Trusts, increasing over collateralization until the targeted percentage level of assets has been reached. Once the targeted percentage level of overcollateralization is reached and maintained, excess cash flows generated by the Trusts are released to us as distributions from the Trusts. We also receive monthly servicing fees as servicer for the Trusts. Our securitizations each require an increase in credit enhancement levels if Cumulative Net Losses, as defined in the documents underlying each ABS transaction, exceed a specified percentage of the pool balance. None of our securitizations have Cumulative Net Loss percentages above their limits.
Our securitization transactions utilize bankruptcy-remote special purpose entities which are also VIEs that meet the requirements to be consolidated in our financial statements. Following a securitization, the finance receivables and the notes payable related to the securitized retail installment contracts remain on the consolidated balance sheets. We recognize finance and interest income as well as fee income on the collateralized retail installment contracts and interest expense on the ABS issued. We also record a provision for loan losses to cover probable loan losses on the retail installment contracts. While these Trusts are included in our consolidated financial statements, these Trusts are separate legal entities; thus, the finance receivables and other assets sold to these Trusts are legally owned by these Trusts, are available to satisfy the notes payable related to the securitized retail installment contracts, and are not available to our creditors or our other subsidiaries.
We completed eight securitizations in 2013 and currently have 28 securitizations outstanding in the market with a cumulative ABS balance of over $12 billion. Our securitizations generally have several classes of notes, with principal paid sequentially based on seniority and any excess spread distributed to the residual holder. We generally retain the lowest bond class and the residual. We use the proceeds from securitization transactions to repay borrowings outstanding under our credit facilities, originate and acquire new loans and leases, and for general corporate purposes. We generally exercise clean-up call options on our securitizations when the collateralization pool balance reaches 10% of its original balance.
We also periodically privately issue amortizing notes, in transactions that are structured similarly to our public and Rule 144A securitizations but are issued to banks and conduits. Historically, all of these private issuances have been collateralized by vehicle retail installment contracts and loans; however, in the third quarter of 2013, we executed our first private issuance backed by vehicle leases. This issuance had an initial balance of $507 million, with an additional $493 million issued upon execution of an amendment on October 31, 2013.
Flow Agreements
In order to manage our balance sheet and provide funding for our recent significant increase in volume of originations, we are actively seeking to enter into flow agreements under which we will sell, or otherwise source to third parties, loans on a periodic basis. These loans will not be on our balance sheet but may provide a gain on sale and will provide a stable stream of servicing fee income.
On June 13, 2013, we entered into a forward flow agreement with Bank of America whereby we are committed to sell a contractually determined amount of eligible loans to Bank of America on a monthly basis.
68
Table of Contents
The amount sold monthly may vary depending on the amount and credit quality of eligible current month originations and prior month sales. On September 26, 2013, we amended this flow agreement to replace the maximum annual sale amounts with a monthly limit of $300 million and to extend the term of the agreement from December 31, 2015 to May 31, 2018, such that the total maximum committed sales, $17 billion, remains the same. For loans sold, we retain the servicing rights at contractually agreed upon rates. We also will receive or pay a servicer performance payment if net credit losses on the sold loans are lower or higher, respectively, than expected net credit losses at the time of sale. These servicer performance payments are limited to a percentage of principal balance sold or expected losses at time of sale and are not expected to be significant to our total servicing compensation from the forward flow agreement. As of September 30, 2013, the Company had sold approximately $897 million of loans under this agreement.
On June 28, 2013, we entered into a flow agreement with SBNA whereby we provide the bank with the first right to review and assess dealer lending opportunities and, if the bank elects, to provide the proposed financing. We provide servicing on all loans originated under this arrangement. We also will receive or pay a servicer performance payment if yields, net of credit losses, on the loans are higher or lower, respectively, than expected at origination. As of September 30, 2013, approximately $17 million of loans had been originated under this agreement. Servicer performance payments earned for the year-to-date period ended September 30, 2013 were immaterial.
Off-Balance Sheet Financing
On October 24 and November 12, 2013, we executed our first two Chrysler Capital-branded securitizations, both of which were executed under Rule 144A of the Securities Act. Because all of the notes and residual interests in these securitizations were issued to third parties, we recorded these transactions as true sales of the $640 million and $451 million, respectively, of retail installment contracts securitized, and removed these sold assets from our consolidated balance sheets.
As of September 30, 2013, substantially all of the dealer floorplan loans originated under Chrysler Capital were held by our affiliate, SBNA, under the terms of either of two agreements, a flow agreement entered into in June 2013 and a sale agreement entered into in August 2013. In November 2013, we entered into an additional sale agreement to sell substantially all of the non-floorplan dealer loans to SBNA.
Cash Flow Comparison
We have produced positive net cash from operating activities every year since 2003. Our investing activities primarily consist of originations and acquisitions of retail installment contracts. Our financing activities primarily consist of borrowing, repayments of debt, and payment of dividends.
| For the Nine Months Ended September 30, |
For the Year Ended December 31, | |||||||||||||||||||
| 2013 | 2012 | 2012 | 2011 | 2010 | ||||||||||||||||
| (Dollar amounts in thousands) | ||||||||||||||||||||
| Net cash provided by operating activities |
$ | 1,381,799 | $ | 1,035,173 | $ | 1,442,592 | $ | 1,555,596 | $ | 1,159,613 | ||||||||||
| Net cash provided by (used in) investing activities |
$ | (7,595,568 | ) | $ | 153,351 | $ | (64,632 | ) | $ | (3,563,965 | ) | $ | (7,078,789 | ) | ||||||
| Net cash provided by (used in) financing activities |
$ | 6,170,233 | $ | (1,240,638 | ) | $ | (1,361,482 | ) | $ | 2,003,777 | $ | 5,943,247 | ||||||||
Cash Provided by Operating Activities
For the nine months ended September 30, 2013, net cash provided by operating activities of $1.4 billion consisted of net income of $582 million, adjustments for non-cash items of $1.0 billion, and net proceeds from sales of loans of $1.1 billion, partially offset by net purchases of loans held for sale of $1.2 billion and changes in working capital of $146 million. Adjustments for non-cash items consisted primarily of $1.2 billion in provision for credit losses and $43 million in deferred tax expense, partially offset by $231 million in accretion of discount, net of depreciation and amortization of capitalized origination costs.
69
Table of Contents
For the nine months ended September 30, 2012, net cash provided by operating activities of $1.0 billion consisted of net income of $612 million and adjustments for non-cash items of $538 million, partially offset by changes in working capital of $115 million. Adjustments for non-cash items consisted primarily of $660 million in provision for credit losses and $45 million of depreciation and amortization, partially offset by $67 million in accretion of discount and capitalized origination costs and $101 million in deferred tax benefit.
For the year ended December 31, 2012, net cash provided by operating activities of $1.43 billion consisted of net income of $735 million and adjustments for non-cash items of $832 million, partially offset by a change in working capital of $125 million. Adjustments for non-cash items consisted primarily of $1.12 billion in provision of credit losses and $187 million for depreciation and amortization, partially offset by $273 million in accretion of discount and capitalized origination costs and $196 million in deferred tax benefit.
For the year ended December 31, 2011, net cash provided by operating activities of $1.56 billion consisted of net income of $788 million and adjustments for non-cash items of $877 million, partially offset by change in working capital of $110 million. Adjustments for non-cash items consisted primarily of $819 million in provision of credit losses and $258 million for depreciation and amortization, partially offset by $237 million in accretion of discount and capitalized origination costs. Cash used for changes in working capital and other activities was primarily impacted by $191 million in federal income tax and other taxes partially offset by a $72 million decrease in other assets.
For the year ended December 31, 2010, net cash provided by operating activities of $1 billion consisted of net income of $438 million, adjustments for non-cash items of $476 million, and changes in working capital of $245 million. Adjustments for non-cash items consisted primarily of $888 million in provision of credit losses and $124 million for depreciation and amortization, partially offset by $277 million in accretion of discount and capitalized origination costs and $260 million in deferred tax benefit. Cash provided by changes in working capital and other activities was primarily impacted by $204 million in federal income tax and other taxes.
Cash Provided by (Used in) Investing Activities
For the nine months ended September 30, 2013, net cash used in investing activities of $7.6 billion primarily consisted of $14.3 billion in loan and lease originations and net balance increases on revolving lines, net of $7.1 billion in collections. Net cash used in investing activities also includes the $150 million upfront fee paid to Chrysler and a $322 million increase in restricted cash.
For the nine months ended September 30, 2012, net cash provided by investing activities of $153 million primarily consisted of a net $409 million decrease in restricted cash, offset by $314 million in loan originations and purchases less collections. The increase in restricted cash was due to the $1.16 billion influx of previously restricted cash that was used to pay down Santander lines of credit, partially offset by other builds of restricted cash during the period.
For the year ended December 31, 2012, net cash used in investing activities of $64 million primarily consisted of $589 million used for retail installment contract originations and acquisitions, net of collections on retail installment contracts, partially offset by changes in restricted cash of $379 million. In addition, net collections on available-for-sale securities and receivables from lenders totaled $159 million.
For the year ended December 31, 2011, net cash used in investing activities of $3.56 billion was primarily impacted by the purchases of and collections on retail installment contracts. Purchases of retail installment contract portfolios during the year were $3.65 billion. Excluding the purchase of these receivables portfolios, net cash inflow on retail installment contracts was $1.21 billion. In addition, restricted cash increased due to $1.16 billion received for the sale of common stock in connection with the Equity Transaction. This cash was used to pay down Santander lines of credit in early 2012.
70
Table of Contents
For the year ended December 31, 2010, net cash used in investing activities of $7.08 billion was primarily impacted by the purchases of and collections on retail installment contracts. We purchased retail installment contract portfolios during the year of $7.81 billion. Excluding the purchase of these receivables portfolios, net cash inflow on retail installment contracts was $416 million.
Cash Provided by (Used in) Financing Activities
For the nine months ended September 30, 2013, net cash provided by financing activities of $6.2 billion was driven by net advances of $4.0 billion on credit facilities, in addition to net proceeds on new secured structured financings exceeding payments on secured structured financings by $2.4 billion, partially offset by a $290 million dividend.
For the nine months ended September 30, 2012, net cash used in financing activities of $1.2 billion consisted of the net pay down on borrowings of $766 million and $475 million paid in dividends during the period.
During the year ended December 31, 2012, net cash used in financing activities of $1.36 billion resulted from payments on notes payable exceeding proceeds by $540 million, in addition to $735 million in dividends.
During the year ended December 31, 2011, net cash provided by financing activities of $2.00 billion resulted from proceeds in notes payable exceeding payments by $1.82 billion, in addition to the $1.16 billion cash infusion in December 2011 from the Equity Transaction, partially offset by $865 million in dividends.
During the year ended December 31, 2010, net cash provided by financing activities of $5.94 billion resulted from proceeds in notes payable exceeding payments by $6.07 billion.
Contingencies and Off-Balance Sheet Arrangements
Litigation
On September 13, 2013, Ally Financial Inc. filed suit against us in the United States District Court for the Eastern District of Michigan in a matter pending as Case No. 13-CV-13929, alleging copyright infringement and misappropriation of trade secrets and confidential information in connection with our launch of Chrysler Capital and, in particular, our offering of floorplan lines of credit to Chrysler dealerships. We consider the allegations to be without merit and intend to vigorously defend the case.
Periodically, we are party to or otherwise involved in other legal proceedings arising in the normal course of business. We have recorded no material reserves for any cases and do not believe that there are any proceedings threatened or pending that would have a material adverse effect on us if determined adversely.
Lending Arrangements
We are obligated to make purchase price holdback payments to a third-party originator of loans that we purchase on a periodic basis, when losses are lower than originally expected.
We have extended revolving lines of credit to certain auto dealers. Under this arrangement, we are committed to lend up to each dealer’s established credit limit.
In March 2013, we entered into certain agreements with LendingClub under which we have the option to purchase up to 25% of LendingClub’s total originations for a term of three years. In July 2013, we entered into certain additional agreements with LendingClub under which we are committed to purchase at least the lesser of $30 million per month or 75% of the lending platform company’s near-prime originations through July 2015, and the lesser of $30 million per month or 50% of the lending platform company’s near-prime originations thereafter through July 2017. This commitment can be reduced or cancelled with 90 days’ notice.
71
Table of Contents
In April 2013, we entered into certain agreements with Bluestem. The terms of the agreements include a commitment by us to purchase new advances originated by Bluestem, along with existing balances on accounts with new advances, for an initial term ending in April 2020. Each customer account generated under the agreements generally is approved with a credit limit higher than the amount of the initial purchase, with each subsequent purchase automatically approved as long as it does not cause the account to exceed its limit and the customer is in good standing. As these credit lines do not have a specified maturity, but rather can be terminated at any time in the event of adverse credit changes or lack of use, we have not recorded a reserve for unfunded commitments. We are required to make a monthly profit-sharing payment to Bluestem.
Flow Agreements
In June 2013, we entered into a forward flow agreement that, as amended in September 2013, commits us to sell up to $300 million per month of prime loans to Bank of America. For loans sold, we retain the servicing rights at contractually agreed upon rates. We also will receive or pay a servicer performance payment if net credit losses on the sold loans are lower or higher, respectively, than expected net credit losses at the time of sale.
In June 2013, we entered into a flow agreement with SBNA whereby we provide SBNA with the first right to review and assess Chrysler dealer lending opportunities and, if SBNA elects, SBNA will provide the proposed financing. We provide servicing on all loans originated under this arrangement. We also will receive or pay a servicer performance payment if yields, net of credit losses, on the loans are higher or lower, respectively, than expected at origination.
Credit Enhancement Arrangements
In connection with the sale of retail installment contracts to securitization trusts, we have made standard representations and warranties customary to the consumer finance industry. Violations of these representations and warranties may require us to repurchase loans previously sold. As of September 30, 2013, we had no repurchase requests outstanding.
We have a letter of credit facility in the amount of $500 million from Santander with a maturity date of December 31, 2014 that we can use as credit enhancement to support increased borrowings on certain third-party credit facilities. We have not used this letter of credit facility since December 2012.
Chrysler-related Contingencies
Throughout the ten-year term of our agreement with Chrysler, we are obligated to make quarterly payments to Chrysler representing a percentage of gross profits earned from a portion of the Chrysler Capital consumer loan and lease platform. We also are obligated to make quarterly payments to Chrysler sharing residual gains on leases in quarters in which we experience lease terminations with gains over a specified percentage threshold.
Contractual Obligations
We lease our headquarters in Dallas, Texas, our servicing centers in Texas and Colorado, and an operations facility in California under non-cancelable operating leases that expire at various dates through 2026. We rent printers and postage machines under capital leases that expire in 2014.
72
Table of Contents
The following table summarizes our contractual obligations as of December 31, 2012 (in thousands):
| Less than 1 year |
1-3 years |
3-5 years |
More than 5 years |
Total | ||||||||||||||||
| (Dollar amounts in thousands) | ||||||||||||||||||||
| Operating lease obligations |
$ | 4,420 | $ | 8,411 | $ | 5,716 | $ | — | $ | 18,547 | ||||||||||
| Capital lease obligations |
473 | 69 | — | — | 542 | |||||||||||||||
| Notes payable — |
||||||||||||||||||||
| revolving credit facilities |
1,109,966 | 2,264,700 | — | — | 3,374,666 | |||||||||||||||
| Notes payable — |
||||||||||||||||||||
| secured structural financings |
715,461 | 4,009,722 | 5,489,171 | 2,668,832 | 12,883,186 | |||||||||||||||
| Contractual interest on notes payable |
291,609 | 523,632 | 309,333 | 40,700 | 1,165,274 | |||||||||||||||
|
|
|
|
|
|
|
|
|
|
|
|||||||||||
| $ | 2,121,929 | $ | 6,806,534 | $ | 5,804,220 | $ | 2,709,532 | $ | 17,442,215 | |||||||||||
|
|
|
|
|
|
|
|
|
|
|
|||||||||||
The above table does not include operating lease obligations related to the lease we entered into on October 21, 2013. Future minimum lease payments for the twelve-year term of the lease total approximately $83.6 million.
The above table also does not include purchase commitments under the agreement with a third party retailer we entered into in April 2013, under terms of which we are committed to purchase certain new advances of unsecured revolving financings originated by the retailer, along with existing balances on accounts with new advances, for an initial term ending in April 2020. In connection with this agreement, as of September 30, 2013, we had elected to exercise our option to purchase certain existing balances on accounts without new advances, thereby committing to purchase approximately $90 million of loans on or about October 4, 2013, a commitment we fulfilled in a timely manner.
The above table also does not include purchase commitments under the agreement with a peer-to-peer unsecured lender we entered into in July 2013, under terms of which we are committed to purchase the lesser of $30 million per month or 75% of the lender’s near-prime originations through July 2015, and the lesser of $30 million per month or 50% of the lender’s near-prime originations thereafter through July 2017. This commitment can be reduced or cancelled with 90 days’ notice.
Market Risk
We assume various types of risk in the normal course of business. Management classifies risk exposures into six risk categories: (1) strategic, including reputational, (2) credit, (3) market, (4) liquidity, (5) capital, and (6) non prudential risk including operations, technology, compliance, human resources, accounting and model risks.
We continuously enhance our risk management capabilities with additional processes, tools and systems designed to not only provide management with deeper insight into our various risks and assess our tolerance for risk, but also enhance our ability to mitigate these risks with the proper control infrastructure, ensure mitigation actions are effective in modifying or reducing the risk profile and the appropriate return is received for the risks taken.
The Board Enterprise Risk Committee (“BERC”) has been established by the Board of Directors (the Board) and charged with responsibility for establishing the governance over the risk management process, providing oversight in managing the aggregate risk position and reporting on the comprehensive portfolio of risk categories and the potential impact these risks can have on our risk profile. The BERC is principally composed of the executive management team representing the different risk areas and business units who are appointed by the Chief Executive Officer.
73
Table of Contents
The BERC meets quarterly and is chartered to assist the Board in promoting the best interests of the Company by overseeing policies, procedures and risk practices relating to enterprise-wide risk and compliance with regulatory guidance. Members of the BERC are selected such that the committee comprises individuals whose experiences and qualifications can lead to broad and informed views on risk matters facing us and the financial services industry, including, but not limited to, risk matters that address credit, market, liquidity, operational, compliance, legal and other general business conditions. A comprehensive risk report is submitted to the BERC each quarter providing management’s view of our risk position provided by the Chief Compliance and Risk Officer.
In addition to the BERC, the CEO delegates risk responsibility to management committees. These committees are: Executive Operations Committee (EOC), Asset Liability Committee (ALCO), Finance & Treasury Committee, Pricing and Credit Risk Oversight Committee (PCROC), the Legal & Compliance Committee (L&C) and the Model Risk Committee. The Chief Compliance and Risk Officer participates in each of these committees.
In response to the evolving regulatory requirements for consumer finance, in 2012, we established the position of Chief Compliance Officer, later expanded to Chief Compliance and Risk Officer, to place emphasis on SCUSA’s commitment to manage regulatory in a comprehensive compliance management program and overall risk in an enterprise risk program.
Interest Rate Risk
A change from the current low interest rate environment, a flat or inverted yield curve, and changes in prevailing interest rates can have an adverse impact on our business. Loans and leases originated or otherwise acquired by us and pledged to secure borrowings under our revolving credit facilities bear fixed interest rates and finance charges. Our gross interest rate spread, which is the difference between the income we earn through the interest and finance charges on our finance receivables and lease contracts and the interest we pay on our funding, is affected by changes in interest rates as a result of our dependence on the incurrence of variable rate debt. We are exposed to variable rate funding through our borrowings under our revolving credit facilities.
The variable rates on the borrowings under our revolving credit facilities are indexed to LIBOR or commercial paper rates and fluctuate periodically based on movements in those indexes. We sometimes use interest rate swap agreements to convert the variable rate exposures on these borrowings to a fixed rate, thereby mitigating our interest rate exposure. Interest rate swap agreements purchased by us do not impact the contractual cash flows to be paid to the creditor. The counterparty for most of our interest rate swaps is Santander or one of its affiliates. As of September 30, 2013, the notional value of our hedges with Santander and affiliates was approximately $6.0 billion.
In our public and Rule 144A securitization transactions, we transfer fixed rate to trusts that, in turn, issue fixed rate securities to investors. The interest rate demanded by investors in our securitization transactions and other secured financings depends on the general interest rate environment and prevailing interest rate spreads for securitizations. We are able to obtain attractive interest rate spreads on our securitizations due to among other factors: (i) the credit quality of the receivables in the trusts; (ii) the historical credit performance of similar pools of our receivables; (iii) the significant expansion of our securitization investor base since 2010; (iv) the historical lack of defaults in auto ABS; (v) the structure of our securitizations (with first losses going to the equity residual retained by us); and (vi) our obtaining of ratings from at least two ratings agencies on each securitization.
We are, in certain circumstances, required to hedge our interest rate risk on our secured structured financings and the borrowings under our revolving credit facilities, and we use both interest rate swaps and interest rate caps to satisfy these requirements. We currently hold purchased interest rate caps and offsetting sold interest rate caps related to several of our secured structured financings and to our Chrysler retail financing facility. Although the interest rate caps are purchased by these financing facilities, cash outflows from the
74
Table of Contents
facilities ultimately impact our retained interests in the secured structured financings as cash expended by the facilities will decrease the ultimate amount of cash to be received by us. Therefore, when economically feasible, we may simultaneously sell a corresponding interest rate cap to offset the premium paid to purchase the interest rate cap. The fair values of our interest rate cap agreements purchased and sold net to an immaterial value in our financial statements and have an immaterial earnings impact comprised solely of their execution cost. The counterparty for certain of our interest rate caps and related options is an affiliate of Santander. As of September 30, 2013, the notional value of our caps and options with this affiliate was approximately $3.2 billion.
Our board of directors requires that we closely monitor and manage the amount of our interest rate risk exposure. We monitor our interest rate risk by conducting sensitivity analyses that include parallel shifts in prevailing interest rates. As of September 30, 2013, the impact of a hypothetical 100 basis point parallel increase in the interest rate curve on our net interest margin and our economic net worth was a decrease of $49.5 million and $78.3 million, respectively. We assess interest rate risk by monitoring the repricing gap by maturity date of our interest-bearing assets and liabilities to ensure appropriate duration matching. The following table provides information about maturities of our interest rate-sensitive financial instruments by expected maturity date as of September 30, 2013:
| 1M | 3M | 6M | 12 M | 2 Y | 3 Y | 4 Y | 5 Y | >5 Y | ||||||||||||||||||||||||||||
| (Dollar amounts in millions) | ||||||||||||||||||||||||||||||||||||
| Assets |
1,029 | 1,438 | 2,384 | 3,636 | 5,700 | 4,372 | 1,552 | 694 | 527 | |||||||||||||||||||||||||||
| Liabilities |
8,319 | 1,209 | 1,787 | 2,140 | 3,055 | 1,981 | 952 | — | — | |||||||||||||||||||||||||||
| Net Swaps |
5,934 | (324 | ) | (495 | ) | (923 | ) | (1,739 | ) | (1,386 | ) | (708 | ) | (360 | ) | — | ||||||||||||||||||||
| Repricing Gap |
(1,356 | ) | (96 | ) | 101 | 573 | 907 | 1,005 | (107 | ) | 334 | 527 | ||||||||||||||||||||||||
| Cumulative Gap |
(1,356 | ) | (1,451 | ) | (1,350 | ) | (778 | ) | 129 | 1,134 | 1,027 | 1,361 | 1,889 | |||||||||||||||||||||||
Finance receivables are estimated to be realized by us in future periods using discount rate, prepayment, and credit loss assumptions similar to our historical experience. Notional amounts on interest rate swap and cap agreements are based on contractual terms. Credit facilities and securitization notes payable amounts have been classified based on expected payoff.
The notional amounts of interest rate swap and cap agreements, which are used to calculate the contractual payments to be exchanged under the contracts, represent average amounts that will be outstanding for each of the years included in the table. Notional amounts do not represent amounts exchanged by parties and, thus, are not a measure of our exposure to loss through our use of these agreements.
Management monitors our interest rate hedging activities to ensure that the value of derivative financial instruments, their correlation to the contracts being hedged, and the amounts being hedged continue to provide effective protection against interest rate risk. However, there can be no assurance that our strategies will be effective in minimizing interest rate risk or that increases in interest rates will not have an adverse effect on our profitability.
Liquidity Risk
We view liquidity as integral to other key elements such as capital adequacy, asset quality and profitability. Because our debt is nearly entirely serviced by collections on consumer receivables, our primary liquidity risk relates to the ability to continue to grow our business through the funding of new originations. We have a robust liquidity policy in place to manage this risk.
Our liquidity policy also establishes the following guidelines:
| • | that we maintain at least four external credit providers (as of September 30, 2013, we had nine); |
| • | that we rely on Santander and affiliates for no more than 30% of our funding (as of September 30, 2013, Santander and affiliates provided 14% of our funding); |
75
Table of Contents
| • | that no more than 35% and 65% of our debt mature in the next six and twelve months, respectively (as of September 30, 2013, only 3% and 9%, respectively, of our debt is scheduled to mature in these timeframes); |
| • | that we maintain unused capacity of at least $3.0 billion in excess of our expected peak usage over the following twelve months (as of September 30, 2013, we had twelve-month rolling unused capacity of approximately $4.8 billion); and |
| • | that we maintain a minimum liquidity ratio, defined as our short-term assets divided by our short-term liabilities, of at least 70% over periods of one, three, six, and twelve months (as of September 30, 2013, our minimum liquidity ratio was at least 99% for each of these periods). |
Our liquidity policy also requires that our Asset and Liability Committee monitor many indicators, both market-wide and company-specific, to determine if action may be necessary to maintain our liquidity position. These indicators include:
| • | delinquency and loss ratios on our securitizations; |
| • | available commitments on our borrowing lines; |
| • | Santander ratings, market capitalization, and commercial paper rate; |
| • | spreads on U.S. and Spanish debt; |
| • | swap rates; and |
| • | the Manheim Used Vehicle Index. |
We generally look for funding first from structured secured financings, second from third-party credit facilities, and last from Santander. We believe this strategy helps us avoid being overly reliant on Santander for funding. We also utilize financing structures whereby even if a credit facility is canceled, balances outstanding are not due and payable immediately but rather run off only as the underlying collateral amortizes. Additionally, we can reduce originations to significantly lower levels if necessary during times of limited liquidity.
Our liquidity management tools include daily and twelve-month rolling cash requirements forecasts, monthly funding usage and availability reports, daily sources and uses reporting, structural liquidity risk exercises, and the establishment of liquidity contingency plans. We also perform quarterly stress tests in which we forecast the impact of various negative scenarios (alone and in combination), including reduced credit availability, higher funding costs, lower advance rates, lower customer interest rates, dealer discount rates, and higher credit losses.
We are currently in the process of establishing a qualified like-kind exchange program in order to defer tax liability on gains on sale of vehicle assets at lease termination. If we do not meet the safe harbor requirements of IRS Revenue Procedure 2003-39, we may be subject to large, unexpected tax liabilities, thereby generating immediate liquidity needs. We believe that our compliance monitoring policies and procedures will be adequate to enable us to remain in compliance with the program requirements.
Credit Risk
The risk inherent in our loan and lease portfolios is driven by credit quality and is affected by borrower-specific and economy-wide factors such as changes in employment. We manage this risk through our underwriting and credit approval guidelines and servicing policies and practices, as well as geographic and manufacturer concentration limits.
Our automated originations process reflects a disciplined approach to credit risk management. Our robust historical data on both organically originated and acquired loans provides us with the ability to perform advanced
76
Table of Contents
loss forecasting. Each applicant is automatically assigned a proprietary loss forecasting score (“LFS”) using information such as FICO®, debt-to-income ratio, loan-to-value ratio, and over 30 other predictive factors, placing the applicant in one of 100 pricing tiers. The pricing in each tier is continuously monitored and adjusted to reflect market and risk trends. In addition to our automated process, we maintain a team of underwriters for manual review, consideration of exceptions, and review of deal structures with dealers. We generally tighten our underwriting requirements in times of greater economic uncertainty (including during the recent financial crisis) to compete in the market at loss and approval rates acceptable for meeting our required returns. We have also adjusted our underwriting standards to meet the requirements of our contracts such as the Chrysler agreement. In both cases, we have accomplished this by adjusting our risk-based pricing, the material components of which include interest rate, down payment, and loan-to-value.
We monitor early payment defaults and other potential indicators of dealer or customer fraud, and use the monitoring results to identify dealers who will be subject to more extensive stipulations when presenting customer applications, as well as dealers with whom we will not do business at all.
As part of our plan for minimizing credit losses from our new dealer lending product line, we will conduct periodic inventories, generally without advance notice to the dealer, of the collateral for floorplan lines of credit we have extended. We also will reevaluate the creditworthiness of each dealer with an outstanding balance on at least an annual basis, and more often if events indicate a possible decline in creditworthiness.
See additional discussion of our servicing approach in “Business.”
Collateral Risk
Our lease portfolio presents an inherent risk that residual values recognized upon lease termination will be lower than those used to price the contracts at inception. Although we have elected not to purchase residual value insurance, our residual risk is somewhat mitigated by our residual risk-sharing agreement with Chrysler, as all of our leases are originated under terms of the Chrysler Agreement with Chrysler. We also utilize industry data, including the Automotive Lease Guide (“ALG”) benchmark for residual values, and employ a team of individuals experienced in forecasting residual values.
Similarly, lower used vehicle prices also reduce the amount we can recover when remarketing repossessed vehicles that serve as collateral underlying loans. We manage this risk through loan-to-value limits on originations, monitoring of new and used vehicle values using standard industry guides, and active, targeted management of the repossession process.
Legal and Compliance Risk
We must comply with the significant number of laws and regulations governing the consumer finance industry and, specifically, consumer protection. Compliance with applicable law is costly and can affect operating results. Compliance also requires a robust framework of governance and controls, which may create operational constraints.
To manage our legal and compliance risk, we maintain an extensive compliance, internal control, and monitoring framework, which includes the gathering of corporate control performance threshold indicators, Sarbanes-Oxley testing, monthly quality control tests, ongoing compliance monitoring with all applicable regulations, internal control documentation and review of processes, and internal audits. We also utilize internal and external legal counsel for expertise when needed. All associates upon new hire and annually receive comprehensive mandatory regulatory compliance training. In addition, the board of directors receives annual regulatory and compliance training. We use industry-leading call mining and other software solutions that assist us in analyzing potential breaches of regulatory requirements and customer service. Our call mining software analyzes all customer service calls, converting speech to text and mining for specific words and phrases that may
77
Table of Contents
indicate inappropriate comments by a representative. The software also detects escalated voice volume, enabling a supervisor to intervene if necessary. This tool enables us to effectively manage and identify training opportunities for associates, as well as track and resolve customer complaints through a robust quality assurance program. An example of another system control to mitigate compliance risk is that our customer dialing system has been programmed based on regulatory requirements to not permit dialing a customer phone number outside of permissible time periods or that already has been called the maximum number of times that day.
Operational and Technological Risk
We are exposed to loss that occurs in the process of carrying out our business activities. These relate to failures arising from inadequate or failed processes, failures in our people or systems, or from external events. Our operational risk management program encompasses risk event reporting, analysis, and remediation; key risk indicator monitoring; and risk profile self-assessments.
Foreign Exchange Risk
As we do not currently operate in foreign markets, substantially all of our vendors are based in the United States, and we have only one employee outside of the United States (an employee in Canada working to establish our presence in that country). As a result, we do not currently have material exposure to currency fluctuations.
Inflation Risk
The risk of inflation does not have a significant impact on our business.
Critical Accounting Policies and Significant Judgments and Estimates
The preparation of financial statements in conformity with accounting principles generally accepted in the U.S. requires management to make estimates and assumptions which affect the reported amounts of assets and liabilities and the disclosures of contingent assets and liabilities as of the date of the financial statements and the amount of revenue and costs and expenses during the reporting periods. Actual results could differ from those estimates and those differences may be material. The accounting estimates that we believe are the most critical to understanding and evaluating our reported financial results include the following:
Retail Installment Contracts
Retail installment contracts consist largely of nonprime automobile finance receivables, which are acquired individually from dealers at a nonrefundable discount from the contractual principal amount. Retail installment contracts also include receivables originated through a direct lending program and loan portfolios purchased from other lenders. Retail installment contracts acquired individually or originated directly are primarily classified as held-for-investment and carried at amortized cost, net of allowance for loan losses. Most of our retail installment contracts are pledged under warehouse lines of credit or securitization transactions. Retail installment contracts we do not have the intent and ability to hold for the foreseeable future or until maturity or payoff are classified as held for sale and carried at the lower of cost or market, as determined on an aggregate basis.
Interest is accrued when earned in accordance with the terms of the retail installment contract. The accrual of interest is discontinued and reversed once a retail installment contract becomes more than 60 days past due, and is resumed and reinstated if a delinquent account subsequently becomes 60 days or less past due. The amortization of discounts, subvention payments from manufacturers, and origination costs on retail installment contracts held for investment acquired individually or through a direct lending program are recognized as adjustments to the yield of the related contract using the effective interest method. We estimate future principal prepayments and defaults in the calculation of the constant effective yield.
78
Table of Contents
A portion of the discount received on contracts purchased from other lenders is attributable to the expectation that not all contractual cash flows will be received from the borrowers. These loans are accounted for in accordance with FASB ASC 310-30, Loans and Debt Securities Acquired with Deteriorated Credit Quality. The excess of the estimated undiscounted principal, interest, and other cash flows expected to be collected over the initial investment in the acquired loans, or accretable yield, is accreted to interest income over the expected life of the loans using the effective interest rate method. The nonaccretable difference, or excess of contractually required payments over the estimated cash flows expected to be collected, is not accreted into income.
Any deterioration in the performance of the purchased portfolios results in an incremental provision for loan losses. Improvements in performance of the purchased pools that significantly increase actual or expected cash flows result first in a reversal of previously recorded allowance for loan losses and then in a transfer of the excess from nonaccretable difference to accretable yield, which will be recorded as finance income over the remaining life of the receivables.
Unsecured Consumer Loans, net
Unsecured consumer loans, net, consist of both revolving and amortizing term finance receivables acquired individually under terms of the Company’s agreements with certain third parties who originate and continue to service the loans. Certain of the revolving receivables were acquired at a discount. Unsecured consumer loans are classified as held-for-investment and carried at amortized cost, net of allowance for loan losses.
Interest is accrued when earned in accordance with the terms of the contract. The accrual of interest on amortizing term receivables is discontinued and reversed once a receivable becomes past due more than 60 days, and is resumed and reinstated if a delinquent account subsequently becomes 60 days or less past due. The accrual of interest on revolving unsecured loans continues until the receivable becomes 180 days past due, at which point the principal amount and interest are charged off. The amortization of discounts is recognized straight-line over the estimated period over which the receivables are expected to be outstanding.
Receivables from Dealers
Receivables from dealers include floorplan loans provided to dealerships to finance new and used vehicles for their inventory. Receivables from dealers also include real estate loans and working capital revolving lines of credit. Interest on these loans is accrued when earned in accordance with the agreement with the dealer. Receivables from dealers we do not have the intent and ability to hold for the foreseeable future or until maturity or payoff are classified as held for sale and carried at the lower of cost or market, as determined on an aggregate basis.
Dealers with floorplan loans are permitted to deposit cash with the Company in exchange for a lower interest rate. This cash is commingled with the Company’s other cash and available for general use.
Provision for Loan Losses
Provisions for loan losses are charged to operations in amounts sufficient to maintain the loan loss allowance at a level considered adequate to cover probable credit losses inherent in the portfolio. Probable losses are estimated based on contractual delinquency status and historical loss experience, in addition to the Company’s judgment of estimates of the value of the underlying collateral, bankruptcy trends, economic conditions such as unemployment rates, changes in the used vehicle value index, delinquency status, historical collection rates and other information in order to make the necessary judgments as to probable loan losses.
Retail installment contracts acquired individually are charged off against the allowance in the month in which the account becomes 120 days contractually delinquent if we have not repossessed the related vehicle. We charge off accounts in repossession when the automobile is repossessed and legally available for disposition. A charge-off represents the difference between the estimated net sales proceeds and the amount of the delinquent
79
Table of Contents
contract. Accounts in repossession that have been charged off and are pending liquidation are removed from retail installment contracts and the related repossessed automobiles are included in repossessed vehicles and other assets in our consolidated balance sheets.
Term and revolving unsecured consumer loans are charged off against the allowance in the month in which the accounts become 120 and 180 days contractually delinquent, respectively.
In addition to maintaining a general allowance based on risk ratings, receivables from dealers are evaluated individually for impairment with specific reserves established for receivables determined to be individually impaired. Receivables from dealers are charged off against these reserves at management’s discretion based on the dealer’s individual facts and circumstances.
Leased Vehicles, net
Vehicles for which we are the lessor are classified as operating leases, as they do not meet the accounting requirements to be classified as a capital lease. The net capitalized cost of each lease is recorded as an asset and depreciated on a straight-line basis over the contractual term of the lease to the expected residual value. The expected residual value and, accordingly, the monthly depreciation expense may change throughout the term of the lease. We estimate expected residual values using independent data sources and internal statistical models that take into consideration economic conditions, current auction results, our remarketing abilities, and manufacturer vehicle and marketing programs.
Lease payments due from customers are recorded as income until and unless a customer becomes more than 60 days delinquent, at which time the accrual of revenue is discontinued and reversed. The accrual is resumed and reinstated if a delinquent account subsequently becomes 60 days or less past due. Subvention payments from the manufacturer, down payments from the customer, and initial direct costs incurred in connection with originating the lease are amortized on a straight-line basis over the contractual term of the lease. We periodically evaluate our investment in operating leases for impairment if circumstances, such as a general decline in used vehicle values, indicate that an impairment may exist.
Income Taxes
Income tax expense consists of income taxes currently payable and deferred income taxes computed using the asset and liability method. Under the asset and liability method, deferred tax assets and liabilities are recognized for the future tax consequences attributable to differences between the financial statement carrying amounts of existing assets and liabilities and their respective tax bases. The deferred tax asset is subject to reduction by a valuation allowance in certain circumstances. This valuation allowance is recognized if it is more likely than not that some portion or all of the deferred tax asset will not be realized based on a review of available evidence. Deferred tax assets and liabilities are measured using enacted tax rates expected to apply to taxable income in the years in which those temporary differences are expected to be recovered or settled. The effect on deferred tax assets and liabilities of a change in tax rates is recognized in income in the period that includes the enactment date.
Periodic reviews of the carrying amount of deferred tax assets are made to determine if the establishment of a valuation allowance is necessary. If, based on the available evidence, it is more likely than not that all or a portion of our deferred tax assets will not be realized, a deferred tax valuation allowance is established. Consideration is given to all positive and negative evidence related to the realization of the deferred tax assets. Factors considered in this evaluation include historical financial performance, expectation of future earnings of an appropriate character, the ability to carry back losses to recoup taxes previously paid, length of statutory carryforward periods, tax planning strategies, and timing of reversals of temporary differences. Significant judgment is required in assessing future earnings trends and the timing of reversals of temporary differences. The evaluation is based on current tax laws as well as expectations of future performance.
80
Table of Contents
Overview
We are a full-service, technology-driven consumer finance company focused on vehicle finance and unsecured consumer lending products. Since our founding in 1995, we believe that we have achieved strong brand recognition in the nonprime vehicle finance space and have recently increased our presence in the prime space. We continually strive to build mutually beneficial relationships in the consumer finance industry that expand our franchise. For example, in February 2013, we entered into a ten-year agreement with Chrysler whereby in May we began originating private-label loans and leases under our Chrysler Capital brand to facilitate Chrysler vehicle retail sales to consumers and Chrysler-franchised automotive dealers. In addition, we have several relationships through which we provide unsecured consumer loans. We have developed sophisticated, proprietary software applications that leverage our knowledge of consumer behavior across the full credit spectrum. Our platforms allow us to effectively price and manage risk by origination channel and closely monitor our risk-adjusted margins and excess spread. As a result of our deep understanding of the market, we have consistently produced controlled growth and robust profitability in both economic expansions and downturns.
We believe our extensive data and advanced analytics tools enhance our proprietary loan origination, servicing and risk management platforms. We believe that these platforms are technologically sophisticated, readily expandable and easily adaptable to a diverse set of consumer finance products. We also believe that our scalable platforms will allow us to significantly expand our product offerings in both the vehicle finance and unsecured consumer lending markets to originate and service loans and leases at attractive costs. Led by our experienced and disciplined management team, we have significantly increased our origination volume and our portfolio over the past three years, demonstrating our ability to rapidly grow our asset base without having to significantly invest in new infrastructure or compromise our credit performance. In addition to originations, we have acquired and/or converted over $34 billion of assets to our lending platform since 2008.
Historically, we have originated loans primarily through franchised automotive dealers for manufacturers such as Chrysler, Ford, General Motors, and Toyota in conjunction with the sale of new and used vehicles to retail consumers. We currently have active relationships with over 14,000 such franchises and dealers throughout the United States. In February 2013, we entered into a ten-year agreement with Chrysler whereby we originate private-label loans and leases under the Chrysler Capital brand to facilitate Chrysler vehicle retail sales. We also originate loans and leases through selected independent automobile dealers, such as CarMax, from national and regional banks as well as through relationships with other OEMs. Additionally, we directly originate and refinance vehicle loans via our branded online platform, RoadLoans.com, which is available through major online affiliates including Cars.com, AutoTrader.com, Kelley Blue Book, and eBay Motors. Moreover, we periodically purchase vehicle loan portfolios from other lenders.
Vehicle loans, leases, and dealer loans originated through our relationships with OEMs represent a significant source of growth for our vehicle finance business. Under our Chrysler Capital brand, we expect to significantly grow our vehicle finance portfolio, which we expect will more than offset the run-off of previously acquired portfolios, diversify the types of vehicle finance products that we offer, and continue to increase the volume of new vehicle financings. For the three months ended September 30, 2013, new vehicle financings as a percentage of our originations increased from approximately 10% – 20% historically to approximately 40%. Under the Chrysler Capital brand, we originate vehicle loans and leases across the full credit spectrum, and provide dealer loans to Chrysler-franchised automotive dealers. We have entered into flow agreements in connection with the loans we originate through Chrysler Capital. For those loans, we retain the servicing rights at contractually agreed-upon rates, which provides us with an additional and stable fee income stream. We also believe that we can provide substantial benefits to our OEM partners. According to JD Power’s Power Information Network® data, our partnership with Chrysler has helped Chrysler’s market share in the sub-650 FICO® vehicle space compared to other OEMs increase to first in September 2013 from fourth in February 2010. We continue to evaluate opportunities for new OEM relationships in addition to Chrysler, as well as new flow agreements.
81
Table of Contents
We also provide unsecured consumer loans. Recently, we have entered into relationships with Bluestem, a retailer, and LendingClub, a peer-to-peer lending platform, to acquire and, in certain circumstances, service unsecured consumer loans. In addition, we are actively utilizing our deep understanding of underwriting consumer finance assets and our technologically advanced operating and servicing platforms to expand into private label credit cards and other unsecured consumer finance products. As an example of this, we have recently entered into a strategic relationship with a technology provider to obtain and process credit applications of retail store customers, including those rejected by the primary lender.
Santander is our largest shareholder, a leader in the banking and consumer finance industries and, as of September 30, 2013, the largest bank in the Eurozone by market capitalization. We derive significant benefits from our relationship with Santander, including liquidity support and shared best practices in compliance and risk management. During the credit crisis that began in 2008, Santander maintained its commitment to us. We have benefitted from our strong relationship with Santander, which provided us with financing to opportunistically acquire and/or convert several large portfolios of loans and certain operations from institutions including CitiFinancial Auto, Triad Financial, HSBC Auto, and GE Capital (RV/marine portfolio). Santander has demonstrated its continuing commitment to us by extending $4.5 billion in credit facilities with terms of three to five years, which have yearly renewal options, as well as a $0.5 billion letter of credit facility.
We have significant access to the capital markets: we have issued and sold over $26 billion in securitization transactions since 2010, obtained approximately $13.7 billion in committed credit lines and privately issued amortizing notes from large commercial banks, and entered into material flow agreements with leading commercial banks. In 2011, funds managed by three of the world’s leading private equity investment firms, Centerbridge Partners, L.P., Kohlberg Kravis Roberts & Co. L.P., and Warburg Pincus LLC, purchased $1.0 billion of newly issued common stock.
Our Markets
The consumer finance industry in the United States has approximately $2.5 trillion of outstanding borrowings and includes vehicle loans and leases, credit cards, home equity lines of credit, private student loans, and personal loans. As economic conditions have recovered from the 2008 and 2009 downturn, there has been a significant demand for consumer financing, particularly to finance vehicle sales.
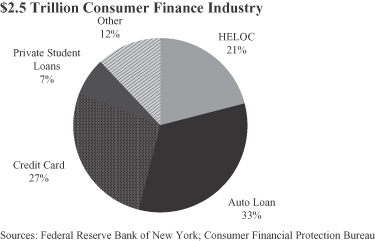
Our primary focus is the vehicle finance segment of the U.S. consumer finance industry. Vehicle finance includes loans and leases taken out by consumers to fund the purchase of new and used automobiles, as well as motorcycles, RVs, and watercraft. Within the vehicle finance segment, we maintain a strong presence in the auto finance market. The auto finance market features a fungible product resulting in an efficient pricing market, but it
82
Table of Contents
is highly fragmented, with no individual lender accounting for more than 10% of market share. As of September 30, 2013, there were approximately $850 billion of auto loans outstanding.
Through the recent economic downturn, auto loans generally were not as adversely impacted as most other consumer lending products. This performance was largely attributable to several factors, including: (i) the importance that automobiles serve in consumers’ everyday lives; (ii) the ability to locate, repossess and sell a vehicle to mitigate losses on defaulted loans; and (iii) the robustness of the used car market and residual values. This latter factor is subject to fluctuations in the supply and demand of automobiles. The primary metric used by the market to monitor the strength of the used car market is the Manheim Used Vehicle Index, a measure of wholesale used car prices adjusted by their mileage or vintage. As of September 30, 2013, used car financing represented 73% of our outstanding retail installment contracts of which 87% consisted of nonprime auto loans. The Manheim Used Vehicle Index has recently been well above historical norms and during the recent economic downturn rebounded in nine months while the broader economy took several years to rebound. This strength in the used car market reflects the importance of cars to U.S. consumers.
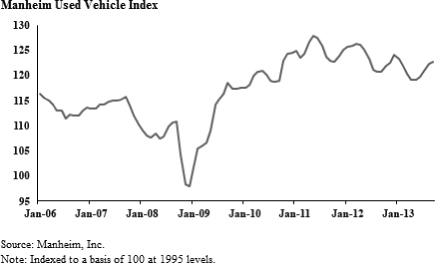
Historically, used car financing has made up a majority of our business. Used automobiles accounted for 74% of total automobiles sold in the United States in 2012. In the second quarter of 2013, approximately 53% of used car purchases were financed. Most loans in the used auto finance space are extended to nonprime consumers, who comprise a significant portion of the U.S. population. Of the approximately 200 million Americans with a credit history, 34% have FICO® scores below 650. Although nonprime auto loans typically
83
Table of Contents
produce higher losses than prime loans, our data-driven approach, extensive experience, and adaptive platform have enabled us to accurately project cash flows and effectively price loans for their inherent risk.
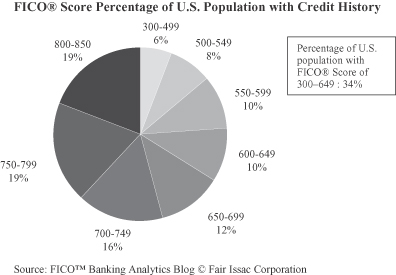
Through our Chrysler Capital brand, we are increasing our focus on the new auto finance space by providing financing for the acquisition of new Chrysler cars. The new auto market continues to recover from the recent economic downturn. There were 14.4 million new cars sold in 2012, which was an increase of 39% over the number of new cars sold in 2009. Of total new auto sales in the second quarter of 2013, approximately 85% were financed. Future growth of new auto sales in the United States, and the parallel growth of consumer loans and leases to finance those sales, are driven by improving economic conditions, new automobile product offerings, and the need to replace aging automobiles. During 2012, the average age of U.S. autos reached an all-time high of 11.2 years. Chrysler Capital loan and lease growth will be driven by the volume of new Chrysler cars sold in the United States.
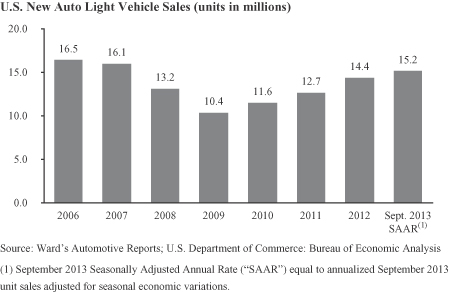
84
Table of Contents
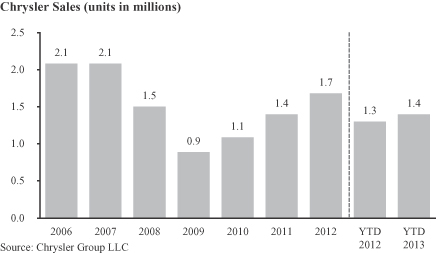
We are a leading originator of nonprime auto loans. National and regional banks have historically been the largest originators of used and nonprime vehicle loans and leases due to their broad geographic footprint and wide array of vehicle finance products. We primarily compete against national and regional banks, as well as automobile manufacturers’ captive finance businesses, to originate loans and leases to finance consumers’ purchases of new and used cars.
The unsecured consumer lending market, including credit cards, private student loans, point-of-sale financing, and personal loans, represents a significant expansion opportunity for us within the U.S. consumer finance industry. From a recent high in 2008, the U.S. consumer has steadily faced declining access to traditional sources of consumer credit. This decline is evidenced by the reduction of outstanding consumer credit card limits by approximately $865 billion and of home equity lines of credit by over approximately $370 billion since 2008. During the recent economic downturn, traditional lenders were forced to tighten credit and, in some cases, exit the market altogether, leaving a large market opportunity with significant growth potential. Additionally, consumer loan demand is recovering and, on average, most domestic bank lenders have reported stronger demand for consumer loans since April 2011. Imbalances in supply and demand have created a significant opportunity for companies like us who have national scale, financial strength, stability of management, strong credit and underwriting processes, and an appetite for identifying incremental lending opportunities.
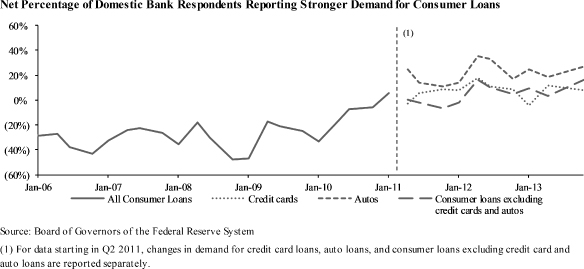
85
Table of Contents
In both the vehicle finance and unsecured consumer lending markets, we generate originations indirectly and directly. The indirect model requires relationships with third parties who are generally active in the market, are looking for an additional source of financing for their customers, and agree to direct certain customers to SCUSA. The direct model requires an internally-managed platform through which consumers are able to make requests for credit directly to SCUSA. While we have historically focused on the indirect model, we are growing our direct presence in the vehicle finance market through our RoadLoans.com platform and we are currently building out our unsecured consumer lending platform. Additionally, we continue to develop new relationships with third parties to further broaden our origination channels within these markets.
Our Strengths
We believe the following are our most significant competitive strengths:
Technology-Driven Platforms Drive Superior Credit and Operational Performance. Throughout our history we have made significant investments in the technology underlying our origination, servicing and risk management platforms in order to be nimble and adapt quickly to market forces and changes in performance data. We have internally developed proprietary software applications that we believe are highly effective and leverage nearly 20 years of consumer behavior across the full credit spectrum. These systems enable us to effectively price, manage, and monitor risk on a real-time basis and at a highly granular level, including by vintage, origination channel, brand, and location where the loan or lease was originated. Our internally generated data, acquired historical credit data and extensive third-party data are utilized to continuously adapt our origination, servicing and risk management platforms to evolving consumer behavior and product performance. The strength of our platforms is demonstrated by our proactive decision to tighten credit standards prior to the recent economic downturn and by our successful acquisition and/or conversion of over $34 billion of assets onto our platform since 2008. During the first half of 2007, we began to notice upward trends in early payment default rates, leading to a decision to tighten extensions of credit. As a result, in the third quarter of 2007, we made significant changes to the higher-risk segment of our portfolios, including minimizing no-cash-down loans and loans with high payments and high payment-to-income ratios (which resulted in a reduction in origination volume). We continued to tighten our credit standards throughout 2008 and 2009, and closely monitor the data we collect through our servicing and origination platforms to refine our underwriting criteria. Another benefit of our technology-driven platform is that it allows us to move quickly. For example, in 2010 we onboarded a portfolio of $14.4 billion in assets in just four months.
Our data-driven approach, extensive experience and adaptive platform have enabled us to accurately project cash flows and develop our leadership in the industry for a period of nearly 20 years. We believe that our proprietary credit scoring system helps us maximize originations by appropriately applying risk-adjusted pricing for any given consumer’s credit profile through economic cycles. Our proprietary credit scoring system, “LFS,” takes into account 36 unique attributes, including FICO®, time at residence, time at job, loan-to-value, payment-to-income, collateral attributes, dealer attributes, and economic factors, and we believe it has a higher predictive power regarding consumers’ willingness and ability to pay their debts than FICO®, a conventional measure of consumer creditworthiness, alone. In addition, our scalable technology platform allows us to expand our existing relationships and explore new relationships at low marginal cost.
Growth-Oriented Business Model. We believe our business model and strategic third-party relationships will continue to attract new channels for origination volume growth and increase our penetration in the markets we serve. We have demonstrated the ability to capture growth and opportunities for diversification within the consumer finance industry, having successfully built mutually beneficial relationships with Chrysler, CarMax, other national automotive dealer groups, national and regional banks through their private label auto loan programs, and others. The flexibility of our platform has allowed us to expand our vehicle finance product offerings through the Chrysler Capital brand to include prime vehicle loans, vehicle leases, and dealer loans. Additionally, we believe we can quickly and efficiently provide similar or expanded offerings for others, including OEMs and consumer lenders. Further, our knowledge of consumer behavior across the full credit
86
Table of Contents
spectrum and our technologically sophisticated origination and servicing platforms will continue to facilitate our expansion of unsecured consumer lending and servicing.
We believe that our business and the underlying systems are highly scalable, thereby enabling growth through new and existing channels. From December 31, 2008 to September 30, 2013, our total assets grew by 424% while maintaining an efficiency ratio of between 16% and 22%. We currently process 7 million credit applications annually and handle 1.4 million phone calls per day. Further, we believe our systems have the capacity to handle growth of 4x the current portfolio.
Our diverse array of origination channels coupled with our flexible technology platforms enables us to seamlessly shift loan production to take advantage of changing market conditions to maximize returns and minimize credit risk. For the first nine months of 2013, our average nonprime capture rate was only 8% and our prime capture rate averaged 18% since the start of the Chrysler Agreement in May 2013. Management continually evaluates each origination channel for anomalies in expected credit performance and utilizes available tools to remedy the anomaly, including fraud investigations or pricing and volume adjustments. At the same time, other available origination channels may be experiencing more attractive market conditions than other channels, allowing management to increase originations through those channels and continue to drive profitable, risk-adjusted growth.
Robust Financial Performance. We have been profitable every year for the last ten years, including throughout the recent economic downturn. We believe this consistent profitability can be attributed to our credit analysis, pricing discipline, and efficient low-cost structure. From 2005 to 2012, average profit per loan by vintage never dropped below $1,000. Our lending experience, deep understanding of consumer behavior across the full credit spectrum and rigorous business processes help us manage risk and insulate us from swings in the economic and consumer credit cycles. In addition, while portions of our nonprime customer base produce relatively high losses, we structure and apply risk-adjusted pricing to these loans to produce a consistent return on capital. Supported by our robust financial profile, we delivered an average return on assets of 3.9% from 2009 to 2012 and a return on total common equity of more than 30% in each of those years, and have continued to deliver similar levels of return on assets and equity in 2013, which we believe provides us with the ability to support our growth organically and return capital to our shareholders.
Deep Access to Committed Funding. We also maintain diverse and stable financing sources, and have demonstrated significant access to the broader capital markets. We have issued and sold over $26 billion of ABS since 2010, and we were the largest U.S. issuer of retail auto ABS in 2011, 2012, and in 2013. We have significant bank funding relationships, with third-party banks and Santander currently providing $13.7 billion and $4.5 billion in committed financing, respectively. We also have a $17 billion retail flow agreement in place with Bank of America and a dealer lending flow agreement in place with SBNA whereby we provide SBNA with the first right to review and assess Chrysler dealer lending opportunities and, if SBNA elects, to provide the proposed financing. We provide servicing, for a fee, on all loans originated under these arrangements. Further, we have been able to attract a substantial amount of third-party capital from our private equity sponsors.
Strong Relationship with Santander. We believe that our relationship with Santander, our largest shareholder (through SHUSA) and a premier global bank, offers us significant competitive advantages. As of September 30, 2013, Santander was the largest bank in the Eurozone by market capitalization. In addition, Santander, operating through Santander Consumer Finance’s pan-European platform, is one of the top three consumer lending companies and is a leading non-captive vehicle lender in twelve European countries. Through Santander Consumer Finance, Santander continues to demonstrate its commitment to vehicle finance, as evidenced by its eleven current global OEM relationships and large vehicle loan portfolio. We may in the future look to benefit from Santander’s strong relationships with global OEMs. Santander, a deposit-funded lender, has also provided us with significant funding support, both through existing committed liquidity and opportunistic extensions of credit. For example, during the recent economic downturn, Santander and its affiliates provided us
87
Table of Contents
with substantial liquidity that enabled us to complete several significant acquisitions and conversions of consumer assets. In addition, because of our relationship with Santander, we are subject to the oversight of the Federal Reserve. We believe that this regulatory oversight has led us to develop and maintain extensive risk management and reporting procedures, and has helped us to continually adapt our business to meet the evolving regulatory requirements for consumer finance in the United States.
Experienced Management Team. We have a highly respected management team that is focused on the continued success and growth of our business. Our company is led by one of our founders, Thomas Dundon, who currently serves as our Chief Executive Officer. Mr. Dundon has approximately 20 years of experience in the consumer finance industry. In addition, Jason Kulas, our President and Chief Financial Officer, has approximately 18 years of experience in the financial services industry and seven years of experience as our Chief Financial Officer. Mr. Dundon maintains a meaningful equity stake in SCUSA and, after giving effect to this offering, he will continue to own approximately % of our outstanding common stock as well as options to purchase an additional % of our common stock. In addition, the remainder of our senior management team in the aggregate will own approximately % of our common stock and options to purchase an additional % of our common stock after this offering. Our senior management team brings an average of over 16 years of experience across the financial services and consumer industries. They have demonstrated their ability to ably steer the company through economic expansions as well as downturns, as evidenced by our strong financial performance during the 2008 and 2009 downturn. Our management team is fully committed to our entrepreneurial spirit, attracting and developing talent, the implementation of best practices in risk management, corporate governance, regulatory compliance, financial accountability and effective system control.
Our Business Strategy
Our primary goal is to create stockholder value by leveraging our systems, data, liquidity, and management. Our growth strategy is to increase market penetration in the consumer finance industry while deploying our capital and funding efficiently.
Expand Our Vehicle Finance Franchise
Organic Growth in Indirect Auto Finance. We have a deep knowledge of consumer behavior across the full credit spectrum and are a key player in the U.S. vehicle finance market. We have the ability to continue to increase our market penetration in the vehicle finance market, subject to attractive market conditions, via the number and depth of our relationships. We plan to achieve this in part through rolling out alliance programs with national vehicle dealer groups and financial institutions, including banks, credit unions, and other lenders, in both the prime and nonprime vehicle finance markets. Our technology-based platform enables us to integrate seamlessly with other originators and thereby benefit from their channels and brands. Additionally, we are evaluating new indirect auto finance opportunities across both North and South America.
Strategic Alliances with OEMs. We plan to expand our existing OEM relationships and develop future relationships with other OEMs to drive incremental origination volume. The loans and leases originated through Chrysler Capital should provide us with the majority of our near-term expected growth. In addition, the experience gained in lease and dealer financing can be applied to improve origination volume through the rest of our dealer base. Our relationship with Chrysler has accelerated our transformation into a full-service vehicle finance company that provides financial products and services to consumers and automotive dealers. In addition to the Chrysler Agreement, we have a pilot program with another OEM, pursuant to which we serve as a preferred finance provider for certain dealers in certain geographic markets.
Growth in Direct-to-Consumer Exposure. We are working to further diversify our vehicle finance product offerings by expanding our web-based, direct-to-consumer offerings. We are seeking to engage the consumer at the early stages of the car buying experience. Our RoadLoans.com program is a preferred finance resource for many major vehicle shopping websites, including Cars.com, AutoTrader.com, Kelley Blue Book, and eBay
88
Table of Contents
Motors, each of which have links on their websites promoting our RoadLoans.com website for financing. We will continue to focus on securing relationships with additional vehicle-related websites. We anticipate that the next generation of our web-based direct-to-consumer offerings will include additional strategic relationships, an enhanced online experience, and additional products and services to assist with all stages of the vehicle ownership life cycle, including research, financing, buying, servicing, selling, and refinancing.
Expansion of Fee-Based Income Opportunities. We seek out opportunities to leverage our technologically sophisticated and highly adaptable servicing platform for both prime and nonprime loans, as well as other vehicle finance (including RV and marine) and unsecured consumer lending products. We collect fees to service loan portfolios for third parties, and we handle both secured and unsecured loan products across the full credit spectrum. Loans sold to or sourced to third-party banks through flow agreements (including our flow agreements with Bank of America and SBNA) also provide additional opportunities to service large vehicle loan pools. Additionally, we are exploring the possibility of expanding our loan servicing activities in North and South America by leveraging our existing relationships with Chrysler, as well as Santander and other banks in these regions. We believe our loan servicing business is scalable and provides an attractive return on equity, and we intend to continue to develop new third-party relationships to increase its size. In 2013, as of September 30, we have added over $1 billion of assets to our portfolio of assets serviced for others.
Continue to Grow Our Unsecured Consumer Lending Platform
We are further diversifying our business through our strategic relationships in the unsecured consumer lending space, which includes point-of-sale financing, personal loans, and private label credit cards. Unsecured consumer lending is a rapidly growing segment of the consumer finance market in the United States, and we expect that financing in the unsecured consumer loan space will significantly contribute to our growth. For the nine months ended September 30, 2013, we originated approximately $0.7 billion in unsecured consumer loans. Our ability to offer these products is derived from our deep knowledge of consumer behavior across the full credit spectrum, our scalable technology platform and Santander’s expertise in the unsecured consumer lending industry. One of our principal strategic consumer finance relationships is with Bluestem, which owns the Fingerhut®, Gettington.com™ and PayCheck Direct® brands. Bluestem’s customers rely on Bluestem proprietary credit products at the point of sale to make purchases. Through our agreement with Bluestem, we have the option to purchase certain loans through April 2020. Additionally, we have a strategic relationship with LendingClub, pursuant to which we invest in or purchase personal loans and have the right to purchase nonprime loans as well, and have recently begun originating private label revolving lines of credit through our relationship with another point-of-sale lending technology company. We also have a pipeline of private label credit card initiatives we expect to pursue. We believe these relationships and initiatives provide us with a strong entry point into the unsecured consumer lending space.
History
We were founded by a group of entrepreneurs within the auto industry, including our CEO, Thomas Dundon. The group gained experience working in finance in auto dealerships, and in 1995 left the dealership environment to start a new company focused on the finance side of the industry. As a non-originator, the new company marketed the auto finance programs of various banks, gaining valuable perspective on the originations process.
The success of the group caught the attention of FirstCity Financial and in 1998 our entrepreneurial partnership joined with FirstCity Financial to form FirstCity Funding, a nonprime auto finance company with a unique business model serving a niche market. FirstCity Funding grew quickly and in 2000 our ownership group expanded to include HBOS plc., and we officially became Drive Financial Services LP (“Drive”).
In 2004, FirstCity Financial sold its interest in Drive, shifting ownership to HBOS plc and Drive Management, LP. The stability and strength of HBOS plc allowed Drive to surpass expectations and continue to
89
Table of Contents
grow at a rapid pace. HBOS plc helped develop Drive’s information technology infrastructure, compliance organization and data warehouse, which has been the backbone of our operational success in recent acquisitions. In 2006, HBOS plc and certain members of Drive Management, LP sold their interest to Santander, forming SCUSA Illinois.
In 2009, Santander contributed its interest in us to SHUSA and until December 31, 2011, we were owned 91.5% by SHUSA and 8.5% by Mr. Dundon. In late 2011, we completed an infusion of $1.16 billion in capital from funds managed by our private equity sponsors, Mr. Dundon, and our Chief Financial Officer. This resulted in the private equity sponsors owning approximately 24% of our stock, with SHUSA continuing to own approximately 65%, and Mr. Dundon owning approximately 11%.
In July 2013, Santander Consumer USA Holdings Inc. and SCUSA Merger Sub were formed solely for the purpose of effecting this offering. Immediately prior to the closing of this offering, SCUSA Merger Sub will merge with and into SCUSA Illinois, with SCUSA Illinois continuing as the surviving corporation and a wholly owned subsidiary and operating company of Santander Consumer USA Holdings Inc., the registrant. In the merger, all of the outstanding shares of common stock of SCUSA Merger Sub will be converted into shares of SCUSA Delaware common stock on a for basis. See “Reorganization.”
Our Products and Services
We offer vehicle-related financing products and services and, beginning in the first quarter of 2013, unsecured consumer financing.
Vehicle Finance
Our vehicle finance products and services include loans and leases to consumers and dealer loans.
Consumer Vehicle Loans
Our primary business is to indirectly originate vehicle loans through automotive dealerships throughout the United States. We currently do business with over 14,000 dealers, over 95% of whom are manufacturer-affiliated and the remainder of whom are selected large and reputable independent dealers. We use our risk-adjusted methodology to determine the price we pay the automotive dealer for the loan, which may be above or below the principal amount of the loan depending on characteristics such as the contractual APR, the borrower’s credit profile and the tenor of the loan. The consumer is obligated to make payments in an amount equal to the principal amount of the loan plus interest at the APR negotiated with the dealer. In addition, the consumer is also responsible for charges related to past-due payments. Dealers typically retain some portion of the finance charge as income. Our agreements with dealers place a limit on the amount of the finance charges they are entitled to retain. Although we do not own the vehicles we finance through loans, we hold a perfected security interest in those vehicles. Loans with below-market APRs are frequently offered through manufacturer incentive programs. The manufacturer will compensate the originator of these loans for the amount of the financing rate that is below market. These payments are called rate subvention. We are entitled to receive rate subvention payments as Chrysler’s preferred provider through the Chrysler Agreement.
Since 2008, we also have directly originated loans through our branded online RoadLoans.com platform, and we also periodically acquire large portfolios of loans. The loans acquired in bulk acquisitions have primarily been collateralized by automobiles. However, a small amount of such loans have been collateralized by marine and RVs. We generate revenue on these loans through finance charges.
Vehicle Leases
We acquire leases from Chrysler-affiliated automotive dealers and, as a result, become the titleholder for the leased car. The acquisition cost for these leases is based on the underlying value of the vehicle, the contractual
90
Table of Contents
lease payments and the residual value, which is the expected value of the vehicle at the time of the lease termination. We use projected residual values that are estimated by third parties, such as ALG. The residual value we use to determine lease payments, or the contractual residual value, may be upwardly adjusted as part of marketing incentives provided by the manufacturer of the vehicle. When a contractual residual value is written up, the lease payments we offer may become more attractive to consumers. The marketing incentive payment that manufacturers pay is equal to the expected difference between the projected ALG residual value and the contractual residual value. This residual support payment is a form of subvention. We are a preferred provider of subvented leases through Chrysler Capital. The consumer, or lessee, is responsible for the contractual lease payments and any excessive mileage or wear and tear on the car that results in a lower residual value of the car at the time of the lease’s termination. In addition, the consumer is also generally responsible for charges related to past due payments. Our leases are primarily closed-ended, meaning the consumer does not bear the residual risk.
We generate revenue on leases through monthly lease payments and fees, and, depending on the market value of the off-lease vehicle, we may recognize a gain or loss upon remarketing. Our agreement with Chrysler permits us to share any residual losses over a threshold, determined on an individual lease basis, with Chrysler.
Dealer Loans
We provide dealer floorplan loans to certain automotive dealers, primarily Chrysler-franchised dealerships, so that they can acquire new and used vehicles for their inventory. We provide these loans in our sole discretion and in accordance with our credit policies, generally advancing up to 100% of the vehicle’s wholesale invoice price for a new vehicle, up to 100% of the price of a used vehicle purchased at an authorized auction, and up to 90% for any other used vehicle. Each dealer loan is secured by all of the dealer’s existing vehicle inventory and is generally secured by dealership assets and/or personal guarantees by the dealership’s owner. Repayment of the advance related to each vehicle in inventory is required within seven days of the date the vehicle is sold or leased. A full or partial repayment also may also be required if the vehicle in inventory remains unsold. The interest charged on such loans is based on our internal risk rating for the dealer and is payable monthly.
In addition, we may periodically provide certain automotive dealers, primarily Chrysler-franchised dealerships, with real estate loans and working capital revolving lines of credit. Generally a dealer must have a floorplan loan with us in order to be eligible for real estate loans and working capital revolving lines of credit from us.
As of September 30, 2013, substantially all of the dealer floorplan loans originated under Chrysler Capital were held by our affiliate, SBNA, under terms of either of two agreements, a flow agreement entered into in June 2013 and a sale agreement entered into in August 2013. In November 2013, we entered into an additional sale agreement to sell substantially all of the non-floorplan dealer loans to SBNA.
Servicing for Others
We service a portfolio of vehicle loans originated or otherwise independently acquired by SBNA, as well as the dealer loans SBNA purchased from us and originated under a flow agreement. We also service loans sold through our flow agreement with Bank of America and several smaller loan portfolios for various third-party institutions.
Unsecured Consumer Lending
In March 2013, we began indirectly originating unsecured consumer loans. Most of these loans are currently serviced by the third-party originators, who handle daily cash remittances and customer service. We are constantly evaluating new unsecured consumer lending opportunities, such as credit cards, so that we may further diversify and expand our business.
91
Table of Contents
Origination and Servicing
Vehicle Finance
Our origination platform delivers automated 24/7 underwriting decision-making through a proprietary, credit-scoring system designed to ensure consistency and efficiency, with dealers receiving a decision in under 10 seconds for 95% of all requests. Every loan application we receive is processed by our risk scoring and pricing models. Our credit scorecard development process is supported by an extensive market database that includes nearly 20 years of historical data on the loans we have acquired as well as extensive consumer finance third-party data. We continuously evaluate loan performance and consumer behavior to improve our underwriting decisions. As a result of our readily adaptable and scalable systems, we are able to quickly implement changes in pricing and scoring credit policy rules and we seek to modify our underwriting standards to match the economic environment. Our scorecard methodology supports underwriting decisions for consumers across the full credit spectrum and has been designed to allow us to maximize modeled risk-adjusted yield for a given consumer’s credit profile. As a result of the Chrysler Agreement, we have adjusted underwriting standards in the prime space to compete with the major lenders in the area.
We have built our servicing approach based on years of experience as a nonprime lender. Our servicing activities consist largely of processing customer payments, responding to customer inquiries (such as requests for payoff quotes), processing customer requests for account revisions (such as payment deferrals), maintaining a perfected security interest in the financed vehicle, monitoring vehicle insurance coverage, pursuing collection of delinquent accounts, and remarketing repossessed or off-lease vehicles. We have made significant technology investments in our servicing systems to ensure that our servicing activities are in compliance with federal and local consumer lending rules in all 50 states.
Through our servicing platform, we seek to maximize collections while providing the best possible customer service. Our servicing practices are closely integrated with our origination platform. This results in an efficient exchange of customer data, market information and understanding of the latest trends in consumer behavior. Our customer account management process is model-driven and utilizes automated customer service and collection strategies, including the use of automated dialers rather than physical phones. Each of the models we use is validated by back-testing with data and can be adjusted to reflect new information that we receive throughout our entire business and to include new vehicle loan and lease applications, refreshed consumer credit data, and consumer behavior that we observe through our servicing operations. Our robust processes and sophisticated technology support our servicing platform to maximize efficiency, consistent loan treatment, and cost control.
In order to provide the best possible customer service, we provide multiple convenience options to our customers and have implemented many strategies to monitor and improve the customer experience. In addition to live agent assistance, our customers are offered a wide range of self-service options via our interactive voice response system and through our customer website. Self-service options include demographic management (such as updating a customer’s address, phone number, and other identifying information), payment and payoff capability, payment history reporting, as well as online chat and communication requests. Quality assurance teams perform account reviews and are responsible for grading our phone calls to ensure adherence to our policies and procedures as well as compliance with regulatory rules. Our analytics software converts speech from every call into text so that each of our conversations with a customer can be analyzed and subsequently data-mined. This is used to identify harmful words or phrases in real-time for potential intervention from a manager, and to search for the omission of words or phrases that are required for specific conversations. A quality control team provides an independent, objective assessment of the servicing department’s internal control systems and underlying business processes. This helps us identify organizational improvements while protecting our franchise reputation and brand. Lastly, complaint tracking processes ensure customer complaints are addressed appropriately and that the customers receive status updates. These systems assign the account to a specialized team (Office of the President) until the complaint is deemed to be closed. This team tracks and resolves customer complaints and is subject to a robust quality assurance program.
92
Table of Contents
The servicing process is divided into stages based on delinquency status and the collectors for each stage receive specialized training. In the event that a retail installment contract becomes delinquent, we follow an established set of procedures that we believe maximize our ultimate recovery on the loan or lease. Late stage account managers employ skip tracing, utilize specialized negotiation skills, and are trained to tailor their collection attempts based on the proprietary borrower behavioral score we assign to each of our customers. Collection efforts include calling within one business day when an obligor has broken a promise to make a payment on a certain date and using alternative methods of contact such as location gathering via references, employers, landlords, credit bureaus, and cross-directories. If the borrower is qualified, the account manager may offer an extension of the maturity date, a temporary reduction in payment, or a modification permanently lowering the interest rate or principal. If attempts to work with the customer to cure the delinquency are unsuccessful, the customer is sent a “right to cure” letter in accordance with state laws and the loan is assigned a risk score based on our historical days-to-repossess data. This score is used to prioritize repossessions, and each repossession is systematically assigned to third-party repossession agents according to their recent performance with us. Once the vehicle has been secured, any repairs required are performed and the vehicle is remarketed as quickly as possible, typically through an auction process.
Most of our servicing processes and quality-control measures also serve a dual purpose in that they both ensure compliance with the appropriate regulatory laws and ensure that we deliver the best possible customer service. Additionally, our servicing platform and all of the features we offer to our customers are scalable and can be tailored through statistical modeling and automation.
Unsecured Consumer Lending
We offer point-of-sale financing and personal loans through our partnerships with retailers and other lenders that offer several unsecured consumer lending products. Our ability to offer these products is derived from our expertise in originating nonprime vehicle retail loans and Santander’s expertise in the unsecured consumer lending industry. Our existing relationships with Bluestem, LendingClub, and others are partner-managed programs. In these arrangements, our partner decides whether to extend credit on any application using their own credit policies. If the applicant is declined, the application is sent to us to decide whether or not to extend a loan based on our own credit policy. For each unsecured consumer loan that we purchase, our partner retains the servicing rights unless the loan becomes delinquent, at which point we can elect to become the servicer. Additionally, our partners are required to share data files with us for accounting and portfolio review throughout the life of the unsecured consumer loan. We intend to leverage this data to further strengthen our origination and servicing systems with respect to unsecured consumer lending.
Our Relationship with Chrysler
On February 6, 2013, we entered into the Chrysler Agreement pursuant to which we are the preferred provider for Chrysler’s consumer loans and leases and dealer loans effective May 1, 2013. Business generated under terms of the Chrysler Agreement is branded as Chrysler Capital. During the period from the May 1, 2013 launch of the Chrysler Capital business through September 30, 2013, we acquired over $5 billion of Chrysler Capital retail installment contracts and over $1.4 billion of Chrysler Capital vehicle leases, and facilitated the origination of over $300 million of Chrysler Capital dealer loans. We expect these volumes to continue.
The Chrysler Agreement requires, among other things, that we bear the risk of loss on loans originated pursuant to the agreement, but that Chrysler share in any residual gains and losses in respect of consumer leases. The agreement also requires that we maintain at least $5.0 billion in funding available for dealer inventory financing and $4.5 billion of financing dedicated to Chrysler retail financing. In turn, Chrysler must provide designated minimum threshold percentages of its subvention (Chrysler subsidized below-market loan and lease rates) business to us.
Under the Chrysler Agreement, we have agreed to specific transition milestones, including market penetration rates, approval rates, staffing, and service milestones, for the initial year following launch on May 1, 2013. If the transition milestones are not met in the first year, the agreement may terminate and we may lose the
93
Table of Contents
ability to operate as Chrysler Capital. If the transition milestones are met, the Chrysler Agreement will have a ten-year term, subject to early termination in certain circumstances, including the failure by either party to comply with certain of their ongoing obligations. In addition, Chrysler may also terminate the agreement, among other circumstances, if (i) we fail to meet certain performance metrics, including certain penetration and approval rate targets, during the term of the agreement, (ii) a person other than Santander and its affiliates or our other stockholders owns 20% or more of our common stock and Santander and its affiliates own fewer shares of common stock than such person, (iii) we become, control, or become controlled by, an OEM that competes with Chrysler or (iv) if certain of our credit facilities become impaired. Based on projections and our initial performance under the agreement, management believes that we will meet all of our performance targets.
In connection with entering into the Chrysler Agreement, we paid Chrysler a $150 million upfront, nonrefundable fee on May 1, 2013. This fee is considered payment for future profits generated from the Chrysler Agreement and, accordingly, we are amortizing it over the expected ten-year term of the agreement as a component of net finance and other interest income. We have also executed an Equity Option Agreement with Chrysler, whereby Chrysler may elect to purchase, at any time during the term of the Chrysler Agreement, at fair market value, an equity participation of any percentage in the Chrysler Capital portion of our business.
For a period of 20 business days after Chrysler’s delivery to us of a notice of intent to exercise its option, we are to discuss with Chrysler in good faith the structure and valuation of the proposed equity participation. If the parties are unable to agree on a structure and Chrysler still intends to exercise its option, we will be required to create a new company into which the Chrysler Capital assets will be transferred and which will own and operate the Chrysler Capital business. If Chrysler and we cannot agree on a fair market value during the 20-day negotiation period, each party will engage an investment bank and the appointed banks will mutually appoint a third independent investment bank to determine the value, with the cost of the valuation divided evenly between Chrysler and us. Each party has the right to a one-time deferral of the independent valuation process for up to nine months. Chrysler will have a period of 90 days after a valuation has been determined, either by negotiation between the parties or by an investment bank, to deliver a binding notice of exercise. Following this notice, Chrysler’s purchase is to be paid and settled within 10 business days, subject to a delay of up to 180 days if necessary to obtain any required consents from governmental authorities.
Any new company formed to effect Chrysler’s exercise of its equity option will be a Delaware limited liability company unless otherwise agreed to by the parties. As long as each party owns at least 20% of the business, Chrysler and we will have equal voting and governance rights without regard to ownership percentage. If either party has an ownership interest in the business of less than 20%, the party with less than 20% ownership will have the right to designate a number of directors proportionate to its ownership and will have other customary minority voting rights.
As the equity option is exercisable at fair market value, we could recognize a gain or loss upon exercise if the fair market value is determined to be different from book value. We believe that the fair market value of our Chrysler Capital financing business currently exceeds book value and therefore have not recorded a contingent liability for potential loss upon Chrysler’s exercise.
Subsequent to the exercise of the equity option, SCUSA’s rights under the Chrysler Agreement will be assigned to the jointly owned business. Exercise of the equity option would be considered a triggering event requiring re-evaluation of whether or not the remaining unamortized balance of the upfront fee we paid to Chrysler on May 1, 2013 should be impaired.
On June 13, 2013, we entered into a committed forward flow agreement that, as amended on September 26, 2013, commits us to sell up to $300 million per month of prime loans to Bank of America through May 31, 2018. For those loans, we will retain the servicing rights at contractually agreed upon rates. This servicing arrangement will provide us with an additional fee income stream. We also will receive or pay a servicer performance payment if net credit losses on the sold loans are lower or higher, respectively, than expected net credit losses at the time of sale.
94
Table of Contents
On June 28, 2013, we entered into a flow agreement with SBNA whereby we provide SBNA with the first right to review and assess Chrysler dealer lending opportunities and, if SBNA elects, to provide the proposed financing. On August 16, 2013, we sold most of our existing Chrysler floorplan loans to SBNA. We provide servicing on all loans sold or originated under these agreements. We also will receive or pay a servicer performance payment if yields, net of credit losses, on the loans originated under the flow agreement are higher or lower, respectively, than expected at origination.
In addition, we may periodically provide certain automotive dealers, primarily Chrysler-franchised dealerships, with real estate loans and working capital revolving lines of credit. Generally, a dealer must have a floorplan loan with us in order to be eligible for real estate loans and working capital revolving lines of credit from us.
Competition
The automotive finance industry is highly competitive. We compete on the pricing we offer on our loans and leases as well as the customer service we provide to our automotive dealer customers. Pricing for these loans and leases is very transparent. We, along with our competitors, post our pricing for loans and leases on web-based credit application aggregation platforms. When dealers submit applications for consumers acquiring vehicles, they can compare our pricing against our competitors’ pricing. Dealer relationships are important in the automotive finance industry. Vehicle finance providers need to tailor product offerings to meet each individual dealer’s needs.
We believe that we can effectively compete because our proprietary scorecards and industry experience enable us to price risk appropriately. In addition, we benefit from Chrysler subvention programs through the Chrysler Agreement. We have developed strong dealer relationships through our nationwide sales force and long history in the automotive finance space. Further, we expect that we will be able to deepen dealer relationships through our Chrysler Capital product offerings.
Our primary competitors in the vehicle finance space are:
| • | national and regional banks; |
| • | credit unions; |
| • | independent financial institutions; and |
| • | the affiliated finance companies of automotive manufacturers. |
While the used car market is fragmented with no single lender accounting for more than 10% of the market, in both the new and used car markets there are a number of competitors that have substantial positions nationally or in the markets in which they operate. Some of our competitors have lower cost structures, lower cost funding, and are less reliant on securitization. We believe we can compete effectively by continuing to expand and deepen our relationships with dealers. In addition, through our Chrysler Capital brand we will benefit from the manufacturer’s subvention programs and Chrysler’s relationship with its dealers.
Our primary competitors in the unsecured consumer lending space are banks that have traditionally offered revolving credit products such as credit cards, home equity lines of credit, and personal loans. In recent years, new, smaller competitors have emerged to fulfill consumers’ demand for credit products by offering point-of-sale financing and personal loans through technologically sophisticated and often web-based applications. We compete with banks by identifying borrowers with attractive credit profiles who do not rely on traditional bank-offered consumer finance products like credit cards and home equity lines of credit. We also compete with other financial institutions who seek to identify potential partners that offer point-of-sale and web-based credit applications. We believe we can compete successfully due to our ability to identify unsecured consumer loan applications with attractive risk-adjusted returns, as well as the speed at which we can adapt to our potential partners’ operations.
95
Table of Contents
Seasonality
Our origination volume is generally highest in March and April each year due to consumers receiving tax refunds. Our delinquencies are generally highest in the period from November through January due to consumers’ holiday spending. Although we are profitable throughout the year, these trends drive a seasonal fluctuation whereby our profits generally are highest in the first quarter of each year and decline each quarter thereafter.
Employees
As of September 30, 2013, we had approximately 3,900 employees. None of our employees are parties to a collective bargaining agreement. We consider our relationship with our employees to be satisfactory.
Facilities and Real Estate
Our corporate headquarters are located in Dallas, Texas, where we lease approximately 125,000 square feet of office and operations space pursuant to a lease agreement expiring in 2016. In October 2013, we signed a lease expiring in 2024 for an additional 373,000 square feet of office and operations space in Dallas, Texas. We intend to move our corporate headquarters to this newly leased space in 2014. We also lease a 165,000 square foot servicing facility in North Richland Hills, Texas, a 73,000 square foot servicing facility in Lewisville, Texas, a 43,000 square foot servicing facility in Englewood, Colorado, and a 2,000 square foot operations facility in Costa Mesa, California, under leases that expire at various dates through 2018. Management believes the terms of the leases are consistent with market standards and were arrived at through arm’s-length negotiation.
Intellectual Property
Our right to use the Santander name is on the basis of a non-exclusive, royalty-free and non-transferable license from Santander, and only extends to uses in connection with our current and future operations within the United States. Santander may terminate such license at any time Santander ceases to own, directly or indirectly, 50% or more of our common stock.
In connection with our agreement with Chrysler, Chrysler has granted us a limited, non-exclusive, non-transferable, royalty-free license to use certain Chrysler trademarks, including the term “Chrysler Capital,” for as long as the Chrysler Agreement is in effect. We are required to adhere to specified guidelines, specifications, and other usage instructions related to these trademarks, as well as to obtain prior written approval of any materials, including financing documents and promotional materials, using the trademarks. This license does not grant us any ownership rights in Chrysler’s trademarks.
Legal Proceedings
On September 13, 2013, Ally Financial Inc. filed suit against us in the United States District Court for the Eastern District of Michigan, in a matter pending as Case No. 13-CV-13929, alleging copyright infringement and misappropriation of trade secrets and confidential information in connection with our launch of Chrysler Capital and, in particular, our offering of floorplan lines of credit to Chrysler dealerships. We consider the allegations to be without merit and intend to vigorously defend the case.
From time to time, we may become involved in various additional lawsuits and legal proceedings that arise in the ordinary course of business. However, litigation is subject to inherent uncertainties, and an adverse result in these or other matters may arise from time to time that may harm our business. We do not expect that the legal proceedings to which we are currently party, individually, or in the aggregate, will have a material adverse impact.
Supervision and Regulation
The U.S. lending industry is highly regulated under federal and state law. We are subject to inspections, examinations, supervision, and regulation by each state in which we are licensed, the CFPB, and the Federal
96
Table of Contents
Trade Commission. In addition, because our largest shareholder is a bank holding company, we are subject to certain bank regulations, including oversight by the Federal Reserve, the Office of the Comptroller of the Currency, and the Bank of Spain. See “Risk Factors — Regulatory Risks — We may be subject to certain banking regulations that may limit our business activities.”
State Lending Regulations
In general, state statutes establish maximum loan amounts, interest rates, fees and maximum amounts allowed to be charged for such fees, insurance premiums, and fees that may be charged for both direct and indirect lending. Specific allowable charges vary by state and type of license. Statutes in Texas, for example, allow for indexing the maximum small loan amounts to the Consumer Price Index and setting maximum rates for automobile purchase loans based on the age of the vehicle. In addition, state laws regulate the keeping of books and records and other aspects of the operation of consumer finance companies. State and federal laws regulate account collection practices.
We are separately licensed under the laws of each state in which we operate. Licenses granted by the regulatory agencies in these states are subject to renewal every year and may be revoked for failure to comply with applicable state and federal laws and regulations. We are in compliance with state laws and regulations applicable to our lending operations in each state.
We and our operations are regulated by several state agencies. We are subject to compliance audits of our operations in every state.
Dodd-Frank Wall Street Reform and Consumer Protection Act of 2010
At the federal level, Congress enacted comprehensive financial regulatory reform legislation on July 21, 2010. A significant focus of the new law (the Dodd-Frank Act) is heightened consumer protection. The Dodd-Frank Act established a new body, the CFPB, which has regulatory, supervisory, and enforcement powers over providers of consumer financial products and services, including us, including explicit supervisory authority to examine and require registration of non-depository lenders and promulgate rules that can affect the practices and activities of lenders.
Although the Dodd-Frank Act expressly provides that the CFPB has no authority to establish usury limits, some consumer advocacy groups have suggested that various forms of alternative financial services or specific features of consumer loan products should be a regulatory priority, and it is possible that at some time in the future the CFPB could propose and adopt rules making such lending services materially less profitable or impractical, which may impact finance loans or other products that we offer.
In March 2013, the CFPB issued a bulletin recommending that indirect vehicle lenders, a class that includes us, take steps to monitor and impose controls over dealer markup policies whereby dealers charge consumers higher interest rates, with the markup shared between the dealer and the lender.
The CFPB is also conducting supervisory audits of large vehicle lenders and has indicated it intends to study and take action with respect to possible ECOA “disparate impact” credit discrimination in indirect vehicle finance. If the CFPB enters into a consent decree with one or more lenders on disparate impact claims, it could negatively impact the business of the affected lenders, and potentially the business of dealers and other lenders in the vehicle finance market. This impact on dealers and lenders could increase our regulatory compliance requirements and associated costs.
In addition to the grant of certain regulatory powers to the CFPB, the Dodd-Frank Act gives the CFPB authority to pursue administrative proceedings or litigation for violations of federal consumer financial laws. In these proceedings, the CFPB can obtain cease and desist orders (which can include orders for restitution or rescission of contracts, as well as other kinds of affirmative relief) and monetary penalties.
97
Table of Contents
Other Federal Laws and Regulations
In addition to the Dodd-Frank Act and state and local laws and regulations, numerous other federal laws and regulations affect our lending operations. These laws and their implementing regulations include, among others, usury laws, Anti-Money Laundering requirements (Bank Secrecy Act and USA PATRIOT Act), Equal Credit Opportunity Act, Fair Debt Collection Practices Act, Fair Credit Reporting Act, Privacy Regulations (Gramm-Leach-Bliley Act and Right to Financial Privacy Act), Electronic Funds Transfer Act, Servicemembers’ Civil Relief Act, Telephone Consumer Protection Act, Truth in Lending Act, and requirements relating to unfair, deceptive, or abusive acts or practices. Under the Fair Credit Reporting Act, we must provide certain information to customers whose credit applications are not approved on the basis of a report obtained from a consumer reporting agency, promptly update any credit information reported to a credit reporting agency about a customer and have a process by which customers may inquire about credit information furnished by us to a consumer reporting agency.
Under the Gramm-Leach-Bliley Act, we must protect the confidentiality of our customers’ nonpublic personal information and disclose information on our privacy policy and practices, including with regard to the sharing of customers’ nonpublic personal information with third parties. This disclosure must be made to customers at the time the customer relationship is established and, in some cases, at least annually thereafter.
Under the Truth in Lending Act and Regulation Z promulgated thereunder, we must disclose certain material terms related to a credit transaction, including, but not limited to, the APR, finance charge, amount financed, total of payments, the number and amount of payments, and payment due dates to repay the indebtedness.
Under the Equal Credit Opportunity Act and Regulation B promulgated thereunder, we cannot discriminate against any credit applicant on the basis of any protected category, such as race, color, religion, national origin, sex, marital status, or age. We are also required to make certain disclosures regarding consumer rights and advise customers whose credit applications are not approved of the reasons for the rejection.
The Federal Trade Commission’s Credit Practices Rule limits the types of property we may accept as collateral to secure a consumer loan.
98
Table of Contents
Executive Officers and Directors
The following table sets forth information regarding our executive officers and directors as of the date of this prospectus.
| Name |
Age | Position | ||||
| Executive Officers: |
||||||
| Thomas G. Dundon |
42 | Chief Executive Officer and Chairman | ||||
| Jason A. Kulas |
43 | President and Chief Financial Officer | ||||
| Jason W. Grubb |
47 | Chief Operating Officer | ||||
| Eldridge A. Burns, Jr. |
44 | Chief Legal Officer and General Counsel | ||||
| James W. Fugitt |
40 | Chief Information Officer | ||||
| R. Michele Rodgers |
43 | Chief Compliance and Risk Officer | ||||
| Michelle L. Whatley |
42 | Chief Human Resources Officer | ||||
| Richard Morrin |
44 | Executive Vice President, New Business | ||||
| Nathan Staples |
34 | Chief Credit Officer | ||||
| Hugo R. Dooner |
44 | Executive Vice President, Consumer Lending | ||||
| Jennifer Popp |
34 | Chief Accounting Officer | ||||
| Brad Martin |
38 | Executive Vice President, Business Operations | ||||
| Non-Executive Directors: |
||||||
| Gonzalo de Las Heras |
73 | Honorary Chairman | ||||
| Alberto Sánchez |
49 | Vice Chairman | ||||
| Juan Carlos Alvarez |
42 | Director | ||||
| Roman Blanco |
49 | Director | ||||
| Javier San Felix |
46 | Director | ||||
| Stephen A. Ferriss |
68 | Director | ||||
| Matthew Kabaker |
37 | Director | ||||
| Tagar C. Olson |
36 | Director | ||||
| Juan Andres Yanes |
50 | Director | ||||
| Daniel Zilberman |
40 | Director | ||||
Executive Officers
Thomas G. Dundon, Chief Executive Officer and Chairman
As one of our founding partners, Mr. Dundon was named President in May 2005 and served in that position until November 2013. He became President & Chief Executive Officer in December 2006, and since such time he has served as a member of our board of directors. Mr. Dundon was appointed as the Chairman of our board of directors on December 28, 2013. Mr. Dundon is also a Director of Santander Holdings USA, Inc., the parent company of SBNA and of the non-profit Santander Consumer USA Inc. Foundation. Mr. Dundon holds a bachelor’s degree in economics from Southern Methodist University.
Jason A. Kulas, President and Chief Financial Officer
Mr. Kulas has served as our President since November 2013 and our Chief Financial Officer since January 2007, joining us after serving as Managing Director in investment banking for JPMorgan Securities, Inc., where he was employed from 1995 to 2007. Mr. Kulas also worked as an analyst for Dun & Bradstreet and as an adjunct professor at Texas Christian University. Mr. Kulas served on our board of directors from 2007 to 2012 and currently serves as a member of the Board of the non-profit Santander Consumer USA Inc. Foundation. Mr. Kulas holds a bachelor’s degree in chemistry from Southern Methodist University and an MBA from Texas Christian University.
99
Table of Contents
Jason W. Grubb, Chief Operating Officer
Mr. Grubb joined us in November 2004 as our Senior Vice President of Servicing and has served as our Chief Operating Officer since January 2007. Prior to joining us, Mr. Grubb held positions at WFS Financial, Nissan Motor Acceptance Corp, and Commercial Financial Services in which he was responsible for servicing. Mr. Grubb holds a bachelor’s degree in finance from Oklahoma State University and an MBA from Our Lady of the Lake University.
Eldridge A. Burns, Jr., Chief Legal Officer and General Counsel
Mr. Burns has served as our Chief Legal Officer and General Counsel since January 2007. Prior to joining us, Mr. Burns served as Vice President and Senior Corporate Counsel for Blockbuster, Inc., where he managed real estate, mergers and acquisitions, and general corporate transactions. Prior to joining Blockbuster, Mr. Burns was an associate at Vinson & Elkins LLP. Mr. Burns is a member of the Texas Bar and Dallas Bar Associations, and has served as a member of the steering committee for the Texas Minority Counsel Program. He currently serves as a member of the Board of the non-profit Santander Consumer USA Inc. Foundation. Mr. Burns holds a bachelor’s degree in business administration from Southern Methodist University and a J.D. from the University of Texas, School of Law.
James W. Fugitt, Chief Information Officer
Mr. Fugitt has served as our Chief Information Officer for Santander Consumer USA Inc. since October 2011 and prior to that served as our Chief Technology Officer and Vice President of Application Development. Prior to joining us in 2002, Mr. Fugitt held various IT development and management positions at WorldNow, a new media company, and BSG Consulting, a technology consulting company. Mr. Fugitt holds a bachelor’s degree in electrical engineering from Columbia University.
R. Michele Rodgers, Chief Compliance and Risk Officer
Ms. Rodgers has served as our Chief Compliance Officer since April 2012 and added the role of Chief Risk Officer in June 2013. Ms. Rodgers joined us in March 2005 and has previously served as Controller and head of the Project Management Office. Prior to joining us, Ms. Rodgers worked in the fields of finance and technology consulting. Ms. Rodgers holds a bachelor’s degree in accounting from the University of Alabama.
Michelle L. Whatley, Chief Human Resources Officer
Ms. Whatley has served as our Chief Human Resource Officer since May 2013; prior to that she served as our EVP, Human Resources and Director of Human Resources Information Systems. Prior to joining us in June 2003, Ms. Whatley held various other human resources roles in both the technology and consumer industries. She currently serves as a member of the Board of the non-profit Santander Consumer USA Inc. Foundation. Ms. Whatley attended Midwestern State University, attained the Professional in Human Resources accreditation in 2002, and has been a member of the Society of Human Resources Management for over ten years.
Richard Morrin, Executive Vice President, New Business
Mr. Morrin has served as our Executive Vice President of New Business since August 2011. Prior to joining us, Mr. Morrin held a variety of management positions in 21 years of combined service at Ally Financial and General Motors Acceptance Corp. Most recently, he managed the commercial lending operations for Ally automotive dealers in the United States and Canada. Mr. Morrin holds a bachelor’s degree in economics from the University of Pennsylvania and an MBA from the University of Virginia.
100
Table of Contents
Nathan Staples, Chief Credit Officer
Mr. Staples joined us in May 2001 and has served as our Chief Credit Officer since June 2013. Mr. Staples has worked with the Santander Group locally within the USA, and prior to assuming the role of Chief Credit Officer, globally in and throughout the United Kingdom. Mr. Staples is experienced in cash flow modeling, financial and portfolio analyses, credit policy, risk management and collateral recovery. Mr. Staples holds a Bachelor of Science degree in Business Administration with a concentration in Finance from the University of Texas at Dallas and an MBA with a concentration in Strategy from Southern Methodist University, Cox School of Business.
Hugo R. Dooner, Executive Vice President, Consumer Lending
Mr. Dooner joined the Company in March 2010 with more than 20 years of experience in the finance industry. Prior to joining the Santander team, Mr. Dooner was a Vice President and managed the Portfolio Marketing, Strategic Initiatives and global servicing operations of HSBC Auto Finance. Mr. Dooner holds a bachelor’s degree from UC Santa Barbara and an MBA from the University of Chicago, Booth School of Business.
Jennifer Popp, Chief Accounting Officer
Ms. Popp has served in the finance industry since 2001, and joined our team in July 2012. Prior to joining our executive team, she served as Vice President, Controller for Residential Credit Solutions, Inc., a Texas-based residential mortgage servicer, and as a senior manager for KPMG LLP. Ms. Popp holds bachelor’s and master’s degrees in accounting from the University of Missouri, and is a Certified Public Accountant and Chartered Financial Analyst (CFA) charterholder.
Brad Martin, Executive Vice President, Business Operations
Mr. Martin has served within our senior leadership team since 2005, and has served as our Executive Vice President of Business Operations since January 2011. Prior to entering the consumer finance industry in 2000, Mr. Martin served the United States as a Petty Officer in the United States Navy. Mr. Martin attended Dallas Baptist University.
Directors
Our board of directors currently consists of eleven members.
Gonzalo de Las Heras, Honorary Chairman
Mr. de Las Heras served as our Chairman from December 2006 until December 28, 2013, when he became our Honorary Chairman. Mr. de Las Heras has been a director of SHUSA and SBNA since October 2006. Mr. de Las Heras joined Santander in 1990 and most recently served as Executive Vice President supervising Santander business in the United States until 2009, when he retired. Mr. de Las Heras is also the Chairman of Santander Bancorp, Puerto Rico, Banco Santander International, Miami, Santander Trust & Bank (Bahamas) Limited, and Banco Santander (Suisse). Prior to joining Santander, Mr. de Las Heras held various positions at JP Morgan, most recently as Senior Vice President and Managing Director heading its Latin American division. He served as a director of First Fidelity Bancorporation until its merger with First Union. From 1993 to 1997, Mr. de Las Heras served on the New York State Banking Board. He is a director and past chairman of the Foreign Policy Association and a Trustee and past chairman of the Institute of International Bankers. Mr. de Las Heras has a law degree from the University of Madrid and as a Del Amo Scholar pursued postgraduate studies in Business Administration and Economics at the University of Southern California. Mr. de Las Heras has extensive knowledge and experience in international finance, and we believe he is qualified to serve on our board.
101
Table of Contents
Alberto Sánchez, Vice Chairman
Mr. Sánchez has served as a director since December 2006. Mr. Sánchez has served as a Director of SHUSA and SBNA since January 2009, when they were Sovereign Bancorp and Sovereign Bank, respectively. Mr. Sánchez is the Head of Strategy and Specialty Finance of the U.S. for Banco Santander. Since 1997, Mr. Sánchez has held the following positions within the Santander organization: Head of Equity Research, Head of Latin American Equities, and Head of Spanish Equities and Macroeconomics Research. Previously he was a Senior Managing Director at Bear Stearns (now JP Morgan) and a Managing Director at Deutsche Bank. Mr. Sánchez serves as a director and Vice Chairman of Santander Consumer USA Inc. He also serves as a Board Member of the Greenwich Village Orchestra, the Concert Artists Guild, the Brooklyn Academy of Music and the President’s Council of the Development and University Relations Department of Fordham University. Mr. Sánchez holds a master’s of International Political Economy & Development from Fordham University and a law degree from the Universidad Complutense de Madrid. Mr. Sánchez has extensive knowledge and experience in international finance, and we believe he is qualified to serve on our board.
Thomas G. Dundon, Director
Mr. Dundon’s biography is included under “— Executive Officers” above. Mr. Dundon has extensive knowledge and experience in consumer finance, and we believe he is qualified to serve on our board.
Juan Carlos Alvarez, Director
Mr. Alvarez has served as a director since December 2011. Mr. Alvarez is the Chief Financial Officer of SHUSA and a Senior Executive Vice President of SBNA and is a member of the SHUSA Executive Management Committee. Mr. Alvarez served as the Corporate Treasurer of SBNA from 2009 to 2013, Global Head of Treasury and Investments for Santander International Private Banking Unit from 2006 to 2009, and Head of Treasury and Investments for Santander Suisse since 2000. Mr. Alvarez is a CFA charterholder. Mr. Alvarez earned his B.B.A. in Accounting and Finance from Tulane University and his master of science in finance from George Washington University. Mr. Alvarez has extensive knowledge and experience in global markets, and we believe he is qualified to serve on our board.
Roman Blanco, Director
Mr. Blanco has served as a director since November 2013. He is the Santander US Country Head, President and Chief Executive Officer of SHUSA and SBNA, and a member of the SHUSA Executive Management Committee. He was an executive at Banco Santander Brazil from 2004 to 2007, Santander’s country head in Colombia from 2007 to 2012, and head of Santander Puerto Rico from 2012 to 2013. Prior to joining Santander, he worked for consulting firm McKinsey & Co. for thirteen years, most recently as a senior partner specializing in the financial sector. He holds a civil engineering degree and an MBA from Carnegie Mellon University. Mr. Blanco has extensive global financial experience, and we believe he is qualified to serve on our board.
Stephen A. Ferriss, Director
Mr. Ferriss was appointed a director in November 2013 and serves as the Chairman of our Audit Committee. He has served as a director to the SHUSA and SBNA Boards since 2012, serves as the chairman of the SHUSA and SBNA Audit Committees, and is a member of SBNA’s Bank Secrecy Act/Anti-Money Laundering Oversight Committee. He is the senior independent director and chairman of the Nominations Committee for Management Consulting Group PLC, London, a publicly traded company on the London Stock Exchange. He also has served as a Board member of Iberchem in Madrid, Spain since 2007, and previously served as a Board member of Santander Bancorp and Banco Santander Puerto Rico from 2002 to 2010 and as a member of the Audit Committee of those companies from 2004 to 2010. He previously served as President and Chief Executive Officer of Santander Central Hispano Investment Services, Inc. from 1999 to 2002 and held various roles at Bankers Trust (now Deutsche Bank Alex. Brown), including managing director and partner of
102
Table of Contents
the Bankers Trust Global Investment Bank in London and New York. Mr. Ferriss has a B.A. from Columbia College and an M.I.A. from Columbia University School of International Affairs. Mr. Ferriss brings extensive global experience to the Board as a result of these positions, and we believe he is qualified to serve on our board.
Matthew Kabaker, Director
Mr. Kabaker joined Centerbridge Partners, L.P. in 2011 and focuses on investments in financial services, institutions and assets in the United States and Europe. Mr. Kabaker also currently serves as a director of Focus Financial LLC. Prior to joining Centerbridge Partners L.P., Mr. Kabaker was a Senior Advisor to Treasury Secretary Timothy Geithner and the Deputy Assistant Secretary for Capital Markets at the U.S. Treasury Department in Washington, D.C. Prior to joining the U.S. Treasury Department in 2008, Mr. Kabaker was a Managing Director at Blackstone where he worked in the firm’s private equity business in New York and London for over 10 years. While at Blackstone, Mr. Kabaker focused on investments in the financial services and retail sectors. Mr. Kabaker earned a B.A. in Philosophy, Politics, and Economics from the University of Pennsylvania. Mr. Kabaker serves on the Board of Directors of Aktua Soluciones Financieras, S.L. and Santander Consumer USA Inc., and we believe he is qualified to serve on our board.
Tagar C. Olson, Director
Mr. Olson has served as a director since January 2012. Mr. Olson is a Member of the general partner of KKR & Co. L.P. (NYSE: KKR), the parent company of Kohlberg Kravis Roberts & Co. L.P., where he is head of KKR’s financial services industry team within its private equity platform. Mr. Olson also serves as a Director of Alliant Insurance Services, Inc., First Data Corporation and Visant Corp. Prior to joining KKR in 2002, Mr. Olson was with Evercore Partners Inc., in their private equity and mergers and acquisition practices. He graduated summa cum laude from the University of Pennsylvania’s Management and Technology dual-degree program, where he received his B.S.E. from The Wharton School and his B.A.S. from the School of Engineering and Applied Science. Mr. Olson has extensive knowledge and experience in financial services and private equity, and we believe he is qualified to serve on our board.
Javier San Felix, Director
Mr. San Felix has served as a director since 2013, and from 2006 until 2012. Mr. San Felix has been a Senior Executive Vice President of Santander in charge of the Retail and Commercial Banking business since May 2013. Prior to serving as a director, he was the Chief Executive Officer of Banesto from May 2012 until its merger into Santander. From 2008 to 2012, Mr. San Felix was Senior Executive Vice President of Santander Consumer Finance, responsible for Non-Euro Markets including the United States. He served in various other roles for Santander Consumer Finance from 2004 to 2008, and previously was a senior partner with McKinsey & Company. Mr. San Felix has a degree in Business Administration from Universidad Pontificia Comillas and an M.B.A. from the University of California, Los Angeles. Mr. San Felix has extensive international financial services experience, and we believe he is qualified to serve on our board.
Juan Andres Yanes, Director
Mr. Yanes has served as a director since December 2011. Mr. Yanes has also served as a director of SHUSA and SBNA since September 2009. Mr. Yanes is the Chief Risk Officer of SHUSA and SBNA, a Senior Executive Vice President of SHUSA and SBNA, and a member of the SHUSA Executive Management Committee and previously served as the Chief Corporate Officer of Santander USA. Mr. Yanes joined the Santander organization in 1991 and was involved in Investment Banking, Corporate Finance, and Financial Markets until 1999. Mr. Yanes has extensive knowledge and experience in financial market risk, and we believe he is qualified to serve on our board.
103
Table of Contents
Daniel Zilberman, Director
Mr. Zilberman has served as director since January 2012. Mr. Zilberman is a Partner of Warburg Pincus & Co., a Managing Director of the private equity firm Warburg Pincus LLC and leads the firm’s European financial services and special situations practice. Mr. Zilberman also serves as a director of Primerica Inc., Aeolus Re, and The Mutual Fund Store and is an observer on the board of Sterling Financial. Prior to joining Warburg Pincus, Mr. Zilberman worked at Evercore Capital Partners and Lehman Brothers. Mr. Zilberman holds his MBA from The Wharton School at the University of Pennsylvania and a bachelor’s degree in International Relations with honors from Tufts University. Mr. Zilberman has extensive knowledge and experience in investments in the financial services sector, and we believe he is qualified to serve on our board.
Composition of the Board of Directors
Upon the closing of this offering, we will have eleven directors and one vacant director position. We intend to avail ourselves of the “controlled company” exception under applicable stock exchange rules, which eliminates the requirements that we have a majority of independent directors on our board of directors and that we have compensation and nominating/corporate governance committees. We will be required, however, to have an audit committee with one independent director during the 90-day period beginning on the date of effectiveness of the registration statement filed with the SEC in connection with this offering and of which this prospectus is part. After such 90-day period and until one year from the date of effectiveness of the registration statement, we will be required to have a majority of independent directors on our audit committee. Thereafter, we will be required to have an audit committee comprised entirely of independent directors.
If at any time we cease to be a “controlled company” under stock exchange rules, the board of directors will take all action necessary to comply with the applicable stock exchange rules, including appointing a majority of independent directors to the board of directors and establishing certain committees composed entirely of independent directors, subject to a permitted “phase-in” period.
Director Independence
Our board of directors has determined that, under NYSE listing standards and taking into account any applicable committee standards, Mr. Ferriss is an independent director. Subject to the Shareholders Agreement, because of the percentage of our voting stock that our Principal Stockholders will continue to own following the offering, under NYSE listing standards, we will qualify as a “controlled company” and, accordingly, are exempt from its requirements to have a majority of independent directors.
Committees of the Board of Directors
Audit Committee. The members of the Audit Committee are Messrs. Ferriss, de Las Heras, Olson and Sanchez. Mr. Ferriss has been determined by our board of directors to be an “independent” director, as defined under the rules of the NYSE and Rule 10A-3 of the Securities Exchange Act of 1934, as amended (which we refer to as the “Exchange Act”). Mr. Ferriss is the chairman of the committee, is an “audit committee financial expert,” as that term is defined under the SEC rules implementing Section 407 of the Sarbanes-Oxley Act, and possesses financial sophistication, as defined under the rules of the NYSE. Each member of the audit committee is financially literate. The Committee is responsible for, among other things:
| • | reviewing our financial statements and public filings that contain financial statements, significant accounting policies changes, material weaknesses and significant deficiencies identified by outside auditors, if any, and risk management issues; |
| • | monitoring and assessing our compliance with legal and regulatory requirements, our financial reporting processes and related internal control systems, and the performance of our internal audit function; |
104
Table of Contents
| • | appointing our outside auditors and monitoring their independence, qualifications, compensation, and performance; and |
| • | preparing the Audit Committee report for inclusion in our proxy statement for our annual meeting. |
Board Enterprise Risk Committee. The members of the Board Enterprise Risk Committee are Messrs. Kabaker, Sanchez and Yanes. The Board Enterprise Risk Committee assists the Board in oversight responsibilities with respect to enterprise, credit, operational, market, liquidity, reputational, legal, regulatory, and compliance risk.
As a “controlled company,” we do not currently intend to establish a separate compensation or nominating and corporate governance committee, and compensation and nominating/corporate governance functions will be managed by the full board of directors until the rules change, we cease to be a “controlled company,” or we otherwise determine to do so.
Code of Business Conduct and Ethics
Our board of directors has adopted a code of business conduct and ethics (which we refer to as the “Code of Ethics”) that applies to all of our directors, officers, and employees, including our principal executive officer, principal financial officer, principal accounting officer, and persons performing similar functions. The Code of Ethics is available free of charge upon written request to Corporate Secretary, Santander Consumer USA Inc., 8585 North Stemmons Freeway, Suite 1100-N, Dallas, Texas 75247. If we amend or grant any waiver from a provision of our Code of Ethics that applies to our executive officers, we will publicly disclose such amendment or waiver on our website and as required by applicable law, including by filing a Current Report on Form 8-K.
Board Leadership Structure
Our board of directors does not have any formal policy on whether the same person should serve as both the Chief Executive Officer and Chairman of the Board, as the board of directors believes that it should have the flexibility to make this determination at any given point in time in the way that it believes best to provide appropriate leadership for us at that time. Our board of directors has not separated the positions of Chairman of the Board and Chief Executive Officer, and both positions are currently held by Mr. Dundon. Our board of directors does not currently have a “Lead Director.” The board of directors believes that this serves us well by creating a critical link between management and our board of directors, enabling our board of directors to perform its oversight function with the benefits of management’s perspectives on the business, facilitating communication between our board of directors and our senior management, and providing our board of directors with direct oversight of our business and affairs.
105
Table of Contents
COMPENSATION DISCUSSION AND ANALYSIS
This Compensation Discussion and Analysis describes the material elements of compensation awarded to, earned by, or paid to each of our executive officers who are included in the Summary Compensation Table, who we collectively refer to as our “named executive officers” or “NEOs” and focuses on the information contained in the following tables and related footnotes primarily for the fiscal year 2013.
For the fiscal year ended December 31, 2013, our NEOs were: (i) Thomas G. Dundon, Chief Executive Officer; (ii) Jason A. Kulas, President and Chief Financial Officer; (iii) Jason W. Grubb, Chief Operating Officer; (iv) Eldridge A. Burns, Jr., Chief Legal Officer and General Counsel; and (v) Richard Morrin, EVP, New Business.
Philosophy and Objectives of Our Executive Compensation Program. The fundamental principles that Santander and we follow in designing and implementing compensation programs for the NEOs are to:
| • | attract, motivate, and retain highly skilled executives with the business experience and acumen necessary for achieving our long-term business objectives; |
| • | link pay to performance; |
| • | align, to an appropriate extent, the interests of management with those of our stockholders; and |
| • | support our core values, strategic mission, and vision. |
We aim to provide a total compensation package that is comparable to that of other financial institutions in the geographic area in which the NEOs are located, taking into account publicly available information considered by our Chief Executive Officer and Chief Human Resources Officer; however, we did not engage in formal market or industry benchmarking in fiscal year 2013. Within this framework, SCUSA considers each component of each NEO’s compensation package independently; that is, SCUSA does not evaluate what percentage each component comprises of the total compensation package.
SCUSA took into account individual performance, level of responsibility, and track record within the organization in setting each named executive officer’s compensation for fiscal year 2013.
Process for Determining Executive Compensation
SCUSA Board of Directors. Our board of directors has oversight of, among other things, adoption, modification or termination of the terms within our executive equity-based incentive plan in which our NEOs participate and approval of amounts paid to the Chief Executive Officer, Chief Financial Officer and Chief Operating Officer under the executive incentive program. Our board of directors also sets compensation for our Chief Executive Officer.
SCUSA Human Resources Department. Our human resources department has the authority and responsibility to oversee management performance reviews, and to prepare the management bonus pools for presentation to our board of directors. Our Executive Committee (which includes all of our NEOs), in partnership with our human resources department, also approves individual bonus awards to the extent that our board of directors delegates such powers and responsibilities.
SCUSA Management. Our Chief Executive Officer collaborates with our Chief Human Resources Officer in setting compensation for all of our NEOs other than our Chief Executive Officer.
Santander. While our NEOs were eligible to participate in Santander’s Performance Shares Plan in fiscal year 2013, no awards were granted to the NEOs under the Performance Shares Plan in fiscal year 2013, and no awards are anticipated to be granted to the NEOs under the Performance Shares Plan in the future.
106
Table of Contents
Benchmarking and Independent Compensation Consultant. We did not engage in market or industry benchmarking in fiscal year 2013 with respect to the compensation of the NEOs. In addition, neither we nor our board of directors engaged a compensation consultant in fiscal year 2013.
Principal Components of Executive Compensation
For fiscal year 2013, the compensation that we paid to our NEOs consisted primarily of base salary and short- and long-term incentive opportunities, as we describe more fully below. In addition, the NEOs are eligible for participation in company-wide welfare benefits plans, and we provide the NEOs with certain welfare benefits and perquisites not available to our employees generally.
Base Salary
Base salary represents the fixed portion of each NEO’s compensation and is intended to provide compensation for expected day-to-day performance. The base salaries of the NEOs were generally set in accordance with each NEO’s employment agreement, each of which was entered into prior to fiscal year 2013. See “— Employment Agreements with Named Executive Officers.” While each NEO’s employment agreement provides for the possibility of increases in base salary, annual increases are not guaranteed. No NEO received an increase in annual base salary in fiscal year 2013, however, our board of directors has approved the following base salary increases for fiscal year 2014 for Messrs. Dundon, Kulas, Grubb, and Burns, to retain these key executives and to reflect the increased responsibility relating to their roles with respect to a public company:
| Name |
2013 Base Salary | 2014 Base Salary | ||||||
| Thomas Dundon |
$ | 1,500,000 | $ | 2,625,000 | ||||
| Jason Kulas |
$ | 400,000 | $ | 890,000 | ||||
| Jason Grubb |
$ | 350,000 | $ | 550,000 | ||||
| Eldridge Burns |
$ | 240,000 | $ | 260,000 | ||||
Short-Term Incentive Compensation
Discretionary Bonuses
In certain cases, we award discretionary bonuses to the NEOs to motivate and reward outstanding performance. These awards permit us to apply discretion in determining awards rather than considering specific performance goals that may inadvertently reward inappropriate risk-taking. No discretionary bonuses were granted in fiscal year 2013.
Retention Bonuses
On June 28, 2013, we executed retention bonus letters with certain executives, including each of our NEOs with the exception of Mr. Dundon. Each retention bonus letter provides for a lump sum cash bonus payable within five days following the date of the retention bonus letter, subject to withholding for applicable income and payroll taxes or otherwise as required by law. The retention bonus is subject to claw-back in the event that, prior to February 28, 2015, the executive voluntarily terminates employment with the Company or in the event that, prior to February 28, 2015, the executive’s employment is terminated by the Company for cause (as defined in the Management Equity Plan). If such termination occurs prior to February 28, 2014, the executive will be required to repay to the Company the net amount of the retention bonus, and if such termination occurs after February 28, 2014 and prior to February 28, 2015, the executive will be required to repay to the Company 50% of the net amount of the retention bonus. After the retention bonuses were granted, we provided for a tax gross-up with respect to the federal, state and local taxes paid by each of the NEOs in connection with their retention bonuses.
107
Table of Contents
The amounts paid to each of the following NEOs under the retention bonus letters, and the amounts of the subsequently-issued tax gross-ups, are set forth in the table below:
| Named Executive Officer |
Value of Retention Bonus ($) | Value of Tax Gross-Up ($) | ||||||
| Jason Kulas |
$ | 200,000 | $ | 75,930 | ||||
| Jason Grubb |
$ | 175,000 | $ | 65,606 | ||||
| Eldridge Burns |
$ | 120,000 | $ | 44,211 | ||||
| Richard Morrin |
$ | 150,000 | $ | 55,616 | ||||
SCUSA Executive Incentive Program
We provide annual short-term cash incentive opportunities for the NEOs in the form of the SCUSA Executive Incentive Program (“EIP”) to reward the NEOs for their efforts towards achievement of corporate performance objectives, as well as to reinforce key cultural behaviors used to achieve short-term and long-term success. The EIP was approved by our board of directors, on the recommendation of our Executive Committee, on May 17, 2011. Each of the NEOs participated in the EIP in fiscal year 2013 and were eligible for a target annual bonus equal to 100% of each such NEO’s annual base salary. Messrs. Dundon and Kulas received a 2013 EIP bonus equal to 250% of their respective annual base salaries, Mr. Grubb received a 2013 EIP bonus equal to 186% of his annual base salary, Mr. Burns received a 2013 EIP bonus equal to 108% of his annual base salary and Mr. Morrin received a 2013 EIP bonus equal to 100% of his annual base salary. Our board of directors has approved target annual bonus levels under the EIP for fiscal year 2014 equal to 100% of annual base salary for each of our NEOs.
Achievement under the EIP was determined by reference to the Company’s overall projected performance goals from year to year. The budgeted goal for net income for 2013 was $675,047,000 – which provided the most exact and quantitative measure of the Company’s performance. Other performance goals critical to a strong performance were more qualitative and less easily measured (i.e., driving revenue-producing opportunities, sourcing of new loans and management of expenses). Our Chief Executive Officer, Chief Financial Officer, Chief Human Resources Officer and our board of directors annually review the appropriateness of the performance goals used in the EIP with respect to the degree of difficulty in achieving such goals, and determine whether there is a sufficient balance of degree of difficulty and potential reward for the NEOs. There is no specific weight given to any one performance goal, and the executives and our board of directors have the flexibility to consider a wide variety of performance goals (including performance goals not enumerated above), as they determine appropriate throughout the year in reaching their final conclusion as to achievement under the EIP. In making the EIP bonus determinations for fiscal year 2013, our board of directors reviewed our overall performance, including our projected net income results for fiscal year 2013, which was approximately $685 million. Our board of directors, with recommendations from our Chief Executive Officer (other than with respect to the Chief Executive Officer), then considered aspects of each NEO’s overall individual performance during the performance period (including, but not limited to, performance in the execution of Company goals and objectives, commitment to the Company’s core values, contributions to retention of workforce, and ability to identify and address cross-departmental concerns) and after considering all of the different factors, determined the actual EIP bonuses on an individual-by-individual basis without giving specific weight to any particular Company-wide or individual goals. In making the EIP bonus determinations for fiscal year 2013, our board of directors reviewed the NEOs’ individual performance during the performance period and made the following determinations:
| • | Mr. Dundon made significant contributions to the overall performance of the Company, including his critical contributions to the successful roll-out of Chrysler Capital, and exceeded expectations in his role as a driver of technology and financial strategies, and by demonstrating strong leadership. |
| • | Mr. Kulas exceeded expectations in his contributions to the Company’s technology and financial strategies, and demonstrated strong leadership in connection with the initial public offering process. |
108
Table of Contents
| • | Mr. Grubb exceeded expectations by strategically directing and guiding the Company toward innovative solutions within the Company’s operational segments. |
| • | Mr. Burns made notable contributions toward identifying and addressing cross-departmental concerns, specifically in connection with the initial public offering process. |
| • | Mr. Morrin was critical to the successful roll-out of Chrysler Capital and further met expectations by facilitating the execution of Company goals and objectives and in his commitment to the Company’s core values. |
The amounts paid under the SCUSA EIP are reflected in the “Non-Equity Incentive Plan Compensation” column of the “— Summary Compensation Table.”
Our NEOs have previously been required to defer a portion of their annual bonus. See “— Santander’s Management Board Compensation Policy and Identified Staff Plan.”
Medium- and Long-Term Incentive Compensation
Performance Shares Plan
The Performance Shares Plan is sponsored by Santander, and is a means for providing medium- and long-term incentive compensation for selected executives across its global platform. Santander developed the Performance Shares Plan to align the interests of Santander’s executives with those of its stockholders by encouraging stock ownership among its executives. The Performance Shares Plan generally consists of a multi-year plan under which Santander may award a participant a number of restricted shares of Santander common stock based on Santander’s performance during a specific three-year performance cycle. For fiscal year 2013, each of our NEOs (other than Richard Morrin) was eligible to participate in the Performance Shares Plan; however, no awards were granted to the NEOs under the Performance Shares Plan in fiscal year 2013, though the NEOs had the opportunity to vest in certain awards that were made in previous years as described below. SCUSA no longer participates in the Performance Shares Plan; accordingly, no awards will be granted to the NEOs under the Performance Shares Plan in the future.
Awards under the Performance Shares Plan relate to three-year performance cycles, with the payout of shares occurring no later than July 31st of the year following the end of the applicable cycle. Each of the NEOs (other than Richard Morrin) participated in the cycle covering performance for fiscal years 2010 through 2012 (which cycle had a payout date of no later than July 31, 2013).
The maximum number of shares that each participant is eligible to receive under each cycle was determined at the beginning of the cycle entirely at the discretion of our Executive Committee, based on the participant’s position within the Company. A percentage of the maximum number of shares vest in accordance with pre-established Santander total stockholder return (“TSR”) goals compared to a peer group of the world’s largest financial institutions chosen by Santander in its sole discretion on the basis of market capitalization, geographic location, and the nature of the businesses. We did not have any input into the selection of the peer group and are not informed of the specific peer group. Restrictions on shares lapse, and shares are delivered to the NEOs under the Performance Shares Plan, based on Santander’s performance over the three-year cycle, provided that the NEO remains continuously employed at Santander or a subsidiary through June 30 of the year following the end of the applicable cycle. In the event that the NEO’s employment is terminated prior to June 30 of the year following the end of the applicable cycle, and such termination is due to retirement, involuntary termination, unilateral waiver by the NEO for good cause (as provided under Spanish law), unfair dismissal, forced leave of absence, permanent disability or death, restrictions will lapse as to a prorated portion of the restricted shares, based on the number of days that the NEO was employed during the applicable cycle.
109
Table of Contents
The TSR goals and the associated possible percentages of restricted shares awarded that the NEOs may have earned under the Performance Shares Plan with respect to the 2010-2012 performance cycles are as follows:
| Santander’s position in the TSR ranking |
Percentage of Award Earned (2009- 2011 Performance Cycle) |
Percentage of Award Earned (2010- 2012 Performance Cycle) |
||||||
|
1st to 5th |
100.0 | % | 100.0 | % | ||||
|
6th |
82.5 | % | 82.5 | % | ||||
|
7th |
65.0 | % | 65.0 | % | ||||
|
8th |
47.5 | % | 47.5 | % | ||||
|
9th |
30.0 | % | 30.0 | % | ||||
|
10th or below |
0 | % | 0 | % | ||||
The maximum number of shares payable to the NEOs under the Performance Shares Plan in fiscal year 2013, with respect to the 2010-2012 performance cycle, is set forth in the table below:
| Named Executive Officer |
Number of Shares Delivered |
|||
| Thomas Dundon |
37,080 | |||
| Jason Kulas |
17,745 | |||
| Jason Grubb |
13,150 | |||
| Eldridge Burns |
7,278 | |||
For fiscal year 2013, Santander’s position in the TSR ranking was 10th or below. Accordingly, no shares were delivered under the Performance Shares Plan during 2013.
SCUSA 2011 Management Equity Plan
We have adopted the Management Equity Plan, which granted stock option awards in view of our potential initial public offering, with the intention of aligning key employees’ interests with those of the Company. Under the Management Equity Plan, eligible Company employees and directors (including the NEOs) may receive nonqualified stock options to purchase SCUSA common stock with an exercise price of at least the fair market value of SCUSA common stock on the date of grant. The Management Equity Plan also provides for the grant of premium priced stock options, which are granted with a per share exercise price in excess of the fair market value of SCUSA common stock on the date of grant. In addition to participation in the Management Equity Plan, certain members of senior management purchased shares of SCUSA common stock at fair market value.
Grants may be in the form of time-vesting options (with vesting based on continued service with SCUSA), or in the form of performance-vesting options (with vesting based on continued service with SCUSA and the achievement of performance targets relating to SCUSA’s return on equity). Vesting of awards under the Management Equity Plan is generally subject to acceleration upon a change in control. See “— Potential Payments upon Termination or Change in Control” below and “— Equity Compensation Plans Information.”
None of our NEOs were, or are expected to be, granted stock options in fiscal year 2013.
SCUSA Omnibus Incentive Plan
We have adopted the Omnibus Incentive Plan, which provides for the grant of nonqualified and incentive stock options, SARs, restricted stock awards, restricted stock units and other awards that may be settled in or based upon the value of our common stock to eligible officers, employees, directors and consultants. The purpose of the Omnibus Incentive Plan is to give us a competitive advantage in attracting, retaining and motivating officers, employees, directors and consultants and to provide a means whereby officers, employees, directors and consultants can acquire and maintain ownership of our common stock or be paid incentive compensation measured by reference to the value of our common stock, strengthening their commitment to us and our affiliates and promoting an identity of interest between our stockholders and the recipient of awards under the Omnibus
110
Table of Contents
Incentive Plan. Vesting of awards under the Omnibus Incentive Plan is generally subject to acceleration upon a change in control. See “— Potential Payments upon Termination or Change in Control” and “— Our Equity Incentive Plans,” below.
Messrs. Dundon, Kulas and Grubb were granted restricted shares in fiscal year 2013 in order to reward these NEOs for their contributions to the Company in 2013. In order to provide additional retention to Mr. Dundon, given his expansive experience in our business, our board of directors determined that it was in the best interests of the Company to grant Mr. Dundon a restricted share grant that was greater than those received by the other two NEOs. The restricted shares vest ratably over five years, subject to continued employment. If the NEO’s employment is terminated for any reason other than death, disability or by the Company without cause, the restricted shares will be forfeited. If the NEO’s employment is terminated due to death, disability or by the Company without cause, the restricted shares will vest in full. The restricted shares will also vest in full upon a change in control; provided, that, a change in control will not be deemed to occur as a result of the offering or related transactions (including the Reorganization). These NEOs were granted the following restricted shares in fiscal year 2013:
| Named Executive Officer |
Restricted Shares | |||
| Thomas Dundon |
143,589 | |||
| Jason Kulas |
64,615 | |||
| Jason Grubb |
10,769 | |||
Santander’s Management Board Compensation Policy and Identified Staff Plan
Under Santander’s Management Board Compensation Policy and Identified Staff Plan, certain executive officers, including Messrs. Dundon, Kulas and Grubb, had been required to defer a portion of their annual bonuses for the fiscal years 2010 and 2011. The percentage of annual bonus that was required to be deferred was based on each NEO’s total bonus earned.
With the exception of certain bonus deferrals made by Mr. Dundon, all amounts deferred under the Santander’s Management Board Compensation Policy and Identified Staff Plan are payable in Santander common stock, in three equal installments on each anniversary of the date of the deferral. Mr. Dundon’s deferred annual bonus with respect to fiscal year 2011 is payable one half in cash and one half in Santander common stock, in three equal installments on each anniversary of the date of deferral. Receipt of deferred bonus payments is contingent on the NEO remaining employed through the applicable payment date and subject to there being no: (i) deficient financial performance by Santander during that period, (ii) poor conduct by the participant (with respect to 2010 bonus deferrals only), (iii) breach or falsification by the participant in violation of the internal risk rules, (iv) material restatement of the entity’s financial statements and (v) significant variation in the economic capital or in the qualitative valuation of risks. Accordingly, amounts with respect to 2010 bonus deferrals are payable one-third in each of 2012, 2013 and 2014, and amounts with respect to 2011 bonus deferrals are payable one-third in each of 2013, 2014 and 2015. Once received, shares of Santander common stock are subject to a one-year holding requirement.
Other Compensation
In addition to the benefits that all of our employees are eligible to receive, the NEOs are eligible for certain other benefits and perquisites. For fiscal year 2013, the additional benefits and perquisites included a car allowance, SCUSA employer matching contributions to SCUSA’s qualified defined contribution retirement plan (i.e., 401(k) Plan), and annual premiums for executive disability benefits. These benefits and perquisites are generally consistent with those paid to similarly situated SCUSA executives. Mr. Dundon’s perquisites also include parking and toll expenses, financial planning expenses (including tax preparation services, accounting services and financial advisory and planning services), legal and estate planning expenses, medical reimbursements, and personal use of reward points earned on the Company credit card in connection with payment of corporate expenses.
111
Table of Contents
We pay certain expenses incurred by Mr. Dundon in the operation of his private plane when used for SCUSA business within the contiguous 48 states of the United States. Under this practice, payment is based on a set flight time hourly rate, and the amount of our reimbursement is not subject to a maximum cap per fiscal year. During fiscal year 2013, the average flight time hourly rate was approximately $5,400, and accordingly, we paid approximately $496,000 to Meregrass Company, a 135 charter company that manages this operation, under this practice.
Retirement Benefits
Each of the NEOs is eligible to participate in SCUSA’s qualified defined contribution retirement plan (i.e., 401(k) Plan) under the same terms as other eligible SCUSA employees. SCUSA provides these benefits in order to foster the development of the NEOs’ long-term careers with the Company. We do not provide defined benefit pension benefits, or nonqualified or excess retirement benefits to any of our NEOs.
Employment Agreements
We have entered into employment agreements with each of the NEOs, establishing key elements of compensation that differ from our standard plans and programs and that facilitate the creation of covenants, such as those prohibiting post-employment competition or solicitation by the NEOs. We believe that these agreements provide stability to SCUSA and further our overarching compensation objective of attracting and retaining the highest quality executives to manage and lead us. See “— Employment Agreements with Named Executive Officers.”
Tax Considerations
We intend to seek to maximize deductibility for tax purposes (including under Section 162(m) of the Code) of all elements of compensation of the NEOs, from and after the time that our compensation programs become subject to Section 162(m) of the Code (“Section 162(m)”). Pursuant to the transition provisions under Section 162(m), certain compensation arrangements that were entered into by a corporation before it was publicly held may not be subject to the deductibility limits for a period of approximately three years following the consummation of a public offering. Prior to such time as our compensation programs become subject to Section 162(m), we intend to review our compensation plans in light of applicable tax provisions and revise them as necessary to maximize deductibility. However, the Company and our board of directors will take into consideration a multitude of factors in making executive compensation decisions and may, in certain circumstances, approve compensation arrangements that do not qualify for maximum deductibility.
Compensation in Connection with this Offering
Adoption of SCUSA Omnibus Incentive Plan and Equity Grants
In advance of the offering, we have adopted the Omnibus Incentive Plan, which we expect to continue to use following this offering. We have also granted restricted shares to Messrs. Dundon, Kulas and Grubb in order to reward them for their contributions to the Company in 2013. See “— SCUSA Omnibus Incentive Plan” above and “— Our Equity Incentive Plans,” below.
Accelerated Vesting of Outstanding Equity Awards
Effective as of, and subject to the occurrence of, this offering (and contingent on their continued employment through the offering), our board of directors has approved the acceleration of the vesting of all stock options previously granted under the Management Equity Plan held by Messrs. Dundon, Kulas and Grubb (including the waiver of performance conditions), with the shares underlying such options to be subject to amended transfer restrictions resulting in a portion of the shares received upon exercise of such options being transferable earlier than currently contemplated by the management equity arrangements, and other portions of the shares received upon exercise of such options being transferable later than currently contemplated. In
112
Table of Contents
addition, the options that are vested in accordance with the first sentence of this section will be forfeited if the employment of the applicable NEO terminates prior to the date that the options would have vested in the ordinary course under the current management equity arrangements. Our board of directors has also approved the amendment effective as of, and subject to the occurrence of the offering (and contingent on their continued employment through the offering) of the management equity arrangements previously granted under the Management Equity Plan with each of Messrs. Burns and Morrin whereby certain transfer restrictions with respect to shares underlying a portion of their outstanding vested and unvested options will be waived and transfer restrictions with respect to shares underlying other portions of the outstanding options held by Messrs. Burns and Morrin will be extended.
The Management Equity Plan requires that the remaining shares available under the Management Equity Plan be granted in connection with an initial public offering; however, our board of directors has approved the amendment of the Management Equity Plan in connection with, and immediately prior to, this offering to provide that shares available under the Management Equity Plan that remain available at the consummation of the initial public offering will remain available for grant under the Management Equity Plan.
Compensation Following This Offering
We anticipate that our NEOs will continue to be subject to employment agreements that are substantially similar to their existing employment agreements which are described herein. It is also anticipated that our current NEOs will hold substantially similar positions following the offering.
While we are still in the process of determining specific details of the compensation program that will take effect following the offering, it is anticipated that our compensation program following the offering will be based on the same principles and designed to achieve the same objectives as our current compensation program. In addition, in connection with the offering, we intend to adopt a written annual bonus plan, described below, which will be used following this offering.
Equity Grants
Our board of directors has approved a grant of stock options to Messrs. Dundon, Kulas and Grubb pursuant to the Management Equity Plan, which grant will be made and will be effective on the date on which the underwriting agreement in connection with this offering is executed, this registration statement becomes effective and the initial public offering price of our common stock in this offering is determined, and will be made with an exercise price equal to the initial public offering price of our common stock in this offering. Our board of directors approved this grant in order to reward the NEOs for their performance during the initial public offering process and to provide additional retention.
Adoption of Senior Executive Annual Bonus Plan
In connection with this offering, we intend to adopt the following written annual bonus plan, which is expected to have the following material terms.
The Senior Executive Bonus Plan, is intended to provide an incentive for superior work and to motivate covered key executives toward even greater achievement and business results, to tie their goals and interests to those of ours and our stockholders and to enable us to attract and retain highly qualified executives.
The Senior Executive Bonus Plan is a performance-based bonus plan under which our designated key executives, including our executive officers, will be eligible to receive bonus payments with respect to a specified period (for example, our fiscal year). Bonuses generally will be payable under the Senior Executive Bonus Plan upon the attainment of pre-established performance goals. Notwithstanding the foregoing, we may pay bonuses (including, without limitation, discretionary bonuses) to participants under the Senior Executive
113
Table of Contents
Bonus Plan based upon such other terms and conditions as the board of directors or a committee of the Company’s board of directors, which we refer to as the Administrator, may in its discretion determine.
Performance goals under the Senior Executive Bonus Plan may relate to one or more corporate business criteria with respect to us or any of our subsidiaries, including but not limited to: sales; revenues; assets; expenses; earnings before or after deduction for all or any portion of interest, taxes, depreciation, or amortization, whether or not on a continuing operations or an aggregate or per share basis (basic or fully diluted); return on equity, capital or assets; one or more operating ratios such as earnings before interest, taxes and/or depreciation and amortization; borrowing levels, leverage ratios or credit rating; market share; capital expenditures; free cash flow, cash flow, return on investment (discounted or otherwise), net cash provided by operations, or cash flow in excess of cost of capital; stock price; earnings per share; shareholder return; sales of particular products or services; customer acquisition or retention; acquisitions and divestitures (in whole or in part); economic value added; strategic business criteria consisting of one or more objectives based on meeting specific market penetration, geographic business expansion goals, facility construction or completion goals, geographic facility relocation or completion goals, cost targets, customer satisfaction, supervision of litigation or information technology; joint ventures and strategic alliances; spin-offs, split-ups and the like; reorganizations; or recapitalizations, restructurings, financings (issuance of debt or equity) or refinancings, any of which may be measured either in absolute terms or as compared to any incremental increase or decrease, or as compared to results of a peer group.
The payment of a bonus to a participant pursuant to the Senior Executive Bonus Plan is generally conditioned on continued employment of such participant through the last day of the performance period; however, the Administrator may make exceptions to this requirement in its sole discretion, including, without limitation, in the case of a participant’s termination of employment, retirement, death or disability, or as may be required by an individual employment or similar agreement.
The Senior Executive Bonus Plan is administered by the Administrator. The Administrator will select the participants in the Senior Executive Bonus Plan and the performance goals to be utilized with respect to the participants, establish the bonus formulas for each participant’s annual bonus, and certify whether any applicable performance goals have been met with respect to a given performance period. We may amend or terminate the Senior Executive Bonus Plan at any time in our sole discretion. Any amendments to the Senior Executive Bonus Plan will require stockholder approval only to the extent required by applicable law, rule or regulation.
Summary Compensation Table
The following summary compensation table sets forth the total compensation paid or accrued for the years ended December 31, 2012 and December 31, 2013, for each individual who served as our Chief Executive Officer or Chief Financial Officer during fiscal year 2013, and our three other most highly compensated executive officers who were serving as executive officers on December 31, 2013.
| Name and Principal |
Year | Salary ($)(1) |
Bonus ($) |
Stock Awards ($) |
Option Awards ($) |
Non-Equity Incentive Plan Compensation ($)(5) |
Change in Pension Value and Non- qualified Deferred Compensation Earnings ($) |
All Other Compensation ($)(6) |
Total ($) | |||||||||||||||||||||||||||
| Thomas G. Dundon, CEO |
|
2013 2012 |
|
|
1,500,000 1,500,000 |
|
|
136,376 613,694 |
(2)
|
|
8,040,984 613,484 |
(4)
|
|
— 78,479,071 |
|
|
3,750,000 3,750,000 |
|
|
— — |
|
|
235,820 263,411 |
|
|
13,663,180 85,219,660 |
| |||||||||
| Jason A. Kulas, |
|
2013 2012 |
|
|
400,000 400,000 |
|
|
275,930 115,000 |
(3)
|
|
3,618,440 — |
(4)
|
|
— 6,208,846 |
|
|
1,000,000 1,000,000 |
|
|
— — |
|
|
17,544 29,006 |
|
|
5,311,914 7,752,852 |
| |||||||||
| Jason W. Grubb, |
|
2013 2012 |
|
|
350,000 350,000 |
|
|
240,606 100,000 |
(3)
|
|
603,064 — |
(4)
|
|
— 5,551,138 |
|
|
650,000 650,000 |
|
|
— — |
|
|
12,381 12,381 |
|
|
1,856,051 6,663,519 |
| |||||||||
| Eldridge A. Burns |
|
2013 2012 |
|
|
240,000 240,000 |
|
|
164,211 — |
(3)
|
|
— — |
|
|
— 2,394,083 |
|
|
260,000 325,000 |
|
|
— — |
|
|
12,015 12,413 |
|
|
676,226 2,971,496 |
| |||||||||
| Richard Morrin, |
|
2013 2012 |
|
|
255,000 255,000 |
|
|
205,615 230,000 |
(3)
|
|
— — |
|
|
— 1,604,828 |
|
|
255,000 255,000 |
|
|
— — |
|
|
19,755 28,320 |
|
|
735,370 2,373,148 |
| |||||||||
| (1) | We base the amounts in this column on actual base compensation paid through the end of the applicable fiscal year. |
114
Table of Contents
| (2) | Reflects a cash amount with respect to 2011 variable compensation that vests and becomes payable annually to Mr. Dundon in each of 2013, 2014 and 2015 pursuant to Santander’s Management Board Compensation Policy and Identified Staff Plan. See “— Santander’s Management Board Compensation Policy and Identified Staff Plan” and “— Outstanding Equity Awards at Fiscal 2013 Year End.” |
| (3) | Reflects the cash retention amounts (and related tax gross-ups) paid to Messrs. Kulas, Grubb, Burns and Morrin in July 2013. See “— Retention Bonuses.” |
| (4) | The value of the stock awards included in the Summary Compensation Table is based on the aggregate grant date fair value computed in accordance with ASC 718. For assumptions used in determining these values, see “— Determination of the Fair Value of Stock-based Compensation Grants.” See “Outstanding Equity Awards at Fiscal 2013 Year End” table for additional information regarding the vesting parameters that are applicable to these awards. |
| (5) | Reflects amounts paid to the NEOs under the SCUSA EIP. See “— SCUSA Executive Incentive Program.” |
| (6) | Includes the following amounts paid to or on behalf of the NEOs in fiscal year 2013: |
| Car Allowance ($) |
SCUSA Contribution to Defined Contribution Plan ($) |
Club Memberships ($) |
Financial Planning ($) |
Estate Planning ($) |
Legal Expenses ($) |
Executive Disability Benefits ($)(b) |
Medical Reimbursements ($) |
Paid Parking and Tolls ($) |
Total ($) | |||||||||||||||||||||||||||||||
| Thomas G. Dundon(a) |
12,246 | 12,750 | — | 177,415 | 7,054 | 8,365 | 13,979 | (c) | 3,501 | 510 | 235,820 | |||||||||||||||||||||||||||||
| Jason A. Kulas |
9,600 | 5,538 | — | — | — | — | 2,406 | — | — | 17,544 | ||||||||||||||||||||||||||||||
| Jason W. Grubb |
9,600 | — | — | — | — | — | 2,781 | — | — | 12,381 | ||||||||||||||||||||||||||||||
| Eldridge A. Burns, Jr. |
9,600 | — | — | — | — | — | 2,505 | — | — | 12,105 | ||||||||||||||||||||||||||||||
| Richard Morrin |
9,600 | 7,650 | — | — | — | — | 2,505 | — | — | 19,755 | ||||||||||||||||||||||||||||||
| (a) | The Company permits Mr. Dundon to use reward points earned on the Company credit card in connection with payment of corporate expenses for Mr. Dundon’s personal use. |
| (b) | Amount listed represents the annual premiums paid by the Company for NEO executive disability benefits. |
| (c) | Amount listed represents the annual premiums paid by the Company for Mr. Dundon’s executive disability benefits, inclusive of an additional rider. |
Grants of Plan-Based Awards — 2013
| Name |
Grant Date | Estimated Possible Future Payouts Under Non-Equity Incentive Plan Awards ($)(1) |
All Other Stock Awards: Number of Shares of Stock or Units (#)(2) |
Grant Date Fair Value of Stock and Option Awards ($)(3) |
||||||||||
| Thomas G. Dundon |
February 2013 | 1,500,000 | ||||||||||||
| December 2013 | 143,589 | 8,040,984 | ||||||||||||
| Jason A. Kulas |
February 2013 | 400,000 | ||||||||||||
| December 2013 | 64,615 | 3,618,440 | ||||||||||||
| Jason W. Grubb |
February 2013 | 350,000 | ||||||||||||
| December 2013 | 10,769 | 603,064 | ||||||||||||
| Eldridge A. Burns, Jr. |
February 2013 | 240,000 | ||||||||||||
| Richard Morrin |
February 2013 | 255,000 | ||||||||||||
| (1) | The amounts set forth in this column reflect the target bonus opportunities for each of our NEOs pursuant to the SCUSA EIP for fiscal year 2013. |
| (2) | The amounts set forth in this column reflect the restricted shares that were granted to certain of our NEOs in 2013 pursuant to the Omnibus Incentive Plan. Restricted shares vest ratably over five years, subject to continued employment. |
| (3) | The value of the stock awards included in the Summary Compensation Table is based on the aggregate grant date fair value computed in accordance with ASC 718. For assumptions used in determining these values, |
115
Table of Contents
| see “— Determination of the Fair Value of Stock-based Compensation Grants.” See “Outstanding Equity Awards at Fiscal 2013 Year End” table for additional information regarding the vesting parameters that are applicable to these awards. |
Outstanding Equity Awards at Fiscal 2013 Year End
| Option Awards | Stock Awards | |||||||||||||||||||||||||||
| Name |
Number of Securities Underlying Unexercised Options Exercisable (#) |
Number of Securities Underlying Unexercised Options Unexercisable (#)(1) |
Equity Incentive Plan Awards: Number of Securities Underlying Unexercised Unearned Options (#)(2) |
Option Exercise Price ($)(3) |
Option Expiration Date |
Number of Shares or Units of Stock that have not Vested (#) |
Market Value of Shares or Units of Stock that have not Vested ($) |
|||||||||||||||||||||
| Thomas G. Dundon |
1,509,281 | 727,132 | 1,536,789 | 24.54 | 12/31/2021 | |||||||||||||||||||||||
| 475,932 | — | 713,899 | 32.24 | 12/31/2021 | ||||||||||||||||||||||||
| 143,589 | (4) | 8,040,984 | (7) | |||||||||||||||||||||||||
| 8,356 | (5) | 30,465 | (8) | |||||||||||||||||||||||||
| 34,569 | (6) | 163,270 | (8) | |||||||||||||||||||||||||
| Jason A. Kulas |
132,112 | 116,957 | 81,210 | 24.54 | 12/31/2021 | — | — | |||||||||||||||||||||
| 23,888 | — | 35,833 | 32.24 | 12/31/2021 | — | — | ||||||||||||||||||||||
| 64,615 | (4) | 3,618,440 | (7) | |||||||||||||||||||||||||
| 1,938 | (5) | 9,153 | (8) | |||||||||||||||||||||||||
| 3,295 | (6) | 15,562 | (8) | |||||||||||||||||||||||||
| Jason W. Grubb |
118,117 | 104,567 | 72,608 | 24.54 | 12/31/2021 | — | — | |||||||||||||||||||||
| 21,358 | — | 32,807 | 32.24 | 12/31/2021 | — | — | ||||||||||||||||||||||
| 10,769 | (4) | 603,064 | (7) | |||||||||||||||||||||||||
| 1,188 | (5) | 5,611 | (8) | |||||||||||||||||||||||||
| 1,521 | (6) | 7,184 | (8) | |||||||||||||||||||||||||
| Eldridge A. Burns, Jr. |
50,941 | 45,908 | 31,314 | 24.54 | 12/31/2021 | — | — | |||||||||||||||||||||
| 9,211 | — | 13,817 | 32.24 | 12/31/2021 | — | — | ||||||||||||||||||||||
| Richard Morrin |
34,148 | 30,230 | 20,991 | 24.54 | 12/31/2021 | — | — | |||||||||||||||||||||
| 6,174 | — | 9,262 | 32.24 | 12/31/2021 | — | — | ||||||||||||||||||||||
| (1) | Options with respect to SCUSA common stock were granted under the Management Equity Plan in February 2012. Time-vesting options generally vest and become exercisable over five years in equal installments subject to the participant’s continued employment. With respect to the options held by Messrs. Dundon, Kulas and Grubb, our board of directors intends to accelerate the vesting of such options effective as of, and subject to, the occurrence of this offering. |
| (2) | Options with respect to SCUSA common stock were granted under the Management Equity Plan in February 2012. Performance-vesting options generally vest and become exercisable over five years in equal annual installments, based on our achievement of applicable threshold ROE targets, and subject to the participant’s continued employment at each measurement date. These ROE targets are an ROE of 27.5% for each of 2012 and 2013 and 18% for each of the years 2014 through 2016. If we do not achieve the applicable threshold ROE target with respect to a measurement date, the portion of the performance-vesting option that would have vested had the ROE target been met will remain outstanding and will vest if, at any point prior to the earlier of the end of the five-year performance period or a “change in control” (as defined in the Management Equity Plan), we achieve an average ROE target of 25.0%, subject to the participant’s |
116
Table of Contents
| continued employment through such time. With respect to the options held by Messrs. Dundon, Kulas and Grubb, our board of directors has approved the acceleration of the vesting of such options (including the waiver of performance conditions) effective as of, and subject to, the occurrence of the offering (and contingent on their continued employment through this offering). |
| (3) | Exercise prices were retroactively adjusted to reflect dividend protection adjustments. As discussed under the heading “—Our Equity Incentive Plans,” in connection with the Reorganization, the Management Equity Plan will be assumed by the Company and all awards outstanding under the Management Equity Plan at the time of the Reorganization will be adjusted, in accordance with the terms of the Management Equity Plan, and on the same basis as shares of SCUSA Illinois, generally (including with respect to any stock splits or similar adjustments effected in connection with the Reorganization). |
| (4) | Restricted shares granted under the Omnibus Incentive Plan vest ratably over five years, subject to continued employment. Vesting may be accelerated upon death, disability, termination of employment without cause or upon a change in control; provided, that, a change in control will not be deemed to occur as a result of the initial public offering or related transactions (including the Reorganization). |
| (5) | Reflects restricted shares of Santander common stock outstanding in respect of NEO bonus deferrals under Santander’s Management Board Compensation Policy and Identified Staff Plan in fiscal year 2010. |
| (6) | Reflects restricted shares of Santander common stock outstanding in respect of NEO bonus deferrals under Santander’s Management Board Compensation Policy and Identified Staff Plan in fiscal year 2011. |
| (7) | Valuation based on a per share price of our common stock on December 31, 2013 of $56.00, computed in accordance with ASC 718. For assumptions used in determining these values, see “— Determination of the Fair Value of Stock-based Compensation Grants.” As discussed under the heading “— Our Equity Incentive Plans,” in connection with the Reorganization, the Omnibus Incentive Plan will be assumed by the Company and all awards outstanding under the Omnibus Incentive Plan at the time of the Reorganization will be adjusted, in accordance with the terms of the Omnibus Incentive Plan, and on the same basis as shares of SCUSA Illinois, generally (including with respect to any stock splits or similar adjustments effected in connection with the Reorganization). |
| (8) | Valuation based on a per share closing price of Santander common stock on December 31, 2013 of €6.51 and a rate of exchange of 0.7255 Euros to one U.S. Dollar on such date. |
Option Exercises and Stock Vested — 2013
| Option Awards | Stock Awards | |||||||||||||||
| Name |
Number of Shares Acquired on Exercise (#) |
Value Realized on Exercise ($) |
Number of Shares Acquired on Vesting (#) |
Value Realized on Vesting ($)(3) |
||||||||||||
| Thomas G. Dundon |
||||||||||||||||
| — | — | 8,803 | (1) | 69,315 | ||||||||||||
| 17,285 | (2) | 136,105 | ||||||||||||||
| Jason A. Kulas |
— | — | 2,042 | (1) | 16,079 | |||||||||||
| 1,647 | (2) | 12,974 | ||||||||||||||
| Jason W. Grubb |
— | — | 1,252 | (1) | 9,856 | |||||||||||
| 760 | (2) | 5,987 | ||||||||||||||
| Eldridge A. Burns, Jr. |
— | — | — | — | ||||||||||||
| Richard Morrin |
— | — | — | — | ||||||||||||
| (1) | Reflects certain deferred bonus amounts with respect to 2010 bonuses that were paid out in shares of Santander common stock in fiscal year 2013. |
117
Table of Contents
| (2) | Reflects certain deferred bonus amounts with respect to 2011 bonuses that were paid out in shares of Santander common stock in fiscal year 2013. |
| (3) | Valuation based on per share closing price of Santander common stock on February 15, 2013 of €5.89 and a rate of exchange of 0.748 Euros to one U.S. Dollar on such date. |
Our Equity Incentive Plans
Under the Management Equity Plan, eligible Company employees and directors (including the NEOs) may receive nonqualified stock options to purchase SCUSA common stock with an exercise price of at least the fair market value of SCUSA common stock on the date of grant. The Management Equity Plan also provides for the grant of premium priced stock options, which are granted with a per share exercise price in excess of the fair market value of SCUSA common stock on the date of grant. As a condition to receiving nonqualified stock options under the Management Equity Plan, employees and directors must subscribe to purchase a set number of shares of SCUSA common stock at fair market value. In connection with the Reorganization, the Management Equity Plan will be assumed by the Company and all awards outstanding under the Management Equity Plan at the time of the Reorganization will be adjusted, in accordance with the terms of the Management Equity Plan, and on the same basis as shares of SCUSA Illinois, generally.
Grants may be in the form of time-vesting options (with vesting based on continued provision of services to SCUSA), or in the form of performance-vesting options (with vesting based on continued service with SCUSA and the achievement of performance targets relating to SCUSA’s return on equity).
Time-vesting options generally vest and become exercisable over five years in equal annual installments subject to the participant’s continued employment. Performance-vesting options generally vest and become exercisable over five years in equal annual installments, based on our achievement of applicable threshold return on equity (“ROE”) targets (determined in accordance with GAAP), and subject to the participant’s continued employment at each measurement date. These ROE targets are an ROE of 27.5% for each of 2012 and 2013 and 18.0% for each of the years 2014 through 2016. If we do not achieve the applicable threshold ROE target with respect to a measurement date, the portion of the performance-vesting option that would have vested had the ROE target been met will remain outstanding and will vest if, at any point prior to the earlier of the end of the five-year performance period or a “change in control” (as defined in the Management Equity Plan), we achieve an average ROE target of 25.0%, subject to the participant’s continued employment through such time.
Generally, unless otherwise determined by our board of directors, a participant will forfeit his or her unvested options upon termination of employment, other than in the circumstances set forth below. Upon a participant’s termination of employment due to death or disability, (i) the portion of the participant’s time-vesting options that would have vested had the participant continued to provide services through the next following anniversary of the grant date will vest and become exercisable upon such termination, and (ii) any of the participant’s unvested performance-vesting options will remain outstanding until the next applicable vesting date and will vest with respect to the portion that was scheduled to vest on such vesting date if, and to the extent that, such portion would have vested had the participant continued to be employed until such vesting date. A participant’s vested stock options will terminate on the earliest to occur of: (u) the tenth anniversary of the date of grant, (v) one year after the participant’s termination of employment by reason of death or disability, (w) immediately upon the participant’s involuntary termination for “cause” (as defined in the Management Equity Plan), (x) 30 days after the participant’s voluntary termination without “good reason” (as defined in the Management Equity Plan), (y) 60 days after the participant’s involuntary termination other than for cause, death or disability or by the participant voluntarily for good reason, or (z) at a time set in the discretion of our board of directors, in the event of a change in control.
Upon a change in control, (i) any unvested time-vesting options will automatically vest and become exercisable, (ii) any unvested performance-vesting options will vest to the extent that we achieve an average ROE target of 25.0% with respect to the period commencing on the beginning of the five-year performance period and ending on the change in control.
118
Table of Contents
The Management Equity Plan provides that issuance of shares underlying awards is contingent on the participant signing and agreeing to be bound to a Management Shareholder Agreement with respect to such shares. Each Management Shareholder Agreement provides for certain repurchase rights and restrictions, including that shares obtained through exercise of stock options may not be transferred until the later of an IPO or December 31, 2016 (the “Lapse Date”). Upon the participant’s termination of employment due to death or disability, the participant is entitled to require that we repurchase all of the participant’s shares at their then-fair market value or, in the event of the participant’s breach of restrictions on transfer or restrictive covenants in the Management Shareholder Agreement, at the price that the participant originally paid for such shares. Upon the participant’s termination of employment for any reason, or the participant’s breach of restrictions on transfer or restrictive covenants in the Management Shareholder Agreement, we are entitled to require that the participant sell all of the participant’s shares to us at their then-fair market value or, in the event of the participant’s termination of employment for cause or without good reason, or the participant’s breach of restrictions on transfer or restrictive covenants in the Management Shareholder Agreement, at the price that the participant originally paid for such shares. The transfer restrictions and repurchase rights in the Management Shareholder Agreement terminate on the Lapse Date; however, our board of directors has approved the amendment of option award agreements with respect to options previously granted under the Management Equity Plan and the amendment of the Management Shareholders Agreement effective as of and subject to the occurrence of the offering to remove certain transfer restrictions with respect to shares underlying a portion of such outstanding options and provide for additional transfer restrictions with respect to shares underlying another portion of such outstanding options.
Omnibus Incentive Plan
Introduction
We have adopted the Omnibus Incentive Plan. The Omnibus Incentive Plan provides for the grant of nonqualified and incentive stock options, SARs, restricted stock awards, restricted stock units and other awards that may be settled in or based upon the value of our common stock. Set forth below is a summary of the material features that are in the Omnibus Incentive Plan. This summary is qualified in its entirety by the actual Omnibus Incentive Plan. In connection with the Reorganization, the Omnibus Incentive Plan will be assumed by the Company, and all awards outstanding under the Omnibus Incentive Plan at the time of the Reorganization will be adjusted, in accordance with the terms of the Omnibus Incentive Plan, and on the same basis as shares of SCUSA Illinois, generally.
Purpose
The purpose of the Omnibus Incentive Plan is to give us a competitive advantage in attracting, retaining and motivating officers, employees, directors and consultants and to provide a means whereby officers, employees, directors and/or consultants can acquire and maintain ownership of our common stock or be paid incentive compensation measured by reference to the value of our common stock, thereby strengthening their commitment to our welfare and that of our affiliates and promoting an identity of interest between our stockholders and recipients of awards under the Omnibus Incentive Plan.
Administration
The Omnibus Incentive Plan will be administered by our board of directors or such other committee of our board of directors as our board of directors may from time to time designate, which we refer to as the Committee. Among other things, the Committee has the authority to select individuals to whom awards may be granted, to determine the type of award as well as the number of shares of common stock to be covered by each award, and to determine the terms and conditions of any such awards. Subject to applicable law, the Committee may allocate all or any portion of its responsibilities and powers to any one or more of its members or persons selected by it.
Eligibility
Current and prospective directors, employees (including executive officers) and/or consultants to us and any of our subsidiaries and affiliates are eligible to participate in the Omnibus Incentive Plan.
119
Table of Contents
Shares Subject to the Omnibus Incentive Plan
The aggregate number of shares of our common stock available for issuance under the Omnibus Incentive Plan is 1,947,362 shares. The maximum number of shares that may be granted pursuant to options intended to be incentive stock options is 1,947,362 shares.
The shares of common stock subject to grant under the Omnibus Incentive Plan are to be made available from authorized but unissued shares, from treasury shares, from shares purchased on the open market or by private purchase, or a combination of any of the foregoing. To the extent that any award is forfeited, or any stock option or stock appreciation right terminates, expires or lapses without being exercised, or any award is settled for cash, the shares of common stock subject to such awards not delivered as a result thereof will again be available for awards under the Omnibus Incentive Plan. If the exercise price of any option and/or the tax withholding obligations relating to any award are satisfied by delivering shares of common stock (by either actual delivery or by attestation), only the number of shares of common stock issued net of the shares of common stock delivered or attested will be deemed delivered for purposes of the limits in the Omnibus Incentive Plan. To the extent any shares of common stock subject to an award are withheld to satisfy the exercise price (in the case of a stock option) and/or the tax withholding obligations relating to such award, such shares of common stock will not generally be deemed to have been delivered for purposes of the limits set forth in the Omnibus Incentive Plan.
The Omnibus Incentive Plan provides that in the event of certain extraordinary corporate transactions or events affecting us, the Committee or our board of directors will make such substitutions or adjustments as it deems appropriate and equitable to (1) the aggregate number and kind of shares or other securities reserved for issuance and delivery under the Omnibus Incentive Plan, (2) the various maximum limitations set forth in the Omnibus Incentive Plan, (3) the number and kind of shares or other securities subject to outstanding awards and (4) the exercise price of outstanding options and stock appreciation rights. In the case of corporate transactions such as a merger or consolidation, such adjustments may include the cancellation of outstanding awards in exchange for cash or other property or the substitution of other property for the shares subject to outstanding awards.
Awards
As indicated above, several types of awards can be made under the Omnibus Incentive Plan. A summary of these awards is set forth below.
Stock Options and Stock Appreciation Rights
Stock options granted under the Omnibus Incentive Plan may either be incentive stock options, which are intended to qualify for favorable treatment to the recipient under U.S. federal tax law, or nonqualified stock options, which do not qualify for this favorable tax treatment. Stock appreciation rights granted under the Omnibus Incentive Plan may either be “tandem SARs,” which are granted in conjunction with a stock option, or “free-standing SARs,” which are not granted in tandem with a stock option.
Each grant of stock options or stock appreciation rights under the Omnibus Incentive Plan will be evidenced by an award agreement that specifies the exercise price, the duration of the award, the number of shares to which the award pertains and such additional limitations, terms and conditions as the Committee may determine, including, in the case of stock options, whether the options are intended to be incentive stock options or nonqualified stock options. The Omnibus Incentive Plan provides that the exercise price of stock options and stock appreciation rights will be determined by the Committee, but may not be less than 100% of the fair market value of the stock underlying the stock options or stock appreciation rights on the date of grant. Award holders may pay the exercise price in cash or, if approved by the Committee, in common stock (valued at its fair market value on the date of exercise) or a combination thereof, or by “cashless exercise” through a broker or by withholding shares otherwise receivable on exercise. The term of stock options and stock appreciation rights will be determined by the Committee, but may not exceed ten years from the date of grant. The Committee will determine the vesting and exercise schedule of stock options and stock appreciation rights, and the extent to which they will be exercisable after the award holder’s service with the Company terminates.
120
Table of Contents
Restricted Stock
Restricted stock may be granted under the Omnibus Incentive Plan with such restrictions as the Committee may designate. The Committee may provide at the time of grant that the vesting of restricted stock will be contingent upon the achievement of applicable performance goals and/or continued service. Except for these restrictions and any others imposed under the Omnibus Incentive Plan or by the Committee, upon the grant of restricted stock under the Omnibus Incentive Plan, the recipient will have rights of a stockholder with respect to the restricted stock, including the right to vote the restricted stock; however, whether and to what extent the recipient will be entitled to receive cash or stock dividends paid, either currently or on a deferred basis, will be set forth in the award agreement.
Restricted Stock Units
The Committee may grant restricted stock units payable in cash or shares of common stock, conditioned upon continued service and/or the attainment of performance goals (as described below) determined by the Committee. We are not required to set aside a fund for the payment of any restricted stock units and the award agreement for restricted stock units will specify whether, to what extent and on what terms and conditions the applicable participant will be entitled to receive dividend equivalents with respect to the restricted stock units.
Stock-Bonus Awards
The Committee may grant unrestricted shares of our common stock, or other awards denominated in our common stock, alone or in tandem with other awards, in such amounts and subject to such terms and conditions as the Committee determines from time to time in its sole discretion as, or in payment of, a bonus, or to provide incentives or recognize special achievements or contributions.
Performance Awards
Under the Omnibus Incentive Plan, the Committee may determine that the grant, vesting or settlement of an award granted under the Omnibus Incentive Plan may be subject to the attainment of one or more performance goals.
The Committee has the authority to establish any performance objectives to be achieved during the applicable performance period when granting performance awards. However, if an award under the Omnibus Incentive Plan is intended to qualify as “performance-based compensation” under Section 162(m) of the Internal Revenue Code, the performance goals will be established with reference to one or more of the following, either on a Company-wide basis, or, as relevant in respect of one or more affiliates, subsidiaries, divisions, departments or operations of the Company: earnings (gross, net, pre-tax, post-tax or per share), net profit after tax, EBITDA, gross profit, cash generation, unit volume, market share, sales, asset quality, earnings per share, operating income, revenues, return on assets, return on operating assets, return on equity, profits, total stockholder return (measured in terms of stock price appreciation and/or dividend growth), cost saving levels, marketing spending efficiency, core non-interest income, change in working capital, return on capital and/or stock price.
Termination of Employment
The impact of a termination of employment on an outstanding award granted under the Omnibus Incentive Plan, if any, will be set forth in the applicable award agreement.
Treatment of Outstanding Equity Awards following a Change in Control
The Omnibus Incentive Plan provides that, unless otherwise set forth in an award agreement, in the event of a change in control (as defined in the Omnibus Incentive Plan), (1) any restricted stock that was forfeitable prior to such change in control will become nonforfeitable, (2) all restricted stock units will be considered earned and
121
Table of Contents
payable in full and any restrictions thereon will lapse, (3) any unexercised stock option or SAR, whether or not exercisable on the date of such change in control, will become fully exercisable and may be exercised in whole or in part, and (4) the Committee may determine the level of achievement with respect to any performance-based awards through the date of the change in control. The Committee may make additional adjustments and/or settlements of outstanding awards upon a change in control, including cancelling any awards for cash upon at least ten days’ advance notice to affected participants.
A “change in control” is generally deemed to occur under the Omnibus Incentive Plan upon:
| (1) | the acquisition by any individual, entity or group of “beneficial ownership” (pursuant to the meaning given in Rule 13d-3 under the Exchange Act) of 30% or more of either (a) the outstanding shares of the Company’s common stock or (b) the combined voting power of our then outstanding voting securities, with each of clauses (a) and (b) subject to certain customary exceptions; |
| (2) | a majority of the directors who constituted our board of directors at the time the Omnibus Incentive Plan was adopted are replaced by directors whose appointment or election is not endorsed by at least two-thirds of the incumbent directors then on the board of directors; |
| (3) | approval by our stockholders of the Company’s complete dissolution or liquidation; or |
| (4) | the consummation of a merger of the Company, the sale or disposition by the Company of all or substantially all of its assets, or any other business combination of the Company with any other corporation, other than any merger or business combination following which (a) the individuals and entities that were the beneficial owners of the outstanding common stock and the voting securities immediately prior to such business combination beneficially own more than 50% of the then-outstanding shares of common stock and combined voting power of the then-outstanding voting securities entitled to vote generally in the election of directors of the entity resulting from such business combination in substantially the same proportions as immediately prior to such business combination, (b) no person beneficially owns 30% or more of the then-outstanding shares of common stock of the entity resulting from such business combination or the combined voting power of the then-outstanding voting securities of such entity and (c) at least two-thirds of the members of the board of directors of the parent company (or, if there is no parent company, the surviving company) following the consummation of the transaction were members of the board of directors at the time the execution of the initial agreement providing for the transaction was approved. |
However, a “change in control” will not be deemed to occur as a result of the offering or related transactions (e.g., the Reorganization).
Amendment and Termination
The Omnibus Incentive Plan may be amended, altered, suspended, discontinued or terminated by the Board, but no amendment, alteration, suspension, discontinuation or termination may be made if it would materially impair the rights of a participant (or his or her beneficiary) without the participant’s (or beneficiary’s) consent, except for any such amendment required to comply with law. The Omnibus Incentive Plan may not be amended, without stockholder approval to the extent such approval is required to comply with applicable law or the listing standards of the applicable exchange.
Federal Income Tax Consequences Relating to Equity Awards Granted pursuant to the Omnibus Incentive Plan
The following discussion summarizes certain federal income tax consequences of the issuance, receipt and exercise of stock options and the granting and vesting of restricted stock, in each case under the Omnibus Incentive Plan. The summary does not purport to cover federal employment tax or other federal tax consequences that may be associated with the Omnibus Incentive Plan, nor does it cover state, local or non-U.S. taxes.
122
Table of Contents
Incentive Stock Options
In general, a participant realizes no taxable income upon the grant or exercise of an incentive stock option (“ISO”). However, the exercise of an ISO may result in an alternative minimum tax liability to the participant. With certain exceptions, a disposition of shares purchased under an ISO within two years from the date of grant or within one year after exercise produces ordinary income to the participant (and a deduction for us) equal to the value of the shares at the time of exercise less the exercise price. Any additional gain recognized in the disposition is treated as a capital gain for which we are not entitled to a deduction. If the participant does not dispose of the shares until after the expiration of these one- and two-year holding periods, any gain or loss recognized upon a subsequent sale is treated as a long-term capital gain or loss for which we are not entitled to a deduction.
Nonqualified Options
In general, in the case of a nonqualified stock option (“NSO”), the participant has no taxable income at the time of grant but realizes income in connection with exercise of the option in an amount equal to the excess (at the time of exercise) of the fair market value of the shares acquired upon exercise over the exercise price. A corresponding deduction is available to us. Any gain or loss recognized upon a subsequent sale or exchange of the shares is treated as capital gain or loss for which we are not entitled to a deduction.
Restricted Stock
Unless a participant makes an election to accelerate recognition of the income to the date of grant as described below, the participant will not recognize income, and the Company will not be allowed a tax deduction, at the time a restricted stock award is granted. When the restrictions lapse, the participant will recognize ordinary income equal to the fair market value of the common stock as of that date, less any amount paid for the stock, and the Company will be allowed a corresponding tax deduction at that time. If the participant files an election under Section 83(b) of the Code within 30 days after the date of grant of the restricted stock, the participant will recognize ordinary income as of the date of grant equal to the fair market value of the common stock as of that date, less any amount the participant paid for the common stock, and we will be allowed a corresponding tax deduction at that time. Any future appreciation in the common stock will be taxable to the participant at capital gains rates. However, if the restricted stock award is later forfeited, the participant will not be able to recover the tax previously paid pursuant to his Section 83(b) election.
Restricted Stock Units
A participant does not recognize income, and the Company will not be allowed a tax deduction, at the time a restricted stock unit is granted. When the restricted stock units vest and are settled for cash or stock, the participant generally will be required to recognize as income an amount equal to the fair market value of the shares on the date of vesting. Any gain or loss recognized upon a subsequent sale or exchange of the stock (if settled in stock) is treated as capital gain or loss for which we are not entitled to a deduction.
Employment Agreements with Named Executive Officers
Employment Agreement with Thomas Dundon
Santander and the Company entered into an employment agreement with Mr. Dundon on December 31, 2011, which amended and restated the obligations of the parties under a prior agreement, dated September 23, 2006, as amended. Mr. Dundon’s employment agreement has an initial term of five years and, unless earlier terminated, will automatically extend annually for additional one-year terms following that time, unless any party provides written notice at least 90 days prior to such anniversary date that such party did not agree to renew the employment agreement. The employment agreement provides for an initial base salary of $1,500,000 per year, which will be reviewed annually and is subject to increase at the discretion of our board of directors. In addition
123
Table of Contents
to base salary, Mr. Dundon is eligible to receive an annual cash performance bonus with a target of no less than 100% of his then-current base salary and a maximum of up to 250% of his then-current base salary. The employment agreement also provides that, among other things, Mr. Dundon has a right to participate in all equity compensation programs and all other employee benefit plans and programs generally available to SCUSA’s senior executives and receive reimbursement of reasonable expenses in accordance with SCUSA’s policies and practices.
Subject to Mr. Dundon’s execution of a general release and waiver, if Mr. Dundon’s employment is terminated by SCUSA for any reason other than “cause” (but excluding death or disability), or if Mr. Dundon resigns for “good reason” (as defined below), Mr. Dundon is entitled to:
| • | an amount equal to two times the sum of his then-current base salary and the target annual cash performance bonus then in effect, payable in a lump sum; |
| • | a lump sum payment equal to his then-current base salary, prorated through the date of termination; and |
| • | continuation of welfare benefits (including life, long-term disability and other fringe benefits) for Mr. Dundon and his dependents, on the same basis as provided to actively employed senior executives of SCUSA, until (i) the third anniversary of Mr. Dundon’s termination of employment, or (ii) with respect to benefits under SCUSA’s health insurance plan, the 18-month anniversary of Mr. Dundon’s termination of employment. |
If Mr. Dundon’s employment is terminated as a result of his death or “inability to perform” (generally defined as being disabled under SCUSA’s long-term disability plan), he is entitled to (i) a lump sum payment equal to his then-current base salary, prorated through the date of termination, and (ii) in the event of a termination of employment due to “inability to perform” only, continuation of welfare benefits (including life, long-term disability and other fringe benefits) for Mr. Dundon and his dependents, on the same basis as provided to actively employed senior executives, until the third anniversary of Mr. Dundon’s termination of employment, or, with respect to benefits under SCUSA’s health insurance plan, the 18-month anniversary of Mr. Dundon’s termination of employment.
Pursuant to the terms of his employment agreement, Mr. Dundon is subject to the following restrictive covenants: (i) perpetual confidentiality; (ii) non-solicitation of employees, customers, suppliers or vendors of SCUSA or its affiliates during the term of employment and for a period of two years thereafter (subject to certain exceptions described in this paragraph, the “Dundon Restricted Period”); (iii) non-competition during the term of employment and for the Dundon Restricted Period; (iv) cooperation in the context of litigation involving SCUSA or its affiliates; and (v) non-disparagement of SCUSA, its affiliates, or their products, services or operations, officers, directors or employees during the term of employment and for the Dundon Restricted Period. The Dundon Restricted Period will be reduced to 18 months in the event Mr. Dundon’s employment is terminated by SCUSA for cause. In the event that SCUSA delivers written notice to Mr. Dundon of its desire to not extend the term of the employment agreement, the restrictive covenants will lapse on the last day of the employment term unless, on or before the end of the employment term, SCUSA makes a lump sum payment to Mr. Dundon equal to the sum of his base salary and target bonus in effect on the employment termination date, subject to Mr. Dundon’s execution of a general release and waiver. If SCUSA makes such a lump sum payment, the Dundon Restricted Period will extend for one year following Mr. Dundon’s termination of employment.
In the event that a payment is made to Mr. Dundon in connection with a change in control such that an excise tax imposed by Code Section 4999 applies, Mr. Dundon is entitled to a gross-up payment in an amount such that after payment of all taxes (including interest and penalties imposed with respect thereto), Mr. Dundon retains an amount as if the excise tax did not apply. However, if the amount otherwise due to Mr. Dundon is not more than 110% of the amount that he could receive without triggering the excise tax, the amount shall be reduced so that the excise tax does not apply.
124
Table of Contents
Mr. Dundon’s employment agreement defines “Cause” as (i) breach of the agreement or other certain agreements to which Mr. Dundon and the Company are parties in any material respect; (ii) gross negligence or willful, material malfeasance, misconduct or insubordination in connection with the performance of duties; (iii) willful refusal or recurring failure to carry out written directives or instructions of our board of directors that are consistent with the scope and nature of duties and responsibilities; (iv) willful repeated failure to adhere in any material respect to any material written policy or code of conduct of the Company; (v) willful misappropriation of a material business opportunity, including attempting to secure or securing any personal profit in connection with any transaction entered into on behalf of the Company; (vi) willful misappropriation of any of the Company’s funds or material property; or (vii) conviction of, or the entering of a guilty plea or plea of no contest with respect to, a felony or the equivalent thereof, any other crime involving fraud or theft or any other crime with respect to which imprisonment is a possible punishment or the indictment (or its procedural equivalent) for a felony involving fraud or theft. Any termination of Mr. Dundon’s employment for Cause requires the board of directors to provide prior written notice to Mr. Dundon, a 15-day cure period, and an opportunity for Mr. Dundon to defend himself to the board of directors, other than a termination indicated in (vii), above.
A termination for “Good Reason” occurs if Mr. Dundon terminates his employment for any of the following reasons: (i) any material failure by the Company to comply with its compensation obligations under the agreement; (ii) any material failure by the Company to require a successor to assume the agreement; (iii) a substantial reduction in the executive’s responsibilities or duties except in accordance with the terms of the agreement; (iv) any relocation of the principal place of business of 20 miles or more; (v) materially increasing the travel required in the performance of duties under the agreement for a period of more than three consecutive months; (vi) assignment of duties that are inconsistent with the executive’s role; (vii) the reduction in executive’s title, except as contemplated by agreements or the articles of incorporation or bylaws; (viii) a material reduction in the executive’s responsibilities; or (ix) a resignation for any reason during the 30-day period following the date that is six months after a change in control of the Company. Mr. Dundon must provide SCUSA with written notice prior to any termination for Good Reason, following which SCUSA will have a 30-day period in which to remedy the circumstance.
Mr. Dundon’s employment agreement defines “Change of Control” as the occurrence of either of the following events, other than in connection with an IPO: (i) more than 50% of the equity interests in SCUSA (excluding any equity interests owned by Mr. Dundon) are at any time owned directly or indirectly by a person or entity other than Santander and its affiliates; or (ii) SCUSA sells all or substantially all of the assets owned by it, or ceases to engage in the business of acquiring from automobile dealers retail installment contracts originated in the United States whose obligors have on average, at origination, FICO® scores of less than 660.
The benefits that Mr. Dundon actually received in 2012 under the terms of his employment agreement are reflected in the “— Summary Compensation Table.”
Employment Agreements with Jason A. Kulas, Jason W. Grubb, Eldridge A. Burns, Jr., and Richard Morrin
SCUSA entered into employment agreements with Messrs. Kulas, Grubb and Burns on May 1, 2009, and with Mr. Morrin on August 24, 2011. All of the employment agreements have an initial term of three years and, unless earlier terminated, will automatically extend annually for additional one-year terms following that time, unless any party provides written notice at least three months prior to such anniversary date that such party did not agree to renew the employment agreement. The employment agreements provide for an initial monthly base salary (for Mr. Kulas, $30,943 per month, for Mr. Grubb, $25,750 per month, for Mr. Burns, $15,471 per month and for Mr. Morrin, $21,250 per month), eligibility to receive an annual cash performance bonus, certain deferred bonus payments and participation in equity compensation programs available to SCUSA’s senior executives. The employment agreements also provide that, among other things, each of Messrs. Kulas, Grubb, Burns and Morrin have a right to participate in employee benefit plans and programs generally made available by SCUSA and receive reimbursement of reasonable expenses in accordance with SCUSA’s policies and practices.
125
Table of Contents
Subject to their execution of a general release and waiver, if any of Messrs. Kulas, Grubb, Burns or Morrin’s employment is terminated by us without “cause” (but excluding death or disability), or if he resigns because of a reduction in his base salary or target bonus opportunity, each of Messrs. Kulas, Grubb, Burns and Morrin will be entitled to:
| • | salary continuation for the longer of 12 months or the balance of the employment agreement term; |
| • | full annual cash performance bonus for the calendar year in which the termination of employment occurs; |
| • | certain deferred bonus payments; |
| • | accelerated vesting and settlement of equity-related awards; and |
| • | continuation of medical and dental insurance under COBRA and continuation of life insurance coverage, in each case, for the longer of 12 months or the balance of the employment agreement term. |
If any of Messrs. Kulas, Grubb, Burns or Morrin’s employment is terminated by us for “good reason,” he will be entitled to (i) a lump sum payment equal to 12 months of base salary, (ii) full annual cash performance bonus for the calendar year in which the termination of employment occurs, (iii) certain deferred bonus payments and (iv) continuation of medical and dental insurance under COBRA for 12 months.
If any of Messrs. Kulas, Grubb, Burns or Morrin’s employment is terminated as a result of “disability” (generally defined by reference to SCUSA’s disability plans), he will be entitled to (i) a payment in lieu of short-term salary continuation benefits (only in the event that they are not eligible for short-term benefits due to lack of service with SCUSA), and (ii) prorated portions of his annual cash performance bonus for the year of termination and, in certain cases, for subsequent years.
If any of Messrs. Kulas, Grubb, Burns or Morrin’s employment is terminated as a result of death, their estates will be entitled to (i) 12 months of salary continuation, (ii) full annual cash performance bonus for the calendar year in which the termination of employment occurs, and (iii) continuation of medical and dental insurance for their dependents for the longer of 12 months or the balance of the employment agreement term.
Pursuant to the terms of their employment agreements, each of Messrs. Kulas, Grubb, Burns and Morrin is subject to the following restrictive covenants: (i) perpetual confidentiality; (ii) non-solicitation of employees of SCUSA or its affiliates during the term of employment and for one year thereafter; (iii) non-competition during the term of employment and for any period thereafter that he is receiving severance payments; (iv) cooperation in the context of litigation involving SCUSA or its affiliates during the term of employment and for the pendency of any such litigation or other proceeding; and (v) perpetual non-disparagement of SCUSA, its affiliates, or their officers or directors.
Messrs. Kulas, Grubb, Burns and Morrin’s employment agreements each define “Cause” as (i) dishonesty; (ii) embezzlement, fraud, or other conduct which would constitute a felony, (iii) unauthorized disclosure of confidential information, (iv) failure to obey a material lawful directive that is appropriate to the executive’s position and from executive(s) in the executive’s reporting line; (v) material breach of the agreement; or (vi) failure (except in the event of disability) or refusal to substantially perform material obligations under the agreement.
Messrs. Kulas, Grubb, Burns and Morrin’s employment agreements each define “Good Reason” as termination of employment by us if, in the reasonable opinion of Mr. Dundon in his capacity as the Chief Executive Officer of SCUSA (for so long as Mr. Dundon is Chief Executive Officer of SCUSA), such NEO has not met the expectations or fulfilled the responsibilities required of his position.
The benefits that each of Messrs. Kulas, Grubb, Burns and Morrin actually received in 2012 under the terms of his employment agreement are reflected in the “— Summary Compensation Table.”
126
Table of Contents
Potential Payments upon Termination or Change in Control
A Change in Control does not affect the timing or amount of severance payments to the NEOs under their employment agreements. See “— Employment Agreements with Named Executive Officers.” Under the Management Equity Plan, vesting of awards is subject to acceleration upon a Change in Control. Specifically, unless otherwise provided by our board of directors, (i) time-vesting options will automatically vest and become exercisable, and (ii) performance-vesting options will vest to the extent that the Company achieves the applicable average return on equity target starting at the beginning of a pre-established five-year performance period and ending upon the date of the Change in Control. See “— Medium- and Long-Term Incentive Compensation.”
Under the Management Equity Plan, “Change in Control” is defined as an event upon which (i) any “person” or “group” (as such terms are used in Sections 13(d) and 14(d) of the Exchange Act, or any successor provision), other than Santander and its affiliates or Sponsor Auto Finance Holdings and its affiliates, becomes the “beneficial owner” (as defined in Rules 13d-3 and 13d-5 under the Exchange Act, or any successor provision), directly or indirectly, of more than 20% of the outstanding shares of SCUSA common stock (such person or group, the “Change in Control Owner”) or (ii) an event upon which Santander and its affiliates become the beneficial owners, directly or indirectly, of fewer shares of SCUSA common stock than the Change in Control Owner.
The table below sets forth the value of the benefits (other than payments that were generally available to Company employees) that would have been due to the NEOs if they had terminated employment on December 31, 2013, under their respective employment agreements. For the purposes of this table, the price per share of our common stock on December 31, 2013 was $ 56.00, based on our determination using contemporaneous valuations and considering all objective and subjective factors we believed to be relevant.
| Name |
Cash ($) (1) | Equity ($) (3) | Perquisites/ Benefits ($) |
Tax Reimbursement ($) (7) |
Total ($) | |||||||||||||||
| Thomas G. Dundon |
||||||||||||||||||||
| Termination due to Death |
1,500,000 | 37,434,772 | — | — | 38,934,772 | |||||||||||||||
| Termination due to Inability to Perform |
1,500,000 | 37,434,772 | 868,589 | (4) | — | 39,803,361 | ||||||||||||||
| Termination for Good Reason |
7,500,000 | — | 868,589 | — | 8,368,589 | |||||||||||||||
| Termination without Cause |
7,500,000 | 8,040,984 | 868,589 | (4) | 16,409,573 | |||||||||||||||
| Termination without Cause or for Good Reason in Connection with a Change in Control |
7,500,000 | 96,226,179 | 868,589 | 18,441,447 | 123,036,215 | |||||||||||||||
| Change in Control (no termination of employment) |
— | 96,226,179 | — | 14,042,714 | 110,268,893 | |||||||||||||||
| Jason A. Kulas |
||||||||||||||||||||
| Termination due to Death |
800,000 | 5,980,350 | 18,924 | (6) | — | 6,799,274 | ||||||||||||||
| Termination due to Disability |
400,000 | (2) | 5,980,350 | — | — | 6,380,350 | ||||||||||||||
| Termination without Cause, resignation due to reduction in base salary or target bonus opportunity |
800,000 | 10,704,166 | 76,432 | (5) | — | 11,580,598 | ||||||||||||||
| Termination by the Company for Good Reason |
800,000 | — | 18,924 | (6) | — | 818,925 | ||||||||||||||
| Change in Control (no termination of employment) |
— | 10,704,166 | — | 10,704,166 | ||||||||||||||||
| Jason W. Grubb |
||||||||||||||||||||
| Termination due to Death |
700,000 | 2,714,774 | 18,924 | (6) | — | 3,433,699 | ||||||||||||||
| Termination due to Disability |
350,000 | (2) | 2,714,774 | — | — | 3,064,774 | ||||||||||||||
| Termination without Cause, resignation due to reduction in base salary or target bonus opportunity |
700,000 | 6,956,484 | 76,432 | (5) | — | 7,732,916 | ||||||||||||||
| Termination by the Company for Good Reason |
700,000 | — | 18,924 | (6) | — | 718,924 | ||||||||||||||
| Change in Control (no termination of employment) |
— | 6,956,484 | — | — | 6,956,484 | |||||||||||||||
127
Table of Contents
| Name |
Cash ($) (1) | Equity ($) (3) | Perquisites/ Benefits ($) |
Tax Reimbursement ($) (7) |
Total ($) | |||||||||||||||
| Eldridge A. Burns, Jr. |
||||||||||||||||||||
| Termination due to Death |
480,000 | 910,734 | 18,924 | (6) | — | 1,409,659 | ||||||||||||||
| Termination due to Disability |
240,000 | (2) | 910,734 | — | — | 1,150,734 | ||||||||||||||
| Termination without Cause, resignation due to reduction in base salary or target bonus opportunity |
480,000 | 2,757,696 | 76,432 | (5) | — | 3,314,128 | ||||||||||||||
| Termination by the Company for Good Reason |
480,000 | — | 18,924 | (6) | — | 498,924 | ||||||||||||||
| Change in Control (no termination of employment) |
— | 2,757,696 | — | — | 2,757,696 | |||||||||||||||
| Richard Morrin |
||||||||||||||||||||
| Termination due to Death |
510,000 | 610,494 | 18,924 | (6) | — | 1,139,418 | ||||||||||||||
| Termination due to Disability |
255,000 | (2) | 610,494 | — | — | 865,494 | ||||||||||||||
| Termination without Cause, resignation due to reduction in base salary or target bonus opportunity |
510,000 | 1,831,478 | 76,265 | (5) | — | 2,417,743 | ||||||||||||||
| Termination by the Company for Good Reason |
510,000 | — | 18,924 | (6) | 528,924 | |||||||||||||||
| Change in Control (no termination of employment) |
— | 1,831,478 | — | — | 1,831,478 | |||||||||||||||
| (1) | Represents cash severance. For severance payment calculation, and time and form of such payments. See “— Employment Agreements with Named Executive Officers.” |
| (2) | Assumes that: (i) NEO first receives compensation under the Company’s short-term salary continuation program thirteen weeks prior to December 31, 2013 and begins receiving compensation and benefits under the Company’s long-term and individual disability insurance program on December 31, 2013, (ii) target level of annual cash performance bonus is achieved in fiscal year 2013 and no bonus is payable for subsequent years due to the NEO receiving compensation and benefits under the Company’s long-term and individual disability insurance program, and (iii) NEO is eligible for the Company’s short-term salary continuation benefits. See “— Employment Agreements with Named Executive Officers.” |
| (3) | Represents value of accelerated vesting of stock options with respect to SCUSA common stock as provided under the Management Equity Plan and accelerated vesting of restricted stock as provided under the Omnibus Incentive Plan. Assumes that all applicable performance targets with respect to any performance-vesting stock options are achieved. See “— SCUSA 2011 Management Equity Plan” “— SCUSA Omnibus Incentive Plan” and “— Equity Compensation Plans Information.” |
| (4) | Represents continuation of welfare benefits, perquisites and other fringe benefits as provided pursuant to Mr. Dundon’s employment agreement. Assumes no increase in the cost of welfare benefits. For welfare continuation payment calculation, and time and form of such payments. See “— Employment Agreements with Named Executive Officers.” |
| (5) | Represents continuation of medical and dental benefits and life insurance coverage. Assumes no increase in the cost of welfare benefits. For welfare continuation payment calculation, and time and form of such payments. See “— Employment Agreements with Named Executive Officers.” |
| (6) | Represents continuation of medical and dental benefits. Assumes no increase in the cost of welfare benefits. For welfare continuation payment calculation, and time and form of such payments. See “— Employment Agreements with Named Executive Officers.” |
| (7) | In the event that a payment is made to Mr. Dundon in connection with a Change in Control such that an excise tax imposed by Code Section 4999 applies, Mr. Dundon is entitled to a gross-up payment in an amount such that after payment of all taxes (including interest and penalties imposed with respect thereto), Mr. Dundon retains an amount as if the excise tax did not apply. However, if the amount otherwise due to Mr. Dundon is not more than 110% of the amount that he could receive without triggering the excise tax, the amount shall be reduced so that the excise tax does not apply. |
Director Compensation in Fiscal Year 2013
Our board members were not compensated for their services on the board in 2013. We have adopted a director compensation policy that provides for the following compensation for independent members of our board of directors:
| • | An annual cash board retainer of $80,000; |
| • | An additional annual cash retainer of $20,000 for the chair of the audit committee of our board of directors; |
| • | An additional annual cash retainer of $10,000 for being a member of the audit committee; |
128
Table of Contents
| • | An additional annual cash retainer of $10,000 for the chair of any other committee of our board of directors; |
| • | An additional annual cash retainer of $10,000 for being a member of any other committee; and |
| • | An annual grant of stock options or restricted stock units with a grant date fair value equal to $50,000 that vest ratably over three years. |
In addition, in 2014 we have granted stock options to Stephen Ferriss, our independent director, pursuant to the Management Equity Plan that will be granted on and effective as of the date on which the underwriting agreement in connection with this offering is executed, this registration statement becomes effective and the initial public offering price of our common stock in this offering is determined, and that will be granted with an exercise price equal to the initial public offering price of our common stock in this offering.
Equity Compensation Plan Information
| Plan category |
Number of securities to be issued upon exercise of outstanding options, warrants and rights |
Weighted-average exercise price of outstanding options, warrants and rights(1) |
Number of securities remaining available for future issuance under equity compensation plans (excluding securities reflected in column (a)) |
|||||||||
| (a) | (b) | (c) | ||||||||||
| Equity compensation plans approved by security holders |
8,981,861 | $ | 26.14 | 3,776,674 | (2) | |||||||
| Equity compensation plans not approved by security holders |
||||||||||||
| Total |
8,981,861 | $ | 26.14 | 3,776,674 | ||||||||
| (1) | Weighted-average exercise price is based solely on outstanding options. |
| (2) | Includes 1,728,389 shares available for issuance under the Omnibus Incentive Plan. |
We have granted stock options to certain executives and other employees under the Management Equity Plan. The Management Equity Plan is administered by the board of directors and enables us to make stock awards up to a total of approximately 11 million shares of SCUSA common stock (net of shares cancelled and forfeited), or 8.5% of the equity invested in the company as of December 31, 2011. Stock options for approximately 9.3 million of the shares were granted as of December 31, 2013 with stock options for approximately 0.3 million shares having been forfeited during the period from December 31, 2011 to December 31, 2013. Accordingly, at December 31, 2013, we had approximately 2.0 million shares that were available to grant under the Management Equity Plan. The Management Equity Plan provides that, upon the earlier of (i) an IPO and (ii) December 31, 2016, any shares that remain available for the future grant of options will be granted by our board of directors (or the Compensation Committee, as applicable), in good faith to the then-eligible directors and employees of SCUSA and its subsidiaries; however, our board of directors has approved the amendment of the Management Equity Plan, in connection with, and immediately prior to, this offering, to provide that shares available under the Management Equity Plan that remain available at consummation of the initial public offering will remain available for grant under the Management Equity Plan.
The stock options granted during 2013 were granted with an exercise price equal to or above the fair market value of our common stock on the date of issuance, estimated based on an independent valuation performed as of December 31, 2012. The stock options expire after ten years and include both time vesting options and performance vesting options. We will issue new shares when options are exercised. As long as an option holder remains employed by us, the time vesting options currently become vested and exercisable in equal annual installments of 20% on each of the first five anniversaries of the December 31, 2011 equity transactions; provided, however, that our board of directors has approved the amendment of the stock options previously
129
Table of Contents
granted under the Management Equity Plan held by certain NEOs effective as of, and subject to the occurrence of the offering, to immediately vest such stock options, and the amendment of stock options held by certain NEOs and other employees to remove certain transfer restrictions with respect to shares underlying certain options and to extend certain other transfer restrictions with respect to shares underlying certain other options. The performance vesting options have the same time-vesting requirements and additionally require certain annual or cumulative ROE targets to be met. These targets are an ROE of 27.5% for each of 2012 and 2013 and 18.0% for each of the years 2014 through 2016, or an average annual ROE of 25.0% for the five-year vesting period.
No shares obtained through exercise of stock options may be transferred until the Lapse Date. Until the Lapse Date, if an employee leaves the company, we have the right to repurchase any or all of the stock obtained by the employee through option exercise. In connection with this offering, our board of directors has approved the amendment of the transfer restrictions to which certain stock options previously granted under the Management Equity Plan were subject, resulting in a portion of certain of the shares received on exercise of these stock options being transferable earlier than currently contemplated by the Company’s equity arrangements, and certain other shares received on exercise of these stock options being transferable later than currently contemplated. If the employee is terminated for cause (as defined in the Management Shareholder Agreement) or voluntarily leaves the company without good reason (as defined in the Management Shareholder Agreement), the repurchase price is the lower of the strike price or fair market value at the date of repurchase. If the employee is terminated without cause or voluntarily leaves the company with good reason, the repurchase price is the fair market value at the date of repurchase.
We have granted restricted shares to certain executives under the Omnibus Incentive Plan. The Omnibus Incentive Plan is administered by the board of directors (or, at the board’s election, by a committee thereof) and enables us to make equity-based awards up to a total of approximately 1,947,362 shares of SCUSA common stock. Restricted shares for approximately 218,973 of the shares were granted as of December 31, 2013. Accordingly, at December 31, 2013, we had approximately 1,728,389 shares that were available to grant under the Omnibus Incentive Plan.
The restricted shares granted in 2013 vest in equal annual installments of 20% on each of the first five anniversaries of the date of grant, subject to the participant’s continued employment. If a participant’s employment is terminated for any reason other than death, disability or by the Company without cause, the restricted shares will be forfeited. If a participant’s employment is terminated due to death, disability or by the Company without cause, the restricted shares will vest in full. The restricted shares will also vest in full upon a change in control; provided, that, a change in control will not be deemed to occur as a result of the offering or related transactions (including the Reorganization).
Determination of the Fair Value of Stock-based Compensation Grants
The determination of the fair value of stock-based compensation arrangements is affected by a number of variables, including estimates of the fair value of our common stock, expected stock price volatility, risk-free interest rate and the expected life of the award. We value stock options using the Black-Scholes option-pricing model, which was developed for use in estimating the fair value of traded options that are fully transferable and have no vesting restrictions. Black-Scholes and other option valuation models require the input of highly subjective assumptions, including the expected stock price volatility.
130
Table of Contents
Beginning in 2012, we granted stock options to certain executives and other employees under the Management Equity Plan. The following summarizes the assumptions used for estimating the fair value of stock options granted under the Management Equity Plan to employees for the periods indicated.
| Nine Months Ended September 30, |
Year Ended December 31, | |||||||||||||||
| 2013 | 2012 | 2012 | 2011 | 2010 | ||||||||||||
| Assumption |
||||||||||||||||
| Risk-free interest rate |
1.08%-1.13% | 0.88%-1.28% | 1.28% | n/a | n/a | |||||||||||
| Expected life (in years) |
6.5 | 6.5 | 6.5 | n/a | n/a | |||||||||||
| Expected volatility |
50%-51% | 66%-67% | 66% | n/a | n/a | |||||||||||
| Dividend yield |
0.38% | 1.92% | 1.92% | n/a | n/a | |||||||||||
| Weighted average grant date fair value |
$ | 17.50-$19.89 | $ | 14.83-$16.15 | $ | 14.87-$16.11 | n/a | n/a | ||||||||
| * | We did not issue stock options prior to 2012. |
The risk-free interest rate assumption is based on observed interest rates for constant maturity U.S. Treasury securities consistent with the expected life of our employee stock options. The expected life represents the period of time the stock options are expected to be outstanding and is based on the simplified method. Under the simplified method, the expected life of an option is presumed to be the midpoint between the vesting date and the end of the contractual term. We used the simplified method due to the lack of sufficient historical exercise data to provide a reasonable basis upon which to otherwise estimate the expected life of the stock options. Expected volatility is based on historical volatilities for publicly traded stock of comparable companies over the estimated expected life of the stock options. During the nine months ended September 30, 2013, we updated and expanded the list of comparable companies used to estimate expected volatility by including companies in our industry that had recently completed initial public offerings, and replacing some of the companies that had been used in prior periods with others that we believed to be more comparable to us in terms of size, business model or stage of development.
Our estimate of pre-vesting forfeitures, or forfeiture rate, is based on our analysis of historical behavior by stock option holders. The estimated forfeiture rate is applied to the total estimated fair value of the awards, as derived from the Black-Scholes model, to compute the stock-based compensation expense, net of pre-vesting forfeitures, to be recognized in our consolidated statements of operations.
Based upon an assumed initial public offering price of $ per share, the midpoint of the range set forth on the cover of this prospectus, the aggregate intrinsic value of outstanding options to purchase shares of our common stock as of , 2013 was $ million, of which $ million related to vested options and $ million to unvested options.
We value restricted stock based on the estimated fair value of our common stock on the date of grant. In 2013, we granted restricted stock to certain executives under the Omnibus Incentive Plan. The following summarizes the determinations made in estimating the fair value of restricted stock granted under the Omnibus Incentive Plan in 2013.
We are a private company with no active public market for our common stock. Therefore, in response to Section 409A of the Internal Revenue Code of 1986, as amended, related regulations issued by the Internal Revenue Service and accounting standards related to stock-based compensation, we have periodically determined for financial reporting purposes the estimated per share fair value of our common stock at various dates using contemporaneous valuations performed in accordance with the guidance outlined in the American Institute of Certified Public Accountants Practice Aid, “Valuation of Privately-Held Company Equity Securities Issued as Compensation,” also known as the Practice Aid. We performed these contemporaneous valuations as of December 31, 2011, 2012, and 2013. In conducting the contemporaneous valuations, we considered all objective and subjective factors that we believed to be relevant for each valuation conducted, including management’s best
131
Table of Contents
estimate of our business condition, prospects and operating performance at each valuation date. Within the contemporaneous valuations performed by our management, a range of factors, assumptions and methodologies were used. The significant factors included:
| • | independent third-party valuations performed contemporaneously or shortly before the grant date, as applicable; |
| • | the fact that we are a privately held finance company and our common stock is illiquid; |
| • | the nature and history of our business; |
| • | our historical financial performance; |
| • | our discounted future cash flows, based on our projected operating results; |
| • | valuations of comparable public companies; |
| • | general economic conditions and the specific outlook for our industry; |
| • | the likelihood of achieving a liquidity event for shares of our common stock, such as an initial public offering, or IPO, or a sale of our company, given prevailing market conditions, or remaining a private company; and |
| • | the state of the IPO market for similarly situated privately held finance companies. |
The dates of our contemporaneous valuations have not always coincided with the dates of our stock-based compensation grants. In such instances, management’s estimates have been based on the most recent contemporaneous valuation of our shares of common stock and our assessment of additional objective and subjective factors we believed were relevant as of the grant date. The additional factors considered when determining any changes in fair value between the most recent contemporaneous valuation and the grant dates included our operating and financial performance, current business conditions and the market performance of comparable publicly traded companies.
There are significant judgments and estimates inherent in these contemporaneous valuations. These judgments and estimates include assumptions regarding our future operating performance, the time to completing an IPO or other liquidity event, and the determinations of the appropriate valuation methods. If we had made different assumptions, the amount disclosed in our financial statements of stock-based compensation expense to be recorded following an IPO could have been significantly different.
132
Table of Contents
BENEFICIAL OWNERS, MANAGEMENT AND SELLING STOCKHOLDERS
The following table sets forth information about the beneficial ownership of our common stock as of December 31, 2013 and as adjusted to reflect the sale of the shares of common stock by us and the selling stockholders in this offering, for:
| • | each person known to us to be the beneficial owner of more than 5% of our common stock; |
| • | each named executive officer; |
| • | each of our directors; |
| • | all of our executive officers and directors as a group; and |
| • | each selling stockholder. |
Unless otherwise noted below, the address of each beneficial owner listed on the table is c/o Santander Consumer USA Inc., 8585 North Stemmons Freeway, Suite 1100-N, Dallas, Texas 75247. We have determined beneficial ownership in accordance with the rules of the SEC. Except as indicated by the footnotes below, we believe, based on the information furnished to us, that the persons and entities named in the tables below have sole voting and investment power with respect to all shares of common stock that they beneficially own, subject to applicable community property laws. We have based our calculation of the percentage of beneficial ownership on 130,043,167.83 shares of common stock outstanding as of December 31, 2013 and shares of common stock outstanding after the completion of this offering.
In computing the number of shares of common stock beneficially owned by a person and the percentage ownership of that person, we deemed outstanding shares of unvested restricted stock because holders of unvested restricted stock under the Omnibus Incentive Plan hold the right to vote such stock, and we deemed outstanding shares of common stock subject to options held by that person that are currently exercisable or exercisable within 60 days of December 31, 2013. We, however, did not deem these shares outstanding for the purpose of computing the percentage ownership of any other person.
| Shares Owned Before the Offering |
Shares Owned After the Offering (no option exercise) |
Shares Owned After the Offering (full option exercise) | ||||||||||||||
| Name of Beneficial Owner |
Number | Percentage | Number | Percentage | Number | Percentage | ||||||||||
| Beneficial owners of 5% or more of our common stock: |
||||||||||||||||
| DDFS LLC (1) |
12,975,250.88 | 9.98 | % | |||||||||||||
| Santander Holdings USA, Inc. (2) |
84,339,130.70 | 64.85 | % | |||||||||||||
| Sponsor Auto Finance Holdings Series LP |
32,438,127.19 | 24.94 | % | |||||||||||||
| Directors and Named Executive Officers: |
||||||||||||||||
| Thomas G. Dundon (3) |
16,386,820.52 | 12.41 | % | |||||||||||||
| Jason Kulas (4) |
254,114.53 | * | ||||||||||||||
| Jason Grubb (5) |
161,597.14 | * | ||||||||||||||
| Eldridge A. Burns, Jr. (6) |
67,937.55 | * | ||||||||||||||
| Rich Morrin (7) |
50,053.44 | * | ||||||||||||||
| Gonzalo de Las Heras |
— | — | ||||||||||||||
| Juan Carlos Alvarez |
— | — | ||||||||||||||
| Roman Blanco |
— | — | ||||||||||||||
| Stephen A. Ferriss |
— | — | ||||||||||||||
| Matthew Kabaker |
— | — | ||||||||||||||
| Tagar C. Olson |
— | — | ||||||||||||||
| Alberto Sanchez |
— | — | ||||||||||||||
133
Table of Contents
| Shares Owned Before the Offering |
Shares Owned After the Offering (no option exercise) |
Shares Owned After the Offering (full option exercise) | ||||||||||||||
| Name of Beneficial Owner |
Number | Percentage | Number | Percentage | Number | Percentage | ||||||||||
| Juan Andres Yanes |
— | — | ||||||||||||||
| Daniel Zilberman |
— | — | ||||||||||||||
| All executive officers and directors as a group (21 persons) |
17,157,670.13 | 12.93 | % | |||||||||||||
| Other selling stockholders: |
||||||||||||||||
| James W. Fugitt (8) |
67,288.20 | * | ||||||||||||||
| R. Michele Rodgers (9) |
33,878.20 | * | ||||||||||||||
| Michelle L. Whatley (10) |
44,538.96 | * | ||||||||||||||
| Hugo R. Dooner (11) |
27,982.40 | * | ||||||||||||||
| Jennifer Popp (12) |
9,916.20 | * | ||||||||||||||
| Brad Martin (13) |
53,542.40 | * | ||||||||||||||
| * | Represents less than 1% beneficial ownership |
| (1) | A Delaware limited liability company solely owned by our Chief Executive Officer, Thomas G. Dundon. |
| (2) | A wholly owned subsidiary of Santander. |
| (3) | Includes 12,975,250.88 shares owned by DDFS LLC, 143,589.00 shares of restricted stock, 1,985,213.20 stock options that are currently exercisable or are exercisable within 60 days of December 31, 2013 and 1,282,767.44 shares held indirectly through Sponsor Auto Finance Holdings. Mr. Dundon intends to exercise options prior to this offering pursuant to a net exercise feature of such options assuming an initial public offering price of $ per share, which represents the midpoint of the range set forth on the cover page of this prospectus. |
| (4) | Includes 64,615.00 shares of restricted stock, 156,000.00 stock options that are currently exercisable or are exercisable within 60 days of December 31, 2013 and 20,524.28 shares held indirectly through Sponsor Auto Finance Holdings. Mr. Kulas intends to exercise options prior to this offering pursuant to a net exercise feature of such options assuming an initial public offering price of $ per share, which represents the midpoint of the range set forth on the cover page of this prospectus. |
| (5) | Includes 10,769.00 shares of restricted stock and 139,474.80 stock options that are currently exercisable or are exercisable within 60 days of December 31, 2013. Mr. Grubb intends to exercise options prior to this offering pursuant to a net exercise feature of such options assuming an initial public offering price of $ per share, which represents the midpoint of the range set forth on the cover page of this prospectus. |
| (6) | Includes 60,152.40 stock options that are currently exercisable or are exercisable within 60 days of December 31, 2013. Mr. Burns intends to exercise options prior to this offering pursuant to a net exercise feature of such options assuming an initial public offering price of $ per share, which represents the midpoint of the range set forth on the cover page of this prospectus. |
| (7) | Includes 40,322.00 stock options that are currently exercisable or are exercisable within 60 days of December 31, 2013. Mr. Morrin intends to exercise options prior to this offering pursuant to a net exercise feature of such options assuming an initial public offering price of $ per share, which represents the midpoint of the range set forth on the cover page of this prospectus. |
| (8) | Includes stock options that are currently exercisable or are exercisable within 60 days of December 31, 2013. Mr. Fugitt intends to exercise options prior to this offering pursuant to a net exercise feature of such options assuming an initial public offering price of $ per share, which represents the midpoint of the range set forth on the cover page of this prospectus. |
| (9) | Includes stock options that are currently exercisable or are exercisable within 60 days of December 31, 2013. Ms. Rodgers intends to exercise options prior to this offering pursuant to a net exercise feature of such options assuming an initial public offering price of $ per share, which represents the midpoint of the range set forth on the cover page of this prospectus. |
| (10) | Includes stock options that are currently exercisable or are exercisable within 60 days of December 31, 2013. Ms. Whatley intends to exercise options prior to this offering pursuant to |
134
Table of Contents
| a net exercise feature of such options assuming an initial public offering price of $ per share, which represents the midpoint of the range set forth on the cover page of this prospectus. |
| (11) | Includes stock options that are currently exercisable or are exercisable within 60 days of December 31, 2013. Mr. Dooner intends to exercise options prior to this offering pursuant to a net exercise feature of such options assuming an initial public offering price of $ per share, which represents the midpoint of the range set forth on the cover page of this prospectus. |
| (12) | Includes stock options that are currently exercisable or are exercisable within 60 days of December 31, 2013. Ms. Popp intends to exercise options prior to this offering pursuant to a net exercise feature of such options assuming an initial public offering price of $ per share, which represents the midpoint of the range set forth on the cover page of this prospectus. |
| (13) | Includes stock options that are currently exercisable or are exercisable within 60 days of December 31, 2013. Mr. Martin intends to exercise options prior to this offering pursuant to a net exercise feature of such options assuming an initial public offering price of $ per share, which represents the midpoint of the range set forth on the cover page of this prospectus. |
135
Table of Contents
CERTAIN RELATIONSHIPS AND RELATED PARTY TRANSACTIONS
In addition to the director and executive officer compensation arrangements discussed above under “Compensation Discussion and Analysis,” the following is a summary of material provisions of various transactions we have entered into with our executive officers, directors (including nominees), 5% or greater stockholders and any of their immediate family members or entities affiliated with them since January 1, 2010. We believe the terms and conditions set forth in such agreements are reasonable and customary for transactions of this type.
2011 Investment
On October 20, 2011, SCUSA Illinois and SHUSA entered into an investment agreement with Auto Finance Holdings. Auto Finance Holdings is jointly owned by investment funds affiliated with Warburg Pincus LLC, Kohlberg Kravis Roberts & Co. L.P. and Centerbridge Partners, L.P., as well as DFS Sponsor Investments LLC and our Chief Financial Officer. On October 20, 2011, we also entered into an investment agreement with DDFS.
On December 31, 2011, SCUSA Illinois completed (i) the sale to Auto Finance Holdings of an aggregate number of 32,438,127.19 shares of common stock of SCUSA Illinois for an aggregate purchase price of $1.0 billion and (ii) the sale to DDFS of 5,140,468.58 shares of common stock of SCUSA Illinois for aggregate consideration of $158.2 million, a portion of which was financed under a general line of credit extended by an affiliate of Santander to DDFS. These sales are collectively referred to as the “Equity Transaction.” In addition, on December 31, 2011, we completed the sale to certain members of our management of 67,373.99 shares of common stock of SCUSA Illinois for an aggregate consideration of approximately $2.1 million. Members of management purchasing shares of common stock of SCUSA Illinois were Jason A. Kulas, Jason W. Grubb, Eldridge A. Burns, Jr. and Richard Morrin, each of whom is a named executive officer; James W. Fugitt and Michelle L. Whatley, each of whom is an executive officer, Matthew Fitzgerald, our Executive Vice President, Sales and Marketing, and Steve Zemaitis, our Executive Vice President, Originations.
Concurrently with the sale of shares of our common stock to certain of our officers described above, the officers entered into Management Shareholder Agreements with us. The Management Shareholder Agreements granted these officers piggyback registration rights pursuant to which they may require us to include their shares in this offering and in any offering hereafter that involves, in whole or in part, a secondary offering of our shares, provided that Auto Finance Holdings is selling shares in such offering. The Management Shareholder Agreements also provide that these officers may not sell or otherwise dispose of shares acquired in the Equity Transaction until December 31, 2016 and for customary periods before and after an underwritten offering of shares of our common stock.
Shareholders Agreement
In connection with this offering, we will enter into the Shareholders Agreement, which will replace the existing shareholders agreement with each of our Principal Stockholders and Mr. Dundon. The Shareholders Agreement will provide our Principal Stockholders, among other things, certain rights related to director nominations, approvals over certain actions taken by us and registration rights.
Board Composition
The Shareholders Agreement will provide that SHUSA will have the right to nominate the following number of directors at each applicable threshold for its share ownership: (i) greater than or equal to 50% of our then-outstanding shares of common stock, seven of our directors, (ii) greater than or equal to 35% and less than 50% of our then-outstanding shares of common stock, six of our directors, (iii) greater than or equal to 25% and less than 35% of our then-outstanding shares of common stock, five of our directors, (iv) greater than or equal to 15% and less than 25% of our then-outstanding shares of common stock, three of our directors (increased to four of our directors prior to a Sponsor/DDFS Termination Event (as defined below) and increased to five of our
136
Table of Contents
directors prior to a Sponsor/DDFS Termination Event if Mr. Dundon is no longer our Chief Executive Officer), (v) greater than or equal to 10% and less than 15% of our then-outstanding shares of common stock, two of our directors (increased to four of our directors prior to a Sponsor/DDFS Termination Event and increased to five of our directors prior to a Sponsor/DDFS Termination Event if Mr. Dundon is no longer our Chief Executive Officer) and (vi) greater than or equal to 5% and less than 10% of our then-outstanding shares of common stock, one of our directors.
The Shareholders Agreement will also provide that DDFS and Auto Finance Holdings will collectively have the right to nominate five of our directors prior to a Sponsor/DDFS Termination Event. A Sponsor/DDFS Termination Event occurs when either: (x) if DDFS owns at least 8.5% of our then-outstanding shares of common stock (excluding shares acquired by DDFS or Mr. Dundon pursuant to any equity-based compensation plan), the total number of shares of our common stock owned collectively by DDFS and Auto Finance Holdings divided by the total number of shares of our common stock outstanding immediately following the completion of the Reorganization is less than 21.0%, or (y) if DDFS owns less than 8.5% of our then-outstanding shares of common stock (excluding shares acquired by DDFS or Mr. Dundon pursuant to any equity-based compensation plan), the total number of shares of our common stock owned by Auto Finance Holdings divided by the total number of shares of our common stock outstanding immediately following the completion of the Reorganization is less than 12.5%. Prior to a Sponsor/DDFS Termination Event and for so long as Mr. Dundon is our Chief Executive Officer, Mr. Dundon will be one of DDFS’s and Auto Finance Holdings’s collective nominees. Following a Sponsor/DDFS Termination Event, Mr. Dundon will have the right to serve as a director for so long as (x) Mr. Dundon is our Chief Executive Officer or (y) Mr. Dundon owns at least 5% of our then-outstanding shares of common stock (excluding shares acquired by DDFS or Mr. Dundon pursuant to any equity-based compensation plan) and has continued to comply with certain provisions of his employment agreement with the Company. Following a Sponsor/DDFS Termination Event, Auto Finance Holdings will have the right to nominate the following number of directors at each applicable threshold for its share ownership: (i) greater than or equal to 10% and less than 15% of our then-outstanding shares of common stock, two of our directors and (ii) greater than or equal to 5% and less than 10% of our then-outstanding shares of common stock, one of our directors.
The Shareholders Agreement will also provide that the obligation to nominate directors that are “independent” as defined under the rules of the NYSE and Rule 10A-3 of the Exchange Act will be allocated proportionately between SHUSA, on the one hand, and DDFS and Auto Finance Holdings, on the other hand, prior to a Sponsor/DDFS Termination Event, and between SHUSA and Auto Finance Holdings following a Sponsor/DDFS Termination Event, in each case after taking into account any independent directors that are nominated in accordance with our amended and restated bylaws and not by our Principal Stockholders. Therefore, following the completion of the offering, two of SHUSA’s nominees and one of DDFS’s and Auto Finance Holdings’s collective nominees will be “independent” as defined under the rules of the NYSE and Rule 10A-3 of the Exchange Act, subject to any permitted “phase-in” periods.
As a result of the foregoing, the entirety of our board of directors immediately following the completion of the offering will be nominated by our Principal Stockholders pursuant to the Shareholders Agreement. However, upon a Sponsor/DDFS Termination Event or a reduction of SHUSA’s share ownership below the above described thresholds, certain of our directors will no longer be nominated by our Principal Stockholders and will be nominated in accordance with our amended and restated bylaws.
The Shareholders Agreement will provide that SCUSA will take all action within its power to cause the individuals nominated by the Principal Stockholders pursuant to the provisions of the Shareholders Agreement described above to be included in the slate of nominees recommended by the board of directors to our stockholders for election as directors at each annual meeting of our stockholders and to cause the election of each such nominee, including soliciting proxies in favor of the election of such nominees. Each Principal Stockholder will commit under the terms of the Shareholders Agreement to vote all shares of our common stock owned by such Principal Stockholder to cause the election or re-election of the individuals nominated by all Principal Stockholders pursuant to the provisions of the Shareholders Agreement described above. In addition, the
137
Table of Contents
applicable Principal Stockholder(s) will have the right to designate a replacement to fill a vacancy on our board of directors created by the departure of a director that was nominated by the Principal Stockholder(s), and we will be required to take all action within our power to cause such vacancy to be filled by such designated replacement (including by promptly appointing such designee to the board of directors).
Approval Rights
The Shareholders Agreement will also provide that, until a Sponsor/DDFS Termination Event has occurred, the following actions by us will require the approval of each of SHUSA, DDFS, and Auto Finance Holdings, in their capacity as stockholders of SCUSA:
| • | the commencement of an insolvency or similar proceeding relating to the Company or certain of our material subsidiaries; |
| • | any non-pro rata reduction to the share capital of the Company or certain of our material subsidiaries, except as required by law; |
| • | certain amendments to our organizational documents or the organizational documents of certain of our material subsidiaries; |
| • | any appointment of an individual to the board of directors of the Company or certain of our material subsidiaries contrary to the rights described under “— Board Composition” above; |
| • | any merger, amalgamation, consolidation or similar transaction involving, or the sale of substantially all of the assets of, the Company or certain of our material subsidiaries; and |
| • | any change in the principal line of business of the Company or certain of our material subsidiaries. |
The Shareholders Agreement will also provide that, until a Sponsor/DDFS Termination Event has occurred, the following actions by us will require the approval of a majority of the directors nominated by SHUSA and a majority of the directors nominated collectively by DDFS and Auto Finance Holdings:
| • | the entry into, or amendment or termination of, material contracts or other agreements; |
| • | the sale, conveyance, transfer or other disposition of material property or assets of the Company or any of our subsidiaries; |
| • | the institution or settlement by the Company or any of our subsidiaries of any material litigation or arbitration; |
| • | the declaration or payment of dividends or other distributions in respect of the capital stock of the Company; |
| • | except as required by changes in law or GAAP, any change to the material accounting policies of the Company; |
| • | except as required by changes in law or changes which are consistent with changes to the tax policies or positions of affiliates of Santander in the United States, any change to the material tax policies or positions of the Company; |
| • | any change in the compensation of members of the board of directors of the Company in their capacity as directors; |
| • | the making by the Company or any of our subsidiaries of any material investment in, or the acquisition of, any material assets or entity (other than investments in wholly owned subsidiaries), or the entry into any material joint ventures, partnerships or similar arrangements; |
| • | the incurrence by the Company or any of our subsidiaries of any material indebtedness or the assumption of any material obligations (fixed or contingent); |
| • | the approval of the annual budget of the Company; |
138
Table of Contents
| • | any transactions with affiliates (including our Principal Stockholders) subject to certain exceptions; |
| • | any issuance or repurchase of equity or equity linked securities by the Company (other than pursuant to equity-based compensation plans approved by the stockholders); |
| • | the hiring or removal of certain of our executive officers; |
| • | any changes in the compensation of our executive officers; |
| • | any adoption, modification or termination of any equity-based incentive plans; |
| • | any amendment to the Company’s liquidity policy; |
| • | certain amendments to the organizational documents of the Company; and |
| • | any consent by the Company or any of our subsidiaries to the transfer by Santander or any of its affiliates of any portion of their respective commitments under certain of the Santander Credit Facilities. |
Upon a Sponsor/DDFS Termination Event, the foregoing approval rights will terminate and no longer be applicable to actions taken by the Company or any of our subsidiaries. However, the Shareholders Agreement will also provide that, following a Sponsor/DDFS Termination Event, the following actions by us will require the approval of a majority of the directors nominated by SHUSA for so long as SHUSA’s share ownership is greater than 20% of our then-outstanding shares of common stock:
| • | except as required by changes in law or GAAP, any change to the material accounting policies of the Company; |
| • | except as required by changes in law or changes which are consistent with changes to the tax policies or positions of affiliates of Santander in the United States, any change to the material tax policies or positions of the Company; and |
| • | any change in the principal line of business of the Company or certain of our material subsidiaries. |
Registration Rights
The Shareholders Agreement will also contain registration rights provisions with respect to our common stock. Specifically, each of Auto Finance Holdings and SHUSA will have demand registration rights that will be exercisable 180 days after the consummation of this offering. The demand registration rights require us to register the shares of our common stock owned by Auto Finance Holdings or SHUSA with the SEC for sale by it to the public. We may postpone the filing of such a registration statement or suspend the effectiveness of any registration statement for a “blackout period” not in excess of 60 days if we are planning to prepare and file a registration statement for a primary offering or there is a pending or contemplated material acquisition or other material transaction or reorganization and our Chief Executive Officer or Chief Financial Officer reasonably concludes that such postponement or suspension would be in the Company’s best interest, provided that we may not postpone the filing of a registration statement or suspend the effectiveness of a registration statement more than once during any 12-month period. The Shareholders Agreement will provide that we will be responsible for and must pay all fees and expenses incident to any registration described above.
In addition, in the event that we are registering additional shares of common stock for sale to the public following this offering, whether on our own behalf, through a demand registration (as described above) or otherwise (other than any registration relating to any employee benefit or similar plan, any dividend reinvestment plan or any acquisition by us pursuant to a registration statement filed in connection with an exchange offer), we are required to give notice of our intention to effect such a registration to each of our Principal Stockholders. Each of our Principal Stockholders will have piggyback registration rights pursuant to which they may require us to include their shares of our common stock in any such registration, subject to certain customary limitations and other customary registration rights provisions.
139
Table of Contents
Other
The Shareholders Agreement will provide that neither we nor SHUSA is permitted to take any action that would cause Auto Finance Holdings or DDFS to be required to register as a bank holding company.
The Shareholders Agreement will also provide that the Principal Stockholders will have preemptive rights to purchase their respective proportionate shares of any issuance by the Company of equity securities, securities convertible into or exercisable for equity securities or securities that include an equity component, subject to certain exceptions.
Other Arrangements
Guarantees
Santander has provided guarantees on the covenants, agreements, and our obligations under the governing documents of our warehouse facilities and privately issued amortizing notes. These guarantees are limited to our obligations as servicer.
Currently Outstanding Borrowing Arrangements
Santander, through its New York Branch, has extended various credit facilities (the Santander Credit Facilities) to us for an aggregate amount of $4.5 billion.
| • | Santander Consumer Funding 3 LLC (a subsidiary of SCUSA) has a committed facility of $1,750 million established in December 2011. As of December 31, 2011, the balance of the line was $1,748 million. Santander Consumer Funding 3 LLC paid $37.3 in interest on this line of credit during 2011. The highest outstanding balance of the line in 2012 was $1,750 million. As of December 31, 2012, the balance of the line was $1,385 million. In 2012, Santander Consumer Funding 3 LLC paid $13.9 million in interest on this line of credit. The current maturity of the facility is December 31, 2015. |
| • | Santander Consumer Funding 5 LLC (a subsidiary of SCUSA) has a committed facility of $1,750 million established in December 2011. As of December 31, 2011, the balance of the line was $300 million. Santander Consumer Funding 5 LLC paid no interest on this line of credit during 2011. The highest outstanding balance of the line in 2012 was $425 million. As of December 31, 2012, the balance of the line was zero. In 2012, Santander Consumer Funding 5 LLC paid $0.5 million in interest on this line of credit. The current maturity of the facility is December 31, 2017. |
| • | Santander Consumer Captive Auto Funding LLC (a subsidiary of SCUSA) has a committed facility of $500 million established on May 31, 2013. The current maturity of the facility is December 31, 2015. |
| • | Santander Consumer Captive Auto Funding 5 LLC (a subsidiary of SCUSA) has a committed facility of $500 million established on May 31, 2013. The current maturity of the facility is December 31, 2017. |
Any secured drawings outstanding under the Santander Credit Facilities at the time of the facilities’ maturity will amortize to match the maturities and expected cash flows of the corresponding collateral. The current maturity of each facility is listed above. Santander has the option to allow us to renew these facilities. These facilities currently permit unsecured borrowing but generally are collateralized.
Previously Outstanding Borrowing Arrangements
| • | Santander Consumer Receivables 2 LLC (a subsidiary of SCUSA) had a line of credit with Santander’s New York branch. The credit limit in 2010 and until December 30, 2011 was $3.65 billion. The highest outstanding balance of the line in 2010 was $2,930 million. The balance of the line was $2,552 million as of December 31, 2010. In 2010, Santander Consumer Receivables 2 LLC paid $32.6 million in interest on this line of credit. The highest outstanding balance of the line in 2011 was $3,638 million. In |
140
Table of Contents
| 2011, Santander Consumer Receivables 2 LLC paid $37.3 million in interest on this line of credit. On December 30, 2011, this facility was replaced by the facilities extended to Santander Consumer Funding 3 LLC and Santander Consumer Funding 5 LLC and the outstanding balances were refinanced by those facilities. |
| • | We had a $150 million revolving line of credit with Santander Benelux. The highest balance on the line during each of 2010 and 2011 was $150 million. The outstanding balance of the line as of December 31, 2010 was $150 million. In 2010 and 2011, we paid Santander Benelux $1.7 million and $3.2 million respectively, in interest on this line of credit. The line was terminated by mutual consent of Santander Benelux and us on December 30, 2011. |
| • | We had $100 million and $150 million revolving lines of credit with Santander Benelux, SA, NV (“Santander Benelux”), a wholly owned subsidiary of Santander. In 2010 and 2011, we paid Santander Benelux $4.1 million and $5.2 million in interest on these lines of credit. The lines were terminated by mutual consent of Santander Benelux and us on December 30, 2011. |
| • | In 2010, we had a $200 million unsecured loan from Santander’s New York branch. The outstanding balance as of January 1, 2010 was $28 million. In 2010, we paid $2.7 million in interest on this loan. This loan was paid off in 2010. |
| • | In 2010, we had a $500 million line of credit with Santander’s New York branch. The outstanding balance as of January 1, 2010 was $500 million. In 2010, we paid $6.8 million in interest on this line of credit. This line of credit was paid off in 2010. |
| • | In 2010, we had a $1.7 billion warehouse line of credit with Abbey National Bank, now Santander UK plc, a wholly owned subsidiary of Santander. As of January 1, 2010, the outstanding balance on the line was $1,683 million. In 2010, we paid $14.8 million in interest on this line of credit. This line of credit was paid off in 2010. |
| • | In 2010, we had a $700 million warehouse line of credit with SBNA. The maximum amount outstanding in 2010 was $375.5 million. We paid $0.5 million in interest on this line of credit in 2010. This line of credit was paid off in 2010. |
| • | In 2010, we had a $1,800 million line of credit with Santander’s New York Branch. The outstanding balance as of December 31, 2010 was $1,596 million. We paid $18.8 million of interest on this line of credit in 2010. On December 30, 2011, the line was terminated and replaced with a $1.0 billion line of credit maturing on December 31, 2014. We did not borrow on the new line of credit. On May 31, 2013, the new line of credit was terminated and replaced with the facilities extended to Santander Consumer Captive Auto Funding LLC and Santander Consumer Captive Auto Funding 5 LLC. |
Servicing Arrangements
| • | We are under contract with SBNA to service the bank’s retail vehicle loan portfolio, which had a balance of $251 million as of December 31, 2012. For the years 2012, 2011 and 2010, SBNA paid $11.8 million, $19.9 million, and $29.1 million, respectively, to us with respect to this agreement. |
| • | We are under contract with SBNA to service the bank’s RV loan portfolio, which had a balance of $1.4 billion as of December 31, 2012. In 2012 and 2011, SBNA paid $14.2 million and $16.4 million, respectively, to us with respect to this agreement. |
| • | We are under contract with SBNA to service the bank’s portfolio of Chrysler dealer loans either purchased from us or originated under a flow agreement with us. These services began in August 2013 and SBNA had not paid any servicing fees to us as of September 30, 2013. SBNA paid us a $9 million referral fee in June 2013 in connection with the flow agreement. |
141
Table of Contents
Other Agreements
| • | Produban Servicios Informaticos Generales, S.L., a Santander affiliate, is under contract with us to provide a videoconferencing system. Expenses incurred, which are included as a component of data processing, communications and other expenses, totaled $148,000, $160,000, and $161,000 for the years ended December 31, 2012, 2011 and 2010, respectively. |
| • | We have entered into interest rate swaps and caps with Santander and its affiliates with a notional value of approximately $9.2 billion as of September 30, 2013. |
| • | We have established a $500 million letter of credit facility with Santander’s New York Branch. As of December 31, 2010 the facility commitment was reduced from $1 billion to the current $500 million. For 2010, the highest balance outstanding under this facility was $506.1 million and the balance as of December 31, 2010 was $198.5 million. In 2010, we paid $3.8 million in interest and fees on letters of credit issued under this facility. For 2011, the highest balance outstanding under this facility was $351.9 million and the balance as of December 31, 2011 was $285.9 million. In 2011, we paid $2.2 million in interest and fees on letters of credit issued under this facility. For 2012, the highest balance outstanding under this facility was $269.8 million and the balance as of December 31, 2012 was zero. In 2012, the Company paid $1.0 million in fees on letters of credit issued under this facility. We have not used the letter of credit facility during 2013 YTD. |
| • | On December 21, 2012, we entered into a Master Services Agreement with a company in which we have a cost method investment and hold a warrant to increase our ownership if certain vesting conditions are satisfied. The Master Services Agreement enables us to review credit applications of retail store customers. We began reviewing applications under terms of this Agreement on October 24, 2013 and have originated approximately $139,000 in loans under the Agreement as of December 31, 2013. |
| • | We pay certain expenses incurred by Mr. Dundon in the operation of his private plane when used for SCUSA business within the contiguous 48 states of the United States. Under this practice, payment is based on a set flight time hourly rate, and the amount of our reimbursement is not subject to a maximum cap per fiscal year. During fiscal year 2013, the average flight time hourly rate was approximately $5,400, and accordingly, we paid approximately $496,000 to Meregrass Company, a 135 charter company that manages this operation, under this practice. |
| • | Two of the funds that invested in Auto Finance Holdings, CCP II Auto Holdings LLC and KKR 2006 Auto Holding I LLC, also were the equity investors in two LLCs that were formed in 2011 and were consolidated in our financial statements due to our being the primary beneficiary of the entities. On August 30, 2013, the funds abandoned their interests in the entities, resulting in our having full ownership of the entities, which continue to be consolidated in our financial statements. Each fund’s investment in each LLC was $5,000. At the time the LLCs were formed, we entered into indemnification agreements with each of the funds whereby we reimbursed the funds, on a grossed-up basis, for all taxes they incurred related to their investments in the LLCs. Payments under these indemnification agreements have totaled $28,080,000, all of which was paid during the year ended December 31, 2012. In July 2013, we recovered $9,092,925 of this amount as a result of a tax refund to one of the funds. In November 2013, we recovered an additional $9,172,726. We currently have a receivable of $8,602,921, representing the remaining amount of the indemnification payments that we expect to recover as the funds receive additional tax refunds. Additionally, one of the funds served as the managing member of the VIEs until the abandonment. The VIEs each paid a management fee of $25,000 to the managing member in each of the years ended December 31, 2012 and 2011, and reimbursed expenses incurred by the managing member on behalf of the VIEs totaling $156,237 and zero for the years ended December 31, 2012 and 2011, respectively. |
| • | On October 21, 2013, we entered into a lease for approximately 373,000 square feet at a property intended to serve as our corporate headquarters, and in which property Mr. Dundon, Mr. Sanchez and |
142
Table of Contents
| Mr. Kulas each have a minority equity investment. Future minimum lease payments for the 12-year term of the lease total approximately $83.6 million. |
Approval of Related-Party Transactions
Transactions by us with related parties are subject to a formal written policy, as well as regulatory requirements and restrictions. In connection with this offering, we intend to revise our written policy to ensure compliance with all applicable requirements of the SEC and the NYSE concerning related-party transactions.
Under the new policy, our directors and director nominees, executive officers and holders of more than 5% of our common stock, including their immediate family members, will not be permitted to enter into a related party transaction with us, as described below, without the consent of our Audit Committee. Any request for us to enter into a transaction in which the amount involved exceeds $120,000 and any such party has a direct or indirect material interest, subject to certain exceptions will be required to be presented to our Audit Committee for review, consideration and approval. Management will be required to report to our Audit Committee any such related party transaction and such related party transaction will be reviewed and approved or disapproved by the disinterested members of our Audit Committee.
143
Table of Contents
The following descriptions include summaries of the material terms of our amended and restated certificate of incorporation and amended and restated bylaws, which will become effective upon the completion of this offering. Reference is made to the more detailed provisions of the amended and restated certificate of incorporation and amended and restated bylaws, forms of which will be filed with the SEC as exhibits to the registration statement of which this prospectus is a part, and applicable law. Because this is only a summary, it may not contain all the information that is important to you.
General
Upon the completion of this offering, our amended and restated certificate of incorporation will authorize us to issue shares of common stock, $0.01 par value per share, and shares of preferred stock, $0.01 par value per share. Immediately following the completion of this offering, we will have shares of common stock outstanding. There will be no shares of preferred stock outstanding immediately following this offering.
Common Stock
Voting Rights
Holders of common stock will be entitled to one vote per share on all matters to be voted upon by the stockholders. The holders of common stock will not have cumulative voting rights in the election of directors.
Dividend Rights
Holders of common stock will be entitled to ratably receive dividends if, as and when declared from time to time by our board of directors at its own discretion out of funds legally available for that purpose, after payment of dividends required to be paid on outstanding preferred stock, if any. Under Delaware law, we can only pay dividends either out of “surplus” or out of the current or the immediately preceding year’s net profits. Surplus is defined as the excess, if any, at any given time, of the total assets of a corporation over its total liabilities and statutory capital. The value of a corporation’s assets can be measured in a number of ways and may not necessarily equal their book value.
Liquidation Rights
Upon liquidation, dissolution or winding up, the holders of common stock will be entitled to receive ratably the assets available for distribution to the stockholders after payment of all liabilities and accrued but unpaid dividends and liquidation preferences on any outstanding preferred stock.
Other Matters
The common stock will have no preemptive or conversion rights pursuant to the terms of our amended and restated certificate of incorporation and amended and restated bylaws. There will be no redemption or sinking fund provisions applicable to the common stock. All outstanding shares of our common stock will be fully paid and non-assessable, and the shares of our common stock offered in this offering, upon payment and delivery in accordance with the underwriting agreement, will be fully paid and non-assessable.
Preferred Stock
Pursuant to our amended and restated certificate of incorporation, shares of preferred stock will be issuable from time to time, in one or more series, with the designations of the series, the voting rights of the shares of the series (if any), the powers, preferences and relative, participation, optional or other special rights (if any), and
144
Table of Contents
any qualifications, limitations or restrictions thereof as our board of directors from time to time may adopt by resolution (and without further stockholder approval), subject to certain limitations. Each series will consist of that number of shares as will be stated and expressed in the certificate of designations providing for the issuance of the stock of the series.
Composition of Board of Directors
In accordance with our amended and restated certificate of incorporation and amended and restated bylaws, the number of directors comprising our board of directors will be fixed in our amended and restated bylaws and may only be increased or decreased from time to time by an amendment to our amended and restated bylaws. We intend to avail ourselves of the “controlled company” exception under NYSE rules, which exempt us from certain requirements, including the requirements that we have a majority of independent directors on our board of directors and that we have compensation and nominating and corporate governance committees composed entirely of independent directors. We will, however, remain subject to the requirement that we have an audit committee composed entirely of independent members.
Upon the completion of this offering, we expect to have eleven directors and one vacant director position. Our amended and restated certificate of incorporation and amended and restated bylaws will provide that our board of directors will be elected annually at an annual or special meeting of stockholders, with such election decided by plurality vote, each year, except as provided in the Shareholders Agreement. Each director is to hold office until his successor is duly elected and qualified or until his earlier death, resignation or removal. At any meeting of our board of directors, except as otherwise required by law or in connection with certain matters subject to our Principal Stockholders’ approval rights, a majority of the total number of directors then in office will constitute a quorum for all purposes.
In addition, the Shareholders Agreement will provide our Principal Stockholders with the right to designate all of the nominees to our board of directors immediately following the completion of the offering. See “Certain Relationships and Related Party Transactions — Shareholders Agreement.”
Certain Anti-Takeover Provisions of Delaware Law and our Amended and Restated Certificate of Incorporation and Amended and Restated Bylaws
Certain provisions of Delaware law and certain provisions that will be included in our amended and restated certificate of incorporation and amended and restated bylaws summarized below may be deemed to have an anti-takeover effect and may delay, deter or prevent a tender offer or takeover attempt that a stockholder might consider to be in its best interests, including attempts that might result in a premium being paid over the market price for the shares held by stockholders.
Preferred Stock
Our amended and restated certificate of incorporation will contain provisions that permit our board of directors to issue, without any further vote or action by the stockholders (subject to the approval rights described under “Certain Relationships and Related Party Transactions — Shareholders Agreement”), shares of preferred stock in one or more series and, with respect to each such series, to fix the number of shares constituting the series and the designation of the series, the voting rights (if any) of the shares of the series, and the powers, preferences and relative, participation, optional and other special rights, if any, and any qualifications, limitations or restrictions, of the shares of such series.
Vacancies
Vacancies on our board of directors may be filled only by election at an annual meeting or at a special meeting of stockholders called for that purpose, subject to the rights of the Principal Stockholders to designate replacements to fill vacancies created by the departure of directors designated by the Principal Stockholders. See “Certain Relationships and Related Party Transactions — Shareholders Agreement.”
145
Table of Contents
No Cumulative Voting
Our amended and restated certificate of incorporation will provide that stockholders do not have the right to cumulative votes in the election of directors.
Special Meetings of Stockholders
Our amended and restated certificate of incorporation and amended and restated bylaws will provide that, except as otherwise required by law, special meetings of the stockholders may be called only by any officer at the request of a majority of our board of directors, by the chairman of the board of directors or by our Chief Executive Officer. In addition, for so long as SHUSA, DDFS and Auto Finance Holdings and their respective affiliates beneficially own more than 50% of our voting stock, special meeting of stockholders may also be called at the request of the holders of 50% of our voting stock. At such time as SHUSA, DDFS and Auto Finance Holdings and their respective affiliates beneficially own less than or equal to 50% of our voting stock, stockholders will no longer be permitted to call a special meeting or to require the board of directors to call a special meeting.
Advance Notice Procedures for Director Nominations
Our amended and restated bylaws will provide that stockholders (except stockholders with nomination rights under the Shareholders Agreement) seeking to nominate candidates for election as directors at an annual or special meeting of stockholders must provide timely notice thereof in writing. To be timely, a stockholder’s notice generally will have to be delivered to and received at our principal executive offices before notice of the meeting is issued by the secretary of the Company, with such notice being served not less than 10 nor more than 60 days before the meeting. Although the amended and restated bylaws will not give the board of directors the power to approve or disapprove stockholder nominations of candidates to be elected at an annual meeting, the amended and restated bylaws may have the effect of precluding the conduct of certain business at a meeting if the proper procedures are not followed or may discourage or deter a potential acquirer from conducting a solicitation of proxies to elect its own slate of directors or otherwise attempting to obtain control of the Company.
Action by Written Consent
Our amended and restated certificate of incorporation and amended and restated bylaws will provide that any action to be taken by the stockholders must be effected at a duly called annual or special meeting of stockholders and may not be effected by written consent. However, for so long as SHUSA, DDFS and Auto Finance Holdings and their respective affiliates beneficially own more than 50% of our voting stock, any action of the stockholders that may be effected at an annual or special meeting of stockholders may also be effected by the written consent of stockholders having at least the minimum number of votes required to take such action at a meeting of stockholders. At such time as SHUSA, DDFS and Auto Finance Holdings and their respective affiliates beneficially own less than or equal to 50% of our voting stock, stockholders will no longer be permitted to act by written consent.
Amendment of Our Amended and Restated Certificate of Incorporation and Amended and Restated Bylaws; Supermajority Provisions
The DGCL generally provides that the affirmative vote of a majority of the outstanding shares of stock entitled to vote is required to amend a corporation’s certificate of incorporation or bylaws, unless the certificate of incorporation requires a greater percentage. Our amended and restated certificate of incorporation and our amended and restated bylaws will provide that prior to a Sponsor/DDFS Termination Event, the following provisions in our amended and restated certificate of incorporation or amended and restated bylaws, as applicable, may be repealed, altered, amended or rescinded only by the affirmative vote of a majority of the combined voting power of the then outstanding shares of all classes and series of the Company then held by
146
Table of Contents
SHUSA and a majority of the combined voting power of the then outstanding shares of all classes and series of the Company then held by Auto Finance Holdings and DDFS, collectively:
| • | the provisions regarding notice of stockholder and board of directors meetings; |
| • | the provision setting the number of directors on the board of directors; |
| • | the provisions regarding the election of directors, nominations for directors and the appointment of the chairman and vice chairman of the board of directors; |
| • | the provision regarding the frequency and place of meetings of the board of directors; |
| • | the provisions regarding the requirements for a quorum and voting at meetings of stockholders and the board of directors; |
| • | the provision regarding the establishment of committees of the board of directors; |
| • | the provisions regarding competition and corporate opportunities; |
| • | the provisions regarding filling vacancies on the board of directors and newly created directorships; |
| • | the provisions regarding indemnification; |
| • | the provisions regarding the removal of directors; |
| • | the provisions regarding business combinations with interested stockholders; |
| • | the provisions regarding advance notice procedures for director nominations and other stockholder business; and |
| • | the provision regarding amendment to the above listed provisions. |
Except as described above, our amended and restated bylaws may also be amended by our board of directors without a stockholder vote in any manner not inconsistent with Delaware law or our amended and restated certificate of incorporation.
In addition, the Shareholders Agreement provides that prior to a Sponsor/DDFS Termination Event, our Principal Stockholders will have approval rights over the following amendments to our amended and restated certificate of incorporation and amended and restated bylaws:
| • | any amendment that would change the name of the Company; |
| • | any amendment that would change the jurisdiction of incorporation of the Company; |
| • | any amendment that would change the purpose or purposes for which the Company is organized; |
| • | any amendment that would change the size of the Company’s board of directors; |
| • | any amendment that would change the authorized capital stock of the Company, including the creation or issuance of any new class or series of capital stock either (i) having separate class or disproportionate voting rights or (ii) ranking senior to the common stock as to dividends or upon liquidation; |
| • | any amendment that would change the rights of any holders of common stock in a manner adverse to such holders; and |
| • | any amendment that would change the approval rights of our Principal Stockholders with respect to the foregoing amendments to our amended and restated certificate of incorporation and certain other corporate actions described in “Certain Relationships and Related Party Transactions — Shareholders Agreement — Approval Rights”. |
147
Table of Contents
See “Certain Relationships and Related Party Transactions — Shareholders Agreement.”
Business Combinations with Interested Stockholders
We currently intend to elect in our amended and restated certificate of incorporation not to be subject to Section 203 of the DGCL, which generally prohibits a publicly held Delaware corporation from engaging in a business combination, such as a merger, with a person or group owning 15% or more of the corporation’s voting stock, for a period of three years following the date on which the person became an interested stockholder, unless (with certain exceptions) the business combination or the transaction in which the person became an interested stockholder is approved in accordance with Section 203. Accordingly, we are not subject to the anti-takeover effects of Section 203. However, our amended and restated certificate of incorporation will contain provisions that have the same effect as Section 203, except that they provide that each of SHUSA and its successors and affiliates and Auto Finance Holdings and its successors and affiliates will not be deemed to be “interested stockholders,” and accordingly will not be subject to such restrictions, as long as it and its affiliates own at least 10% of our outstanding shares of common stock.
Limitation on Liability and Indemnification of Directors and Officers
The DGCL authorizes corporations to limit or eliminate the personal liability of directors to corporations and their stockholders for monetary damages for breaches of directors’ fiduciary duties. Our amended and restated certificate of incorporation includes a provision that eliminates the personal liability of directors for monetary damages for breach of fiduciary duty as a director, except:
| • | for breach of duty of loyalty; |
| • | for acts or omissions not in good faith or involving intentional misconduct or knowing violation of law; |
| • | under Section 174 of the DGCL (unlawful dividends); or |
| • | for transactions from which the director derived an improper personal benefit. |
Our amended and restated certificate of incorporation and amended and restated bylaws provide that we must indemnify our directors and officers to the fullest extent authorized by the DGCL. We are expressly authorized to, and do, carry directors’ and officers’ insurance providing coverage for our directors, officers and certain employees for some liabilities. We believe that these indemnification provisions and insurance are useful to attract and retain qualified directors and executive directors.
The limitation on liability and indemnification provisions in our amended and restated certificate of incorporation and amended and restated bylaws may discourage stockholders from bringing a lawsuit against directors for breach of their fiduciary duty. These provisions may also have the effect of reducing the likelihood of derivative litigation against directors and officers, even though such an action, if successful, might otherwise benefit us and our stockholders. In addition, your investment may be adversely affected to the extent we pay the costs of settlement and damage awards against directors and officers pursuant to these indemnification provisions.
Renunciation of Certain Corporate Opportunities
Our amended and restated certificate of incorporation will provide that none of our Principal Stockholders or any of their affiliates (other than any member of our board of directors who is also an officer of the Company) will be obligated to present any particular investment or business opportunity to the Company even if such opportunity is of a character that could be pursued by the Company, and may pursue for their own account or recommend to any other person any such investment opportunity.
148
Table of Contents
Listing
We have applied to have our common stock approved for listing on the NYSE under the symbol “ .” Listing will be subject to our fulfilling all of the listing requirements of the NYSE, including the corporate governance standards applicable to controlled companies.
Transfer Agent and Registrar
Computershare Trust Company, N.A. is the transfer agent and registrar for the common stock.
149
Table of Contents
SHARES ELIGIBLE FOR FUTURE SALE
Prior to this offering, there has been no established public market for our common stock, and we cannot predict the effect, if any, that sales of shares or availability of any shares for sale will have on the market price of our common stock prevailing from time to time. Issuances or sales of substantial amounts of common stock (including shares issued on the exercise of options, warrants or convertible securities, if any) or the perception that such issuances or sales could occur, could adversely affect the market price of our common stock and our ability to raise additional capital through a future sale of securities.
Upon completion of this offering and the Reorganization, we will have shares of common stock issued and outstanding. All of the shares of our common stock sold in this offering will be freely tradable without restriction or further registration under the Securities Act, unless such shares are purchased by “affiliates” as that term is defined in Rule 144 under the Securities Act or are subject to a lock-up agreement (described below). Upon completion of this offering, approximately % of our outstanding common stock will be held by “affiliates” as that term is defined in Rule 144 or be subject to a lock-up agreement (assuming no shares are sold in this offering to a holder that is subject to a lock-up agreement). The shares held by “affiliates” will be “restricted securities” as that phrase is defined in Rule 144. Subject to certain contractual restrictions, including the lock-up agreements, holders of restricted shares will be entitled to sell those shares in the public market if they qualify for an exemption from registration under Rule 144 or any other applicable exemption under the Securities Act. Subject to the lock-up agreements and the provisions of Rules 144 and 701 under the Securities Act, additional shares will be available for sale as set forth below.
Registration Statement on Form S-8
In addition to the issued and outstanding shares of our common stock, we intend to file a registration statement on Form S-8 to register an aggregate of approximately shares of common stock reserved for issuance under our incentive programs. That registration statement will become effective upon filing and shares of common stock covered by such registration statement are eligible for sale in the public market immediately after the effective date of such registration statement (unless held by affiliates), subject to the lock-up agreements.
Lock-Up Agreements
See “Underwriting” for a description of lock-up agreements entered into with the underwriters in connection with this offering. Upon the completion of this offering, SHUSA will agree with Auto Finance Holdings to not sell or otherwise dispose of any shares of our common stock owned by SHUSA (other than to certain permitted transferees) for a period of twelve months following the completion of this offering.
Management Shareholder Agreements that we have entered into with certain of our officers and employees also provide that these officers and employees may not sell or otherwise dispose of our common stock for customary periods before and after an underwritten offering of shares of our common stock. See “Certain Relationships and Related Party Transactions — 2011 Investment.” In addition, the Management Shareholder Agreements provide for certain repurchase rights and restrictions, including that shares acquired in the Equity Transaction may not be transferred until December 31, 2016 and that certain shares acquired through the exercise of stock options may not be transferred for certain periods.
Registration Rights
Following the completion of this offering, pursuant to the Shareholders Agreement, our Principal Stockholders will have rights, subject to certain conditions, to require us to include their shares in registration statements that we may file for ourselves or other existing stockholders, and the Principal Stockholders will have demand registration rights. In addition, pursuant to the Management Shareholder Agreements, we have granted
150
Table of Contents
certain of our officers and employees piggyback registration rights pursuant to which they may require us to include their shares in future offerings that involve, in whole or in part, a secondary offering of our shares, provided that Auto Finance Holdings is selling shares in such offering. See “Certain Relationships and Related Party Transactions — Shareholders Agreement — Registration Rights” and “Certain Relationships and Related Party Transactions — 2011 Investment.” Registration of these shares under the Securities Act will result in these shares becoming freely tradable without restriction under the Securities Act upon effectiveness of the registration statement.
Rule 144
In general, under Rule 144 under the Securities Act, a person (or persons whose shares are aggregated) who is not deemed to have been an affiliate of ours at any time during the three months preceding a sale, and who has beneficially owned restricted securities within the meaning of Rule 144 for at least six months (including any period of consecutive ownership of preceding non-affiliated holders), will be entitled to sell those shares, subject only to the availability of current public information about us. A non-affiliated person who has beneficially owned restricted securities within the meaning of Rule 144 for at least one year will be entitled to sell those shares without regard to the provisions of Rule 144.
A person (or persons whose shares are aggregated) who is deemed to be an affiliate of ours and who has beneficially owned restricted securities within the meaning of Rule 144 for at least six months would be entitled to sell within any three-month period a number of shares that does not exceed the greater of 1% of the then-outstanding shares of our common stock or the average weekly trading volume of our common stock during the four calendar weeks preceding such sale. Such sales are also subject to certain manner of sales provisions, notice requirements and the availability of current public information about us.
Rule 701
In general, under Rule 701 under the Securities Act, an employee, consultant or advisor who purchases shares of our common stock from us in connection with a compensatory stock or option plan or other written agreement is eligible to resell those shares 90 days after the effective date of the registration statement of which this prospectus forms a part in reliance on Rule 144, but without compliance with some of the restrictions, including the holding period restriction, contained in Rule 144.
151
Table of Contents
MATERIAL U.S. TAX CONSEQUENCES TO NON-U.S. HOLDERS
The following is a discussion of the material U.S. federal income tax considerations with respect to the ownership and disposition of shares of common stock applicable to non-U.S. holders who acquire such shares in this offering and hold such shares as a capital asset within the meaning of Section 1221 of the Internal Revenue Code of 1986, as amended (the “Code”) (generally, property held for investment). For purposes of this discussion, a “non-U.S. holder” means a beneficial owner of our common stock (other than an entity or arrangement that is treated as a partnership for U.S. federal income tax purposes) that is not, for U.S. federal income tax purposes, any of the following:
| • | a citizen or resident of the United States; |
| • | a corporation (or other entity treated as a corporation for U.S. federal income tax purposes) created or organized in the United States or under the laws of the United States, any state thereof or the District of Columbia, or any other corporation treated as such; |
| • | an estate, the income of which is includable in gross income for U.S. federal income tax purposes regardless of its source; or |
| • | a trust if (i) a court within the United States is able to exercise primary supervision over the administration of the trust and one or more “U.S. persons,” as defined under the Code, have the authority to control all substantial decisions of the trust or (ii) such trust has made a valid election to be treated as a U.S. person for U.S. federal income tax purposes. |
This discussion is based on current provisions of the Code, Treasury regulations promulgated thereunder, judicial opinions, published positions of the Internal Revenue Service and other applicable authorities, all of which are subject to change (possibly with retroactive effect). This discussion does not address all aspects of U.S. federal income taxation that may be important to a particular non-U.S. holder in light of that non-U.S. holder’s individual circumstances, nor does it address any aspects of the unearned income Medicare contribution tax pursuant to the Health Care and Education Reconciliation Act of 2010, any U.S. federal estate and gift taxes, any U.S. alternative minimum taxes or any state, local or non-U.S. taxes. This discussion may not apply, in whole or in part, to particular non-U.S. holders in light of their individual circumstances or to holders subject to special treatment under the U.S. federal income tax laws (such as insurance companies, tax-exempt organizations, financial institutions, brokers or dealers in securities, “controlled foreign corporations,” “passive foreign investment companies,” non-U.S. holders that hold our common stock as part of a straddle, hedge, conversion transaction or other integrated investment and certain U.S. expatriates).
If a partnership (or other entity or arrangement treated as a partnership for U.S. federal income tax purposes) holds our common stock, the tax treatment of a partner therein will generally depend on the status of the partner and the activities of the partnership. Partners of a partnership holding our common stock should consult their tax advisor as to the particular U.S. federal income tax consequences applicable to them.
THIS SUMMARY IS FOR GENERAL INFORMATION ONLY AND IS NOT INTENDED TO CONSTITUTE A COMPLETE DESCRIPTION OF ALL TAX CONSEQUENCES FOR NON-U.S. HOLDERS RELATING TO THE OWNERSHIP AND DISPOSITION OF OUR COMMON STOCK. PROSPECTIVE HOLDERS OF OUR COMMON STOCK SHOULD CONSULT WITH THEIR TAX ADVISORS REGARDING THE TAX CONSEQUENCES TO THEM (INCLUDING THE APPLICATION AND EFFECT OF ANY STATE, LOCAL, FOREIGN INCOME AND OTHER TAX LAWS) OF THE OWNERSHIP AND DISPOSITION OF OUR COMMON STOCK.
Dividends
In general, the gross amount of any distribution we make to a non-U.S. holder with respect to its shares of common stock will be subject to U.S. withholding tax at a rate of 30% to the extent the distribution constitutes a dividend for U.S. federal income tax purposes, unless the non-U.S. holder is eligible for a reduced rate of
152
Table of Contents
withholding tax under an applicable tax treaty and the non-U.S. holder provides proper certification of its eligibility for such reduced rate. A distribution will constitute a dividend for U.S. federal income tax purposes to the extent of our current or accumulated earnings and profits as determined for U.S. federal income tax purposes. To the extent any distribution does not constitute a dividend, it will be treated first as reducing the adjusted basis in the non-U.S. holder’s shares of common stock and then, to the extent it exceeds the adjusted basis in the non-U.S. holder’s shares of common stock, as gain from the sale or exchange of such stock. Any such gain will be subject to the treatment described below under “— Gain on Sale or Other Disposition of Common Stock.”
Dividends we pay to a non-U.S. holder that are effectively connected with its conduct of a trade or business within the United States (and, if required by an applicable tax treaty, are attributable to a U.S. permanent establishment of such non-U.S. holder) will not be subject to U.S. withholding tax, as described above, if the non-U.S. holder complies with applicable certification and disclosure requirements. Instead, such dividends generally will be subject to U.S. federal income tax on a net income basis, at regular U.S. federal income tax rates. Dividends received by a foreign corporation that are effectively connected with its conduct of trade or business within the United States may be subject to an additional branch profits tax at a rate of 30% (or such lower rate as may be specified by an applicable tax treaty).
Gain on Sale or Other Disposition of Common Stock
In general, a non-U.S. holder will not be subject to U.S. federal income tax on any gain realized upon the sale or other disposition of the non-U.S. holder’s shares of common stock unless:
| • | the gain is effectively connected with a trade or business carried on by the non-U.S. holder within the United States (and, if required by an applicable tax treaty, is attributable to a U.S. permanent establishment of such non-U.S. holder); |
| • | the non-U.S. holder is an individual and is present in the United States for 183 days or more in the taxable year of disposition and certain other conditions are met; or |
| • | we are or have been a U.S. real property holding corporation for U.S. federal income tax purposes at any time within the shorter of the five-year period preceding such disposition or such non-U.S. holder’s holding period of our common stock, and the non-U.S. holder has held, at any time during said period, more than 5% of the class of our stock being sold. |
Gain that is effectively connected with the conduct of a trade or business in the United States (or so treated) generally will be subject to U.S. federal income tax on a net income tax basis, at regular U.S. federal income tax rates. If the non-U.S. holder is a foreign corporation, the branch profits tax described above also may apply to such effectively connected gain. An individual non-U.S. holder who is subject to U.S. federal income tax because the non-U.S. holder was present in the United States for 183 days or more during the year of sale or other disposition of our common stock will be subject to a flat 30% tax on the gain derived from such sale or other disposition, which may be offset by U.S. source capital losses. We believe that we are not and we do not anticipate becoming a U.S. real property holding corporation for U.S. federal income tax purposes.
Withholdable Payments to Foreign Financial Entities and Other Foreign Entities
Under the Foreign Account Tax Compliance Act and related administrative guidance (“FATCA”), a United States federal withholding tax of 30% generally will be imposed on certain payments made after December 31, 2013 to a “foreign financial institution” (as defined under FATCA) unless (i) such institution enters into an agreement with the U.S. tax authorities to withhold on certain payments and to collect and provide to the U.S. tax authorities substantial information regarding U.S. account holders of such institution (which includes certain equity and debt holders of such institution, as well as certain account holders that are foreign entities with U.S. owners), and certain other requirements are met; or (ii) complies with the terms of an applicable intergovernmental agreement to implement FATCA (“IGA”), which IGA has waived the requirement to enter into the type of agreement specified in (i), and registers its status as compliant with such IGA with the U.S.
153
Table of Contents
government. Under FATCA, a U.S. federal withholding tax of 30% generally also will be imposed on certain payments made after December 31, 2013 to a non-financial foreign entity unless such entity provides the withholding agent with a certification identifying its direct and indirect U.S. owners. These withholding taxes would be imposed on dividends paid with respect to our common stock after December 31, 2013, and on gross proceeds from sales or other dispositions of our common stock after December 31, 2016, in each case, to foreign financial institutions or non-financial entities (including in their capacity as agents or custodians for beneficial owners of our common stock) that fail to satisfy the above requirements. Under certain circumstances, a non-U.S. holder might be eligible for refunds or credits of such taxes. Prospective non-U.S. holders should consult with their tax advisors regarding the possible implications of FATCA on their investment in our common stock.
Backup Withholding, Information Reporting and Other Reporting Requirements
We must report annually to the Internal Revenue Service and to each non-U.S. holder the amount of dividends paid to, and the tax withheld with respect to, each non-U.S. holder. These reporting requirements apply regardless of whether withholding was reduced or eliminated by an applicable tax treaty. Copies of this information reporting may also be made available under the provisions of a specific tax treaty or agreement with the tax authorities in the country in which the non-U.S. holder resides or is established.
A non-U.S. holder will generally be subject to backup withholding for dividends on our common stock paid to such holder unless such holder certifies under penalties of perjury that, among other things, it is a non-U.S. holder (and the payor does not have actual knowledge or reason to know that such holder is a U.S. person) or otherwise establishes an exemption.
Information reporting and backup withholding generally are not required with respect to the amount of any proceeds from the sale or other disposition of our common stock by a non-U.S. holder outside the United States through a foreign office of a foreign broker that does not have certain specified connections to the United States. However, if a non-U.S. holder sells or otherwise disposes of its shares of common stock through a U.S. broker or the U.S. offices of a foreign broker, the broker will generally be required to report the amount of proceeds paid to the non-U.S. holder to the Internal Revenue Service and also backup withhold on that amount unless such non-U.S. holder provides appropriate certification to the broker of its status as a non-U.S. person (and the payor does not have actual knowledge or reason to know that such holder is a U.S. person) or otherwise establishes an exemption. Information reporting will also apply if a non-U.S. holder sells its shares of common stock through a foreign broker deriving more than a specified percentage of its income from U.S. sources or having certain other connections to the United States, unless such broker has documentary evidence in its records that such non-U.S. holder is a non-U.S. person (and the payor does not have actual knowledge or reason to know that such holder is a U.S. person) and certain other conditions are met, or such non-U.S. holder otherwise establishes an exemption.
Backup withholding is not an additional income tax. Any amounts withheld under the backup withholding rules from a payment to a non-U.S. holder generally can be credited against the non-U.S. holder’s U.S. federal income tax liability, if any, or refunded, provided that the required information is furnished to the Internal Revenue Service in a timely manner. Non-U.S. holders should consult their tax advisors regarding the application of the information reporting and backup withholding rules to them.
154
Table of Contents
Citigroup Global Markets Inc. and J.P. Morgan Securities LLC are acting as global coordinators and joint book-running managers of the offering and as representatives of the underwriters named below. Subject to the terms and conditions stated in the underwriting agreement dated the date of this prospectus, each underwriter named below has severally agreed to purchase, and the selling stockholders have agreed to sell to that underwriter, the number of shares set forth opposite the underwriter’s name.
| Underwriter |
Number of Shares | |
| Citigroup Global Markets Inc. |
||
| J.P. Morgan Securities LLC |
||
| Merrill Lynch, Pierce, Fenner & Smith Incorporated |
||
| Deutsche Bank Securities Inc. |
||
| Santander Investment Securities Inc. |
||
| Barclays Capital Inc. |
||
| Goldman, Sachs & Co. |
||
| Morgan Stanley & Co. LLC |
||
| RBC Capital Markets, LLC |
||
| BMO Capital Markets Corp. |
||
| Credit Suisse Securities (USA) LLC |
||
| UBS Securities LLC |
||
| Wells Fargo Securities, LLC |
||
| KKR Capital Markets LLC |
||
| Sandler O’Neill & Partners, L.P. |
||
| Stephens Inc. |
||
| LOYAL3 Securities, Inc. |
||
|
| ||
| Total |
||
|
|
The underwriting agreement provides that the obligations of the underwriters to purchase the shares included in this offering are subject to approval of legal matters by counsel and to other conditions. The underwriters are obligated to purchase all the shares (other than those covered by the over-allotment option described below) if they purchase any of the shares.
Shares sold by the underwriters to the public will initially be offered at the initial public offering price set forth on the cover of this prospectus. Any shares sold by the underwriters to securities dealers may be sold at a discount from the initial public offering price not to exceed $ per share. If all the shares are not sold at the initial offering price, the underwriters may change the offering price and the other selling terms. The representatives have advised us and the selling stockholders that the underwriters do not intend to make sales to discretionary accounts.
If the underwriters sell more shares than the total number set forth in the table above, the selling stockholders have granted to the underwriters an option, exercisable for 30 days from the date of this prospectus, to purchase up to additional shares at the public offering price less the underwriting discount. To the extent the option is exercised, each underwriter must purchase a number of additional shares approximately proportionate to that underwriter’s initial purchase commitment. Any shares issued or sold under the option will be issued and sold on the same terms and conditions as the other shares that are the subject of this offering.
We, our Principal Stockholders, our directors and certain of our officers have agreed, subject to certain exceptions, that, for a period of 180 days from the date of this prospectus, we and they will not, without the prior written consent of Citigroup Global Markets Inc. and J.P. Morgan Securities LLC, dispose of or hedge any shares
155
Table of Contents
or any securities convertible into or exchangeable for our common stock. Citigroup Global Markets Inc. and J.P. Morgan Securities LLC in their sole discretion may release any of the securities subject to these lock-up agreements at any time, which, in the case of officers and directors, shall be with notice. Notwithstanding the foregoing, if (i) during the last 17 days of the 180-day restricted period, we issue an earnings release or material news or a material event relating to our company occurs; or (ii) prior to the expiration of the 180-day restricted period, we announce that we will release earnings results during the 16-day period beginning on the last day of the 180-day restricted period, the restrictions described above shall continue to apply until the expiration of the 18-day period beginning on the issuance of the earnings release or the occurrence of the material news or material event.
Prior to this offering, there has been no public market for our shares. Consequently, the initial public offering price for the shares was determined by negotiations among us, the selling stockholders and the representatives. Among the factors considered in determining the initial public offering price were our results of operations, our current financial condition, our future prospects, our markets, the economic conditions in and future prospects for the industry in which we compete, our management, and currently prevailing general conditions in the equity securities markets, including current market valuations of publicly traded companies considered comparable to our company. We cannot assure you, however, that the price at which the shares will sell in the public market after this offering will not be lower than the initial public offering price or that an active trading market in our shares will develop and continue after this offering.
We have applied to have our shares listed on the NYSE under the symbol “ .”
The following table shows the underwriting discounts and commissions that the selling stockholders are to pay to the underwriters in connection with this offering. These amounts are shown assuming both no exercise and full exercise of the underwriters’ over-allotment option to purchase additional shares.
| Paid by Selling Stockholders | ||||||||
| No Exercise | Full Exercise | |||||||
| Per share |
$ | $ | ||||||
| Total |
$ | $ | ||||||
We and the selling stockholders estimate that our respective portions of the total expenses of this offering will be $ and $ .
In connection with the offering, the underwriters may purchase and sell shares in the open market. Purchases and sales in the open market may include short sales, purchases to cover short positions, which may include purchases pursuant to the over-allotment option, and stabilizing purchases.
| • | Short sales involve secondary market sales by the underwriters of a greater number of shares than they are required to purchase in the offering. |
| • | “Covered” short sales are sales of shares in an amount up to the number of shares represented by the underwriters’ over-allotment option. |
| • | “Naked” short sales are sales of shares in an amount in excess of the number of shares represented by the underwriters’ over-allotment option. |
| • | Covering transactions involve purchases of shares either pursuant to the underwriters’ over-allotment option or in the open market in order to cover short positions. |
| • | To close a naked short position, the underwriters must purchase shares in the open market. A naked short position is more likely to be created if the underwriters are concerned that there may be downward pressure on the price of the shares in the open market after pricing that could adversely affect investors who purchase in the offering. |
156
Table of Contents
| • | To close a covered short position, the underwriters must purchase shares in the open market or must exercise the over-allotment option. In determining the source of shares to close the covered short position, the underwriters will consider, among other things, the price of shares available for purchase in the open market as compared to the price at which they may purchase shares through the over-allotment option. |
| • | Stabilizing transactions involve bids to purchase shares so long as the stabilizing bids do not exceed a specified maximum. |
Purchases to cover short positions and stabilizing purchases, as well as other purchases by the underwriters for their own accounts, may have the effect of preventing or retarding a decline in the market price of the shares. They may also cause the price of the shares to be higher than the price that would otherwise exist in the open market in the absence of these transactions. The underwriters may conduct these transactions on the NYSE, in the over-the-counter market or otherwise. If the underwriters commence any of these transactions, they may discontinue them at any time.
The underwriters are full-service financial institutions engaged in various activities, which may include securities trading, commercial and investment banking, financial advisory, investment management, principal investment, hedging, financing and brokerage activities. The underwriters and their respective affiliates have in the past performed commercial banking, investment banking and advisory services for us from time to time for which they have received customary fees and reimbursement of expenses and may, from time to time, engage in transactions with and perform services for us in the ordinary course of their business for which they may receive customary fees and reimbursement of expenses. In addition, we have in place a forward flow agreement with Bank of America, as discussed in Management’s Discussion and Analysis of Financial Condition and Results of Operations. In the ordinary course of their various business activities, the underwriters and their respective affiliates may make or hold a broad array of investments and actively trade debt and equity securities (or related derivative securities) and financial instruments (which may include bank loans and/or credit default swaps) for their own account and for the accounts of their customers and may at any time hold long and short positions in such securities and instruments. Such investments and securities activities may involve securities and/or instruments of ours or our affiliates. In addition, affiliates of some of the underwriters are lenders, and in some cases agents or managers for the lenders, under our credit facilities, and affiliates of some of the underwriters receive customary fees and reimbursement of expenses as underwriters for our securitizations. Certain of the underwriters or their affiliates that have a lending relationship with us routinely hedge their credit exposure to us consistent with their customary risk management policies. A typical such hedging strategy would include these underwriters or their affiliates hedging such exposure by entering into transactions which consist of either the purchase of credit default swaps or the creation of short positions in our securities. The underwriters and their affiliates may also make investment recommendations and/or publish or express independent research views in respect of such securities or financial instruments and may hold, or recommend to clients that they acquire, long and/or short positions in such securities and instruments.
At our request, the underwriters have reserved up to 3% of the shares for sale at the initial public offering price to persons who are directors, officers or employees, or who are otherwise associated with us through a directed share program. The number of shares available for sale to the general public will be reduced by the number of directed shares purchased by participants in the program. Except for certain of our officers, directors and employees who have entered into lock-up agreements as contemplated in the immediately preceding paragraph, each person buying shares through the directed share program has agreed that, for a period of 180 days from the date of this prospectus, he or she will not, without the prior written consent of Citigroup and J.P. Morgan, dispose of or hedge any shares or any securities convertible into or exchangeable for our common stock with respect to shares purchased in the program, subject to customary exceptions. For certain officers, directors and employees purchasing shares through the directed share program, the lock-up agreements contemplated in the immediately preceding paragraph shall govern with respect to their purchases. Citigroup and J.P. Morgan in their sole discretion may release any of the securities subject to these lock-up agreements at any time, which, in
157
Table of Contents
the case of officers and directors, shall be with notice. Any directed shares not purchased will be offered by the underwriters to the general public on the same basis as all other shares offered. We have agreed to indemnify the underwriters against certain liabilities and expenses, including liabilities under the Securities Act, in connection with the sales of the directed shares.
We and the selling stockholders have agreed to indemnify the underwriters against certain liabilities, including liabilities under the Securities Act, or to contribute to payments the underwriters may be required to make because of any of those liabilities.
At our request, the underwriters have reserved up to 2% of the shares of common stock offered by this prospectus to be offered through the LOYAL3 platform at the initial public offering price. Purchases through the LOYAL3 platform will be in dollar amounts and may include fractional shares. The LOYAL3 platform is designed to facilitate participation of individual purchasers in initial public offerings in amounts of between $100 and $10,000. Any purchase of our common shares in this offering through the LOYAL3 platform will be at the same initial public offering price, and at the same time, as any other purchases in this offering, including purchases by institutions and other large investors. Individual investors in the United States who are interested in purchasing common shares in this offering through the LOYAL3 platform may go to LOYAL3’s website for information about how to become a customer of LOYAL3, which is required to purchase common shares through the LOYAL3 platform. The LOYAL3 platform is available fee-free to investors, and is administered by LOYAL3 Securities, Inc., which is a U.S.-registered broker-dealer unaffiliated with our company. Sales of our common stock by investors using the LOYAL3 platform will be completed through a batch or combined order process typically only once per day. The LOYAL3 platform and information on the LOYAL3 website do not form a part of this prospectus.
Because Santander Investment Securities Inc. and KKR Capital Markets LLC, underwriters for this offering, are under common control with us, a conflict of interest under Financial Industry Regulatory Authority (“FINRA”) Rule 5121 is deemed to exist. Accordingly, this offering will be conducted in accordance with this rule, which requires, among other things, that a “qualified independent underwriter” has participated in the preparation of, and has exercised the usual standards of due diligence with respect to this prospectus and the registration statement of which this prospectus is a part. Citigroup Global Markets Inc. has agreed to act as a qualified independent underwriter. In its role as a qualified independent underwriter, Citigroup Global Capital Markets Inc. has participated in due diligence and the preparation of this prospectus and the registration statement of which this prospectus is a part. Citigroup Global Capital Markets Inc. will not receive any additional fees for serving as a qualified independent underwriter in connection with this offering. We have agreed to indemnify Citigroup Global Markets Inc. against liabilities incurred in connection with acting as a qualified independent underwriter, including liabilities under the Securities Act. Pursuant to FINRA Rule 5121, neither Santander Investment Securities Inc. nor KKR Capital Markets LLC will confirm sales to any account over which it exercises discretionary authority without the specific prior written approval of the account holder.
Notice to Prospective Investors in the European Economic Area
In relation to each member state of the European Economic Area that has implemented the Prospectus Directive (each, a relevant member state), with effect from and including the date on which the Prospectus Directive is implemented in that relevant member state (the relevant implementation date), an offer of shares described in this prospectus may not be made to the public in that relevant member state other than:
| • | to any legal entity which is a qualified investor as defined in the Prospectus Directive; |
| • | to fewer than 100 or, if the relevant member state has implemented the relevant provision of the 2010 PD Amending Directive, 150 natural or legal persons (other than qualified investors as defined in the Prospectus Directive), as permitted under the Prospectus Directive, subject to obtaining the prior consent of the relevant Dealer or Dealers nominated by us for any such offer; or |
158
Table of Contents
| • | in any other circumstances falling within Article 3(2) of the Prospectus Directive; |
provided that no such offer of shares shall require us or any underwriter to publish a prospectus pursuant to Article 3 of the Prospectus Directive.
For purposes of this provision, the expression an “offer of securities to the public” in any relevant member state means the communication in any form and by any means of sufficient information on the terms of the offer and the shares to be offered so as to enable an investor to decide to purchase or subscribe for the shares, as the expression may be varied in that member state by any measure implementing the Prospectus Directive in that member state, and the expression “Prospectus Directive” means Directive 2003/71/EC (and amendments thereto, including the 2010 PD Amending Directive, to the extent implemented in the relevant member state) and includes any relevant implementing measure in the relevant member state. The expression “2010 PD Amending Directive” means Directive 2010/73/EU.
The sellers of the shares have not authorized, and do not authorize the making of, any offer of shares through any financial intermediary on their behalf, other than offers made by the underwriters with a view to the final placement of the shares as contemplated in this prospectus. Accordingly, no purchaser of the shares, other than the underwriters, is authorized to make any further offer of the shares on behalf of the sellers or the underwriters.
Notice to Prospective Investors in the United Kingdom
This prospectus is only being distributed to, and is only directed at, persons in the United Kingdom that are qualified investors within the meaning of Article 2(1)(e) of the Prospectus Directive that are also (i) investment professionals falling within Article 19(5) of the Financial Services and Markets Act 2000 (Financial Promotion) Order 2005 (the “Order”) or (ii) high net worth entities, and other persons to whom it may lawfully be communicated, falling within Article 49(2)(a) to (d) of the Order (each such person being referred to as a “relevant person”). This prospectus and its contents are confidential and should not be distributed, published or reproduced (in whole or in part) or disclosed by recipients to any other persons in the United Kingdom. Any person in the United Kingdom that is not a relevant person should not act or rely on this document or any of its contents.
Notice to Prospective Investors in Australia
No prospectus or other disclosure document (as defined in the Corporations Act 2001 (Cth) of
Australia (“Corporations Act”)) in relation to the common stock has been or will be lodged with the Australian Securities & Investments Commission (“ASIC”). This document has not been lodged with
ASIC and is only directed to certain categories of exempt persons. Accordingly, this document will only be distributed to persons in Australia that are:
| (i) | “sophisticated investors” under section 708(8)(a) or (b) of the Corporations Act; |
| (ii) | “sophisticated investors” under section 708(8)(c) or (d) of the Corporations Act and that have provided an accountant’s certificate to the underwriters which complies with the requirements of section 708(8)(c)(i) or (ii) of the Corporations Act and related regulations before the offer has been made; |
| (iii) | associated with the Company under section 708(12) of the Corporations Act; or |
| (iv) | “professional investors” within the meaning of section 708(11)(a) or (b) of the Corporations Act, and to the extent that such an investor is unable to confirm or warrant that it is an exempt sophisticated investor, associated person or professional investor under the Corporations Act, any offer made to such investor under this document is void and incapable of acceptance. |
159
Table of Contents
No purchaser of the shares may offer any of the common stock for resale in Australia within 12 months of that common stock being issued unless any such resale offer is exempt from the requirement to issue a disclosure document under section 708 of the Corporations Act.
Notice to Prospective Investors in the Dubai International Financial Centre
This prospectus relates to an Exempt Offer in accordance with the Offered Securities Rules of the Dubai Financial Services Authority (“DFSA”). This prospectus is intended for distribution only to persons of a type specified in the Offered Securities Rules of the DFSA. It must not be delivered to, or relied on by, any other person. The DFSA has no responsibility for reviewing or verifying any documents in connection with Exempt Offers. The DFSA has not approved this prospectus nor taken steps to verify the information set forth herein and has no responsibility for the prospectus. The shares to which this prospectus relates may be illiquid and/or subject to restrictions on their resale. Prospective purchasers of the shares offered should conduct their own due diligence on the shares. If you do not understand the contents of this prospectus you should consult an authorized financial advisor.
Notice to Prospective Investors in France
Neither this prospectus nor any other offering material relating to the shares described in this prospectus has been submitted to the clearance procedures of the Autorité des Marchés Financiers or of the competent authority of another member state of the European Economic Area and notified to the Autorité des Marchés Financiers. The shares have not been offered or sold and will not be offered or sold, directly or indirectly, to the public in France. Neither this prospectus nor any other offering material relating to the shares has been or will be:
| • | released, issued, distributed or caused to be released, issued or distributed to the public in France; or |
| • | used in connection with any offer for subscription or sale of the shares to the public in France. |
Such offers, sales and distributions will be made in France only:
| • | to qualified investors (investisseurs qualifiés) and/or to a restricted circle of investors (cercle restreint d’investisseurs), in each case investing for their own account, all as defined in, and in accordance with articles L.411-2, D.411-1, D.411-2, D.734-1, D.744-1, D.754-1 and D.764-1 of the French Code monétaire et financier; |
| • | to investment services providers authorized to engage in portfolio management on behalf of third parties; or |
| • | in a transaction that, in accordance with article L.411-2-II-1°-or-2°-or 3° of the French Code monétaire et financier and article 211-2 of the General Regulations (Règlement Général) of the Autorité des Marchés Financiers, does not constitute a public offer (appel public à l’épargne). |
The shares may be resold directly or indirectly, only in compliance with articles L.411-1, L.411-2, L.412-1 and L.621-8 through L.621-8-3 of the French Code monétaire et financier.
Notice to Prospective Investors in Hong Kong
The shares may not be offered or sold in Hong Kong by means of any document other than (i) in circumstances which do not constitute an offer to the public within the meaning of the Companies Ordinance (Cap. 32, Laws of Hong Kong), or (ii) to “professional investors” within the meaning of the Securities and Futures Ordinance (Cap. 571, Laws of Hong Kong) and any rules made thereunder, or (iii) in other circumstances which do not result in the document being a “prospectus” within the meaning of the Companies Ordinance (Cap. 32, Laws of Hong Kong) and no advertisement, invitation or document relating to the shares may be issued or may be in the possession of any person for the purpose of issue (in each case whether in Hong Kong or
160
Table of Contents
elsewhere), which is directed at, or the contents of which are likely to be accessed or read by, the public in Hong Kong (except if permitted to do so under the laws of Hong Kong) other than with respect to shares which are or are intended to be disposed of only to persons outside Hong Kong or only to “professional investors” within the meaning of the Securities and Futures Ordinance (Cap. 571, Laws of Hong Kong) and any rules made thereunder.
Notice to Prospective Investors in Japan
The shares offered in this prospectus have not been and will not be registered under the Financial Instruments and Exchange Law of Japan. The shares have not been offered or sold and will not be offered or sold, directly or indirectly, in Japan or to or for the account of any resident of Japan (including any corporation or other entity organized under the laws of Japan), except (i) pursuant to an exemption from the registration requirements of the Financial Instruments and Exchange Law and (ii) in compliance with any other applicable requirements of Japanese law.
Notice to Prospective Investors in Singapore
This prospectus has not been registered as a prospectus with the Monetary Authority of Singapore. Accordingly, this prospectus and any other document or material in connection with the offer or sale, or invitation for subscription or purchase, of the shares may not be circulated or distributed, nor may the shares be offered or sold, or be made the subject of an invitation for subscription or purchase, whether directly or indirectly, to persons in Singapore other than (i) to an institutional investor under Section 274 of the Securities and Futures Act, Chapter 289 of Singapore (the “SFA”), (ii) to a relevant person pursuant to Section 275(1), or any person pursuant to Section 275(1A), and in accordance with the conditions specified in Section 275 of the SFA, or (iii) otherwise pursuant to, and in accordance with the conditions of, any other applicable provision of the SFA, in each case subject to compliance with conditions set forth in the SFA.
Where the shares are subscribed or purchased under Section 275 of the SFA by a relevant person which is:
| • | a corporation (which is not an accredited investor (as defined in Section 4A of the SFA)) the sole business of which is to hold investments and the entire share capital of which is owned by one or more individuals, each of whom is an accredited investor; or |
| • | a trust (where the trustee is not an accredited investor) whose sole purpose is to hold investments and each beneficiary of the trust is an individual who is an accredited investor; |
shares, debentures and units of shares and debentures of that corporation or the beneficiaries’ rights and interest (howsoever described) in that trust shall not be transferred within six months after that corporation or that trust has acquired the shares pursuant to an offer made under Section 275 of the SFA except:
| • | to an institutional investor (for corporations, under Section 274 of the SFA) or to a relevant person defined in Section 275(2) of the SFA, or to any person pursuant to an offer that is made on terms that such shares, debentures and units of shares and debentures of that corporation or such rights and interest in that trust are acquired at a consideration of not less than $200,000 (or its equivalent in a foreign currency) for each transaction, whether such amount is to be paid for in cash or by exchange of securities or other assets, and further for corporations, in accordance with the conditions specified in Section 275 of the SFA; |
| • | where no consideration is or will be given for the transfer; or |
| • | where the transfer is by operation of law. |
161
Table of Contents
The validity of the common stock and other certain legal matters will be passed upon for us by Wachtell, Lipton, Rosen & Katz, New York, New York. Certain legal matters relating to this offering will be passed upon for the underwriters by Cleary Gottlieb Steen & Hamilton, LLP, New York, New York, and Cravath, Swaine & Moore LLP, New York, New York, Simpson Thacher & Bartlett LLP, New York, New York, and Wachtell, Lipton, Rosen & Katz, New York, New York on behalf of the selling stockholders.
The consolidated financial statements of the Company, as of December 31, 2012 and 2011, and for each of the three years in the period ended December 31, 2012, included in this Prospectus have been audited by Deloitte & Touche LLP, an independent registered public accounting firm, as stated in their report, which is included herein. Such consolidated financial statements have been so included in reliance upon the report of such firm given upon their authority as experts in accounting and auditing.
162
Table of Contents
WHERE YOU CAN FIND MORE INFORMATION
We have filed with the SEC a registration statement on Form S-1, of which this prospectus is a part, under the Securities Act with respect to the common stock offered hereby. This prospectus does not contain all of the information set forth in the registration statement and the exhibits and schedules thereto. For further information with respect to us and our common stock, reference is made to the registration statement and the exhibits and any schedules filed therewith. Statements contained in this prospectus as to the content of any contract or other document referred to are not necessarily complete and in each instance, if such contract or document is filed as an exhibit, reference is made to the copy of such contract or other document filed as an exhibit to the registration statement, each statement being qualified in all respects by such reference. A copy of the registration statement, including the exhibits and schedules thereto, may be read and copied at the SEC’s Public Reference Room at 100 F Street, N.E., Washington, DC 20549. Information on the operation of the Public Reference Room may be obtained by calling the SEC at 1-800-SEC-0330. In addition, the SEC maintains an Internet website that contains reports, proxy and information statements and other information about issuers, like us, that file electronically with the SEC. The address of that website is www.sec.gov.
As a result of this offering, we will become subject to the full informational requirements of the Exchange Act. We will fulfill our obligations with respect to such requirements by filing periodic reports and other information with the SEC. We intend to furnish our stockholders with annual reports containing consolidated financial statements certified by an independent registered public accounting firm.
163
Table of Contents
INDEX TO CONSOLIDATED FINANCIAL STATEMENTS
SANTANDER CONSUMER USA INC. AND SUBSIDIARIES
| Page | ||||
| Consolidated Financial Statements for the Nine Months Ended September 30, 2013 and September 30, 2012 |
||||
| Condensed Consolidated Balance Sheets as of September 30, 2013 and December 31, 2012 (unaudited) |
F-2 | |||
| F-3 | ||||
| F-4 | ||||
| F-5 | ||||
| Notes to Unaudited Condensed Consolidated Financial Statements |
F-6 | |||
| Consolidated Financial Statements for the Years Ended December 31, 2012, 2011 and 2010 |
||||
| F-31 | ||||
| Consolidated Balance Sheets as of December 31, 2012 and 2011 |
F-32 | |||
| F-33 | ||||
| Consolidated Statements of Equity for the Years Ended December 31, 2012, 2011 and 2010 |
F-34 | |||
| Consolidated Statements of Cash Flows for the Years Ended December 31, 2012, 2011 and 2010 |
F-35 | |||
| F-36 | ||||
F-1
Table of Contents
SANTANDER CONSUMER USA INC. AND SUBSIDIARIES
CONDENSED CONSOLIDATED BALANCE SHEETS
(UNAUDITED, DOLLARS IN THOUSANDS)
| September 30, 2013 |
December 31, 2012 |
|||||||
| Assets |
||||||||
| Cash and cash equivalents |
$ | 27,351 | $ | 70,887 | ||||
| Receivables held for sale |
73,425 | — | ||||||
| Retail installment contracts held for investment, net |
20,418,553 | 16,203,926 | ||||||
| Unsecured consumer loans, net |
569,781 | — | ||||||
| Restricted cash |
1,612,943 | 1,290,461 | ||||||
| Receivables from dealers held for investment |
176,925 | 61,894 | ||||||
| Accrued interest receivable |
297,642 | 240,628 | ||||||
| Leased vehicles, net |
1,221,949 | — | ||||||
| Investments available for sale |
— | 95,600 | ||||||
| Furniture and equipment, net of accumulated depreciation of $55,388 and $57,630, respectively |
22,607 | 13,462 | ||||||
| Federal, state and other income taxes receivable |
178,717 | — | ||||||
| Deferred tax asset |
446,999 | 506,267 | ||||||
| Goodwill |
74,056 | 74,056 | ||||||
| Intangible assets |
54,517 | 52,644 | ||||||
| Other assets |
432,815 | 131,819 | ||||||
|
|
|
|
|
|||||
| Total assets (1) |
$ | 25,608,280 | $ | 18,741,644 | ||||
|
|
|
|
|
|||||
| Liabilities and Equity |
||||||||
| Liabilities: |
||||||||
| Notes payable — credit facilities, $3,295,000 and $1,385,000 to affiliates, respectively |
$ | 7,407,526 | $ | 3,374,666 | ||||
| Notes payable — secured structured financings |
15,275,871 | 12,853,329 | ||||||
| Accrued interest payable — $6,276 and $2,135 to affiliates, respectively |
20,076 | 13,772 | ||||||
| Accounts payable and accrued expenses — $44,753 and $59,067 to affiliates, respectively |
244,548 | 156,550 | ||||||
| Federal, state and other income taxes payable |
— | 3,038 | ||||||
| Other liabilities |
91,101 | 100,823 | ||||||
|
|
|
|
|
|||||
| Total liabilities (2) |
23,039,122 | 16,502,178 | ||||||
|
|
|
|
|
|||||
| Commitments and contingencies (Notes 5 and 10) |
||||||||
| Equity: |
||||||||
| Common stock, no par value — 250,000,000 shares authorized; 129,824,195 and 129,819,883 shares issued, respectively; 129,823,012 and 129,819,883 shares outstanding, respectively |
1,265,764 | 1,264,201 | ||||||
| Additional paid-in capital |
147,161 | 74,833 | ||||||
| Accumulated other comprehensive loss |
(6,595 | ) | (9,164 | ) | ||||
| Retained earnings |
1,162,828 | 869,664 | ||||||
|
|
|
|
|
|||||
| Total stockholders’ equity |
2,569,158 | 2,199,534 | ||||||
| Noncontrolling interests |
— | 39,932 | ||||||
|
|
|
|
|
|||||
| Total equity |
2,569,158 | 2,239,466 | ||||||
|
|
|
|
|
|||||
| Total liabilities and equity |
$ | 25,608,280 | $ | 18,741,644 | ||||
|
|
|
|
|
|||||
| (1) | Consolidated assets at September 30, 2013 and December 31, 2012, respectively, include the following assets of certain variable interest entities (“VIEs”) that can only be used to settle the liabilities of those entities: Restricted cash, $1.3 billion and $1.1 billion; Retail installment contracts held for investment, net, of $19.8 billion and $14.2 billion; various other assets, $1.6 billion and $0.3 billion (see Note 6). |
| (2) | Consolidated liabilities at September 30, 2013 and December 31, 2012, respectively, include the following liabilities of certain VIEs: Notes payable, $23.1 billion and $13.9 billion; various other liabilities, $0.1 billion (see Note 6). |
See notes to unaudited condensed consolidated financial statements.
F-2
Table of Contents
SANTANDER CONSUMER USA INC. AND SUBSIDIARIES
CONDENSED CONSOLIDATED STATEMENTS OF INCOME AND COMPREHENSIVE INCOME
(UNAUDITED, DOLLARS IN THOUSANDS, EXCEPT PER SHARE AMOUNTS)
| For the Three Months Ended September 30, |
For the Nine Months Ended September 30, |
|||||||||||||||
| 2013 | 2012 | 2013 | 2012 | |||||||||||||
| Interest and fees on finance receivables and loans |
$ | 1,011,492 | $ | 744,958 | $ | 2,723,774 | $ | 2,153,289 | ||||||||
| Leased vehicle income |
50,099 | — | 60,129 | — | ||||||||||||
| Other finance and interest income |
1,029 | 2,950 | 5,870 | 9,423 | ||||||||||||
|
|
|
|
|
|
|
|
|
|||||||||
| Total finance and other interest income |
1,062,620 | 747,908 | 2,789,773 | 2,162,712 | ||||||||||||
| Interest expense — Including $38,935, $20,424, $64,479, and $62,031 to affiliates, respectively |
120,589 | 98,774 | 291,062 | 293,238 | ||||||||||||
| Leased vehicle expense |
41,485 | — | 48,513 | — | ||||||||||||
|
|
|
|
|
|
|
|
|
|||||||||
| Net interest margin |
900,546 | 649,134 | 2,450,198 | 1,869,474 | ||||||||||||
| Provision for loan losses |
598,201 | 185,875 | 1,223,805 | 660,202 | ||||||||||||
|
|
|
|
|
|
|
|
|
|||||||||
| Net interest margin after provision for loan losses |
302,345 | 463,259 | 1,226,393 | 1,209,272 | ||||||||||||
| Profit sharing |
27,238 | — | 34,802 | — | ||||||||||||
|
|
|
|
|
|
|
|
|
|||||||||
| Net interest margin after provision for loan losses and profit sharing |
275,107 | 463,259 | 1,191,591 | 1,209,272 | ||||||||||||
| Gain on sale of receivables |
7,678 | — | 8,950 | — | ||||||||||||
| Servicing fee income |
7,384 | 7,979 | 21,010 | 26,843 | ||||||||||||
| Fees, commissions, and other |
63,278 | 66,312 | 178,918 | 212,047 | ||||||||||||
|
|
|
|
|
|
|
|
|
|||||||||
| Total other income |
78,340 | 74,291 | 208,878 | 238,890 | ||||||||||||
| Costs and expenses: |
||||||||||||||||
| Salary and benefits expense |
79,293 | 55,402 | 217,172 | 164,701 | ||||||||||||
| Servicing and repossession expense |
36,091 | 27,956 | 103,231 | 101,329 | ||||||||||||
| Other operating costs |
60,756 | 100,372 | 175,909 | 198,162 | ||||||||||||
|
|
|
|
|
|
|
|
|
|||||||||
| Total costs and expenses |
176,140 | 183,730 | 496,312 | 464,192 | ||||||||||||
|
|
|
|
|
|
|
|
|
|||||||||
| Income before income taxes |
177,307 | 353,820 | 904,157 | 983,970 | ||||||||||||
| Income tax expense |
65,486 | 141,261 | 322,413 | 372,266 | ||||||||||||
|
|
|
|
|
|
|
|
|
|||||||||
| Net income |
111,821 | 212,559 | 581,744 | 611,704 | ||||||||||||
| Noncontrolling interests |
(576 | ) | (44,092 | ) | 1,821 | (15,858 | ) | |||||||||
|
|
|
|
|
|
|
|
|
|||||||||
| Net income attributable to Santander Consumer USA Inc. shareholders |
$ | 111,245 | $ | 168,467 | $ | 583,565 | $ | 595,846 | ||||||||
|
|
|
|
|
|
|
|
|
|||||||||
| Net income |
$ | 111,821 | $ | 212,559 | $ | 581,744 | $ | 611,704 | ||||||||
|
|
|
|
|
|
|
|
|
|||||||||
| Other comprehensive income (loss): |
||||||||||||||||
| Change in unrealized gains (losses) on cash flow hedges, net of tax |
986 | 1,330 | 5,821 | 3,718 | ||||||||||||
| Change in unrealized gains (losses) on investments available for sale, net of tax |
(629 | ) | (569 | ) | (3,252 | ) | (3,273 | ) | ||||||||
|
|
|
|
|
|
|
|
|
|||||||||
| Other comprehensive income (loss), net |
357 | 761 | 2,569 | 445 | ||||||||||||
|
|
|
|
|
|
|
|
|
|||||||||
| Comprehensive income |
112,178 | 213,320 | 584,313 | 612,149 | ||||||||||||
| Comprehensive income attributable to noncontrolling interests |
(624 | ) | (44,359 | ) | 953 | (17,369 | ) | |||||||||
|
|
|
|
|
|
|
|
|
|||||||||
| Comprehensive income attributable to Santander Consumer USA Inc. shareholders |
$ | 111,554 | $ | 168,961 | $ | 585,266 | $ | 594,780 | ||||||||
|
|
|
|
|
|
|
|
|
|||||||||
| Net income per common share (basic and diluted) |
$ | 0.86 | $ | 1.30 | $ | 4.50 | $ | 4.59 | ||||||||
|
|
|
|
|
|
|
|
|
|||||||||
| Dividends declared per common share |
$ | — | $ | 1.12 | $ | 2.24 | $ | 3.67 | ||||||||
|
|
|
|
|
|
|
|
|
|||||||||
| Weighted average common shares |
129,822,780 | 129,819,883 | 129,821,712 | 129,819,883 | ||||||||||||
|
|
|
|
|
|
|
|
|
|||||||||
See notes to unaudited condensed consolidated financial statements.
F-3
Table of Contents
SANTANDER CONSUMER USA INC. AND SUBSIDIARIES
CONDENSED CONSOLIDATED STATEMENTS OF EQUITY
(UNAUDITED, DOLLARS IN THOUSANDS)
| Common Stock |
Additional Paid-in Capital |
Accumulated Other Comprehensive (Loss) Income |
Retained Earnings |
Noncontrolling Interests |
Total Stockholders’ Equity |
|||||||||||||||||||
| Balance — January 1, 2012 |
$ | 1,263,686 | $ | 74,833 | $ | (11,496 | ) | $ | 889,661 | $ | 20,001 | $ | 2,236,685 | |||||||||||
| Issuance of common stock |
$ | 515 | $ | — | $ | — | $ | — | $ | — | $ | 515 | ||||||||||||
| Accrued capital contribution |
— | — | — | — | — | — | ||||||||||||||||||
| Receivable from shareholder |
— | |||||||||||||||||||||||
| Net income |
— | — | — | 595,846 | 15,858 | 611,704 | ||||||||||||||||||
| Other comprehensive income, net of taxes of $271 |
— | — | 445 | — | — | 445 | ||||||||||||||||||
| Dividends |
— | — | — | (475,000 | ) | — | (475,000 | ) | ||||||||||||||||
|
|
|
|
|
|
|
|
|
|
|
|
|
|||||||||||||
| Balance — September 30, 2012 |
$ | 1,264,201 | $ | 74,833 | $ | (11,051 | ) | $ | 1,010,507 | $ | 35,859 | $ | 2,374,349 | |||||||||||
|
|
|
|
|
|
|
|
|
|
|
|
|
|||||||||||||
| Balance — January 1, 2013 |
$ | 1,264,201 | $ | 74,833 | $ | (9,164 | ) | $ | 869,664 | $ | 39,932 | $ | 2,239,466 | |||||||||||
| Repayment of employee loans |
1,563 | — | — | — | — | 1,563 | ||||||||||||||||||
| Stock issued in connection with employee incentive compensation plans |
23 | 23 | ||||||||||||||||||||||
| Purchase of treasury stock |
(23 | ) | — | — | — | — | (23 | ) | ||||||||||||||||
| Capital contribution received from shareholder |
— | 48,275 | — | — | — | 48,275 | ||||||||||||||||||
| Net income |
— | — | — | 583,565 | (1,821 | ) | 581,744 | |||||||||||||||||
| Other comprehensive income, net of taxes of $1,730 |
— | — | 2,569 | — | — | 2,569 | ||||||||||||||||||
| Abandonment of noncontrolling interest |
24,053 | (38,111 | ) | (14,058 | ) | |||||||||||||||||||
| Dividends |
— | — | — | (290,401 | ) | — | (290,401 | ) | ||||||||||||||||
|
|
|
|
|
|
|
|
|
|
|
|
|
|||||||||||||
| Balance — September 30, 2013 |
$ | 1,265,764 | $ | 147,161 | $ | (6,595 | ) | $ | 1,162,828 | $ | — | $ | 2,569,158 | |||||||||||
|
|
|
|
|
|
|
|
|
|
|
|
|
|||||||||||||
See notes to unaudited condensed consolidated financial statements.
F-4
Table of Contents
SANTANDER CONSUMER USA INC AND SUBSIDIARIES
CONDENSED CONSOLIDATED STATEMENTS OF CASH FLOWS
(UNAUDITED, DOLLARS IN THOUSANDS)
| For the Nine Months Ended September 30, |
||||||||
| 2013 | 2012 | |||||||
| Cash flows from operating activities: |
||||||||
| Net income |
$ | 581,744 | $ | 611,704 | ||||
| Adjustments to reconcile net income to net cash provided by operating activities: |
||||||||
| Derivative expense |
(16,235 | ) | 1,256 | |||||
| Provision for credit losses |
1,223,805 | 660,202 | ||||||
| Depreciation and amortization |
89,743 | 45,133 | ||||||
| Accretion of discount and capitalized origination costs, net |
(321,187 | ) | (67,112 | ) | ||||
| Originations and purchases of receivables held for sale |
(1,179,109 | ) | — | |||||
| Proceeds from sales of and repayments on receivables held for sale |
1,114,634 | — | ||||||
| Gain on sale of receivables |
(8,950 | ) | — | |||||
| Stock-based compensation |
187 | (207 | ) | |||||
| Deferred tax expense (benefit) |
43,481 | (101,224 | ) | |||||
| Changes in assets and liabilities: |
||||||||
| Accrued interest receivable |
(74,277 | ) | (8,624 | ) | ||||
| Accounts receivable |
(4,504 | ) | 958 | |||||
| Federal income tax and other taxes |
(181,754 | ) | (115,254 | ) | ||||
| Other assets |
(1,114 | ) | (2,068 | ) | ||||
| Accrued interest payable |
6,304 | (1,281 | ) | |||||
| Other liabilities |
109,031 | 11,690 | ||||||
|
|
|
|
|
|||||
| Net cash provided by operating activities |
1,381,799 | 1,035,173 | ||||||
|
|
|
|
|
|||||
| Cash flows from investing activities: |
||||||||
| Retail installment contracts originated or purchased from dealers |
(12,062,266 | ) | (6,194,023 | ) | ||||
| Retail installment contracts purchased from other lenders, net of acquired debt and restricted cash |
— | (76,689 | ) | |||||
| Collections on retail installment contracts |
7,027,406 | 5,956,445 | ||||||
| Leased vehicle purchases |
(1,421,078 | ) | — | |||||
| Proceeds from termination of leased vehicles |
7,199 | — | ||||||
| Change in revolving unsecured consumer loans |
(524,578 | ) | — | |||||
| Unsecured consumer term loans purchased |
(108,669 | ) | — | |||||
| Collections on unsecured consumer term loans |
5,850 | — | ||||||
| Disbursements for receivables from lenders held for investment |
(228,938 | ) | (8,080 | ) | ||||
| Receipts on receivables from lenders held for investment |
112,313 | 8,152 | ||||||
| Collections on investments available for sale |
91,563 | 68,127 | ||||||
| Purchases of furniture and equipment |
(17,789 | ) | (4,886 | ) | ||||
| Retirements and sales of furniture and equipment |
991 | — | ||||||
| Upfront fee paid in accordance with private label financing agreement |
(150,000 | ) | — | |||||
| Change in restricted cash |
(322,482 | ) | 409,707 | |||||
| Other investing activities |
(5,090 | ) | (5,402 | ) | ||||
|
|
|
|
|
|||||
| Net cash provided by (used in) investing activities |
(7,595,568 | ) | 153,351 | |||||
|
|
|
|
|
|||||
| Cash flows from financing activities: |
||||||||
| Proceeds from notes payable related to secured structured financings — net of debt issuance costs |
8,150,330 | 6,194,207 | ||||||
| Payments on notes payable related to secured structured financings |
(5,740,669 | ) | (6,527,691 | ) | ||||
| Payments on TALF loan payable |
— | (87,129 | ) | |||||
| Proceeds from notes payable related to credit facilities |
21,010,855 | 11,963,200 | ||||||
| Payments on notes payable related to credit facilities |
(16,977,995 | ) | (12,308,740 | ) | ||||
| Dividends paid |
(290,401 | ) | (475,000 | ) | ||||
| Repayment of employee notes |
1,562 | 515 | ||||||
| Capital contribution from shareholder |
48,275 | — | ||||||
| Other financing activities |
(31,724 | ) | — | |||||
|
|
|
|
|
|||||
| Net cash provided by (used in) financing activities |
6,170,233 | (1,240,638 | ) | |||||
|
|
|
|
|
|||||
| Net decrease in cash and cash equivalents |
(43,536 | ) | (52,114 | ) | ||||
| Cash — Beginning of period |
70,887 | 54,409 | ||||||
|
|
|
|
|
|||||
| Cash — End of period |
$ | 27,351 | $ | 2,295 | ||||
|
|
|
|
|
|||||
| Supplemental disclosures of cash flow information: |
||||||||
| Cash paid during the period for: |
||||||||
| Interest |
$ | 300,993 | $ | 292,572 | ||||
| Income taxes |
$ | 459,528 | $ | 591,807 | ||||
| Noncash investing and financing transactions: |
||||||||
| Transfers of retail installment contracts to repossessed vehicles |
$ | 677,411 | $ | 627,320 | ||||
See notes to unaudited condensed consolidated financial statements.
F-5
Table of Contents
SANTANDER CONSUMER USA INC. AND SUBSIDIARIES
NOTES TO UNAUDITED CONDENSED CONSOLIDATED FINANCIAL STATEMENTS
(Dollars in thousands)
| 1. | Description of Business, Basis of Presentation, and Significant Accounting Policies |
Santander Consumer USA Inc. and subsidiaries (“SCUSA” or the “Company”) is a specialized consumer finance company focused on vehicle finance and unsecured consumer lending products. The Company’s primary business is the indirect origination of retail installment contracts principally through manufacturer-franchised dealers in connection with their sale of used and new automobiles and light-duty trucks to retail consumers.
In conjunction with a ten-year private label financing agreement with Chrysler Group (the “Chrysler Agreement”) that became effective May 1, 2013, the Company offers a full spectrum of auto financing products and services to Chrysler customers and dealers under the Chrysler Capital brand. These products and services include consumer retail installment contracts and leases, as well as dealer loans for inventory, construction, real estate, working capital and revolving lines of credit.
The Company also originates vehicle loans through a Web-based direct lending program, purchases vehicle retail installment contracts from other lenders, and services automobile and recreational and marine vehicle portfolios for other lenders. Additionally, in 2013 the Company began originating and acquiring unsecured consumer loans.
The Company is currently owned approximately 65% by Santander Holdings USA, Inc. (“SHUSA”), a subsidiary of Banco Santander, S.A. (“Santander”), approximately 25% by Sponsor Auto Finance Holdings Series LP (“Auto Finance Holdings”), approximately 10% by DDFS LLC, an entity affiliated with the Company’s Chief Executive Officer (“CEO”), and less than 1% by other holders, primarily other members of senior management.
Basis of Presentation
The accompanying consolidated financial statements include the accounts of SCUSA and its subsidiaries, including certain special purpose financing trusts utilized in financing transactions (“Trusts”), which are considered variable interest entities (VIEs). Additionally, until August 2013, the Company had consolidated certain other VIEs for which it was deemed the primary beneficiary. All intercompany balances and transactions have been eliminated in consolidation.
The interim period consolidated financial statements, including the notes thereto, are condensed and do not include all disclosures required by generally accepted accounting principles (“GAAP”) in the United States of America. These interim period financial statements should be read in conjunction with the consolidated financial statements and accompanying notes included in the Company’s prospectus filed with the SEC pursuant to Rule 424(b) under the Securities Act of 1933, as amended, on (Prospectus).
The condensed consolidated financial statements as of September 30, 2013 and December 31, 2012, and for the three and nine months ended September 30, 2013 and 2012, are unaudited and, in management’s opinion, include all adjustments, consisting of normal recurring adjustments, necessary for a fair presentation of the results for such interim periods. The results for interim periods are not necessarily indicative of results for a full year.
The preparation of financial statements in conformity with U.S. GAAP requires management to make estimates and assumptions which affect the reported amounts of assets and liabilities and the disclosures of contingent assets and liabilities as of the date of the financial statements and the amount of revenue and costs and expenses during the reporting periods. Actual results could differ from those estimates and those differences may be material. These estimates include the determination of loan loss allowance, discount
F-6
Table of Contents
accretion, impairment, expected end-of-term lease residual values, values of repossessed assets, and income taxes. These estimates, although based on actual historical trends and modeling, may potentially show significant variances over time.
Certain prior period amounts have been reclassified to conform to current period presentation. Specifically, notes payable on the balance sheet are now classified according to whether they are revolving credit facilities or secured structured financings, rather than whether they are related to securitized retail installment contracts.
Business Segment Information
The Company currently operates in one reportable segment, Vehicle Finance. This segment includes vehicle financial products and services, including retail installment contracts, vehicle leases, dealer floorplan loans and commercial loans, primarily for automobiles. This segment also includes financial products and services related to motorcycles and recreational vehicles, as well as unsecured personal lending operations, all of which in aggregate are insignificant to the Company’s operations. The consolidated financial statements reflect the financial results of this one reportable segment.
Retail Installment Contracts
Retail installment contracts consist largely of nonprime automobile finance receivables, which are acquired individually from dealers at a nonrefundable discount from the contractual principal amount. Retail installment contracts also include receivables originated through a direct lending program and loan portfolios purchased from other lenders. Retail installment contracts acquired individually or originated directly are primarily classified as held for investment and carried at amortized cost, net of allowance for loan losses. Most of the Company’s retail installment contracts held for investment are pledged under its warehouse lines of credit or securitization transactions. Retail installment contracts the Company does not have the intent and ability to hold for the foreseeable future or until maturity or payoff are classified as held for sale and carried at the lower of cost or market, as determined on an aggregate basis.
Interest is accrued when earned in accordance with the terms of the retail installment contract. The accrual of interest is discontinued and reversed once a retail installment contract becomes more than 60 days past due, and is resumed and reinstated if a delinquent account subsequently becomes 60 days or less past due. The amortization of discounts, subvention payments from manufacturers, and other origination costs on retail installment contracts held for investment acquired individually or through a direct lending program are recognized as adjustments to the yield of the related contract using the effective interest method. The Company estimates future principal prepayments and defaults in the calculation of the constant effective yield.
A portion of the discount received on contracts purchased from other lenders is attributable to the expectation that not all contractual cash flows will be received from the borrowers. These loans are accounted for in accordance with FASB ASC 310-30, Loans and Debt Securities Acquired with Deteriorated Credit Quality. The excess of the estimated undiscounted principal, interest, and other cash flows expected to be collected over the initial investment in the acquired loans, or accretable yield, is accreted to interest income over the expected life of the loans using the effective interest rate method. The nonaccretable difference, or excess of contractually required payments over the estimated cash flows expected to be collected, is not accreted into income.
Any deterioration in the performance of the purchased portfolios results in an incremental provision for loan losses. Improvements in performance of the purchased pools that significantly increase actual or expected cash flows result first in a reversal of previously recorded allowance for loan losses and then in a transfer of the excess from nonaccretable difference to accretable yield, which will be recorded as finance income over the remaining life of the receivables.
F-7
Table of Contents
Unsecured Consumer Loans, net
Unsecured consumer loans, net, consist of both revolving and amortizing term finance receivables acquired individually under terms of the Company’s agreements with certain third parties who originate and continue to service the loans. Certain of the revolving receivables were acquired at a discount. Unsecured consumer loans are classified as held-for-investment and carried at amortized cost, net of allowance for loan losses.
Interest is accrued when earned in accordance with the terms of the contract. The accrual of interest on amortizing term receivables is discontinued and reversed once a receivable becomes past due more than 60 days, and is resumed and reinstated if a delinquent account subsequently becomes 60 days or less past due. The accrual of interest on revolving unsecured loans continues until the receivable becomes 180 days past due, at which point the principal amount and interest are charged off. The amortization of discounts is recognized on a straight-line basis over the estimated period over which the receivables are expected to be outstanding.
Receivables from Dealers
Receivables from dealers include floorplan loans provided to dealerships to finance new and used vehicles for their inventory. Receivables from dealers also include real estate loans and working capital revolving lines of credit. Interest on these loans is accrued when earned in accordance with the agreement with the dealer. Receivables from dealers the Company does not have the intent and ability to hold for the foreseeable future or until maturity or payoff are classified as held for sale and carried at the lower of cost or market, as determined on an aggregate basis.
Dealers with floorplan loans are permitted to deposit cash with the Company in exchange for a lower interest rate. This cash is commingled with the Company’s other cash and available for general use. As of September 30, 2013, no dealer had cash on deposit with the Company. Interest expense incurred on previously outstanding deposit balances was immaterial for the three and nine months ended September 30, 2013 and is included in interest expense.
Provision for Loan Losses
Provisions for loan losses are charged to operations in amounts sufficient to maintain the loan loss allowance at a level considered adequate to cover probable credit losses inherent in the portfolio. Probable losses are estimated based on contractual delinquency status and historical loss experience, in addition to the Company’s judgment of estimates of the value of the underlying collateral, bankruptcy trends, economic conditions such as unemployment rates, changes in the used vehicle value index, delinquency status, historical collection rates and other information in order to make the necessary judgments as to probable loan losses.
Retail installment contracts acquired individually are charged off against the allowance in the month in which the account becomes 120 days contractually delinquent if the Company has not repossessed the related vehicle. The Company charges off accounts in repossession when the automobile is repossessed and legally available for disposition. A charge-off represents the difference between the estimated net sales proceeds and the amount of the delinquent contract. Accounts in repossession that have been charged off and are pending liquidation are removed from retail installment contracts and the related repossessed automobiles are included in repossessed vehicles and other assets in the Company’s consolidated balance sheets.
Term and revolving unsecured consumer loans are charged off against the allowance in the month in which the accounts become 120 and 180 days contractually delinquent, respectively.
In addition to maintaining a general allowance based on risk ratings, receivables from dealers are evaluated individually for impairment with specific reserves established for receivables determined to be individually impaired. Receivables from dealers are charged off against these reserves at management’s discretion based on the dealer’s individual facts and circumstances.
F-8
Table of Contents
Leased Vehicles, net
Vehicles for which the Company is the lessor are classified as operating leases, as they do not meet the accounting requirements to be classified as a capital lease. The net capitalized cost of each lease is recorded as an asset and depreciated on a straight-line basis over the contractual term of the lease to the expected residual value. The expected residual value and, accordingly, the monthly depreciation expense may change throughout the term of the lease. The Company estimates expected residual values using independent data sources and internal statistical models that take into consideration economic conditions, current auction results, the Company’s remarketing abilities, and manufacturer vehicle and marketing programs.
Lease payments due from customers are recorded as income until and unless a customer becomes more than 60 days delinquent, at which time the accrual of revenue is discontinued and reversed. The accrual is resumed and reinstated if a delinquent account subsequently becomes 60 days or less past due. Subvention payments from the manufacturer, down payments from the customer, and initial direct costs incurred in connection with originating the lease are amortized on a straight-line basis over the contractual term of the lease. The Company periodically evaluates its investment in operating leases for impairment if circumstances, such as a general decline in used vehicle values, indicate that an impairment may exist.
Inventory of Repossessed Vehicles
Inventory of repossessed vehicles represents vehicles the Company has repossessed due to the borrowers’ default on the payment terms of the retail installment contracts and loans. The Company generally begins repossession activity once a customer has reached 60 days past due. The customer has an opportunity to redeem the repossessed vehicle by paying all outstanding balances, including finance charges and fees. Any vehicles not redeemed are sold at auction. The Company records the vehicles currently in its inventory at the lower of cost or estimated fair value, net of estimated costs to sell. See Notes 8 and 12.
Noncontrolling Interests
Noncontrolling interests represent the activity and net assets of two Delaware limited liability companies (the “LLCs”), Auto Loan Acquisition 2011-A LLC (“ALA-A”) and Auto Loan Acquisition 2011-B LLC (“ALA-B”), which were formed in 2011 to purchase and hold certain loan portfolios. Two of the investors in Auto Finance Holdings were the equity investors in the LLCs. Although SCUSA had no equity interest in the LLCs, it had variable interests in the LLCs, including the servicing agreements and an investment in subordinated bonds of the LLCs. Because the Company had the power, through execution of the servicing agreements, to direct the activities of the LLCs that had the most impact on the LLCs’ performance, and had the potential to absorb losses of the entities because of the investment in the bonds, SCUSA was considered the primary beneficiary. Accordingly, these LLCs were consolidated in SCUSA’s consolidated financial statements, with noncontrolling interest expense recorded equal to their entire net income.
On August 30, 2013, the two equity investors abandoned their interests in the LLCs, resulting in SCUSA having full ownership of the LLCs. Accordingly, the $38,110 noncontrolling interests balance as of that date was reclassified into additional paid-in capital, net of a $14,057 adjustment to the deferred tax asset representing the change in the book-tax basis difference of SCUSA’s investment in the LLCs. As a result of the abandonment, noncontrolling interests no longer are recorded.
Recent Accounting Pronouncements
In December 2011, the FASB issued ASU 2011-11, Balance Sheet: Disclosures About Offsetting Assets and Liabilities. ASU 2011-11 requires companies to disclose information about offsetting and related arrangements to enable users of its financial statements to understand the effect of those arrangements on its financial position. In January 2013, the FASB issued ASU 2013-01, Balance Sheet: Clarifying the Scope of Disclosures about Offsetting Assets and Liabilities. ASU 2013-01 amends and clarifies the scope of the disclosures required in ASU 2011-11. The Company retroactively adopted this guidance on January 1, 2013. See Note 7.
F-9
Table of Contents
In February 2013, the FASB issued ASU 2013-02, Comprehensive Income: Reporting of Amounts Reclassified out of Accumulated Other Comprehensive Income. ASU 2013-02 requires presenting information about amounts reclassified out of accumulated other comprehensive income and their corresponding effect on net income. This will present, in one place, information about significant amounts reclassified and, in some cases, cross-references to related footnote disclosures. The amendments to ASC 220 were adopted prospectively by the Company beginning January 1, 2013. The implementation of this guidance did not have a significant effect on the Company’s financial position, results of operations, or cash flows. See Note 14.
In July 2013, the FASB issued ASU 2013-11, Income Taxes: Presentation of an Unrecognized Tax Benefit When a Net Operating Loss Carryforward, a Similar Tax Loss, or a Tax Credit Carryforward Exists. This ASU provides guidance on the presentation of unrecognized tax benefits, particularly the manner in which an entity would settle, at the reporting date, any additional income taxes that would result from the disallowance of a tax position when net operating loss carryforwards, similar tax losses, or tax credit carryforwards exist. This guidance will become effective for the Company January 1, 2014 and implementation is not expected to have a significant impact on the Company’s financial position, results of operations, or cash flows.
| 2. | Finance Receivables |
Finance receivables held for investment at September 30, 2013 and December 31, 2012, are comprised as follows:
| September 30, 2013 | ||||||||||||||||||||
| Retail Installment Contracts Held for Investment |
Receivables from Dealers Held for Investment |
Unsecured Consumer Loans |
||||||||||||||||||
| Loans Acquired Individually |
Purchased Receivables Portfolios |
Total | ||||||||||||||||||
| Unpaid principal balance |
$ | 20,897,405 | $ | 2,409,538 | $ | 23,306,943 | $ | 178,518 | $ | 715,602 | ||||||||||
| Loan loss allowance (see Note 3) |
(1,987,950 | ) | (270,294 | ) | (2,258,244 | ) | (1,593 | ) | (95,250 | ) | ||||||||||
| Discount |
(527,254 | ) | (136,869 | ) | (664,123 | ) | — | (50,853 | ) | |||||||||||
| Capitalized origination costs and fees |
33,977 | — | 33,977 | — | 282 | |||||||||||||||
|
|
|
|
|
|
|
|
|
|
|
|||||||||||
| Net carrying balance |
$ | 18,416,178 | $ | 2,002,375 | $ | 20,418,553 | $ | 176,925 | $ | 569,781 | ||||||||||
|
|
|
|
|
|
|
|
|
|
|
|||||||||||
| December 31, 2012 | ||||||||||||||||
| Retail Installment Contracts Held for Investment | ||||||||||||||||
| Loans Acquired Individually |
Purchased Receivables Portfolios |
Total | Receivables from Dealers |
|||||||||||||
| Unpaid principal balance |
$ | 14,186,712 | $ | 4,406,891 | $ | 18,593,603 | $ | 61,894 | ||||||||
| Loan loss allowance (see Note 3) |
(1,555,362 | ) | (218,640 | ) | (1,774,002 | ) | — | |||||||||
| Discount |
(348,571 | ) | (293,097 | ) | (641,668 | ) | — | |||||||||
| Capitalized origination costs |
25,993 | — | 25,993 | — | ||||||||||||
|
|
|
|
|
|
|
|
|
|||||||||
| Net carrying balance |
$ | 12,308,772 | $ | 3,895,154 | $ | 16,203,926 | $ | 61,894 | ||||||||
|
|
|
|
|
|
|
|
|
|||||||||
Retail installment contracts held for sale totaled $52,744 as of September 30, 2013. Sales of retail installment contracts for the nine months ended September 30, 2013 included principal balance amounts of approximately $897,160. Receivables from dealers held for sale totaled $20,681 as of September 30, 2013. Sales of receivables from dealers for the nine months ended September 30, 2013 included principal balance amounts of approximately $204,782.
F-10
Table of Contents
Retail installment contracts are collateralized by vehicle titles, and the Company has the right to repossess the vehicle in the event the consumer defaults on the payment terms of the contract. Most of the Company’s retail installment contracts held for investment are pledged against warehouse facilities or securitization bonds.
Borrowers on the Company’s retail installment contracts held for investment are located in Texas (17%), Florida (10%), California (8%), Georgia (5%), North Carolina (5%), and other states each individually representing less than 5% of the Company’s total.
Receivables from dealers held for investment includes a $100,000 residual warehouse credit facility and a $44,974 revolving floorplan inventory credit facility with a third-party vehicle dealer and lender that operates in multiple states. Borrowers on the Company’s remaining receivables from dealers held for investment, all of which are Chrysler-affiliated, are located in Texas (49%), Tennessee (22%), New York (17%), and California (12%).
Borrowers on the Company’s unsecured consumer loans are located in California (9%), New York (8%), Texas (8%), Florida (6%), Pennsylvania (5%), and other states each individually representing less than 5% of the Company’s total.
Changes in accretable yield on the Company’s purchased receivables portfolios for the periods indicated were as follows:
| Three Months Ended | Nine Months Ended | |||||||||||||||
| September 30, 2013 | September 30, 2012 | September 30, 2013 | September 30, 2012 | |||||||||||||
| Balance at beginning of period |
$ | 535,656 | $ | 990,709 | $ | 816,854 | $ | 1,373,174 | ||||||||
| Additions (loans acquired during the year) |
— | 16,338 | — | 16,338 | ||||||||||||
| Accretion of accretable yield |
(174,201 | ) | (160,201 | ) | (421,913 | ) | (544,068 | ) | ||||||||
| Transfers from (to) nonaccretable discount |
73,560 | 27,171 | 40,074 | 28,573 | ||||||||||||
|
|
|
|
|
|
|
|
|
|||||||||
| Balance at end of period |
$ | 435,015 | $ | 874,017 | $ | 435,015 | $ | 874,017 | ||||||||
|
|
|
|
|
|
|
|
|
|||||||||
Interest receivable on purchased receivables portfolios totaled $20,292 and $39,955 at September 30, 2013 and December 31, 2012, respectively.
F-11
Table of Contents
| 3. | Loan Loss Allowance and Credit Quality |
Loan Loss Allowance
The Company estimates loan losses on individually acquired retail installment contracts held for investment and unsecured consumer loans based on delinquency status, historical loss experience, estimated values of underlying collateral, when applicable, and various economic factors. The Company maintains a general loan loss allowance for receivables from dealers based on risk ratings, and individually evaluates the loans for specific impairment. The activity in the loan loss allowance for the periods ended September 30, 2013 and 2012 were as follows:
| Three Months Ended September 30, | Nine Months Ended September 30, | |||||||||||||||||||||||||||||||||||||||||||||||
| 2013 | 2012 | 2013 | 2012 | |||||||||||||||||||||||||||||||||||||||||||||
| Loans Acquired Individually |
Receiv- ables from Dealers (a) |
Unsecured Consumer Loans |
Loans Acquired Individually |
Receiv- ables from Dealers |
Unsecured Consumer Loans |
Loans Acquired Individually |
Receiv- ables from Dealers (a) |
Unsecured Consumer Loans |
Loans Acquired Individually |
Receiv- ables from Dealers |
Unsecured Consumer Loans |
|||||||||||||||||||||||||||||||||||||
| Balance — beginning of period |
$ | 1,864,313 | $ | 1,490 | $ | 39,250 | $ | 1,233,062 | $ | — | $ | — | $ | 1,555,362 | $ | — | $ | — | $ | 993,213 | $ | — | $ | — | ||||||||||||||||||||||||
| Provision for loan losses |
447,565 | 103 | 56,815 | 243,698 | — | — | 1,074,487 | 1,593 | 96,071 | 683,000 | — | — | ||||||||||||||||||||||||||||||||||||
| Charge-offs |
(584,815 | ) | — | (815 | ) | (262,989 | ) | — | — | (1,338,936 | ) | — | (821 | ) | (624,961 | ) | — | — | ||||||||||||||||||||||||||||||
| Recoveries on charged-off accounts |
260,887 | — | — | 103,291 | — | — | 697,037 | — | — | 265,810 | — | — | ||||||||||||||||||||||||||||||||||||
|
|
|
|
|
|
|
|
|
|
|
|
|
|
|
|
|
|
|
|
|
|
|
|
|
|||||||||||||||||||||||||
| Balance — end of period |
$ | 1,987,950 | $ | 1,593 | $ | 95,250 | $ | 1,317,062 | $ | — | $ | — | $ | 1,987,950 | $ | 1,593 | $ | 95,250 | $ | 1,317,062 | $ | — | $ | — | ||||||||||||||||||||||||
|
|
|
|
|
|
|
|
|
|
|
|
|
|
|
|
|
|
|
|
|
|
|
|
|
|||||||||||||||||||||||||
| (a) | The loan loss allowance for receivables from dealers is comprised entirely of general reserves as none of these receivables have been determined to be individually impaired. |
The activity in the loan loss allowance related to purchased receivables portfolios for the periods ended September 30, 2013 and 2012 was as follows:
| Three Months Ended September 30, |
Nine Months Ended September 30, |
|||||||||||||||
| 2013 | 2012 | 2013 | 2012 | |||||||||||||
| Allowance related to purchased receivable portfolios, beginning of period |
$ | 176,576 | $ | 250,287 | $ | 218,640 | $ | 215,262 | ||||||||
| Incremental provisions for purchased receivable portfolios |
245,987 | 43,630 | 285,963 | 125,500 | ||||||||||||
| Incremental reversal of provisions for purchased receivable portfolios |
(152,269 | ) | (101,453 | ) | (234,309 | ) | (148,298 | ) | ||||||||
|
|
|
|
|
|
|
|
|
|||||||||
| Allowance related to purchased receivable portfolios, end of period |
$ | 270,294 | $ | 192,464 | $ | 270,294 | $ | 192,464 | ||||||||
|
|
|
|
|
|
|
|
|
|||||||||
F-12
Table of Contents
Delinquencies
The accrual of interest income is suspended on retail installment contracts and term amortizing unsecured consumer loans that are more than 60 days past due, and prior accrued interest receivable is reversed. When an account is returned to a performing status of 60 days or less past due, the Company returns to accruing interest on the contract. The accrual of interest on receivables from dealers and revolving unsecured consumer loans continues until the loan is charged off. A summary of delinquencies as of September 30, 2013 and December 31, 2012 is as follows:
| September 30, 2013 | ||||||||||||||||||||
| Retail Installment Contracts Held for Investment | Receivables from Dealers Held for Investment |
Unsecured Consumer Loans |
||||||||||||||||||
| Loans Acquired Individually |
Purchased Receivables Portfolios |
Total | ||||||||||||||||||
| Principal, current |
$ | 18,630,255 | $ | 1,832,077 | $ | 20,462,332 | $ | 178,518 | $ | 672,657 | ||||||||||
| Principal, 31- 60 days past due |
1,523,848 | 374,997 | 1,898,845 | — | 18,825 | |||||||||||||||
| Delinquent principal over 60 days |
743,302 | 202,464 | 945,766 | — | 24,120 | |||||||||||||||
|
|
|
|
|
|
|
|
|
|
|
|||||||||||
| Total principal |
$ | 20,897,405 | $ | 2,409,538 | $ | 23,306,943 | $ | 178,518 | $ | 715,602 | ||||||||||
|
|
|
|
|
|
|
|
|
|
|
|||||||||||
| December 31, 2012 | ||||||||||||||||
| Retail Installment Contracts Held for Investment | Receivables from Dealers Held for Investment |
|||||||||||||||
| Loans Acquired Individually |
Purchased Receivables Portfolios |
Total | ||||||||||||||
| Principal, current |
$ | 12,512,411 | $ | 3,390,320 | $ | 15,902,731 | $ | 61,894 | ||||||||
| Principal, 31 - 60 days past due |
1,151,099 | 673,856 | 1,824,955 | — | ||||||||||||
| Delinquent principal over 60 days |
523,202 | 342,715 | 865,917 | — | ||||||||||||
|
|
|
|
|
|
|
|
|
|||||||||
| Total principal |
$ | 14,186,712 | $ | 4,406,891 | $ | 18,593,603 | $ | 61,894 | ||||||||
|
|
|
|
|
|
|
|
|
|||||||||
None of the Company’s receivables held for sale were delinquent as of September 30, 2013.
FICO® Distribution — A summary of the credit risk profile of the Company’s consumer loans by Fair Isaac Corporation (FICO®) distribution, determined at origination, as of September 30, 2013 and December 31, 2012 was as follows:
| September 30, 2013 |
December 31, 2012 | |||||||||||||
| FICO Band |
Retail Installment Contracts Held for Investment |
Unsecured Consumer Loans |
FICO Band | Retail Installment Contracts Held for Investment |
||||||||||
| <540 |
25.3 | % | 2.8 | % | <540 | 23.4 | % | |||||||
| 540-599 |
30.7 | % | 27.3 | % | 540-599 | 33.0 | % | |||||||
| 600-659 |
26.7 | % | 43.1 | % | 600-659 | 29.1 | % | |||||||
| >660 |
17.3 | % | 26.8 | % | >660 | 14.4 | % | |||||||
Commercial Lending Credit Quality Indicators — The credit quality of our receivables from dealers, which are considered commercial loans, is summarized according to standard regulatory classifications as follows:
Pass — Asset is well protected by the current net worth and paying capacity of the obligor or guarantors, if any, or by the fair value less costs to acquire and sell any underlying collateral in a timely manner.
Special Mention — Asset has potential weaknesses that deserve management’s close attention, which, if left uncorrected, may result in deterioration of the repayment prospects for an asset at some future date. Special Mention assets are not adversely classified.
F-13
Table of Contents
Substandard — Asset is inadequately protected by the current net worth and paying capacity of the obligor or by the collateral pledged, if any. A well-defined weakness or weaknesses exist that jeopardize the liquidation of the debt. The loans are characterized by the distinct possibility that the Company will sustain some loss if deficiencies are not corrected.
Doubtful — Exhibits the inherent weaknesses of a substandard credit. Additional characteristics exist that make collection or liquidation in full highly questionable and improbable, on the basis of currently known facts, conditions and values. Possibility of loss is extremely high, but because of certain important and reasonable specific pending factors which may work to the advantage and strengthening of the credit, an estimated loss cannot yet be determined.
Loss — Credit is considered uncollectible and of such little value that it does not warrant consideration as an active asset. There may be some recovery or salvage value, but there is doubt as to whether, how much or when the recovery would occur.
Commercial loan credit quality indicators for receivables from dealers held for investment as of September 30, 2013 and December 31, 2012 were as follows:
| September 30, 2013 | December 31, 2012 | |||||||
| Pass |
$ | 178,518 | $ | 61,894 | ||||
| Special Mention |
— | — | ||||||
| Substandard |
— | — | ||||||
| Doubtful |
— | — | ||||||
|
|
|
|
|
|||||
| $ | 178,518 | $ | 61,894 | |||||
|
|
|
|
|
|||||
Troubled Debt Restructurings
The Company periodically agrees to grant to borrowers on retail installment contracts a modification involving one or a combination of the following: a reduction in interest rate, a reduction in loan principal balance, an extension of the maturity date or a deferral of a contractual payment to the end of the loan. A change to a loan’s payment terms is considered to be a troubled debt restructuring (TDR) if the concession was granted to the borrower for economic or legal reasons related to the debtor’s financial difficulties and would not otherwise have been considered. Management considers TDRs to include all individually acquired retail installment contracts that have been modified at least once or deferred at least twice or for a period of 90 days or more. Additionally, management believes that all releases of liability in a bankruptcy proceeding represent TDRs. Our purchased receivables portfolio is excluded from the scope of the applicable guidance.
Borrowers on the Company’s unsecured consumer loans may be granted concessions in the form of principal or interest rate reductions or payment plans. Receivables from dealers may also be granted concessions in certain circumstances. As of September 30, 2013 and December 31, 2012, none of the Company’s receivables from dealers were classified as TDRs.
A summary of the Company’s TDRs at September 30, 2013 and December 31, 2012 is as follows:
| September 30, 2013 | December 31, 2012 | |||||||||||
| Retail Installment Contracts |
Unsecured Consumer Loans |
Retail Installment Contracts |
||||||||||
| Total TDR principal |
$ | 2,371,581 | $ | 4,136 | $ | 1,483,080 | ||||||
| Accrued interest |
64,289 | 387 | 43,813 | |||||||||
| Discount |
(59,836 | ) | (375 | ) | (36,440 | ) | ||||||
| Origination costs |
3,856 | 2 | 2,717 | |||||||||
|
|
|
|
|
|
|
|||||||
| Outstanding recorded investment |
2,379,890 | 4,150 | 1,493,170 | |||||||||
| Allowance for loan losses |
(469,311 | ) | (1,396 | ) | (251,187 | ) | ||||||
|
|
|
|
|
|
|
|||||||
| Outstanding recorded investment, net of allowance |
$ | 1,910,579 | $ | 2,754 | $ | 1,241,983 | ||||||
|
|
|
|
|
|
|
|||||||
F-14
Table of Contents
A summary of the Company’s performing and nonperforming TDRs at September 30, 2013 and December 31, 2012, is as follows:
| September 30, 2013 | December 31, 2012 | |||||||||||
| Retail Installment Contracts |
Unsecured Consumer Loans |
Retail Installment Contracts |
||||||||||
| Current |
$ | 1,554,056 | $ | 3,343 | $ | 860,385 | ||||||
| 31 - 60 days past due |
499,206 | 345 | 383,255 | |||||||||
| Greater than 60 days past due (non-performing) |
318,319 | 448 | 239,440 | |||||||||
|
|
|
|
|
|
|
|||||||
| Total TDR principal |
$ | 2,371,581 | $ | 4,136 | $ | 1,483,080 | ||||||
|
|
|
|
|
|
|
|||||||
A loan that has been classified as a TDR remains so until the loan is liquidated through payoff or charge-off. Consistent with other of the Company’s retail installment contracts, TDRs are placed on nonaccrual status when the account becomes past due more than 60 days, and return to accrual status when the account is 60 days or less past due. Average recorded investment and income recognized on TDR loans are as follows:
| Three Months Ended | ||||||||||||
| September 30, 2013 | September 30, 2012 | |||||||||||
| Retail Installment Contracts |
Unsecured Consumer Loans |
Retail Installment Contracts |
||||||||||
| Average outstanding recorded investment in TDRs |
$ | 2,076,345 | $ | 2,323 | $ | 1,295,192 | ||||||
| Interest income recognized |
88,034 | 24 | 54,211 | |||||||||
| Nine Months Ended | ||||||||||||
| September 30, 2013 | September 30, 2012 | |||||||||||
| Retail Installment Contracts |
Unsecured Consumer Loans |
Retail Installment Contracts |
||||||||||
| Average outstanding recorded investment in TDRs |
$ | 1,816,378 | $ | 1,549 | $ | 1,205,205 | ||||||
| Interest income recognized |
218,435 | 25 | 137,850 | |||||||||
TDR Impact on Allowance for Loan Losses
Prior to a loan being classified as a TDR, the Company generally estimates an appropriate allowance for loan loss based on delinquency status, the Company’s historical loss experience, estimated values of underlying collateral, and various economic factors. Once a loan has been classified as a TDR, impairment is measured based on present value of expected future cash flows considering all available evidence, including collateral values.
Selected information for loans that were newly classified as TDRs is as follows:
| Three Months Ended | ||||||||||||
| September 30, 2013 | September 30, 2012 | |||||||||||
| Retail Installment Contracts |
Unsecured Consumer Loans |
Retail Installment Contracts |
||||||||||
| Troubled Debt Restructurings: |
||||||||||||
| Outstanding recorded investment before TDR |
$ | 615,097 | $ | 4,034 | $ | 293,425 | ||||||
| Outstanding recorded investment after TDR |
585,830 | 4,020 | 287,959 | |||||||||
| Number of contracts |
39,598 | 5,950 | 20,482 | |||||||||
F-15
Table of Contents
| Nine Months Ended | ||||||||||||
| September 30, 2013 | September 30, 2012 | |||||||||||
| Retail Installment Contracts |
Unsecured Consumer Loans |
Retail Installment Contracts |
||||||||||
| Troubled Debt Restructurings: |
||||||||||||
| Outstanding recorded investment before TDR |
$ | 1,379,733 | $ | 4,184 | $ | 721,700 | ||||||
| Outstanding recorded investment after TDR |
1,319,642 | 4,169 | 708,265 | |||||||||
| Number of contracts |
89,869 | 6,093 | 51,270 | |||||||||
Loans that were newly classified as TDRs for the twelve months ended September 30, 2013 and 2012, which have defaulted during the three and nine months ended September 30, 2013 and 2012, are as follows:
| Three Months Ended | ||||||||||||
| September 30, 2013 | September 30, 2012 | |||||||||||
| Retail Installment Contracts |
Unsecured Consumer Loans |
Retail Installment Contracts |
||||||||||
| Troubled debt restructurings that subsequently defaulted |
$ | 341,718 | $ | — | $ | 253,989 | ||||||
| Number of contracts |
24,952 | — | 19,138 | |||||||||
| Nine Months Ended | ||||||||||||
| September 30, 2013 | September 30, 2012 | |||||||||||
| Retail Installment Contracts |
Unsecured Consumer Loans |
Retail Installment Contracts |
||||||||||
| Troubled debt restructurings that subsequently defaulted |
$ | 371,048 | $ | — | $ | 304,699 | ||||||
| Number of contracts |
27,105 | — | $ | 23,203 | ||||||||
TDRs that have subsequently defaulted but are currently active are written down to estimated collateral value less cost to sell. As of September 30, 2013, the principal writedown on active TDRs totaled approximately $41,862.
| 4. | Leased Vehicles, net |
Leased vehicles consisted of the following as of September 30, 2013:
| Leased vehicles |
$ | 1,412,362 | ||
| Origination fees and other costs |
1,394 | |||
| Manufacturer subvention payments |
(143,338 | ) | ||
|
|
|
|||
| 1,270,418 | ||||
| Depreciation |
(48,469 | ) | ||
|
|
|
|||
| $ | 1,221,949 | |||
|
|
|
Minimum rental payments due to the Company as the lessor under operating leases as of September 30, 2013, are as follows:
| 2013 |
$ | 51,571 | ||
| 2014 |
206,283 | |||
| 2015 |
183,695 | |||
| 2016 |
98,176 | |||
| 2017 |
281 | |||
| 2018 |
24 | |||
|
|
|
|||
| Total |
$ | 540,030 | ||
|
|
|
F-16
Table of Contents
| 5. | Debt |
The following table presents information regarding credit facilities as of September 30, 2013:
| Maturity Date(s) | Utilized Balance |
Committed Amount |
Effective Rate |
Assets Pledged |
Restricted Cash Pledged |
|||||||||||||||||
| Warehouse line |
June 2014 | $ | 252,138 | $ | 500,000 | 1.07 | % | $ | 382,864 | $ | — | |||||||||||
| Warehouse line |
Various (a) | — | 1,210,260 | 3.77 | % | — | — | |||||||||||||||
| Warehouse line (b) |
April 2015 | 1,059,700 | 4,550,000 | 1.48 | % | 1,217,403 | 26,713 | |||||||||||||||
| Warehouse line |
June 2015 | 1,541,570 | 2,000,000 | 0.93 | % | 1,895,659 | 39,674 | |||||||||||||||
| Warehouse line |
July 2015 | 302,486 | 500,000 | 0.94 | % | 371,892 | 8,223 | |||||||||||||||
| Warehouse line (c) |
September 2015 | 57,800 | 200,000 | 3.25 | % | 66,418 | 240 | |||||||||||||||
| Repurchase facility (d) |
Various (c) | 898,832 | 898,832 | 1.62 | % | — | — | |||||||||||||||
|
|
|
|
|
|
|
|
|
|||||||||||||||
| Total facilities with third parties |
4,112,526 | 9,859,092 | 3,934,236 | 74,850 | ||||||||||||||||||
|
|
|
|
|
|
|
|
|
|||||||||||||||
| Lines of credit with Santander and related subsidiaries (e): |
||||||||||||||||||||||
| Line of credit (f) |
December 2015 | 500,000 | 500,000 | 2.48 | % | 16,299 | — | |||||||||||||||
| Line of credit (f) |
December 2017 | — | 500,000 | 3.10 | % | — | — | |||||||||||||||
| Line of credit |
December 2015 | 1,750,000 | 1,750,000 | 2.05 | % | 1,570 | — | |||||||||||||||
| Line of credit |
December 2017 | 1,045,000 | 1,750,000 | 2.55 | % | 124,608 | — | |||||||||||||||
|
|
|
|
|
|
|
|
|
|||||||||||||||
| Total facilities with Santander and related subsidiaries |
3,295,000 | 4,500,000 | 142,477 | — | ||||||||||||||||||
|
|
|
|
|
|
|
|
|
|||||||||||||||
| Total revolving credit facilities |
$ | 7,407,526 | $ | 14,359,092 | $ | 4,076,713 | $ | 74,850 | ||||||||||||||
|
|
|
|
|
|
|
|
|
|||||||||||||||
| (a) | One-fourth of any outstanding balance on this facility would mature in each of the following months: March 2014, November 2014, March 2015, and November 2015. |
| (b) | This line is held exclusively for Chrysler Capital retail loan and lease financing, with lease financing comprising no more than 50% of the outstanding balance upon advance. |
| (c) | This line is held exclusively for unsecured consumer term loans. |
| (d) | The repurchase facility is collateralized by securitization bonds and residuals retained by the Company. No portion of this facility is unsecured. This facility has rolling 30-day and 90-day maturities. |
| (e) | As of September 30, 2013, $754,927 of the outstanding balances on credit facilities were unsecured. |
| (f) | These lines are also collateralized by securitization notes payable and residuals retained by the Company. |
Facilities with Third Parties
The warehouse lines and repurchase facility are fully collateralized by a designated portion of the Company’s retail installment contracts (Note 2) and leased vehicles (Note 4) and securitization residuals and notes payable retained by the Company. The Company was in compliance with all covenants related to these financing arrangements at September 30, 2013.
Lines of Credit with Santander and Related Subsidiaries
Through its New York Branch, Santander provides the Company with $4.5 billion of long-term committed revolving credit facilities. These facilities are structured as three- and five-year floating rate facilities, with current maturity dates of December 31, 2015 and 2017. Santander has the option to allow the Company to continue to renew the term of these facilities annually going forward, thereby maintaining the three and five year maturities. These facilities currently permit unsecured borrowing but generally are collateralized by retail installment contracts and retained residuals. Any secured balances outstanding at the time of the facilities’ maturity will amortize to match the maturities and expected cash flows of the corresponding collateral.
F-17
Table of Contents
The following table presents information regarding secured structured financings as of September 30, 2013:
| Original Estimated Maturity Date(s) |
Balance | Initial Note Amounts Issued |
Initial Weighted Average Interest Rate |
Collateral | Restricted Cash |
|||||||||||||||
| 2010 Securitizations |
October 2016 — November 2017 | $ | 771,599 | $ | 4,671,749 | 1.04% — 1.44% | $ | 1,361,897 | $ | 213,458 | ||||||||||
| 2011 Securitizations |
October 2015 — September 2017 | 1,477,673 | 5,605,609 | 1.21% — 2.80% | 1,628,140 | 188,297 | ||||||||||||||
| 2012 Securitizations |
November 2017 — December 2018 | 4,623,776 | 8,023,840 | 0.92% — 1.68% | 5,656,807 | 402,113 | ||||||||||||||
| 2013 Securitizations |
January 2019 — January 2021 | 4,532,017 | 5,228,770 | 0.89% — 1.59% | 5,270,014 | 270,475 | ||||||||||||||
|
|
|
|
|
|
|
|
|
|||||||||||||
| Public securitizations |
11,405,065 | 23,529,968 | 13,916,858 | 1,074,343 | ||||||||||||||||
|
|
|
|
|
|
|
|
|
|||||||||||||
| 2010 Private issuance |
June 2011 | 240,385 | 516,000 | 1.29% | 397,553 | 9,141 | ||||||||||||||
| 2011 Private issuances |
December 2018 | 987,297 | 4,856,525 | 1.46% — 1.80% | 1,697,858 | 122,767 | ||||||||||||||
| 2012 Private issuance |
May 2016 | 39,740 | 70,308 | 1.07% | 46,047 | 3,635 | ||||||||||||||
| 2013 Private issuances |
September 2018 — September 2020 | 2,603,384 | 2,693,754 | 1.13% — 1.38% | 2,547,754 | 69,925 | ||||||||||||||
|
|
|
|
|
|
|
|
|
|||||||||||||
| Privately issued amortizing notes |
3,870,806 | 8,136,587 | 4,689,212 | 205,468 | ||||||||||||||||
|
|
|
|
|
|
|
|
|
|||||||||||||
| Total secured structured financings |
$ | 15,275,871 | $ | 31,666,555 | $ | 18,606,070 | $ | 1,279,811 | ||||||||||||
|
|
|
|
|
|
|
|
|
|||||||||||||
Notes Payable — Secured Structured Financings
The principal and interest on secured structured financings are paid using the cash flows from the underlying retail installment contracts, which serve as collateral for the notes. Accordingly, the timing of the principal payments on these notes is dependent on the payments received on the underlying retail installment contracts, which back the notes.
Most of the Company’s secured structured financings are in the form of public, SEC-registered securitizations. The Company also executes private securitizations under Rule 144A of the Securities Act and periodically issues private term amortizing notes, which are structured similarly to securitizations but are acquired by banks and conduits. Historically, all of the Company’s securitizations and private issuances have been collateralized by vehicle retail installment contracts and loans; however, in August 2013, the Company issued its first amortizing notes backed by vehicle leases, in a private issuance of $507 million of notes.
Unamortized debt issuance costs are amortized as interest expense over the terms of the related notes payable using a method that approximates the interest method. Amortization of premium or accretion of discount on acquired notes payable is also included in interest expense using a method that approximates the interest method, over the estimated remaining life of the acquired notes. Total interest expense on secured structured financings for the three months ended September 30, 2013 and 2012 was $58,444 and $67,028, respectively. Total interest expense on secured structured financings for the nine months ended September 30, 2013 and 2012 was $172,780 and $182,786, respectively.
| 6. | Securitization Activity |
As of September 30, 2013, all of the Company’s outstanding securitization transactions were structured so that they did not meet the criteria for sales of retail installment contracts. Accordingly, in connection with each securitization, the retail installment contracts were transferred to special-purpose finance subsidiaries of SCUSA and the related securitization debt issued by the special-purpose finance subsidiaries remained on the Company’s consolidated balance sheets. While these subsidiaries are included in the Company’s consolidated financial statements, they are separate legal entities and the retail installment contracts and other assets held are legally owned by them. The securitized retail installment contracts are available to satisfy the related securitization debt and are not available to creditors of SCUSA or its other subsidiaries.
The Company recognizes finance charges and fee income on the retail installment contracts and interest expense on the debt issued in the securitization transactions, and records a provision for loan losses to cover
F-18
Table of Contents
probable future losses on the contracts. A summary of the cash flows received from securitization trusts during the three and nine months ended September 30, 2013 and 2012, is as follows:
| Three Months Ended | Nine Months Ended | |||||||||||||||
| September 30, 2013 |
September 30, 2012 |
September 30, 2013 |
September 30, 2012 |
|||||||||||||
| Receivables securitized |
$ | 1,853,327 | $ | 2,740,725 | $ | 5,974,694 | $ | 6,711,677 | ||||||||
| Gross proceeds from new securitizations |
$ | 1,642,310 | $ | 2,425,540 | $ | 5,228,770 | $ | 5,823,840 | ||||||||
| Cash received for servicing fees |
111,204 | 90,130 | 320,640 | 240,767 | ||||||||||||
| Cash received upon release from reserve and restricted cash accounts |
2,160 | 4,736 | 8,385 | 16,426 | ||||||||||||
|
|
|
|
|
|
|
|
|
|||||||||
| Total cash received from securitization trusts |
$ | 1,755,674 | $ | 2,520,406 | $ | 5,557,795 | $ | 6,081,033 | ||||||||
|
|
|
|
|
|
|
|
|
|||||||||
The Company retains servicing responsibility for receivables transferred to the Trusts. Included in servicing fee income is a monthly servicing fee on the outstanding principal balance. Supplemental fees, such as late charges, for servicing the receivables are reflected in fees, commissions and other income. As of September 30, 2013 and December 31, 2012, the Company was servicing $13,916,858 and $15,876,333, respectively, of gross retail installment contracts that have been transferred to the Trusts. The remainder of the Company’s retail installment contracts is either pledged in private issuances or warehouse facilities or unpledged.
| 7. | Derivative Financial Instruments |
Certain of the Company’s interest rate swap agreements are designated as hedges for accounting purposes. The Company’s remaining interest rate swap agreements, as well as its interest rate cap agreements and the corresponding options written in order to offset the interest rate cap agreements, are not designated as hedges for accounting purposes. The underlying notional amounts and aggregate fair values of these agreements at September 30, 2013 and December 31, 2012, were as follows:
| September 30, 2013 | December 31, 2012 | |||||||||||||||
| Notional | Fair Value Asset/(Liability) |
Notional | Fair Value Asset/(Liability) |
|||||||||||||
| Interest rate swap agreements designated as hedges |
$ | 2,280,000 | $ | (11,341 | ) | $ | 2,321,085 | $ | (20,759 | ) | ||||||
| Interest rate swap agreements not designated as hedges |
3,724,475 | (36,236 | ) | 2,712,711 | (52,546 | ) | ||||||||||
| Interest rate cap agreements |
4,373,024 | 26,125 | 1,169,707 | (49 | ) | |||||||||||
| Options for interest rate cap agreements |
4,373,024 | (26,251 | ) | 1,169,707 | 49 | |||||||||||
The aggregate fair value of the interest rate swap agreements was included in other liabilities on the Company’s consolidated balance sheets. The interest rate cap agreements and related options were included in other assets and other liabilities, as appropriate, on the Company’s consolidated balance sheets.
F-19
Table of Contents
Information on the offsetting of derivative assets and derivative liabilities due to the right of offset is as follows, as of September 30, 2013 and December 31, 2012:
| Offsetting of Financial Assets | ||||||||||||||||||||||||
| Gross Amounts Not Offset in the Consolidated Balance Sheet |
||||||||||||||||||||||||
| Gross Amounts of Recognized Assets |
Gross Amounts Offset in the Consolidated Balance Sheet |
Net Amounts of Assets Presented in the Consolidated Balance Sheet |
Financial Instruments |
Cash Collateral Received |
Net Amount |
|||||||||||||||||||
| September 30, 2013 |
||||||||||||||||||||||||
| Interest rate caps — Santander & affiliates |
$ | 8,636 | $ | — | $ | 8,636 | $ | — | $ | — | $ | 8,636 | ||||||||||||
| Interest rate caps — third party |
17,489 | — | 17,489 | — | — | 17,489 | ||||||||||||||||||
|
|
|
|
|
|
|
|
|
|
|
|
|
|||||||||||||
| Total derivatives subject to a master netting arrangement or similar arrangement |
26,125 | — | 26,125 | — | — | 26,125 | ||||||||||||||||||
| Total derivatives not subject to a master netting arrangement or similar arrangement |
— | — | — | — | — | — | ||||||||||||||||||
|
|
|
|
|
|
|
|
|
|
|
|
|
|||||||||||||
| Total Derivative Assets |
$ | 26,125 | $ | — | $ | 26,125 | $ | — | $ | — | $ | 26,125 | ||||||||||||
|
|
|
|
|
|
|
|
|
|
|
|
|
|||||||||||||
| Total Financial Assets |
$ | 26,125 | $ | — | $ | 26,125 | $ | — | $ | — | $ | 26,125 | ||||||||||||
|
|
|
|
|
|
|
|
|
|
|
|
|
|||||||||||||
| Offsetting of Financial Liabilities | ||||||||||||||||||||||||
| Gross Amounts Not Offset in the Consolidated Balance Sheet |
||||||||||||||||||||||||
| Gross Amounts of Recognized Liabilities |
Gross Amounts Offset in the Consolidated Balance Sheet |
Net Amounts of Liabilities Presented in the Consolidated Balance Sheet |
Financial Instruments |
Cash Collateral Received |
Net Amount |
|||||||||||||||||||
| September 30, 2013 |
||||||||||||||||||||||||
| Interest rate swaps — Santander & affiliates |
$ | 47,578 | $ | (5,577 | ) | $ | 42,001 | $ | — | $ | — | $ | 42,001 | |||||||||||
| Back to back — Santander & affiliates |
8,636 | (8,097 | ) | 539 | — | — | 539 | |||||||||||||||||
| Back to back — third party |
17,615 | (17,615 | ) | — | — | 435 | (435 | ) | ||||||||||||||||
|
|
|
|
|
|
|
|
|
|
|
|
|
|||||||||||||
| Total derivatives subject to a master netting arrangement or similar arrangement |
73,829 | (31,289 | ) | 42,540 | — | 435 | 42,105 | |||||||||||||||||
| Total derivatives not subject to a master netting arrangement or similar arrangement |
— | — | — | — | — | — | ||||||||||||||||||
|
|
|
|
|
|
|
|
|
|
|
|
|
|||||||||||||
| Total Derivative Liabilities |
$ | 73,829 | $ | (31,289 | ) | $ | 42,540 | $ | — | $ | 435 | $ | 42,105 | |||||||||||
|
|
|
|
|
|
|
|
|
|
|
|
|
|||||||||||||
| Total Financial Liabilities |
$ | 73,829 | $ | (31,289 | ) | $ | 42,540 | $ | — | $ | 435 | $ | 42,105 | |||||||||||
|
|
|
|
|
|
|
|
|
|
|
|
|
|||||||||||||
F-20
Table of Contents
| Offsetting of Financial Liabilities | ||||||||||||||||||||||||
| Gross Amounts Not Offset in the Consolidated Balance Sheet |
||||||||||||||||||||||||
| Gross Amounts of Recognized Liabilities |
Gross Amounts Offset in the Consolidated Balance Sheet |
Net Amounts of Liabilities Presented in the Consolidated Balance Sheet |
Financial Instruments |
Cash Collateral Received |
Net Amount |
|||||||||||||||||||
| December 31, 2012 |
||||||||||||||||||||||||
| Interest rate swaps — Santander & affiliates |
$ | 71,684 | $ | — | $ | 71,684 | $ | — | $ | — | $ | 71,684 | ||||||||||||
| Interest rate swaps — third party |
1,621 | — | 1,621 | — | — | 1,621 | ||||||||||||||||||
| Interest rate caps — Santander & affiliates |
49 | (49 | ) | — | — | — | — | |||||||||||||||||
|
|
|
|
|
|
|
|
|
|
|
|
|
|||||||||||||
| Total derivatives subject to a master netting arrangement or similar arrangement |
73,354 | (49 | ) | 73,305 | — | — | 73,305 | |||||||||||||||||
| Total derivatives not subject to a master netting arrangement or similar arrangement |
— | — | — | — | — | — | ||||||||||||||||||
|
|
|
|
|
|
|
|
|
|
|
|
|
|||||||||||||
| Total Derivative Liabilities |
$ | 73,354 | $ | (49 | ) | $ | 73,305 | $ | — | $ | — | $ | 73,305 | |||||||||||
|
|
|
|
|
|
|
|
|
|
|
|
|
|||||||||||||
| Total Financial Liabilities |
$ | 73,354 | $ | (49 | ) | $ | 73,305 | $ | — | $ | $ | 73,305 | ||||||||||||
|
|
|
|
|
|
|
|
|
|
|
|
|
|||||||||||||
The Company is the holder of a warrant that gives it the right, if certain vesting conditions are satisfied, to purchase additional shares in a company in which it has a cost method investment. This warrant was issued in 2012 and is carried at its estimated fair value of zero at September 30, 2013.
Gross gains (losses) reclassified from accumulated other comprehensive income to income, and gross gains (losses) recognized in income, are included as components of interest expense. The Company’s interest rate swap agreements had effects on its consolidated statements of income and comprehensive income for the three and nine months ended September 30, 2013 and 2012 as follows:
| Three Months Ended September 30, 2013 |
Nine Months Ended September 30, 2013 |
|||||||||||||||||||||||
| Gross Gains (Losses) Recognized in Interest Expense |
Gross Gains (Losses) Recognized in Accumulated Other Comprehensive Income |
Gross
Gains (Losses) Reclassified From Accumulated Other Comprehensive Income to Interest Expense |
Gross Gains (Losses) Recognized in Interest Expense |
Gross Gains (Losses) Recognized in Accumulated Other Comprehensive Income |
Gross
Gains (Losses) Reclassified From Accumulated Other Comprehensive Income to Interest Expense |
|||||||||||||||||||
| Interest rate swap agreements designated as hedges |
$ | — | $ | (3,577 | ) | $ | (5,342 | ) | $ | — | $ | (5,237 | ) | $ | (14,781 | ) | ||||||||
|
|
|
|
|
|
|
|
|
|
|
|
|
|||||||||||||
| Interest rate swap agreements not designated as hedges |
$ | (978 | ) | $ | 16,361 | |||||||||||||||||||
|
|
|
|
|
|||||||||||||||||||||
F-21
Table of Contents
| September 30, 2012 | September 30, 2012 | |||||||||||||||||||||||
| Gross Gains (Losses) Recognized in Interest Expense |
Gross
Gains (Losses) Recognized in Accumulated Other Comprehensive Income |
Gross
Gains (Losses) Reclassified From Accumulated Other Comprehensive Income to Interest Expense |
Gross Gains (Losses) Recognized in Interest Expense |
Gross
Gains (Losses) Recognized in Accumulated Other Comprehensive Income |
Gross
Gains (Losses) Reclassified From Accumulated Other Comprehensive Income to Interest Expense |
|||||||||||||||||||
| Interest rate swap agreements designated as hedges |
$ | — | $ | (4,132 | ) | $ | (6,284 | ) | $ | — | $ | (14,539 | ) | $ | (20,534 | ) | ||||||||
|
|
|
|
|
|
|
|
|
|
|
|
|
|||||||||||||
| Interest rate swap agreements not designated as hedges |
$ | 610 | $ | (1,249 | ) | |||||||||||||||||||
|
|
|
|
|
|||||||||||||||||||||
The ineffectiveness related to the interest rate swap agreements designated as hedges was not material for the three and nine months ended September 30, 2013 and 2012.
| 8. | Other Assets |
Other assets were comprised as follows:
| September 30, 2013 |
December 31, 2012 |
|||||||
| Upfront fee (a) |
$ | 143,750 | $ | — | ||||
| Inventory of repossessed vehicles (Note 1) |
109,366 | 82,249 | ||||||
| Manufacturer subvention payments receivable (a) |
97,950 | — | ||||||
| Derivative assets (Note 7) |
26,125 | — | ||||||
| Indemnification payments recoverable (b) |
17,776 | 27,825 | ||||||
| Other |
37,848 | 21,745 | ||||||
|
|
|
|
|
|||||
| $ | 432,815 | $ | 131,819 | |||||
|
|
|
|
|
|||||
| (a) | These amounts relate to the Chrysler agreement. The Company paid a $150 million upfront fee at the effective date of the agreement. This fee is being amortized into finance and other interest income over the ten-year term of the agreement. As the preferred financing provider for Chrysler, the Company is entitled to subvention payments on loans and leases with below-market customer payments. |
| (b) | This amount represents tax indemnification payments to the original equity investors in ALA-A and ALA-B (see Note 1) expected to be recovered through tax refunds passed through to the Company as the investors recognize losses related to the investments. Payments made under this indemnification agreement totaled $28,080, all during the year ended December 31, 2012. In July 2013, the Company recovered $9,093 of indemnification payments previously paid. |
| 9. | Income Taxes |
The Company recorded an income tax provision and effective tax rate of $65,486 and 36.9% and $322,413 and 35.7% for the three and nine months ended September 30, 2013, respectively, and $141,261 and 39.9% and $372,266 and 37.8% for the three and nine months ended September 30, 2012, respectively. The effective tax rate varied from the U.S. federal statutory rate for the three and nine months ended September 30, 2013 primarily due to state taxes and partial releases of a valuation allowance for capital loss carryforwards.
F-22
Table of Contents
| 10. | Commitments and Contingencies |
In connection with the sale of retail installment contracts through securitizations, the Company has made standard representations and warranties customary to the consumer finance industry. Violations of these representations and warranties may require the Company to repurchase loans previously sold. As of September 30, 2013, the Company had no repurchase requests outstanding. In the opinion of management, the potential exposure of other recourse obligations related to the Company’s retail installment contract sales agreements will not have a material adverse effect on the Company’s consolidated financial position, results of operations, or cash flows.
The Company has a letter of credit facility with Santander — New York Branch totaling $500,000 at September 30, 2013 and December 31, 2012. The amount issued was zero as of September 30, 2013 and December 31, 2012. The letters of credit can serve as collateral for certain warehouse lines. These commitments will expire on December 31, 2014.
Santander has provided guarantees on the covenants, agreements, and obligations of the Company under the governing documents of our warehouse facilities and privately issued amortizing notes. These guarantees are limited to the obligations of SCUSA as servicer.
The Company has committed to purchase certain new advances of unsecured revolving financings originated by a third party retailer, along with existing balances on accounts with new advances, for an initial term ending in April 2020. The Company also is required to make a profit-sharing payment to the retailer each month. On September 23, 2013, the Company also exercised an option to purchase certain existing balances on accounts without new advances, thereby committing to purchase approximately $90 million of loans on or about September 27, 2013 and approximately $90 million of loans on October 4, 2013.
Under terms of the agreement with Chrysler, the Company must make revenue sharing payments to Chrysler and also must make loss-sharing payments when residual losses on leased vehicles exceed a specified threshold.
The Company is obligated to make purchase price holdback payments to a third party originator of loans that it purchases on a periodic basis, when losses are lower than originally expected.
The Company has a forward flow agreement with Bank of America whereby the Company is committed to sell up to $300,000 of eligible loans to the bank each month through May 31, 2018. The Company retains servicing on all sold loans and will receive or pay a servicer performance payment if yields, net of credit losses, on the loans are higher or lower, respectively, than expected at origination.
The Company has an agreement with Santander Bank N.A. (“SBNA,” formerly Sovereign Bank), a subsidiary of SHUSA, whereby the Company provides SBNA the first right to review and assess Chrysler dealer lending opportunities and, if SBNA elects, to provide the proposed financing. The Company provides servicing on all loans originated under this arrangement. The Company received a $9,000 referral fee in June 2013 in connection with this arrangement and is amortizing the fee into income over the ten-year term of agreement. The Company also will receive or pay a servicer performance payment if yields, net of credit losses, on the loans are higher or lower, respectively, than expected at origination. At the end of each quarter, the Company has the first right to originate loans in an amount equal to the amount of originations the Company made during the quarter due to SBNA decline or a failure to timely respond. Throughout the year, these amounts aggregate if the Company does not exercise its right of first refusal. At the end of each year, any amounts not used expire and do not roll over to the next year. As of September 30, 2013, approximately $17,150 had been originated by SBNA under this agreement, and SCUSA had not exercised its right to originate additional loans.
On July 3, 2013, the Company entered into a purchase agreement and amended a servicing agreement with a peer-to-peer unsecured lending platform company from which the Company already was acquiring prime amortizing term unsecured consumer loans. Under terms of the new agreements, the Company has
F-23
Table of Contents
committed to purchase at least the lesser of $30 million per month or 75% of the lending platform company’s near-prime originations through July 2015, and the lesser of $30 million per month or 50% of the lending platform company’s near-prime originations thereafter through July 2017. This commitment can be reduced or cancelled with 90 days’ notice.
On September 13, 2013, Ally Financial Inc. filed suit against the Company alleging copyright infringement and misappropriation of trade secrets and confidential information in connection with the Company’s launch of Chrysler Capital and, in particular, the Company’s offering of floorplan lines of credit to Chrysler dealerships.
Periodically, the Company is party to or otherwise involved in other legal proceedings arising in the normal course of business. The Company does not believe that there are any proceedings threatened or pending, if determined adversely, that would have a material adverse effect on the consolidated financial position, results of operations, or liquidity of the Company.
| 11. | Related-Party Transactions |
Related-party transactions not otherwise disclosed in these footnotes to the unaudited condensed consolidated financial statements include the following:
The Company has a line of credit agreement with Santander — New York Branch (Note 5). Interest expense on these lines of credit totaled $23,375 and $6,043 for the three months ended September 30, 2013 and 2012, respectively, and $43,826 and $11,268 for the nine months ended September 30, 2013 and 2012, respectively. Accrued interest was $6,148 and $2,007 at September 30, 2013 and December 31, 2012, respectively.
The Company has a letter of credit facility with Santander — New York Branch (Note 10). Letter of credit fees for the used and unused portions, which are included as a component of interest expense, totaled $128 and $157 for the three months ended September 30, 2013 and 2012, respectively, and $398 and $808 for the nine months ended September 30, 2013 and 2012, respectively. Accrued fees totaled $128 and $128 at September 30, 2013 and December 31, 2012, respectively.
The Company has derivative financial instruments with Santander and affiliates with outstanding notional amounts of $9,204,522 and $6,324,625 at September 30, 2013 and December 31, 2012, respectively (Note 7). Interest expense on these agreements, which is included as a component of interest expense, totaled $15,432 and $14,224 for the three months ended September 30, 2013 and 2012, respectively, and $20,255 and $49,955 for the nine months ended September 30, 2013 and 2012, respectively.
On August 16, 2013, the Company sold approximately $204,782 of the Company’s receivables from dealers to SBNA. The Company continues to service these loans but the loans are not subject to the servicer performance payment that applies to dealer loans originated under the SBNA flow agreement, described in Note 10. Servicing fee income recognized on receivables from dealers sold to SBNA or originated by SBNA totaled $247 for the three and nine months ended September 30, 2013, including $9 in servicer performance payments on loans originated by SBNA. Other information on the dealer loan portfolio serviced for SBNA as of September 30, 2013 is as follows:
| September 30, 2013 | ||||
| Total serviced portfolio |
$ | 255,256 | ||
| Cash collections due to owner |
$ | 4,734 | ||
| Servicing fees receivable |
$ | 247 | ||
The Company also has an agreement with SBNA to service auto retail installment contracts and recreational and marine vehicle portfolios. Servicing fee income recognized under these agreements totaled $5,127 and $6,726 for the three months ended September 30, 2013 and 2012, respectively, and $16,705 and $23,108 for the nine months ended September 30, 2013 and 2012, respectively. Other information on the serviced auto
F-24
Table of Contents
loan and retail installment contract portfolios for SBNA as of September 30, 2013 and December 31, 2012 is as follows:
| September 30, 2013 |
December 31, 2012 |
|||||||
| Total serviced portfolio |
$ | 1,263,414 | $ | 1,673,110 | ||||
| Cash collections due to owner |
$ | 40,019 | $ | 59,067 | ||||
| Servicing fees receivable |
$ | 3,751 | $ | 4,471 | ||||
Produban Servicios Informaticos Generales S.L., a Santander affiliate, is under contract with the Company to provide professional services, telecommunications, and internal and/or external applications. Expenses incurred, which are included as a component of data processing, communications and other expenses, totaled $35 and $37 for the three months ended September 30, 2013 and 2012, respectively, and $110 and $112 for the nine months ended September 30, 2013 and 2012, respectively.
On December 31, 2011, SCUSA financed the sale to certain members of SCUSA’s management of 67,373.99 shares of SCUSA common stock for an aggregate amount of approximately $2,077. The balance on the loans totaled $1,562 at December 31, 2012. These loans had an original four-year term but were repaid in full in July 2013.
On December 21, 2012, the Company entered into a Master Services Agreement (MSA) with a company in which it has a cost method investment and holds a warrant to increase its ownership if certain vesting conditions are satisfied. The MSA enables SCUSA to review credit applications of retail store customers. The Company had not yet begun reviewing applications under this agreement as of September 30, 2013.
The Company reimbursed expenses totaling $499 and $37 for the nine months ended September 30, 2013 and 2012 to the investor in Auto Finance Holdings that also served as the managing member of ALA-A and ALA-B.
| 12. | Fair Value of Financial Instruments |
FASB ASC 825, Financial Instruments, requires that the Company disclose estimated fair values of its financial instruments. Fair value estimates, methods, and assumptions are as follows:
| September 30, 2013 | December 31, 2012 | |||||||||||||||
| Carrying Value |
Estimated Fair Value |
Carrying Value |
Estimated Fair Value |
|||||||||||||
| Cash and cash equivalents (a) |
$ | 27,351 | $ | 27,351 | $ | 70,887 | $ | 70,887 | ||||||||
| Receivables held for sale (b) |
73,425 | 74,157 | — | — | ||||||||||||
| Retail installment contracts held for investment, net (c) |
20,418,553 | 20,535,209 | 16,203,926 | 17,037,855 | ||||||||||||
| Unsecured consumer loans, net (d) |
569,781 | 632,180 | — | — | ||||||||||||
| Receivables from dealers held for investment (e) |
176,925 | 176,925 | 61,894 | 61,894 | ||||||||||||
| Restricted cash (a) |
1,612,943 | 1,612,943 | 1,290,461 | 1,290,461 | ||||||||||||
| Notes payable — credit facilities (f) |
7,407,526 | 7,407,526 | 3,374,666 | 3,374,666 | ||||||||||||
| Notes payable — secured structured financings (g) |
15,275,871 | 15,279,236 | 12,853,329 | 13,021,896 | ||||||||||||
| (a) | Cash and cash equivalents and restricted cash — The carrying amount of cash and cash equivalents, including restricted cash, approximated fair value at September 30, 2013 and December 31, 2012, due to the short maturity of these instruments and is considered a Level 1 measurement. |
| (b) | Receivables held for sale — Receivables held for sale are carried at the lower of cost or market, as determined on an aggregate basis. The estimated fair value is based on the prices obtained or expected to be obtained in the subsequent sales and is considered a Level 1 measurement. |
| (c) | Retail installment contracts held for investment — Retail installment contracts are carried at amortized cost, net of loan loss allowance. The estimated fair value is calculated based on estimated market rates for similar contracts with similar credit risks and is considered a Level 3 measurement. |
F-25
Table of Contents
| (d) | Unsecured consumer loans, net — Unsecured consumer loans are carried at amortized cost, net of loan loss allowance. Carrying value approximates fair value for unsecured revolving loans because the loans are short term in duration, do not have a defined maturity date and/or are at a market-based interest rate. For unsecured amortizing loans, the estimated fair value is calculated based on estimated market rates for similar loans with similar credit risks and is considered a level 3 measurement. |
| (e) | Receivables from dealers held for investment — Receivables from dealers held for investment are carried at amortized cost, net of loan loss allowance. The estimated fair value is calculated based on estimated market rates for similar receivables with similar credit risks and is considered a Level 3 measurement. |
| (f) | Notes payable — revolving credit facilities — The carrying amount of notes payable related to revolving credit facilities is estimated to approximate fair value as of September 30, 2013 and December 31, 2012. Management believes that the terms of these credit agreements approximate market terms for similar credit agreements. The fair value of notes payable is considered a Level 3 measurement. |
| (g) | Notes payable — secured structured financings — The estimated fair value of notes payable related to secured structured financings is calculated based on market quotes for the Company’s publicly traded debt and estimated market rates currently available from recent transactions involving similar debt with similar credit risks, and is considered a Level 2 measurement. |
The following table presents the Company’s assets and liabilities that are measured at fair value on a recurring basis at September 30, 2013 and December 31, 2012, and are categorized using the fair value hierarchy. The fair value hierarchy includes three levels based on the reliability of the inputs used to determine the fair value:
| Fair Value Measurements at September 30, 2013 | ||||||||||||||||
| Total | Quoted Prices in Active Markets for Identical Assets (Level 1) |
Significant Other Observable Inputs (Level 2) |
Significant Unobservable Inputs (Level 3) |
|||||||||||||
| Assets — trading interest rate caps (a) |
$ | 26,125 | $ | — | $ | 26,125 | $ | — | ||||||||
| Liabilities — trading options for interest rate caps (a) |
$ | 26,251 | $ | — | $ | 26,251 | $ | — | ||||||||
| Liabilities — hedging interest rate swaps (b) |
$ | 11,341 | $ | — | $ | 11,341 | $ | — | ||||||||
| Liabilities — trading interest rate swaps (b) |
$ | 36,236 | $ | — | $ | 36,236 | $ | — | ||||||||
| Fair Value Measurements at December 31, 2012 | ||||||||||||||||
| Total | Quoted Prices in Active Markets for Identical Assets (Level 1) |
Significant Other Observable Inputs (Level 2) |
Significant Unobservable Inputs (Level 3) |
|||||||||||||
| Assets — investments available-for-sale (c) |
$ | 95,600 | $ | — | $ | 95,600 | $ | — | ||||||||
| Liabilities — hedging interest rate swaps (b) |
$ | 20,759 | $ | — | $ | 20,759 | $ | — | ||||||||
| Liabilities — trading interest rate swaps (b) |
$ | 52,546 | $ | — | $ | 52,546 | $ | — | ||||||||
| (a) | The valuation of interest rate caps is determined based on quoted market prices received from bank counterparties (see Note 7). |
| (b) | The valuation of interest rate swaps is determined using widely accepted valuation techniques including discounted cash flow analysis on the expected cash flows of each swap. This analysis reflects the contractual terms of the swaps, including the period to maturity, and uses observable market-based inputs. The Company incorporates credit valuation adjustments to appropriately reflect both its own nonperformance risk and the respective counterparty’s nonperformance risk in the fair value measurement of its derivatives. In adjusting the fair value of its derivative contracts for the effect of nonperformance risk, the Company has considered the impact of netting and any applicable credit enhancements, such as collateral postings and guarantees. Effective January 1, 2012, the Company |
F-26
Table of Contents
| made an election to use the exception in ASC 820-10-35-18D (commonly referred to as the “portfolio exception”) with respect to measuring counterparty credit risk for derivative instruments (see Note 7). |
| (c) | Quoted market prices for the Company’s investments available for sale are not readily available. The Company’s principal markets for its investment securities are the secondary institutional markets with an exit price that is predominantly reflective of bid-level pricing in these markets. The Company estimated fair values for these securities by evaluating pricing information from a combination of sources such as third party pricing services, third-party broker quotes for certain securities, and other independent third-party valuation sources. These quotes are benchmarked against similar securities that are more actively traded in order to assess the reasonableness of the estimated fair values. The fair market value estimates assigned to these securities assume liquidation in an orderly fashion and not under distressed circumstances. |
No amounts were transferred in or out of Level 3 during 2013.
The following table presents the Company’s assets and liabilities that are measured at fair value on a nonrecurring basis at September 30, 2013 and December 31, 2012, and are categorized using the fair value hierarchy:
| Fair Value Measurements at September 30, 2013 | ||||||||||||||||
| Total | Quoted Prices in Active Markets for Identical Assets (Level 1) |
Significant Other Observable Inputs (Level 2) |
Significant Unobservable Inputs (Level 3) |
|||||||||||||
| Assets — repossessed vehicle inventory |
$ | 109,366 | $ | — | $ | 109,366 | $ | — | ||||||||
| Fair Value Measurements at December 31, 2012 | ||||||||||||||||
| Total | Quoted Prices in Active Markets for Identical Assets (Level 1) |
Significant Other Observable Inputs (Level 2) |
Significant Unobservable Inputs (Level 3) |
|||||||||||||
| Assets — repossessed vehicle inventory |
$ | 82,249 | $ | — | $ | 82,249 | $ | — | ||||||||
The Company estimates the fair value of its repossessed vehicle inventory using historical auction rates and current market levels of used car prices.
| 13. | Employee Benefit Plans |
SCUSA Compensation Plan — Beginning in 2012, the Company granted stock options to certain executives and other employees under a Management Equity Plan (the “Plan”). The Plan is administered by the Board of Directors and enables the Company to make stock awards up to a total of approximately 11 million common shares (net of shares canceled and forfeited), or 8.5% of the equity invested in the Company as of December 31, 2011.
Stock options granted have an exercise price based on the estimated fair market value of the Company’s common stock on the grant date. The stock options expire after ten years and include both time vesting options and performance vesting options. No shares obtained through exercise of stock options may be transferred until the later of December 31, 2016, and the Company’s execution of an initial public offering (IPO) (the later date of which is referred to as the Lapse Date).
The fair value of the stock options is amortized into income over the vesting period as time and performance vesting conditions are met. Until the Lapse Date, if an employee leaves the Company, the Company has the right to repurchase any or all of the stock obtained by the employee through option exercise. If the employee is terminated for cause (as defined in the Plan) or voluntarily leaves the Company without good reason (as defined in the Plan), the repurchase price is the lower of the strike price or fair market value at the date of repurchase. If the employee is terminated without cause or voluntarily leaves the Company with good
F-27
Table of Contents
reason, the repurchase price is the fair market value at the date of repurchase. Management believes the Company’s repurchase right causes the IPO event to constitute an implicit vesting condition; because an IPO had not been executed as of September 30, 2013, no stock compensation expense has been recorded. As of September 30, 2013, there was approximately $143,645 of total unrecognized compensation cost related to stock options granted but for which the IPO implicit vesting condition had not been met. A portion of this cost is expected to be recognized upon occurrence of an IPO, with the remainder to be recognized over the remaining vesting period.
A summary of the Company’s stock options and related activity as of and for the period ended September 30, 2013, is presented below:
| Shares | Weighted Average Exercise Price* |
Weighted Average Remaining Contractual Term (Years) |
||||||||||
| Options outstanding at January 1, 2013 |
9,286,537 | $ | 27.38 | |||||||||
| Granted |
102,374 | 42.00 | ||||||||||
| Exercised |
(11,762 | ) | 25.97 | |||||||||
| Expired |
— | — | ||||||||||
| Forfeited |
(362,494 | ) | 26.81 | |||||||||
|
|
|
|||||||||||
| Options outstanding at September 30, 2013 |
9,014,655 | 27.63 | 8.3 | |||||||||
|
|
|
|
|
|||||||||
| Options exercisable at September 30, 2013 |
1,773,874 | 27.41 | 8.3 | |||||||||
|
|
|
|
|
|||||||||
| * | Exercise prices have been retroactively adjusted for prior year grants to reflect a $4.84 dividend protection adjustment due to dividends paid in 2012. |
| 14. | Accumulated Other Comprehensive Income (Loss) |
A summary of changes in accumulated other comprehensive income (loss), net of tax, for the three and nine months ended September 30, 2013 is as follows:
| Three Months Ended September 30, 2013 | ||||||||||||
| Unrealized gains (losses) on cash flow hedges (a) |
Unrealized gains (losses) on investments available for sale (a) |
Total | ||||||||||
| Beginning balance |
$ | (7,582 | ) | $ | 630 | $ | (6,952 | ) | ||||
| Other comprehensive income (loss) before reclassifications |
(2,385 | ) | (468 | ) | (2,853 | ) | ||||||
| Amounts reclassified out of accumulated other comprehensive income (loss) (b) |
3,372 | (162 | ) | 3,210 | ||||||||
|
|
|
|
|
|
|
|||||||
| Ending balance |
$ | (6,595 | ) | $ | — | $ | (6,595 | ) | ||||
|
|
|
|
|
|
|
|||||||
| (a) | Amounts in this table are net of tax. |
F-28
Table of Contents
| (b) | Amounts reclassified out of accumulated other comprehensive income consist of the following: |
| Reclassification |
Amount reclassified |
Income statement line item |
||||||
| Cash flow hedges: |
||||||||
| Settlements of derivatives |
$ | 5,342 | Interest expense | |||||
| Tax expense (benefit) |
(1,970 | ) | ||||||
|
|
|
|||||||
| Net of tax |
$ | 3,372 | ||||||
|
|
|
|||||||
| Investments available for sale: |
||||||||
| Discount accretion |
$ | (257 | ) | Interest expense | ||||
| Tax expense (benefit) |
95 | |||||||
|
|
|
|||||||
| Net of tax |
$ | (162 | ) | |||||
|
|
|
|||||||
| Nine Months Ended September 30, 2013 | ||||||||||||
| Unrealized gains (losses) on cash flow hedges (a) |
Unrealized gains (losses) on investments available for sale (a) |
Total | ||||||||||
| Beginning balance |
$ | (12,416 | ) | $ | 3,252 | $ | (9,164 | ) | ||||
| Other comprehensive income (loss) before reclassifications |
(3,508 | ) | (2,490 | ) | (5,998 | ) | ||||||
| Amounts reclassified out of accumulated other comprehensive income (loss) (b) |
9,329 | (762 | ) | 8,567 | ||||||||
|
|
|
|
|
|
|
|||||||
| Ending balance |
$ | (6,595 | ) | $ | — | $ | (6,595 | ) | ||||
|
|
|
|
|
|
|
|||||||
| (a) | Amounts in this table are net of tax. |
| (b) | Amounts reclassified out of accumulated other comprehensive income consist of the following: |
| Reclassification |
Amount reclassified |
Income statement line item |
||||||
| Cash flow hedges: |
||||||||
| Settlements of derivatives |
$ | 14,781 | Interest expense | |||||
| Tax expense (benefit) |
(5,452 | ) | ||||||
|
|
|
|||||||
| Net of tax |
$ | 9,329 | ||||||
|
|
|
|||||||
| Investments available for sale: |
||||||||
| Discount accretion |
$ | (1,208 | ) | Interest expense | ||||
| Tax expense (benefit) |
446 | |||||||
|
|
|
|||||||
| Net of tax |
$ | (762 | ) | |||||
|
|
|
|||||||
| 15. | Subsequent Events |
On October 21, 2013, the Company entered into a lease for approximately 373,000 square feet at a property intended to serve as its corporate headquarters and in which three members of the Company’s executive management and Board of Directors each have a minority equity investment. Future minimum lease payments for the twelve-year term of the lease total approximately $83.6 million.
On October 24, 2013, the Company executed the first Chrysler Capital securitization, selling $639,959 in vehicle retail installment contracts. On November 12, 2013, the Company executed the second Chrysler Capital securitization, selling $451,323 in vehicle retail installment contracts. These securitizations were recorded as true sales rather than on-balance sheet securitizations and resulted in gains of $13,286 and $15,514, respectively.
F-29
Table of Contents
On October 24, 2013, the Company began reviewing credit applications of retail store customers, resulting in the origination of an immaterial amount of loans as of the date these financial statements were available to be issued.
On November 1, 2013, the Company entered into an agreement with SBNA whereby it sold a $17,602 portfolio of receivables from dealers on that date, and agreed to sell certain additional loans, with a then-outstanding principal balance of $25,198, at a later date. The completed sale resulted in no gain or loss. No further sales have been completed. The Company will continue to perform certain servicing on the receivables sold.
On December 28, 2013, the Company’s board of directors approved certain changes to the Management Equity Plan, including acceleration of vesting for certain employees, removal of transfer restrictions for shares underlying a portion of the options outstanding under the Plan, and addition of transfer restrictions for shares underlying another portion of the outstanding options. Also on December 28, 2013, the board established the Omnibus Incentive Plan, which enables the Company to grant awards of nonqualified and incentive stock options, stock appreciation rights, restricted stock awards, restricted stock units and other awards that may be settled in or based upon the value of the Company’s common stock up to a total of 1,947,362 common shares. As of December 31, 2013, the Company had granted 218,973 shares of restricted stock to certain executives under terms of the Omnibus Incentive Plan.
The Company has evaluated and disclosed subsequent events through January 6, 2014, the date these financial statements were available to be issued.
************
F-30
Table of Contents
REPORT OF INDEPENDENT REGISTERED PUBLIC ACCOUNTING FIRM
To the Board of Directors and Stockholders of
Santander Consumer USA Inc.
Dallas, Texas
We have audited the accompanying consolidated balance sheets of Santander Consumer USA Inc. and subsidiaries (the “Company”) as of December 31, 2012 and 2011, and the related consolidated statements of income and comprehensive income, equity, and cash flows for each of the three years in the period ended December 31, 2012. These financial statements are the responsibility of the Company’s management. Our responsibility is to express an opinion on these financial statements based on our audits.
We conducted our audits in accordance with the standards of the Public Company Accounting Oversight Board (United States). Those standards require that we plan and perform the audit to obtain reasonable assurance about whether the financial statements are free of material misstatement. The Company is not required to have, nor were we engaged to perform, an audit of its internal control over financial reporting. Our audits included consideration of internal control over financial reporting as a basis for designing audit procedures that are appropriate in the circumstances, but not for the purpose of expressing an opinion on the effectiveness of the Company’s internal control over financial reporting. Accordingly, we express no such opinion. An audit also includes examining, on a test basis, evidence supporting the amounts and disclosures in the financial statements, assessing the accounting principles used and significant estimates made by management, as well as evaluating the overall financial statement presentation. We believe that our audits provide a reasonable basis for our opinion.
In our opinion, such consolidated financial statements present fairly, in all material respects, the financial position of Santander Consumer USA Inc. and subsidiaries as of December 31, 2012 and 2011, and the results of their operations and their cash flows for each of the three years in the period ended December 31, 2012, in conformity with accounting principles generally accepted in the United States of America.
/s/ DELOITTE & TOUCHE LLP
Dallas, Texas
July 3, 2013
F-31
Table of Contents
SANTANDER CONSUMER USA INC. AND SUBSIDIARIES
(dollars in thousands)
| December 31, 2012 |
December 31, 2011 |
|||||||
| Assets |
||||||||
| Cash and cash equivalents |
$ | 70,887 | $ | 54,409 | ||||
| Retail installment contracts, net (including finance receivables transferred to special purpose entities) |
16,203,926 | 16,581,565 | ||||||
| Restricted cash — equity transaction |
— | 1,158,200 | ||||||
| Restricted cash — notes payable and lockbox collections |
1,290,461 | 499,966 | ||||||
| Accrued interest receivable |
240,628 | 215,117 | ||||||
| Receivables from lenders |
61,894 | 134,138 | ||||||
| Investments available for sale |
95,600 | 188,299 | ||||||
| Receivable from Santander Holdings USA, Inc. for taxes |
— | 10,009 | ||||||
| Furniture and equipment, net of accumulated depreciation of $57,630 and $50,830, respectively |
13,462 | 19,138 | ||||||
| Deferred tax asset |
506,267 | 311,490 | ||||||
| Goodwill |
74,056 | 74,056 | ||||||
| Intangibles |
52,644 | 51,371 | ||||||
| Repossessed vehicles and other assets |
131,819 | 106,613 | ||||||
|
|
|
|
|
|||||
| Total assets (1) |
$ | 18,741,644 | $ | 19,404,371 | ||||
|
|
|
|
|
|||||
| Liabilities and Equity |
||||||||
| Liabilities: |
||||||||
| Notes payable — $1,385,000 and $2,047,800, respectively to affiliates |
$ | 3,684,553 | $ | 4,266,405 | ||||
| Notes payable related to securitized retail installment contracts |
12,543,442 | 12,436,984 | ||||||
| TALF loan payable |
— | 87,129 | ||||||
| Accrued interest payable — $2,135 and $3,778, respectively to affiliates |
13,772 | 14,819 | ||||||
| Accounts payable and accrued expenses — $59,067 and $98,513 to affiliates, respectively |
156,550 | 219,033 | ||||||
| Federal, state and other income taxes payable |
3,038 | 23,476 | ||||||
| Other liabilities |
100,823 | 119,840 | ||||||
|
|
|
|
|
|||||
| Total liabilities (2) |
16,502,178 | 17,167,686 | ||||||
|
|
|
|
|
|||||
| Commitments and Contingencies (Notes 11 and 17) |
||||||||
| Equity: |
||||||||
| Common stock, no par value — 250,000,000 shares authorized; 129,819,883 shares issued and outstanding |
1,264,201 | 1,263,686 | ||||||
| Additional paid-in capital |
74,833 | 74,833 | ||||||
| Accumulated other comprehensive loss |
(9,164 | ) | (11,496 | ) | ||||
| Retained earnings |
869,664 | 889,661 | ||||||
|
|
|
|
|
|||||
| Total stockholders’ equity |
2,199,534 | 2,216,684 | ||||||
| Noncontrolling interests |
39,932 | 20,001 | ||||||
|
|
|
|
|
|||||
| Total equity |
2,239,466 | 2,236,685 | ||||||
|
|
|
|
|
|||||
| Total liabilities and equity |
$ | 18,741,644 | $ | 19,404,371 | ||||
|
|
|
|
|
|||||
| (1) | Consolidated assets at December 31, 2012 and 2011, respectively, include the following assets of certain variable interest entities (“VIEs”) that can be used only to settle the liabilities of those entities: Restricted cash, $1.1 billion and $0.4 billion; Retail installment contracts, net, of $14.2 billion and $13.6 billion; various other assets, $0.3 billion and $0.2 billion (See notes 12 and 16). |
| (2) | Consolidated liabilities at December 31, 2012 and 2011, respectively, include the following liabilities of certain VIEs: Notes payable, $13.9 billion and $13.5 billion; various other liabilities, $0.3 billion, and less than $0.1 billion. |
See notes to consolidated financial statements.
F-32
Table of Contents
SANTANDER CONSUMER USA INC. AND SUBSIDIARIES
CONSOLIDATED STATEMENTS OF INCOME AND COMPREHENSIVE INCOME
(dollars in thousands)
| For the Year Ended December 31, | ||||||||||||
| 2012 | 2011 | 2010 | ||||||||||
| Finance and other interest income |
$ | 2,948,502 | $ | 2,594,513 | $ | 2,076,578 | ||||||
| Interest expense — including $77,611, $191,238 and $180,735 to affiliates, respectively |
374,027 | 418,526 | 316,486 | |||||||||
|
|
|
|
|
|
|
|||||||
| Net interest margin |
2,574,475 | 2,175,987 | 1,760,092 | |||||||||
| Provision for loan losses on retail installment contracts |
1,122,452 | 819,221 | 888,225 | |||||||||
|
|
|
|
|
|
|
|||||||
| Net interest margin after provision for credit losses |
1,452,023 | 1,356,766 | 871,867 | |||||||||
|
|
|
|
|
|
|
|||||||
| Servicing fee income |
34,135 | 251,394 | 173,882 | |||||||||
| Fees, commissions, and other |
261,554 | 201,135 | 75,146 | |||||||||
|
|
|
|
|
|
|
|||||||
| Total other income |
295,689 | 452,529 | 249,028 | |||||||||
| Costs and expenses: |
||||||||||||
| Salary and benefits expense |
225,159 | 213,688 | 151,528 | |||||||||
| Servicing and repossession expense |
136,554 | 155,857 | 98,275 | |||||||||
| Other operating expenses |
197,450 | 187,538 | 155,037 | |||||||||
|
|
|
|
|
|
|
|||||||
| Total costs and expenses |
559,163 | 557,083 | 404,840 | |||||||||
|
|
|
|
|
|
|
|||||||
| Income before income taxes |
1,188,549 | 1,252,212 | 716,055 | |||||||||
| Income tax expense |
453,615 | 464,034 | 277,944 | |||||||||
|
|
|
|
|
|
|
|||||||
| Net income |
734,934 | 788,178 | 438,111 | |||||||||
| Noncontrolling interests |
19,931 | 19,981 | — | |||||||||
|
|
|
|
|
|
|
|||||||
| Net income attributable to Santander Consumer USA Inc shareholders |
$ | 715,003 | $ | 768,197 | $ | 438,111 | ||||||
|
|
|
|
|
|
|
|||||||
| Net income |
$ | 734,934 | $ | 788,178 | $ | 438,111 | ||||||
|
|
|
|
|
|
|
|||||||
| Other comprehensive income (loss): |
||||||||||||
| Unrealized gains (losses) on cash flow hedges, net of tax of $4,438, $3,439 and 2,842 |
7,271 | (5,677 | ) | 7,958 | ||||||||
| Unrealized gains (losses) on investments available for sale net of tax of $3,027, $3,886 and $2,595 |
(4,939 | ) | (6,340 | ) | 4,233 | |||||||
|
|
|
|
|
|
|
|||||||
| Other comprehensive income (loss), net |
$ | 2,332 | $ | (12,017 | ) | 12,191 | ||||||
|
|
|
|
|
|
|
|||||||
| Comprehensive income |
$ | 737,266 | $ | 776,161 | $ | 450,302 | ||||||
|
|
|
|
|
|
|
|||||||
| Net income per share (basic and diluted) |
$ | 5.51 | $ | 8.32 | $ | 4.75 | ||||||
|
|
|
|
|
|
|
|||||||
| Weighted average common shares outstanding |
129,819,883 | 92,277,053 | 92,173,913 | |||||||||
|
|
|
|
|
|
|
|||||||
See notes to consolidated financial statements.
F-33
Table of Contents
SANTANDER CONSUMER USA INC. AND SUBSIDIARIES
CONSOLIDATED STATEMENTS OF EQUITY
(dollars in thousands)
| Common Stock |
Additional Paid-in Capital |
Accumulated Other Comprehensive (Loss) Income |
Retained Earnings |
Noncontrolling Interests |
Total Stockholders’ Equity |
|||||||||||||||||||
| Balance — January 1, 2010 |
$ | 105,486 | $ | 74,833 | $ | (11,670 | ) | $ | 548,666 | $ | — | $ | 717,315 | |||||||||||
|
|
|
|
|
|
|
|
|
|
|
|
|
|||||||||||||
| Comprehensive income: |
||||||||||||||||||||||||
| Net income |
— | — | — | 438,111 | 438,111 | |||||||||||||||||||
| Other comprehensive income (loss), net of taxes of $5,437 |
— | — | 12,191 | — | — | 12,191 | ||||||||||||||||||
| Dividends ($4.34 per share) |
— | — | — | (400,000 | ) | — | (400,000 | ) | ||||||||||||||||
|
|
|
|
|
|
|
|
|
|
|
|
|
|||||||||||||
| Balance — December 31, 2010 |
105,486 | 74,833 | 521 | 586,777 | — | 767,617 | ||||||||||||||||||
| Issuance of common stock |
1,158,200 | — | — | — | — | 1,158,200 | ||||||||||||||||||
| Issuance of common stock to employees for notes receivable |
2,077 | — | — | — | — | 2,077 | ||||||||||||||||||
| Issuance of notes receivable to employees for common stock |
(2,077 | ) | — | — | — | — | (2,077 | ) | ||||||||||||||||
| Net income |
— | — | — | 768,197 | 19,981 | 788,178 | ||||||||||||||||||
| Other comprehensive income (loss), net of taxes of $7,325 |
— | — | (12,017 | ) | — | — | (12,017 | ) | ||||||||||||||||
| Sale of noncontrolling interest |
20 | 20 | ||||||||||||||||||||||
| Dividends ($5.05 per share) |
— | — | — | (465,313 | ) | — | (465,313 | ) | ||||||||||||||||
|
|
|
|
|
|
|
|
|
|
|
|
|
|||||||||||||
| Balance — December 31, 2011 |
1,263,686 | 74,833 | (11,496 | ) | 889,661 | 20,001 | 2,236,685 | |||||||||||||||||
| Repayment of employee loans |
515 | — | — | — | — | 515 | ||||||||||||||||||
| Accrued capital contribution |
— | 48,275 | — | — | — | 48,275 | ||||||||||||||||||
| Receivable from shareholder |
— | (48,275 | ) | — | — | — | (48,275 | ) | ||||||||||||||||
| Net income |
715,003 | 19,931 | 734,934 | |||||||||||||||||||||
| Other comprehensive income (loss), net of taxes of $1,411 |
— | — | 2,332 | — | — | 2,332 | ||||||||||||||||||
| Dividends ($5.66 per share) |
— | — | — | (735,000 | ) | — | (735,000 | ) | ||||||||||||||||
|
|
|
|
|
|
|
|
|
|
|
|
|
|||||||||||||
| Balance — December 31, 2012 |
$ | 1,264,201 | $ | 74,833 | $ | (9,164 | ) | $ | 869,664 | $ | 39,932 | $ | 2,239,466 | |||||||||||
|
|
|
|
|
|
|
|
|
|
|
|
|
|||||||||||||
See notes to consolidated financial statements.
F-34
Table of Contents
SANTANDER CONSUMER USA INC. AND SUBSIDIARIES
CONSOLIDATED STATEMENTS OF CASH FLOWS
(dollars in thousands)
| For the Year Ended December 31, | ||||||||||||
| 2012 | 2011 | 2010 | ||||||||||
| Cash flows from operating activities: |
||||||||||||
| Net income |
$ | 734,934 | $ | 788,178 | $ | 438,111 | ||||||
| Adjustments to reconcile net income to net cash provided by operating activities: |
||||||||||||
| Derivative expense |
(8,326 | ) | 34,426 | 639 | ||||||||
| Provision for credit losses on retail installment contracts |
1,122,452 | 819,221 | 888,225 | |||||||||
| Depreciation and amortization |
187,349 | 258,224 | 124,487 | |||||||||
| Accretion of discount and capitalized origination costs, net |
(273,462 | ) | (237,856 | ) | (276,722 | ) | ||||||
| Stock-based compensation |
608 | 3 | (64 | ) | ||||||||
| Deferred tax expense (benefit) |
(196,188 | ) | 3,203 | (260,436 | ) | |||||||
| Changes in assets and liabilities: |
||||||||||||
| Accrued interest receivable |
(25,511 | ) | 3,563 | (11,513 | ) | |||||||
| Accounts receivable |
2,532 | 30,957 | (18,951 | ) | ||||||||
| Federal income tax and other taxes |
(10,429 | ) | (191,092 | ) | 203,859 | |||||||
| Other assets |
(28,248 | ) | 72,443 | 33,212 | ||||||||
| Accrued interest payable |
(1,474 | ) | 3,562 | 2,813 | ||||||||
| Other liabilities |
(61,645 | ) | (29,236 | ) | 35,953 | |||||||
|
|
|
|
|
|
|
|||||||
| Net cash provided by operating activities |
1,442,592 | 1,555,596 | 1,159,613 | |||||||||
|
|
|
|
|
|
|
|||||||
| Cash flows from investing activities: |
||||||||||||
| Retail installment contracts originated or purchased from dealers |
(8,244,373 | ) | (5,470,648 | ) | (3,563,813 | ) | ||||||
| Retail installment contracts purchased from other lenders, net of acquired debt and restricted cash |
(76,689 | ) | (3,650,450 | ) | (7,814,903 | ) | ||||||
| Collections on retail installment contracts |
7,731,759 | 6,682,201 | 3,979,490 | |||||||||
| Disbursements for receivables from lenders |
(18,180 | ) | (4,138 | ) | (379,047 | ) | ||||||
| Receipts on receivables from lenders |
90,424 | 100,000 | 748,663 | |||||||||
| Collections on investments available for sale |
86,918 | 116,418 | 131,857 | |||||||||
| Purchases of furniture and equipment |
(3,232 | ) | (7,152 | ) | (17,643 | ) | ||||||
| Sales of furniture and equipment |
2,108 | — | — | |||||||||
| Other assets acquired from third parties |
— | (215,489 | ) | (121,715 | ) | |||||||
| Change in restricted cash |
379,428 | (1,111,210 | ) | (41,678 | ) | |||||||
| Other investing activities |
(12,795 | ) | (3,497 | ) | — | |||||||
|
|
|
|
|
|
|
|||||||
| Net cash used in investing activities |
(64,632 | ) | (3,563,965 | ) | (7,078,789 | ) | ||||||
|
|
|
|
|
|
|
|||||||
| Cash flows from financing activities: |
||||||||||||
| Proceeds from notes payable related to securitized retail installment contracts, net of debt issuance costs |
7,999,556 | 10,405,352 | 7,715,170 | |||||||||
| Payments on notes payable related to securitized retail installment contracts |
(7,957,572 | ) | (6,021,658 | ) | (3,202,015 | ) | ||||||
| Payments on TALF loan payable |
(87,129 | ) | (108,925 | ) | (123,946 | ) | ||||||
| Proceeds from unsecured notes payable |
1,680,611 | 6,454,019 | 1,213,000 | |||||||||
| Payments on unsecured notes payable |
(3,295,651 | ) | (6,080,699 | ) | (1,208,000 | ) | ||||||
| Proceeds from notes payable |
16,265,837 | 4,838,496 | 13,979,861 | |||||||||
| Payments on notes payable |
(15,232,649 | ) | (7,775,715 | ) | (12,430,823 | ) | ||||||
| Proceeds from issuance of common stock |
— | 1,158,200 | — | |||||||||
| Repayment of employee notes |
515 | — | — | |||||||||
| Dividends paid |
(735,000 | ) | (865,313 | ) | — | |||||||
| Sale of noncontrolling interest |
— | 20 | — | |||||||||
|
|
|
|
|
|
|
|||||||
| Net cash provided by (used in) financing activities |
(1,361,482 | ) | 2,003,777 | 5,943,247 | ||||||||
|
|
|
|
|
|
|
|||||||
| Net increase (decrease) in cash and cash equivalents |
16,478 | (4,592 | ) | 24,071 | ||||||||
| Cash — Beginning of year |
54,409 | 59,001 | 34,930 | |||||||||
|
|
|
|
|
|
|
|||||||
| Cash — End of year |
$ | 70,887 | $ | 54,409 | $ | 59,001 | ||||||
|
|
|
|
|
|
|
|||||||
| Supplemental disclosures of cash flow information: |
||||||||||||
| Cash paid during the year for: |
||||||||||||
| Interest |
$ | 383,400 | $ | 410,265 | $ | 310,968 | ||||||
| Income taxes |
$ | 660,232 | $ | 652,681 | $ | 339,183 | ||||||
| Noncash investing and financing transactions: |
||||||||||||
| Dividends declared, not paid |
$ | — | $ | — | $ | 400,000 | ||||||
| Issuance of stock to employees for notes receivable |
$ | — | $ | 2,077 | $ | — | ||||||
| Transfers of retail installment contracts to repossessed vehicles |
$ | 841,058 | $ | 921,504 | $ | 886,964 | ||||||
See notes to consolidated financial statements.
F-35
Table of Contents
SANTANDER CONSUMER USA INC. AND SUBSIDIARIES
NOTES TO CONSOLIDATED FINANCIAL STATEMENTS
FOR THE YEARS ENDED DECEMBER 31, 2012, 2011 AND 2010
(DOLLARS IN THOUSANDS)
| 1. | Organization and Business |
Santander Consumer USA Inc. and subsidiaries (“SCUSA” or the “Company”) is a specialized consumer finance company engaged in the purchase, securitization, and servicing of retail installment contracts. The Company acquires retail installment contracts principally from manufacturer-franchised dealers in connection with their sale of used and new automobiles and light-duty trucks primarily to nonprime customers with limited credit histories or past credit problems. The Company also originates receivables through a Web-based direct lending program, purchases automobile retail installment contracts from other lenders, and services automobile and recreational and marine vehicle portfolios for other lenders.
Prior to December 31, 2011, the Company was owned 91.5% by Santander Holdings USA, Inc. (SHUSA), a subsidiary of Banco Santander, S.A. (“Santander”), and 8.5% by Mr. Thomas Dundon, Chief Executive Officer of SCUSA. On December 31, 2011, SCUSA completed the sale of common stock to Sponsor Auto Finance Holdings Series LP (“Auto Finance Holdings”), DDFS LLC (previously Dundon DFS LLC) (DDFS), and to certain members of SCUSA’s management. As a result of these transactions, SHUSA owns 65% of the Company, Auto Finance Holdings owns approximately 25%, DDFS owns approximately 10%, and certain other members of senior management own less than 1% (see Note 3).
| 2. | Summary of Significant Accounting Policies and Practices |
The following is a description of the significant accounting policies of SCUSA. Such accounting policies are in accordance with United States generally accepted accounting principles (U.S. GAAP).
Principles of Consolidation — The accompanying consolidated financial statements include the accounts of SCUSA and its subsidiaries, including certain special purpose financing trusts utilized in securitization transactions (“Trusts”), which are considered variable interest entities (VIEs). Additionally, the Company has consolidated other VIEs for which it is deemed the primary beneficiary (see Note 16). All intercompany balances and transactions have been eliminated in consolidation.
Reclassifications — Certain prior year amounts have been reclassified to conform with classifications adopted in the current year. In addition other comprehensive income (OCI) is presented with the consolidated statements of income as a single continuous statement rather than with the consolidated statement of stockholders’ equity, due to the adoption of Financial Accounting Standards Board (FASB) Accounting Standards Update (ASU) 2011-05, Comprehensive Income.
Corrections — Certain amounts in the 2011 and 2010 consolidated financial statements have been corrected, as follows: the presentation of issuance of employee notes for common stock on a gross basis rather than net in the 2011 consolidated statement of equity; and the presentation of proceeds from and payments on notes payable on a gross basis rather than net in the 2011 and 2010 consolidated statement of cash flows.
Use of Estimates — Management of the Company has made a number of estimates and assumptions relating to the reporting of assets and liabilities, revenue and expenses, and the disclosure of contingent assets and liabilities to prepare these consolidated financial statements in conformity with U.S. GAAP. The Company consistently uses estimates for the determination of loan loss allowance, discount accretion, impairment, values of repossessed assets, and income taxes. These estimates, although based on actual historical trends and modeling, may potentially show significant variances over time.
F-36
Table of Contents
Retail Installment Contracts — Net — Retail installment contracts — net, consist largely of nonprime automobile finance receivables, which are acquired individually from dealers at a nonrefundable discount from the contractual principal amount. Retail installment contracts also include receivables originated through a direct lending program and loan portfolios purchased from other lenders. Retail installment contracts acquired individually or originated directly are classified as held-for-investment and carried at amortized cost, net of allowance for loan losses. Most of the Company’s retail installment contracts are pledged under its warehouse lines of credit or securitization transactions.
Interest is accrued when earned in accordance with the terms of the retail installment contract. The accrual of interest is discontinued and reversed once a retail installment contract becomes past due 61 days or more, and is resumed and reinstated if a delinquent account subsequently becomes less than 61 days past due. The amortization of discounts and other origination costs on retail installment contracts acquired individually or through a direct lending program are recognized as adjustments to the yield of the related contract using the effective interest method. The Company estimates future principal prepayments and defaults in the calculation of the constant effective yield.
Provision for Credit Losses — Provisions for loan losses are charged to operations in amounts sufficient to maintain the credit loss allowance at a level considered adequate to cover probable credit losses inherent in the retail installment contracts. Probable losses are estimated based on contractual delinquency status and the Company’s historical loss experience.
In addition, loss allowances are maintained to reflect the Company’s judgment of estimates of the value of the underlying collateral, bankruptcy trends, economic conditions, such as unemployment rates, changes in the used vehicle value index, delinquency status, historical collection rates and other information in order to make the necessary judgments as to probable credit losses on retail installment contracts.
Receivables are charged off against the allowance in the month in which the account becomes 120 days contractually delinquent if the Company has not repossessed the related vehicle. The Company charges off accounts in repossession when the automobile is repossessed and legally available for disposition. A charge-off represents the difference between the estimated net sales proceeds and the amount of the delinquent contract. Accounts in repossession that have been charged off and are pending liquidation are removed from vehicle retail installment contracts and the related repossessed automobiles are included in repossessed vehicles and other assets in the Company’s consolidated balance sheets.
Purchased Receivables Portfolios — For receivables portfolios purchased from other lenders, purchased at amounts less than the principal amount of those receivables, resulting in a discount to par, the discount was attributable, in part, to estimated future credit losses that did not exist at the origination of the loans.
A nonaccretable difference is the excess between the contractually required payments and the amount of cash flows, considering the impact of prepayments, expected to be collected. An accretable yield is the excess of the cash flows, considering the impact of prepayments, expected to be collected over the initial investment of the loans.
Any deterioration in the performance of the purchased portfolios results in an incremental provision for loan losses. Improvements in performance of the purchased pools which significantly increase actual or expected cash flows results in first a reversal of previously recorded allowance for loan losses and then in a transfer of the excess from nonaccretable difference to accretable yield, which will be recorded as finance income over the remaining life of the receivables.
Sales of Retail Installment Contracts — The Company accounts for sales of retail installment contracts into Trusts in accordance with FASB Accounting Standards Codification (ASC) 860, Transfers and Servicing. The Company transfers retail installment contracts into newly formed Trusts which then issue one or more classes of notes payable backed by the retail installment contracts.
F-37
Table of Contents
The Company’s continuing involvement with the credit facilities and Trusts are in the form of servicing loans held by the special purpose entities (SPEs) and through holding a residual interest in the SPE. These transactions are structured without recourse. The Trusts are considered VIEs under U.S. GAAP and are consolidated because the Company has: (a) power over the significant activities of the entity and (b) an obligation to absorb losses or the right to receive benefits from the VIE which are potentially significant to the VIE.
The Company has power over the significant activities of those Trusts as servicer of the financial assets held in the Trust. Servicing fees are not considered significant variable interests in the Trusts; however, because the Company also retains a residual interest in the Trust, either in the form of a debt security or equity interest, the Company has an obligation to absorb losses or the right to receive benefits that are potentially significant to the SPE. Accordingly, they are consolidated within the consolidated financial statements, and the associated retail installment contracts, borrowings under credit facilities and securitization notes payable remain on the consolidated balance sheets.
While these Trusts are included in the consolidated financial statements, these subsidiaries are separate legal entities and the retail installment contracts and other assets held by these subsidiaries are legally owned by them and are not available to other creditors.
Cash and Cash Equivalents — For purposes of the consolidated statements of cash flows, the Company considers all highly liquid investments with original maturities of three months or less to be cash equivalents. The Company has maintained balances in various operating and money market accounts in excess of federally insured limits.
Restricted Cash — Cash deposited to support securitization transactions, lockbox collections, and the related required reserve accounts is recorded in the Company’s consolidated balance sheet as restricted cash. Excess cash flows generated by the securitization trusts are added to the restricted cash reserve account, creating additional over-collateralization until the contractual securitization requirement has been reached. Once the targeted reserve requirement is satisfied, additional excess cash flows generated by the Trusts are released to the Company as distributions from the Trusts. Lockbox collections are added to restricted cash and released when transferred to the appropriate warehouse line of credit or Trust.
At December 31, 2011, the Company had $1,158,200 in restricted cash related to sales of common stock. This restricted cash was used to pay down warehouse line borrowings on January 3, 2012.
The Company has several limited guarantees with Santander that provide explicit performance guarantees on certain servicer obligations related to the Company’s warehouse lines of credit and certain securitizations. As a result of those guarantees, the Company was permitted to commingle funds received on contracts that have been included in the securitizations and certain warehouse lines of credit and retain and remit cash to the respective collection accounts once a month prior to the distribution dates. However, the commingling rights were lost during 2012, and no funds were commingled as of December 31, 2012.
Investments — Investments the Company expects to hold for an indefinite period of time are classified as available for sale and carried at fair value with temporary unrealized gains and losses reported as a component of accumulated other comprehensive income within stockholders’ equity, net of estimated income taxes.
Investments of less than 20% ownership in privately held companies over which the Company has no significant influence are recorded using the cost method. Such investments of $6,000 at December 31, 2012, are included in repossessed vehicles and other assets in the accompanying consolidated balance sheets and other investing activities in accompanying consolidated statement of cash flows.
Income Taxes — The Company was included in the consolidated federal tax return of SHUSA through December 30, 2011. Under the tax sharing arrangement with SHUSA, the Company was responsible for federal tax liabilities on a separate return basis.
F-38
Table of Contents
As a result of the common stock sale, as of December 31, 2011, the Company deconsolidated with SHUSA for federal tax return filing purposes. This ownership change also resulted in SCUSA deconsolidating from filings in certain states.
Income tax expense consists of income taxes currently payable and deferred income taxes computed using the asset and liability method. Under the asset and liability method, deferred tax assets and liabilities are recognized for the future tax consequences attributable to differences between the financial statement carrying amounts of existing assets and liabilities and their respective tax basis. The deferred tax asset is subject to reduction by a valuation allowance in certain circumstances. This valuation allowance is recognized if it is more likely than not that some portion or all of the deferred tax asset will not be realized based on a review of available evidence. Deferred tax assets and liabilities are measured using enacted tax rates expected to apply to taxable income in the years in which those temporary differences are expected to be recovered or settled. The effect on deferred tax assets and liabilities of a change in tax rates is recognized in income in the period that includes the enactment date.
Periodic reviews of the carrying amount of deferred tax assets are made to determine if the establishment of a valuation allowance is necessary. If based on the available evidence, it is more likely that not that all or a portion of the Company’s deferred tax assets will not be realized, a deferred tax valuation allowance is established. Consideration is given to all positive and negative evidence related to the realization of the deferred tax assets. Factors considered in this evaluation include historical financial performance, expectation of future earnings of an appropriate character, the ability to carry back losses to recoup taxes previously paid, length of statutory carryforward periods, tax planning strategies, and timing of reversals of temporary differences. Significant judgment is required in assessing future earnings trends and the timing of reversals of temporary differences. The evaluation is based on current tax laws as well as expectations of future performance.
The Company accounts for uncertainty in income taxes recognized in the consolidated financial statements in accordance with FASB ASC 740, Income Taxes, which requires that a more-likely-than-not threshold be met before the benefit of a tax position may be recognized in the financial statements and prescribes how such benefit should be measured. It also provides guidance on derecognition, measurement, classification, interest and penalties, interim accounting periods, disclosure, and transition.
Furniture and Equipment — Furniture and equipment are stated at cost, less accumulated depreciation and amortization. Depreciation is computed using the straight-line method over the estimated useful lives of the respective assets, which range from three to ten years. Leasehold improvements are amortized over the shorter of the lease term or the estimated useful lives of the improvements. Expenditures for major renewals and betterments are capitalized. Repairs and maintenance expenditures are charged to operations as incurred.
Goodwill and Intangibles — Goodwill represents the excess of consideration paid over fair value of net assets acquired in business combinations. Intangibles represent intangible assets purchased or acquired through business combinations, including trade names and software development costs. Certain intangibles are amortized over their estimated useful lives. The Company follows the provisions of FASB ASC 350, Intangibles — Goodwill and Other, which requires that goodwill and indefinite-lived intangibles be tested for impairment at least annually. No impairment expense was recorded in 2012, 2011 or 2010, and no accumulated impairment charges exist for goodwill or long-lived intangible assets.
Inventory of Repossessed Vehicles — Inventory of repossessed vehicles represents vehicles the Company has repossessed due to the borrowers’ default on the payment terms of the contracts. The Company records the vehicles at estimated fair value, net of estimated costs to sell. Repossessed vehicle inventory balances were $82,249 and $88,757 at December 31, 2012 and 2011, respectively.
Derivative Financial Instruments — Derivative financial instruments are recognized as either assets or liabilities in the consolidated balance sheets at fair value. The accounting for changes in the fair value of each
F-39
Table of Contents
derivative financial instrument depends on whether it has been designated and qualifies as a hedge for accounting purposes, as well as the type of hedging relationship identified. The Company does not use derivative instruments for trading or speculative purposes.
Interest Rate Swap Agreements — The Company uses interest rate swaps to hedge the variability of cash flows on securities issued by securitization Trusts and borrowings under the Company’s warehouse lines of credit. Certain interest rate swap agreements are designated and qualify as cash flow hedges and are highly effective in reducing exposure to interest rate risk from both an accounting and an economic perspective.
At hedge inception and at least quarterly, the interest rate swap agreements designated as accounting hedges are assessed to determine their effectiveness in offsetting changes in the cash flows of the hedged items and whether those interest rate swap agreements may be expected to remain highly effective in future periods.
The Company uses change in variable cash flows to assess hedge effectiveness of cash flow hedges on a prospective and retrospective basis. At December 31, 2012, all of the Company’s interest rate swap agreements designated as cash flow hedges are deemed to be effective hedges for accounting purposes. The Company uses the dollar offset method to measure the amount of ineffectiveness and a net earnings impact occurs when the cumulative change in the value of a derivative, as adjusted, is greater than the cumulative change in value of the discounted future cash flows of the forecasted transaction. The excess change in value (the ineffectiveness or over-hedge portion) is recognized in earnings.
The effective portion of the changes in the fair value of the interest rate swaps qualifying as cash flow hedges is included as a component of accumulated other comprehensive loss, net of estimated income taxes, as an unrealized gain or loss on cash flow hedges. These unrealized gains or losses are recognized as adjustments to income over the same period in which cash flows from the related hedged item affect earnings. Additionally, to the extent that any of these contracts are not considered to be perfectly effective in offsetting the change in the value of the cash flows being hedged, any changes in fair value relating to the ineffective portion of these contracts are recognized in interest expense on the consolidated statements of income and comprehensive income. The Company discontinues hedge accounting prospectively when it is determined that an interest rate swap agreement has ceased to be effective as an accounting hedge or if the underlying hedged cash flow is no longer probable of occurring.
The Company has also entered into interest rate swap agreements related to its securitization trusts and warehouse lines of credit that are not designated as hedges. These agreements are intended to reduce the risk of interest rate fluctuations. For the interest rate swap agreements not designated as hedges, any gains or losses are included in the Company’s earnings as a component of interest expense.
Interest Rate Cap Agreements — The Company purchased an interest rate cap agreement to limit floating rate exposures on securities issued in credit facilities. As part of the interest rate risk management strategy and when economically feasible, the Company may simultaneously sell a corresponding written option in order to offset the premium paid to purchase the interest rate cap agreement and thus retain the interest rate risk. Because these instruments entered into directly by the Company or through SPEs are not designated for hedge accounting, changes in the fair value of interest rate cap agreements purchased by the SPEs and written option sold by the Company are recorded in interest expense on the consolidated statements of income and comprehensive income.
Warrants — The Company is the holder of a warrant that gives it the right, if certain vesting conditions are satisfied, to purchase additional shares in a company in which it has a cost method investment. This warrant would allow SCUSA to increase its ownership in the invested company to approximately 25%.
Stock-Based Compensation — In accordance with FASB ASC 718, Stock Compensation, the Company measures the compensation cost of stock-based awards using the estimated fair value of those awards on the grant date, and recognizes the cost as expense over the vesting period of the awards (see Note 20).
F-40
Table of Contents
Recent Accounting Pronouncements —
In April 2011, the FASB issued ASU No. 2011-02, A Creditor’s Determination of Whether a Restructuring is a Troubled Debt Restructuring (ASU 2011-02). ASU 2011-02 clarifies existing guidance used by creditors to determine when a modification represents a concession. ASU 2011-02 was adopted effective in 2011 (see Note 6).
In April 2011, the FASB issued ASU No. 2011-03, Reconsideration of Effective Control for Repurchase Agreements. ASU 2011-03 modifies the criteria for determining when repurchase agreements and other similar agreements would be accounted for as secured financings as opposed to sales with commitments to resell. The guidance in ASU 2011-03 became effective for the Company January 1, 2012, and did not have a significant effect on the Company’s financial position, results of operations or cash flows.
In May 2011, the FASB issued ASU 2011-04, Amendments to Achieve Common Fair Value Measurement and Disclosure Requirement in U.S. GAAP and IFRSs. ASU 2011-04 provides guidance on how fair value should be determined where it is already required or permitted under U.S. GAAP. The guidance clarifies how a principal market is determined, addresses the fair value measurement of instruments with offsetting market or counterparty credit risks and the concept of valuation premise and highest and best use, extends the prohibition on blockage factors to all three levels of the fair value hierarchy, and requires additional disclosures. The amendments to ASC 820 became effective for the Company January 1, 2012, and did not have a significant effect on the Company’s financial position, results of operations, or cash flows.
In June 2011, the FASB issued ASU 2011-05, Comprehensive Income. ASU 2011-05 requires comprehensive income to be reported in either a single statement or in two consecutive statements reporting net income and OCI. The amendments do not change what items are reported in OCI or the requirement to report classification of items from OCI to net income. The guidance became effective for the Company January 1, 2012, except for the amendments relating to reclassification out of accumulated OCI, which were deferred indefinitely by the issuance of ASU 2011-12 in December 2011. As a result of early adoption of ASU 2011-05, as of January 1, 2012, the Company retrospectively changed the presentation of comprehensive income to a single statement with the statement of income (see the consolidated statements of income and comprehensive income and consolidated statements of equity).
In September 2011, the FASB issued ASU 2011-08, Intangibles — Goodwill and Other. ASU 2011-08 requires companies to perform goodwill and indefinite-life intangible asset impairment testing using a two-step process. The amendments to the ASU permits companies to first assess qualitative factors to determine whether it is more likely than not that the fair value of a reporting unit is less than its carrying amount as a basis for determining whether it is necessary to perform the two-step impairment test. The amendments to ASC 350 became effective for the Company on January 1, 2012. The implementation of this guidance did not have a significant effect on the Company’s financial position, results of operations, or cash flows.
In July 2012, the FASB issued ASU 2012-2, Intangibles — Goodwill and Other. ASU 2012-2 is intended to simplify the testing of intangible assets for impairment by permitting an entity the option to first assess qualitative factors to determine whether it is more likely than not that the fair value of indefinite-lived intangible assets is less than its carrying amount. If an entity determines on the basis of the qualitative factors this is the case, then it is required to perform the currently prescribed two-step impairment test described in ASC 350. ASU 2012-2 will become effective for the Company January 1, 2013. The implementation of this guidance is not expected to have a significant effect on the Company’s financial position, results of operations, or cash flows.
In December 2011, the FASB issued ASU 2011-11, Balance Sheet: Disclosures About Offsetting Assets and Liabilities. ASU 2011-11 requires companies to disclose information about offsetting and related arrangements to enable users of its financial statements to understand the effect of those arrangements on its financial position. In January 2013, the FASB issued ASU 2013-01, Balance Sheet: Clarifying the Scope of Disclosures about
F-41
Table of Contents
Offsetting Assets and Liabilities. ASU 2013-01 amends and clarifies the scope of the disclosures required in ASU 2011-11. The amendments to ASC 210 become effective for the Company on January 1, 2013. The Company retroactively applied the guidance to the financial statements for the years ended December 31, 2012 and 2011. See Note 13.
In February 2013, the FASB issued ASU 2013-02, Comprehensive Income: Reporting of Amounts Reclassified out of Accumulated Other Comprehensive Income. ASU 2013-02 requires presenting information about amounts reclassified out of accumulated other comprehensive income and their corresponding effect on net income. This will present, in one place, information about significant amounts reclassified and, in some cases, cross-references to related footnote disclosures. The amendments to ASC 220 will be adopted by the Company beginning January 1, 2013. The implementation of this guidance is not expected to have a significant effect on the Company’s financial position, results of operations, or cash flows.
In February 2013, the FASB issued ASU 2013-03, Clarifying the Scope and Applicability of a Particular Disclosure to Nonpublic Entities. The amendments to ASC 825 clarify that the requirement to disclose “the level of the fair value hierarchy within which the fair value measurements are categorized in their entirety (Level 1, 2, or 3)” does not apply to nonpublic entities for items that are not measured at fair value in the statement of financial position but for which fair value is disclosed. The amendments to ASC 825 become effective for the Company January 1, 2013. The implementation of this guidance is not expected to have a significant effect on the Company’s financial position, results of operations, or cash flows.
| 3. | Equity Transactions |
Investment Agreements
On October 20, 2011, the Company and SHUSA entered into an investment agreement with Auto Finance Holdings. Auto Finance Holdings is jointly owned by investment funds affiliated with Warburg Pincus LLC; Kohlberg Kravis Roberts & Co. L.P.; and Centerbridge Partners L.P. (collectively, the “New Investors”), as well as DFS Sponsor Investments LLC, a Delaware limited liability company affiliated with Mr. Dundon, CEO of SCUSA, and another SCUSA employee. Mr. Dundon is also a director of SCUSA and SHUSA. On October 20, 2011, SCUSA also entered into an investment agreement with DDFS, a Delaware limited liability company affiliated with Mr. Dundon.
On December 31, 2011, SCUSA completed the sale to Auto Finance Holdings of an aggregate number of 32,438,127.19 shares of common stock for an aggregate purchase price of $1 billion. On December 31, 2011, SCUSA also completed the sale to DDFS of 5,140,468.58 additional shares of common stock for aggregate consideration of $158.2 million. In addition, on December 31, 2011, SCUSA completed the sale to certain members of SCUSA’s management of 67,373.99 shares of common stock for notes receivable of approximately $2.1 million.
As a result of these transactions SHUSA, Auto Finance Holdings and DDFS own approximately 65%, 25%, and 10% of SCUSA, respectively, and certain members of management own less than 1%, as of December 31, 2012. The consideration paid by DDFS and SCUSA management was determined by the share price negotiated by SCUSA and Auto Finance Holdings.
Shareholders Agreement
On December 31, 2011, SHUSA, SCUSA, Auto Financing Holdings, DDFS, Mr. Dundon, and Santander entered into a shareholders agreement (the “Shareholders Agreement”). The Shareholders Agreement established certain board representation, governance, registration, and other rights for each investor with respect to their ownership interests in SCUSA. The Shareholders Agreement also requires unanimous approval of all shareholders for certain shareholder reserved matters.
F-42
Table of Contents
Pursuant to the Shareholders Agreement, depending on SCUSA’s performance during 2014 and 2015, if SCUSA exceeds certain performance targets, SCUSA may be required to make a payment of up to $595 million in favor of SHUSA. If SCUSA does not meet such performance targets during 2014 and 2015, SCUSA may be required to make a payment to Auto Finance Holdings of up to the same amount. If an initial public offering (IPO) of SCUSA common stock takes place prior to the due date of the payment (February 29, 2016), the amount of the required payment will be adjusted and SHUSA or Auto Finance Holdings, rather than SCUSA, will be obligated to make the payment. However, if Auto Finance Holdings is no longer a shareholder in SCUSA after the IPO, it will have no obligation to make or right to receive any contingent payment. Any contingent payment made under any of the circumstances described herein will be recorded as an equity transaction and therefore will not be recorded until and unless determined to be due.
The Shareholders Agreement also provides that each of Auto Finance Holdings and DDFS will have the right to sell, and SHUSA will be required to purchase, their respective shares of SCUSA common stock, at its then fair market value, (i) at the fourth, fifth, and seventh anniversaries of the closing of the Investments, unless an IPO of SCUSA common stock has been previously consummated or (ii) in the event there is a deadlock with respect to certain specified matters which require the approval of the board of directors or shareholders of SCUSA.
Also pursuant to the Shareholders’ Agreement, an additional capital contribution from SHUSA to SCUSA would be required if the net change in value from purchase price as of December 31, 2012, of available-for-sale bonds and hedging instruments held by SCUSA at October 31, 2011, plus the net gain (loss) on sale on any such bonds and instruments held by SCUSA at October 31, 2011, and sold prior to December 31, 2012, was a negative amount. The contribution amount was capped at the net depreciation of the bonds and hedging instruments recorded in OCI, net of tax, as of October 31, 2011. As of December 31, 2011, the Company estimated this payment at $0, and, accordingly, no amount was recorded on the Company’s financial statements. As of December 31, 2012, the required payment was determined to be $48,275, the maximum possible amount, and was recorded as an accrued capital contribution and receivable from shareholder, both classified within additional paid-in capital. The payment was received on January 29, 2013.
| 4. | Retail Installment Contracts |
Retail installment contracts at December 31, 2012 and 2011 are comprised as follows:
| December 31, 2012 | ||||||||||||
| Loans Acquired Individually |
Purchased Receivable Portfolios |
Total | ||||||||||
| Gross retail installment contracts |
$ | 14,186,712 | $ | 4,406,891 | $ | 18,593,603 | ||||||
| Loan loss allowance (see Note 5) |
(1,555,362 | ) | (218,640 | ) | (1,774,002 | ) | ||||||
| Discount |
(348,571 | ) | (293,097 | ) | (641,668 | ) | ||||||
| Capitalized origination costs |
25,993 | — | 25,993 | |||||||||
|
|
|
|
|
|
|
|||||||
| Retail installment contracts — net |
$ | 12,308,772 | $ | 3,895,154 | $ | 16,203,926 | ||||||
|
|
|
|
|
|
|
|||||||
| December 31, 2011 | ||||||||||||
| Loans Acquired Individually |
Purchased Receivable Portfolios |
Total | ||||||||||
| Gross retail installment contracts |
$ | 10,007,312 | $ | 8,613,488 | $ | 18,620,800 | ||||||
| Loan loss allowance (see Note 5) |
(993,213 | ) | (215,262 | ) | (1,208,475 | ) | ||||||
| Discount |
(439,217 | ) | (415,701 | ) | (854,918 | ) | ||||||
| Capitalized origination costs |
24,158 | — | 24,158 | |||||||||
|
|
|
|
|
|
|
|||||||
| Retail installment contracts — net |
$ | 8,599,040 | $ | 7,982,525 | $ | 16,581,565 | ||||||
|
|
|
|
|
|
|
|||||||
F-43
Table of Contents
Interest receivable on purchased receivable portfolios totaled $39,955 and $86,972 at December 31, 2012 and 2011, respectively.
Contractual maturities of total retail installment contracts at December 31, 2012, are as follows:
| 2013 |
$ | 1,424,396 | ||
| 2014 |
2,088,906 | |||
| 2015 |
1,467,799 | |||
| 2016 |
2,431,737 | |||
| 2017 |
4,075,904 | |||
| Thereafter |
7,104,861 | |||
|
|
|
|||
| $ | 18,593,603 | |||
|
|
|
Retail installment contracts are collateralized by vehicle titles, and the Company has the right to repossess the vehicle in the event the consumer defaults on the payment terms of the contract. Most of the Company’s retail installment contracts are pledged against warehouse facilities or securitization bonds (see Note 11).
Borrowers on the Company’s retail installment contracts are located in Texas (16%), Florida (10%), California (9%), Georgia (5%), North Carolina (5%), and other states each individually representing less than 5% of the Company’s total retail installment contracts.
A portion of the discount received on contracts purchased from other lenders is attributable to the expectation that not all contractual cash flows will be received from the borrowers. These loans are accounted for in accordance with FASB ASC 310-30, Loans and Debt Securities Acquired with Deteriorated Credit Quality. The excess of the estimated undiscounted principal, interest, and other cash flows expected to be collected over the initial investment in the acquired loans, or accretable yield, is accreted to interest income over the expected life of the loans using the effective interest rate method.
Changes in accretable yield for the years ended December 31, 2012 and 2011 were as follows:
| December 31, 2012 | December 31, 2011 | |||||||
| Balance at beginning of year |
$ | 1,373,174 | $ | 1,796,086 | ||||
| Additions (loans acquired during the year) |
16,338 | 478,077 | ||||||
| Accretion of accretable yield |
(700,362 | ) | (828,902 | ) | ||||
| Transfers from (to) nonaccretable discount, net |
127,704 | (72,087 | ) | |||||
|
|
|
|
|
|||||
| Balance at end of year |
$ | 816,854 | $ | 1,373,174 | ||||
|
|
|
|
|
|||||
During the years ended December 31, 2012, 2011 and 2010, the Company acquired the following loan portfolios for which it was probable at acquisition that all contractually required payments would not be collected. The portfolios were purchased at a discount attributable to this deterioration of expected cash flows.
| December 31, 2012 | December 31, 2011 | December 31, 2010 | ||||||||||
| Contractually required payments for loans acquired during the period |
$ | 142,383 | $ | 4,413,037 | $ | 11,500,951 | ||||||
| Cash flows expected to be collected on loans acquired during the period |
134,681 | 4,307,187 | 10,329,896 | |||||||||
| Unpaid principal balance on loans acquired during the period |
130,270 | 4,086,070 | 9,266,449 | |||||||||
| Recorded basis of loans acquired during the period |
118,343 | 3,829,109 | 8,551,205 | |||||||||
F-44
Table of Contents
| 5. | Loan Loss Allowance and Credit Quality |
Loan Loss Allowance
The Company estimates loan losses on individually acquired loans and loans acquired through purchased portfolios based on delinquency status, the Company’s historical loss experience, estimated values of underlying collateral, and various economic factors. The activity in the loan loss allowance on individually acquired loans for the years ended December 31, 2012 and 2011, was as follows:
| December 31, 2012 | December 31, 2011 | |||||||
| Balance, beginning of year |
$ | 993,213 | $ | 702,999 | ||||
| Provision for credit losses on retail installment contracts |
1,119,074 | 741,559 | ||||||
| Charge-offs |
(1,000,178 | ) | (711,665 | ) | ||||
| Recoveries on charged-off accounts |
443,253 | 260,320 | ||||||
|
|
|
|
|
|||||
| Balance, end of year |
$ | 1,555,362 | $ | 993,213 | ||||
|
|
|
|
|
|||||
During 2012, we enhanced our loss provisioning model for individually acquired retail installment contracts to reflect recent positive economic trends. Based on these trends, we adjusted the volatility factor that is applied to the estimate of losses in determining a range of likely outcomes. The impact of this change was an $82 million decrease in the provision and allowance for loan losses.
The activity in the loan loss allowance related to purchased receivable portfolios for the years ended December 31, 2012 and 2011, was as follows:
| Year Ended December 31, 2012 |
Year Ended December 31, 2011 |
|||||||
| Allowance related to purchased receivable portfolios, beginning of year |
$ | 215,262 | $ | 137,600 | ||||
| Incremental provisions for purchased receivable portfolios |
161,687 | 115,987 | ||||||
| Incremental reversal of provisions for purchased receivable portfolios |
(158,309 | ) | (38,325 | ) | ||||
|
|
|
|
|
|||||
| Allowance related to purchased receivable portfolios, end of year |
$ | 218,640 | $ | 215,262 | ||||
|
|
|
|
|
|||||
Delinquencies
Accounts that are 61 days or more past due are considered delinquent by the Company. The accrual of interest income is suspended on accounts that are 61 days or more past due, and prior accrued interest receivable is reversed. When an account is returned to a performing status of less than 61 days past due, the Company returns to accruing interest on the contract. A summary of delinquencies for the years ended December 31, 2012 and 2011, is as follows:
| December 31, 2012 | ||||||||||||
| Loans Acquired Individually |
Purchased Receivables Portfolios |
Total | ||||||||||
| Principal amount of performing retail installment contracts |
$ | 12,512,411 | $ | 3,390,320 | $ | 15,902,731 | ||||||
| Principal 31-60 days past due |
1,151,099 | 673,856 | 1,824,955 | |||||||||
| Delinquent principal over 60 days |
523,202 | 342,715 | 865,917 | |||||||||
|
|
|
|
|
|
|
|||||||
| Total principal amount of retail installment contracts |
$ | 14,186,712 | $ | 4,406,891 | $ | 18,593,603 | ||||||
|
|
|
|
|
|
|
|||||||
F-45
Table of Contents
| December 31, 2011 | ||||||||||||
| Loans Acquired Individually |
Purchased Receivables Portfolios |
Total | ||||||||||
| Principal amount of performing retail installment contracts |
$ | 8,920,205 | $ | 7,246,740 | $ | 16,166,945 | ||||||
| Principal 31-60 days past due |
743,474 | 942,543 | 1,686,017 | |||||||||
| Delinquent principal over 60 days |
343,633 | 424,205 | 767,838 | |||||||||
|
|
|
|
|
|
|
|||||||
| Total principal amount of retail installment contracts |
$ | 10,007,312 | $ | 8,613,488 | $ | 18,620,800 | ||||||
|
|
|
|
|
|
|
|||||||
FICO® Distribution — A summary of the credit risk profile by Fair Isaac Corporation (FICO®) distribution, determined at origination, as of December 31, 2012 and 2011, was as follows:
| Percent of Portfolio | ||||||||
|
FICO® Band |
December 31, 2012 | December 31, 2011 | ||||||
| >650 |
17.7 | % | 17.7 | % | ||||
| 650-601 |
25.3 | % | 27.9 | % | ||||
| 600-551 |
28.2 | % | 29.4 | % | ||||
| 550-501 |
18.8 | % | 17.0 | % | ||||
| <=500 |
10.0 | % | 8.0 | % | ||||
| 6. | Troubled Debt Restructurings |
The Company periodically agrees to grant a modification involving one or a combination of the following: a reduction in interest rate, a reduction in loan principal balance, an extension of the maturity date or a deferral of a contractual payment to the end of the loan. A change to a loan’s payment terms is considered to be a troubled debt restructuring (TDR) if the concession was granted to the borrower for economic or legal reasons related to the debtor’s financial difficulties and would not otherwise have been considered. As a result of the adoption of ASU 2011-02 on January 1, 2012, management changed its definition of TDRs to include all loans that meet the definition of a modification or are deferred at least twice. Additionally, management believes that all releases of liability in a bankruptcy proceeding represent TDRs.
In prior year the Company classified only certain loans that had been modified as TDRs, excluding certain other modifications and all deferrals. The disclosures of unpaid principal balance, recorded investment, number of contracts, and subsequent defaults as of and for the year ended December 31, 2011, have not been retrospectively adjusted. Because the Company’s standard loan loss provision methodology results in an allowance not significantly different from the amount required for TDRs, the adoption of ASU 2011-02 did not have a material impact on the provision for credit losses or the allowance for loan losses.
A summary of the Company’s performing and nonperforming TDRs at December 31, 2012 and 2011, is as follows:
| December 31, 2012 | December 31, 2011 | |||||||
| Performing debt restructure |
$ | 1,243,640 | $ | 145,860 | ||||
| Nonperforming debt restructure |
239,440 | 17,666 | ||||||
|
|
|
|
|
|||||
| Total TDR loans |
$ | 1,483,080 | $ | 163,526 | ||||
|
|
|
|
|
|||||
F-46
Table of Contents
A loan that has been classified as a TDR remains so until the loan is liquidated through payoff or chargeoff. Consistent with other of the Company’s loans, TDRs are placed on nonaccrual status when the account becomes past due 61 days or more, and return to accrual status when the account is under 61 days past due. Average recorded investment and income recognized on TDR loans for the years ended December 31, 2012 and 2011, are as follows:
| December 31, 2012 | December 31, 2011 | |||||||
| Average outstanding recorded investment in TDRs |
$ | 1,257,446 | $ | 153,263 | ||||
| Interest income recognized |
$ | 171,878 | $ | 12,569 | ||||
TDR Impact on Allowance for Loan Losses
Prior to a loan being classified as a TDR, the Company generally estimates an appropriate allowance for loan loss based on delinquency status, the Company’s historical loss experience, estimated values of underlying collateral, and various economic factors, as described in Note 5. Once a loan has been classified as a TDR, impairment generally is measured based on present value of expected future cash flows considering all available evidence, including collateral values.
Selected information for loans that were newly classified as TDRs for the twelve month periods ended December 31, 2012 and 2011, is as follows:
| Troubled Debt Restructurings: | Year Ended December 31, 2012 |
Year Ended December 31, 2011 |
||||||
| Outstanding recorded investment before TDR |
$ | 955,088 | $ | 106,237 | ||||
| Outstanding recorded investment after TDR |
$ | 949,883 | $ | 103,210 | ||||
| Number of contracts |
66,883 | 8,621 | ||||||
| Troubled debt restructurings that subsequently defaulted |
$ | 362,308 | $ | 70,161 | ||||
| Number of contracts |
26,645 | 6,486 | ||||||
| 7. | Sales of Retail Installment Contracts |
The Company structures its securitization transactions so that they do not meet the criteria for sale of retail installment contracts. Accordingly, in connection with a securitization, the retail installment contracts are transferred to special-purpose finance subsidiaries of SCUSA and the related securitization debt issued by the special-purpose finance subsidiaries remains on the Company’s consolidated balance sheets. While these subsidiaries are included in the Company’s consolidated financial statements, they are separate legal entities and the retail installment contracts and other assets held are legally owned by them. The securitized retail installment contracts are available to satisfy the related securitization debt and are not available to creditors of SCUSA or its other subsidiaries.
The Company recognizes finance charges and fee income on the retail installment contracts and interest expense on the debt issued in the securitization transactions, and records a provision for loan losses to cover probable future losses on the contracts. The Company securitized $9,197,555, $10,448,897 and $10,310,887 of vehicle retail installment contracts under secured financings in 2012, 2011, and 2010, respectively. Additionally, the Company issued notes payable related to securitized retail installment contracts of $8,023,840, $10,424,594 and $7,729,508 in 2012, 2011 and 2010, respectively.
| 8. | Receivables from Lenders |
The Company periodically enters into financing agreements with other lenders. These agreements are collateralized by retail installment contracts. These agreements are treated as financings in the Company’s consolidated financial statements.
F-47
Table of Contents
In 2010, the Company entered into a residual warehouse credit facility arrangement with committed borrowings up to $100,000. The facility has a maturity date of December 31, 2019, and bears variable interest rate at LIBOR plus a margin. Per the amended and restated loan and servicing agreement dated December 31, 2012, if the borrower fails to offer a specified percentage of its retail installment contracts to the Company, the credit limit of $100,000 can be reduced to $25,000 or the margin on the facility will increase (at the borrower’s option). The facility balance was $25,000 and $100,000 at December 31, 2012 and 2011, respectively.
Additionally, the Company maintains a revolving floor plan inventory credit facility agreement with the third party with committed borrowings up to $52,520. At December 31, 2012 and 2011, the revolving credit facility balance was $36,894 and $34,138, respectively, and was collateralized by a security interest in automobile inventory totaling $270,733 and $138,975, respectively.
| 9. | Investments Available for Sale |
The amortized cost and estimated fair value of the Company’s available-for-sale investments are as follows:
| December 31, 2012 | ||||||||||||||||
| Amortized Cost | Gross Unrealized Gains |
Gross Unrealized Losses |
Estimated Fair Value |
|||||||||||||
| Asset-backed securities |
$ | 90,355 | $ | 5,245 | $ | — | $ | 95,600 | ||||||||
| December 31, 2011 | ||||||||||||||||
| Amortized Cost | Gross Unrealized Gains |
Gross Unrealized Losses |
Estimated Fair Value |
|||||||||||||
| Asset-backed securities |
$ | 175,087 | $ | 13,212 | $ | — | $ | 188,299 | ||||||||
A portion of these investments was eligible collateral under the Federal Reserve Bank of New York’s Term Asset-Backed Securities Loan Facility (TALF) and was pledged as collateral under the Company’s related borrowing until the borrowing was paid off in July 2012. As of December 31, 2012, $83,770 of the investments was pledged as collateral for a repurchase facility (see Note 11).
The weighted-average interest rate and contractual maturity by year on these investments at December 31, 2012, were as follows:
| 2014, 3.73% |
$ | 7,793 | ||
| 2015, 9.45% |
66,789 | |||
| 2016, 9.45% |
15,773 | |||
|
|
|
|||
| Investments available for sale $ |
$ | 90,355 | ||
|
|
|
F-48
Table of Contents
| 10. | Goodwill and Intangibles |
The carrying amount of goodwill for the years ended December 31, 2012 and 2011, was unchanged.
For each of the years ended December 31, 2012, 2011 and 2010, goodwill amortization of $5,463 was deductible for tax purposes. The components of intangible assets at December 31, 2012 and 2011, were as follows:
| December 31, 2012 | ||||||||||||||||
| Useful Life | Gross Carrying Amount |
Accumulated Amortization |
Net Carrying Value |
|||||||||||||
| Amortized intangible assets: |
||||||||||||||||
| Customer relationships |
10 years | $ | 12,400 | $ | (5,683 | ) | $ | 6,717 | ||||||||
| Software and technology |
3 years | 10,293 | (2,666 | ) | 7,627 | |||||||||||
| Trademarks |
3 years | 2,347 | (2,347 | ) | — | |||||||||||
| Intangible assets not subject to amortization — trademarks |
38,300 | — | 38,300 | |||||||||||||
|
|
|
|
|
|
|
|||||||||||
| Total |
$ | 63,340 | $ | (10,696 | ) | $ | 52,644 | |||||||||
|
|
|
|
|
|
|
|||||||||||
| December 31, 2011 | ||||||||||||||||
| Useful Life | Gross Carrying Amount |
Accumulated Amortization |
Net Carrying Value |
|||||||||||||
| Amortized intangible assets: |
||||||||||||||||
| Customer relationships |
10 years | $ | 12,400 | $ | (4,443 | ) | $ | 7,957 | ||||||||
| Software and technology |
3 years | 10,849 | (6,322 | ) | 4,527 | |||||||||||
| Trademarks |
3 years | 2,347 | (1,760 | ) | 587 | |||||||||||
| Intangible assets not subject to amortization — trademarks |
38,300 | — | 38,300 | |||||||||||||
|
|
|
|
|
|
|
|||||||||||
| Total |
$ | 63,896 | $ | (12,525 | ) | $ | 51,371 | |||||||||
|
|
|
|
|
|
|
|||||||||||
Amortization expense on the assets was $5,487, $4,836 and $4,942 for the years ended December 31, 2012, 2011 and 2010, respectively. Estimated future amortization expense is as follows:
| 2013 |
$ | 4,685 | ||
| 2014 |
4,104 | |||
| 2015 |
2,558 | |||
| 2016 |
1,240 | |||
| 2017 |
1,240 | |||
| Thereafter |
517 | |||
|
|
|
|||
| $ | 14,344 | |||
|
|
|
The weighted-average useful life for the Company’s amortizing intangible assets was 6.3 years and 7.3 years at December 31, 2012 and 2011, respectively.
F-49
Table of Contents
| 11. | Debt |
The following tables present information regarding SCUSA borrowings and other debt obligations as of December 31, 2012 and 2011:
| December 31, 2012 | ||||||||||||||||||||
| Balance | Credit Limit |
Effective Rate |
Assets Pledged |
Restricted Cash Pledged |
||||||||||||||||
| Notes Payable |
||||||||||||||||||||
| Warehouse lines with Santander and related subsidiaries, due December 2015 (a) |
$ | 1,385,000 | $ | 4,500,000 | 1.65 | % | $ | 311,475 | $ | — | ||||||||||
| Warehouse line, due March 2013 |
228,123 | 228,123 | 1.33 | % | 468,425 | 11,127 | ||||||||||||||
| Warehouse line, due May 2013 |
239,800 | 500,000 | 0.81 | % | 335,847 | — | ||||||||||||||
| Warehouse line (b) |
45,600 | 1,918,236 | 0.95 | % | 57,005 | 204 | ||||||||||||||
| Warehouse line, due June 2014 |
600,300 | 1,500,000 | 0.91 | % | 740,356 | 17,169 | ||||||||||||||
| Warehouse line, due December 2014 |
256,600 | 500,000 | 0.90 | % | 316,182 | 6,051 | ||||||||||||||
| Warehouse line, due May 2016 |
81,764 | 81,764 | 0.96 | % | 96,248 | 6,057 | ||||||||||||||
| Repurchase facility, due April 2013 (c) |
847,366 | 847,366 | 1.32 | % | 83,770 | 30,052 | ||||||||||||||
|
|
|
|
|
|
|
|
|
|||||||||||||
| Total facilities with third parties |
2,299,553 | 5,575,489 | 2,097,833 | 70,660 | ||||||||||||||||
|
|
|
|
|
|
|
|
|
|||||||||||||
| Total notes payable |
$ | 3,684,553 | $ | 10,075,489 | $ | 2,409,308 | $ | 70,660 | ||||||||||||
|
|
|
|
|
|
|
|
|
|||||||||||||
| Notes payable related to securitized retail installment contracts |
$ | 12,543,442 | 2.03 | % | $ | 15,876,333 | $ | 1,093,648 | ||||||||||||
| December 31, 2011 | ||||||||||||||||||||
| Balance | Credit Limit |
Effective Rate |
Assets Pledged |
Restricted Cash Pledged |
||||||||||||||||
| Notes Payable |
||||||||||||||||||||
| Warehouse line with Santander and related subsidiaries, due December 2015 (a) |
$ | 2,047,800 | $ | 4,500,000 | 2.06 | % | $ | 289,678 | $ | 1,157,661 | ||||||||||
| Warehouse line, due March 2013 |
346,365 | 228,123 | 1.35 | % | 571,774 | 3,688 | ||||||||||||||
| Warehouse line, due May 2013 |
258,700 | 500,000 | 1.25 | % | 289,266 | — | ||||||||||||||
| Warehouse line (b) |
272,200 | 1,918,236 | 2.15 | % | 334,624 | 1 | ||||||||||||||
| Warehouse line, due June 2014 |
731,100 | 1,500,000 | 1.28 | % | 797,151 | — | ||||||||||||||
| Warehouse line, due December 2014 |
386,900 | 500,000 | 1.07 | % | 427,608 | — | ||||||||||||||
| Warehouse line, due May 2016 |
— | 81,764 | — | — | ||||||||||||||||
| Repurchase facility, matured March 2012 |
223,340 | 223,340 | 2.05 | % | — | — | ||||||||||||||
|
|
|
|
|
|
|
|
|
|||||||||||||
| Total facilities with third parties |
2,218,605 | 4,951,463 | 2,420,423 | 3,689 | ||||||||||||||||
|
|
|
|
|
|
|
|
|
|||||||||||||
| Total notes payable |
$ | 4,266,405 | $ | 9,451,463 | $ | 2,710,101 | $ | 1,161,350 | ||||||||||||
|
|
|
|
|
|
|
|
|
|||||||||||||
| Notes payable related to securitized retail installment contracts |
$ | 12,436,984 | 2.25 | % | $ | 14,968,051 | $ | 381,721 | ||||||||||||
|
|
|
|
|
|
|
|||||||||||||||
| TALF |
$ | 87,129 | 2.93 | % | $ | 188,299 | $ | — | ||||||||||||
|
|
|
|
|
|
|
|||||||||||||||
| (a) | These lines also are collateralized by securitization notes payable and residuals retained by the Company. As of December 31, 2012 and 2011, $334,400 and $70,119 of the warehouse lines were unsecured, respectively. |
F-50
Table of Contents
| (b) | One-fourth of the outstanding capacity on this facility matures on each of the following dates: March 21, 2013; November 22, 2013; March 21, 2014; and November 21, 2014. |
| (c) | The repurchase facilities are also collateralized by securitization bonds and residuals retained by the Company. No portions of these facilities are unsecured. |
Notes Payable — Warehouse Lines and Repurchase Facilities
Except for the unsecured portion of the warehouse line with Santander, the warehouse lines and repurchase facility are fully collateralized by a designated portion of the Company’s retail installment contracts (see Note 4), residuals on securitization notes payable and securitization notes payable retained by the Company. The repurchase facility is also collateralized by the Company’s available-for-sale securities (see Note 9). The Company was in compliance with all covenants related to these financing arrangements at December 31, 2012 and 2011.
Notes Payable Related to Securitized Retail Installment Contracts
Notes payable related to securitized retail installment contracts are structured as secured financings. The principal and interest on these notes are paid using the cash flows from the underlying retail installment contracts, which serve as collateral for the notes. Accordingly, the timing of the principal payments on these notes is dependent on the payments received on the underlying retail installment contracts, which back the notes. The weighted-average interest rate and final contractual maturity by year on these notes at December 31, 2012, were as follows:
| 2013, |
0.30% | $ | 487,338 | |||
| 2014, |
1.72% | 726,822 | ||||
| 2015, |
1.15% | 3,282,900 | ||||
| 2016, |
1.74% | 2,150,823 | ||||
| 2017, |
2.61% | 3,256,584 | ||||
| Thereafter, |
3.05% | 2,668,832 | ||||
|
|
|
|||||
| 12,573,299 | ||||||
| Less unamortized debt issuance costs |
29,857 | |||||
|
|
|
|||||
| Notes payable related to securitized retail installment contracts |
$ | 12,543,442 | ||||
|
|
|
|||||
Unamortized debt issuance costs are amortized as interest expense over the terms of the related notes payable using a method that approximates the interest method. Amortization of the purchase accounting adjustment on acquired notes payable is also included in interest expense using a method that approximates the interest method, over the estimated remaining life of the acquired notes. Total interest expense on the securitized notes for 2012, 2011 and 2010, was $229,746, $178,993 and $100,269, respectively.
TALF Loan Payable
The Company’s TALF loan was obtained under the TALF program and was collateralized by the investments available for sale. The principal and interest on the loan were paid using the cash flows from the underlying investments available for sale. Accordingly, the timing of the principal payments on this loan was dependent on the payments received on the underlying investments available for sale. Total interest expense on the loan payable was $999, $3,711 and $5,816 for the years ended December 31, 2012, 2011 and 2010, respectively. The loan had a weighted-average fixed interest rate of 2.93% and 2.42% at December 31, 2011 and 2010, respectively, and was paid off in 2012.
F-51
Table of Contents
| 12. | Securitization Activity |
A summary of the cash flows received from securitization trusts during the years ended December 31, 2012, 2011 and 2010, is as follows:
| 2012 | 2011 | 2010 | ||||||||||
| Receivables securitized |
$ | 9,197,555 | $ | 10,448,897 | $ | 10,310,887 | ||||||
| Gross proceeds from new securitizations |
$ | 8,023,840 | $ | 10,424,594 | $ | 7,729,508 | ||||||
| Cash flows received on subordinated holdings |
— | — | 5,205 | |||||||||
| Cash received for servicing fees |
420,315 | 287,654 | 163,080 | |||||||||
| Cash received upon release from reserved and restricted cash accounts |
38,693 | 26,995 | 151,751 | |||||||||
|
|
|
|
|
|
|
|||||||
| Total cash received from securitization trusts |
$ | 8,482,848 | $ | 10,739,243 | $ | 8,049,544 | ||||||
|
|
|
|
|
|
|
|||||||
The Company retains servicing responsibility for receivables transferred to the Trusts. Included in servicing fee income is a monthly servicing fee on the outstanding principal balance. Supplemental fees, such as late charges, for servicing the receivables are reflected in fees, commissions and other income. As of December 31, 2012 and 2011, the Company was servicing $15,876,333 and $14,968,051, respectively, of gross retail installment contracts that have been transferred to the Trusts.
| 13. | Derivative Financial Instruments |
The Company has interest rate swap agreements that were designated as hedges for accounting purposes with underlying notional amounts of $2,321,085 and $4,753,525 at December 31, 2012 and 2011, respectively. The aggregate fair value of these interest rate swap agreements was a liability of $20,759 and $32,395 at December 31, 2012 and 2011, respectively, and is included in other liabilities on the Company’s consolidated balance sheets.
The Company also has interest rate swap agreements that are not designated as hedges for accounting purposes with underlying notional amounts of $2,712,711 and $4,171,822 at December 31, 2012 and 2011, respectively. The aggregate fair value of these interest rate swap agreements was a liability of $52,546 and $61,373 at December 31, 2012 and 2011, respectively. These amounts are also included in other liabilities on the Company’s consolidated balance sheets.
The Company has an interest rate cap agreement that is not designated as a hedge for accounting purposes with an underlying notional amount of $1,169,707 as of December 31, 2012. The aggregate fair value of the interest rate cap agreement was a liability of $49 at December 31, 2012. The Company also has a corresponding written option in order to offset the premium paid to purchase the interest rate cap agreement with an underlying notional amount of $1,169,707 as of December 31, 2012. The aggregate fair value of the written option was an asset of $49 at December 31, 2012.
Information on the offsetting of derivative assets and derivative liabilities due to the right of offset is as follows, as of December 31, 2012 and 2011:
| December 31, 2012 | ||||||||||||||
| (Amounts in thousands) | ||||||||||||||
| Gross Amount of Recognized Liabilities |
Gross Amounts Offset in the Consolidated Balance Sheet |
Net Amounts of Liabilities Presented in the Consolidated Balance Sheet |
||||||||||||
| Interest rate swaps |
$ | 73,305 | $ | — | $ | 73,305 | ||||||||
| Interest rate caps |
49 | (49 | ) | — | ||||||||||
|
|
|
|
|
|
|
|||||||||
| Derivatives |
$ | 73,354 | $ | (49 | ) | $ | 73,305 | |||||||
|
|
|
|
|
|
|
|||||||||
F-52
Table of Contents
| Net Amount of Liabilities in the Consolidated Balance Sheet |
Gross Amounts Not Offset in the Consolidated Balance Sheet |
Net Amount | ||||||||||||||
| Financial Instruments | Cash Collateral Received | |||||||||||||||
| Counterparty — Santander |
$ | 71,684 | $ | (71,684 | ) | $ | — | $ | — | |||||||
| Counterparty — third party |
1,621 | (1,621 | ) | — | — | |||||||||||
|
|
|
|
|
|
|
|
|
|||||||||
| Derivatives |
$ | 73,305 | $ | (73,305 | ) | $ | — | $ | — | |||||||
|
|
|
|
|
|
|
|
|
|||||||||
| December 31, 2011 | ||||||||||||||||
| (Amounts in thousands) | ||||||||||||||||
| Gross Amount of Recognized Liabilities |
Gross Amounts Offset in the Consolidated Balance Sheet |
Net Amounts of Liabilities Presented in the Consolidated Balance Sheet |
||||||||||||||
| Interest rate swaps |
$ | 96,756 | $ | (2,988 | ) | $ | 93,768 | |||||||||
| Interest rate caps |
1,266 | (1,266 | ) | — | ||||||||||||
|
|
|
|
|
|
|
|||||||||||
| Derivatives |
$ | 98,022 | $ | (4,254 | ) | $ | 93,768 | |||||||||
|
|
|
|
|
|
|
|||||||||||
| Net Amount of Liabilities in the Consolidated Balance Sheet |
Gross Amounts Not Offset in the Consolidated Balance Sheet |
Net Amount | ||||||||||||||
| Financial Instruments | Cash Collateral Received | |||||||||||||||
| Counterparty — Santander |
$ | 88,651 | $ | (88,651 | ) | $ | — | $ | — | |||||||
| Counterparty — third party |
5,117 | (5,117 | ) | — | — | |||||||||||
|
|
|
|
|
|
|
|
|
|||||||||
| Derivatives |
$ | 93,768 | $ | (93,768 | ) | $ | — | $ | — | |||||||
|
|
|
|
|
|
|
|
|
|||||||||
The Company is the holder of a warrant that gives it the right, if certain vesting conditions are satisfied, to purchase additional shares in a company in which it has a cost method investment. This warrant was issued in 2012 and is carried at its estimated fair value of zero at December 31, 2012.
Gross losses reclassified from accumulated OCI to income and gross losses recognized in income are included as components of interest expense. The Company’s interest rate swap agreements had effects on its consolidated statements of income and comprehensive income for the years ended December 31, 2012, 2011, and 2010, as follows:
| For the Year Ended December 31, 2012 | ||||||||||||
| Gross Gains (Losses) Recognized in Interest Expense |
Gross Gains (Losses) Recognized in Accumulated Other Comprehensive Income |
Gross Gains (Losses) Reclassified From Accumulated Other Comprehensive Income to Interest Expense |
||||||||||
| Interest rate swap agreements designated as hedges |
$ | — | $ | (11,709 | ) | $ | (26,190 | ) | ||||
|
|
|
|
|
|
|
|||||||
| Interest rate swap agreements not designated as hedges |
$ | (8,326 | ) | |||||||||
|
|
|
|||||||||||
F-53
Table of Contents
| For the Year Ended December 31, 2011 | ||||||||||||
| Gross Gains (Losses) Recognized in Interest Expense |
Gross Gains (Losses) Recognized in Accumulated Other Comprehensive Income |
Gross Gains (Losses) Reclassified From Accumulated Other Comprehensive Income to Interest Expense |
||||||||||
| Interest rate swap agreements designated as hedges |
$ | — | $ | (39,557 | ) | $ | (30,305 | ) | ||||
|
|
|
|
|
|
|
|||||||
| Interest rate swap agreements not designated as hedges |
$ | (88,591 | ) | |||||||||
|
|
|
|||||||||||
| For the Year Ended December 31, 2010 | ||||||||||||
| Gross Gains (Losses) Recognized in Interest Expense |
Gross Gains (Losses) Recognized in Accumulated Other Comprehensive Income |
Gross Gains (Losses) Reclassified From Accumulated Other Comprehensive Income to Interest Expense |
||||||||||
| Interest rate swap agreements designated as hedges |
$ | (292 | ) | $ | (78,543 | ) | $ | (68,016 | ) | |||
|
|
|
|
|
|
|
|||||||
| Interest rate swap agreements not designated as hedges |
$ | (931 | ) | |||||||||
|
|
|
|||||||||||
The Company estimates that approximately $13 million of unrealized losses included in accumulated other comprehensive loss will be reclassified into earnings within the next twelve months.
The ineffectiveness related to the interest rate swap agreements designated as hedges was not material for the years ended December 31, 2012, 2011 and 2010.
| 14. | Income Taxes |
The components of the provision for income taxes for the years ended December 31, 2012, 2011 and 2010, were as follows:
| 2012 | 2011 | 2010 | ||||||||||
| Current income tax expense: |
||||||||||||
| Federal |
$ | 610,161 | $ | 417,767 | $ | 499,632 | ||||||
| State |
39,642 | 43,064 | 38,748 | |||||||||
|
|
|
|
|
|
|
|||||||
| Total current income tax expense |
649,803 | 460,831 | 538,380 | |||||||||
| Deferred income tax expense (benefit): |
||||||||||||
| Federal |
(183,313 | ) | 2,684 | (239,688 | ) | |||||||
| State |
(12,875 | ) | 519 | (20,748 | ) | |||||||
|
|
|
|
|
|
|
|||||||
| Total deferred income tax expense (benefit) |
(196,188 | ) | 3,203 | (260,436 | ) | |||||||
|
|
|
|
|
|
|
|||||||
| Total income tax expense |
$ | 453,615 | $ | 464,034 | $ | 277,944 | ||||||
|
|
|
|
|
|
|
|||||||
F-54
Table of Contents
The reconciliation of the federal statutory income tax rate to the Company’s effective income tax rates for the years ended December 31, 2012, 2011 and 2010, is as follows:
| 2012 | 2011 | 2010 | ||||||||||
| Federal statutory rate |
35.0 | % | 35.0 | % | 35.0 | % | ||||||
| State and local income taxes — net of federal income tax benefit |
2.4 | % | 2.2 | % | 2.3 | % | ||||||
| Valuation allowance |
1.9 | % | — | — | ||||||||
| Other |
-1.1 | % | -0.1 | % | 1.5 | % | ||||||
|
|
|
|
|
|
|
|||||||
| Effective income tax rate |
38.2 | % | 37.1 | % | 38.8 | % | ||||||
|
|
|
|
|
|
|
|||||||
The Company is a party to a tax sharing agreement requiring that the unitary state tax liability among affiliates included in unitary state tax returns be allocated using the hypothetical separate company tax calculation method. At December 31, 2012, the Company had a net payable to affiliates under the tax sharing agreement of $659, which was included in Federal, state, and other income taxes payable in the consolidated balance sheet. At December 31, 2011, the Company had a federal income tax receivable from its parent, SHUSA, totaling $10,009, which was included in receivable from SHUSA in the consolidated balance sheet.
The tax effect of temporary differences between the financial reporting and income tax-basis of assets and liabilities at December 31, 2012 and 2011, are as follows:
| 2012 | 2011 | |||||||
| Deferred tax assets: |
||||||||
| Debt issuance costs |
$ | 4,886 | $ | 4,797 | ||||
| Allowance for loan losses |
371,429 | 187,313 | ||||||
| Receivables from lenders |
— | 18,010 | ||||||
| Mark-to-market adjustments |
18,918 | 22,494 | ||||||
| Original purchase discount on investments |
116,310 | 81,137 | ||||||
| Capital loss carryforwards |
24,108 | — | ||||||
| Basis difference in consolidated VIEs |
8,991 | — | ||||||
| Other |
16,973 | 13,415 | ||||||
|
|
|
|
|
|||||
| Total gross deferred assets |
561,615 | 327,166 | ||||||
|
|
|
|
|
|||||
| Deferred tax liabilities: |
||||||||
| Capitalized origination costs |
(14,189 | ) | (8,159 | ) | ||||
| Goodwill |
(6,767 | ) | (4,800 | ) | ||||
| Furniture and equipment |
(6,784 | ) | (1,639 | ) | ||||
| Other |
(5,227 | ) | (1,078 | ) | ||||
|
|
|
|
|
|||||
| Total gross deferred tax liabilities |
(32,967 | ) | (15,676 | ) | ||||
|
|
|
|
|
|||||
| Valuation allowance |
(22,381 | ) | — | |||||
|
|
|
|
|
|||||
| Net deferred tax assets |
$ | 506,267 | $ | 311,490 | ||||
|
|
|
|
|
|||||
As of December 31, 2012, the Company had recorded a valuation allowance for capital loss carryforwards for which it does not have a tax-planning strategy in place to recognize before their expiration in 2017. A rollforward of the valuation allowance for the years ended December 31, 2012 and 2011 is as follows:
| 2012 | 2011 | |||||||
| Valuation allowance, beginning of year |
$ | — | — | |||||
| Provision |
22,381 | — | ||||||
|
|
|
|
|
|||||
| Valuation allowance, end of year |
$ | 22,381 | — | |||||
|
|
|
|
|
|||||
F-55
Table of Contents
A reconciliation of the beginning and ending balances of gross unrecognized tax benefits is as follows:
| Gross unrecognized tax benefits balance, January 1, 2011 |
$ | 130,712 | ||
| Additions based on tax positions related to 2011 |
1,772 | |||
| Reductions for tax positions of prior years |
(130,001 | ) | ||
|
|
|
|||
| Gross unrecognized tax benefits balance, December 31, 2011 |
$ | 2,483 | ||
| Reductions as a result of a lapse of the applicable statute of limitations |
(164 | ) | ||
| Settlements |
(173 | ) | ||
|
|
|
|||
| Gross unrecognized tax benefits balance, December 31, 2012 |
$ | 2,146 | ||
|
|
|
Accrued interest and penalties associated with uncertain tax positions are recognized as a component of the income tax provision. Accrued interest and penalties of $752 and $660 are included with the related tax liability line in the accompanying consolidated balance sheets as of December 31, 2012 and 2011, respectively.
At December 31, 2012, the Company believes that it is reasonably possible that the balance of the gross unrecognized tax benefits could decrease by $490 to $1,656 in the next twelve months due to ongoing activities with various taxing jurisdictions that the Company expects may give rise to settlements or the expiration of statute of limitations. The Company continually evaluates expiring statutes of limitations, audits, proposed settlements, changes in tax law and new authoritative rulings.
The Company is subject to examination by federal and state taxing authorities. Periods subsequent to December 31, 2007, are open for audit by the Internal Revenue Service (IRS). The SHUSA consolidated return, of which the Company is a part, is currently under IRS examination for the period 2008-2010. Periods subsequent to December 31, 2005, are open for audit by various state taxing authorities.
| 15. | Servicing Fee Income |
The Company is a party to various servicing agreements, including an agreement with Sovereign Bank (“Sovereign”), a subsidiary of SHUSA, to service vehicle retail installment contracts and recreational and marine vehicle portfolios. At December 31, 2012 and 2011, total serviced portfolios were $2,474,429 and $3,557,984, respectively, of which the Sovereign portfolios were $1,673,110 and $2,524,750, respectively.
In 2010, the Company entered into two third-party servicing agreements to service approximately $12.7 billion of vehicle retail installment contracts. One of these servicing agreements was terminated in August 2010. The other servicing agreement was terminated in December 2011, because the portfolio was transferred to two entities consolidated in the Company’s financial statements (see Note 16).
Servicing fee income and receivable and cash collections received and payable to investor on the serviced portfolios as of and for the years ended December 31, 2012 and 2011, were as follows:
| 2012 | 2011 | |||||||
| Cash collections due to owner |
$ | 59,067 | $ | 98,513 | ||||
| Servicing fees |
$ | 29,270 | $ | 244,323 | ||||
| Servicing fees receivables |
$ | 4,471 | $ | 11,992 | ||||
Servicing fee income for the year ended December 31, 2010, totaled $173,882, of which $32,236 was related to the agreement with Sovereign.
| 16. | Noncontrolling Interest |
In December 2011, SCUSA entered into servicing agreements with Auto Loan Acquisition 2011-A LLC (“ALA-A”) and Auto Loan Acquisition 2011-B LLC (“ALA-B”), Delaware limited liability companies, two entities that
F-56
Table of Contents
were determined to be VIEs. Two investors in Auto Finance Holdings are the equity investors in the VIEs. Although SCUSA has no equity interest in the VIEs, it has variable interests in the VIEs including the servicing agreements and the original investment in subordinated bonds with the face value of $360,000 by the VIEs. Because the Company has the power, through execution of the servicing agreements, to direct the activities of the VIEs that have the most impact on the VIEs’ performance, and has the potential to absorb losses of the entities because of the investment in the bonds, SCUSA is considered the primary beneficiary. Accordingly, these VIEs are consolidated in SCUSA’s consolidated financial statements.
The VIEs are treated as partnerships for federal income tax purposes. The agreements establishing the VIEs state that the Company’s investment in the Class E Bonds is to be treated as equity for federal income tax purposes. The Company has indemnified the other partners for their cumulative tax liability related to their investments in the VIEs. Payments made under this indemnification agreement totaled $28,080 during the year ended December 31, 2012, and $27,825 was recorded as a receivable and included in other assets as of that date.
During 2012, based on updated cash flow projections, the Company determined that it did not expect to receive all of the servicing fees accrued under the terms of the servicing agreements, or the interest accrued on those servicing fees, and recorded impairment totaling $121,185.
The Company did not provide any financial support that it was not contractually obligated to provide for the years ended December 31, 2012 and 2011.
The following table sets forth the carrying amounts of the assets and liabilities of ALA-A and ALA-B, and the Company’s maximum exposure to loss in these VIEs:
| Year Ended December 31, 2012 |
Year Ended December 31, 2011 |
|||||||
| Carrying amount of assets |
$ | 1,526,919 | $ | 3,335,835 | ||||
| Carrying amount of liabilities |
1,479,212 | 3,294,618 | ||||||
| Maximum exposure to loss: |
||||||||
| Investment in bonds |
285,554 | 286,396 | ||||||
| Interest receivable on bonds |
31,760 | 2,480 | ||||||
| 17. | Commitments and Contingencies |
The Company has entered into various operating leases, primarily for office space and computer equipment. Lease expense incurred totaled $4,934, $6,468 and $8,459 during 2012, 2011 and 2010, respectively. The remaining obligations under the lease commitments at December 31, 2012, are as follows:
| 2013 |
$ | 4,893 | ||
| 2014 |
4,348 | |||
| 2015 |
4,133 | |||
| 2016 |
3,140 | |||
| 2017 |
2,575 | |||
| Thereafter |
— | |||
|
|
|
|||
| $ | 19,089 | |||
|
|
|
In connection with the sale of retail installment contracts through securitizations, the Company has made standard representations and warranties customary to the consumer finance industry. Violations of these representations and warranties may require the Company to repurchase loans previously sold. As of December 31, 2012, the Company had no repurchase requests outstanding. In the opinion of management, the potential exposure of other recourse obligations related to the Company’s retail installment contract sales agreements will not have a material adverse effect on the Company’s consolidated financial position, results of operations, or cash flows.
F-57
Table of Contents
The Company has letters of credit commitments by Santander — NY totaling $500,000 at December 31, 2012 and 2011. The amount issued was zero and $285,900 as of December 31, 2012 and 2011, respectively. The letters of credit are collateral for the Santander Drive 2010-H securitization reserves and certain warehouse agreements. These letters of credit will expire December 31, 2013.
Santander has provided guarantees on the covenants, agreements, and obligations of the Company under the governing documents of the securitizations where SCUSA is a party for the securitizations. This includes, but is not limited to, the obligations of SCUSA as servicer and transferor to repurchase certain receivables.
Periodically, the Company is party to or otherwise involved in legal proceedings arising in the normal course of business. The Company does not believe that there are any proceedings threatened or pending, if determined adversely, that would have a material adverse effect on the consolidated financial position, results of operations, or liquidity of the Company.
| 18. | Related-Party Transactions |
Related-party transactions not otherwise disclosed in these footnotes to the consolidated financial statements include the following:
The Company has warehouse line of credit agreements with Santander — NY, a subsidiary of Santander (see Note 11). Interest expense on these lines of credit totaled $15,152, $54,737 and $51,156 for the years ended December 31, 2012, 2011 and 2010, respectively. Accrued interest was $2,135 and $2,509 at December 31, 2012 and 2011, respectively.
The Company had unsecured credit agreements with Benelux, a subsidiary of Santander. These agreements terminated on December 30, 2011. Interest expense totaled $4,990 and $4,233 for the years ended December 31, 2011 and 2010, respectively.
The Company previously had a warehouse line of Credit with Abbey. The agreement was terminated on May 28, 2010. Interest expense totaled $13,716 for the year ended December 31, 2010.
The Company previously had a warehouse line of credit agreement with Santander — NY. The agreement expired on December 31, 2010. Interest expense totaled $6,508 for the year ended December 31, 2010.
The Company previously had an unsecured credit agreement with Santander — NY. The agreement expired on December 31, 2010. Interest expense totaled $2,662 for the year ended December 31, 2010.
The Company has letters of credit issued by Santander — NY (see Note 17). Letter of credit fees, which are included as a component of interest expense, totaled $238, $2,720 and $3,621 for the years ended December 31, 2012, 2011 and 2010, respectively. Accrued fees totaled $128 and $882 at December 31, 2012 and 2011, respectively.
The Company has derivative financial instruments with Santander with outstanding notional amounts of $6,324,625 and $5,768,822 at December 31, 2012 and 2011, respectively (see Note 13). Interest expense on these agreements, which is included as a component of interest expense, totaled $54,361, $121,907 and $97,656 for the years ended December 31, 2012, 2011 and 2010, respectively.
Produban Servicios Informaticos Generales S.L., a Santander affiliate, is under contract with the Company to provide professional services, telecommunications, and internal and/or external applications. Expenses incurred, which are included as a component of data processing, communications and other expenses, totaled $148, $160 and $161 for the years ended December 31, 2012, 2011 and 2010, respectively.
F-58
Table of Contents
On December 31, 2011, SCUSA completed the sale to certain members of SCUSA’s management of 67,373.99 shares of SCUSA common stock for an aggregate consideration of approximately $2,077. These loans will be paid back to the Company over a four year term. The balance on the loans totaled $1,562 and $2,077 at December 31, 2012 and 2011, respectively.
On December 21, 2012, the Company entered into a Master Services Agreement (MSA) with a company in which it has a cost method investment and holds a warrant to increase its ownership if certain vesting conditions are satisfied. The MSA enables SCUSA to review credit applications of retail store customers. No applications had been reviewed as of December 31, 2012.
| 19. | Fair Value of Financial Instruments |
FASB ASC 825, Financial Instruments, requires that the Company disclose estimated fair values of its financial instruments. Fair value, estimates, methods, and assumptions are as follows (in thousands):
| December 31, 2012 | December 31, 2011 | |||||||||||||||
| Carrying Value |
Estimated Fair Value |
Carrying Value |
Estimated Fair Value |
|||||||||||||
| Cash and cash equivalents (a) |
$ | 70,887 | $ | 70,887 | $ | 54,409 | $ | 54,409 | ||||||||
| Restricted cash (a) |
1,290,461 | 1,290,461 | 1,658,166 | 1,658,166 | ||||||||||||
| Retail installment contracts (b) |
16,203,926 | 17,037,855 | 16,581,565 | 17,862,740 | ||||||||||||
| Receivables from lenders (c) |
61,894 | 61,894 | 134,138 | 134,138 | ||||||||||||
| Notes payable (d) |
3,684,553 | 3,684,553 | 4,266,405 | 4,266,405 | ||||||||||||
| Notes payable related to securitized retail installment contracts (e) |
12,543,442 | 12,712,009 | 12,436,984 | 12,453,656 | ||||||||||||
| TALF loan payable (f) |
— | — | 87,129 | 87,129 | ||||||||||||
| (a) | Cash and Cash Equivalents and Restricted Cash — The carrying amount of cash and cash equivalents, including restricted cash, approximated fair value at December 31, 2012 and 2011, due to the short maturity of these instruments and is considered a Level 1 measurement. |
| (b) | Retail Installment Contracts — Retail installment contracts are carried at amortized cost. The estimated fair value is calculated based on estimated market rates for similar contracts with similar credit risks and is considered a Level 3 measurement. |
| (c) | Receivables from Lenders — Receivables from lenders are carried at amortized cost. The estimated fair value is calculated based on estimated market rates for similar receivables with similar credit risks and is considered a Level 3 measurement. |
| (d) | Notes Payable — The carrying amount of notes payable is estimated to approximate their fair values as of December 31, 2012 and 2011. Management believes that the terms of these credit agreements approximate market terms for similar credit agreements as of December 31, 2012 and 2011. The fair value of notes payable is considered a Level 3 measurement. |
| (e) | Notes Payable Related to Securitized Retail Installment Contracts — The estimated fair value of notes payable related to securitized retail installment contracts is calculated based on market quotes for the Company’s publicly traded debt and estimated market rates currently available from recent transactions involving similar debt with similar credit risks, and is considered a Level 2 measurement. |
| (f) | TALF Loan Payable — The estimated fair value of the loan payable was calculated based on estimated market rates currently available from recent transactions involving similar debt with similar credit risks and is considered a Level 3 measurement. |
F-59
Table of Contents
The following table presents the Company’s assets and liabilities that are measured at fair value on a recurring basis during the years ended December 31, 2012 and 2011, and are categorized using the fair value hierarchy. The fair value hierarchy includes three levels based on the reliability of the inputs used to determine the fair value.
| Fair Value Measurements at December 31, 2012 | ||||||||||||||||
| Total | Quoted Prices in Active Markets for Identical Assets (Level 1) |
Significant Other Observable Inputs (Level 2) |
Significant Unobservable Inputs (Level 3) |
|||||||||||||
| Assets — investments available-for-sale (a) |
$ | 95,600 | $ | — | $ | 95,600 | $ | — | ||||||||
| Liabilities — hedging interest rate swaps (b) |
$ | 20,759 | $ | — | $ | 20,759 | $ | — | ||||||||
| Liabilities — trading interest rate swaps (b) |
$ | 52,546 | $ | — | $ | 52,546 | $ | — | ||||||||
| Fair Value Measurements at December 31, 2011 | ||||||||||||||||
| Total | Quoted Prices in Active Markets for Identical Assets (Level 1) |
Significant Other Observable Inputs (Level 2) |
Significant Unobservable Inputs (Level 3) |
|||||||||||||
| Assets — investments available-for-sale (a) |
$ | 188,299 | $ | — | $ | 188,299 | $ | — | ||||||||
| Liabilities — hedging interest rate swaps (b) |
$ | 32,395 | $ | — | $ | 32,395 | $ | — | ||||||||
| Liabilities — trading interest rate swaps (b) |
$ | 61,373 | $ | — | $ | 61,373 | $ | — | ||||||||
| (a) | Quoted market prices for the Company’s investments available for sale are not readily available. The Company’s principal markets for its investment securities are the secondary institutional markets with an exit price that is predominantly reflective of bid-level pricing in these markets. The Company estimated fair values for these securities by evaluating pricing information from a combination of sources such as third-party pricing services, third-party broker quotes for certain securities, and other independent third-party valuation sources. These quotes are benchmarked against similar securities that are more actively traded in order to assess the reasonableness of the estimated fair values. The fair market value estimates assigned to these securities assume liquidation in an orderly fashion and not under distressed circumstances. |
| (b) | The valuation of interest rate swaps is determined using widely accepted valuation techniques including discounted cash flow analysis on the expected cash flows of each swap. This analysis reflects the contractual terms of the swaps, including the period to maturity, and uses observable market-based inputs. The Company incorporates credit valuation adjustments to appropriately reflect both its own nonperformance risk and the respective counterparty’s nonperformance risk in the fair value measurement of its derivatives. In adjusting the fair value of its derivative contracts for the effect of nonperformance risk, the Company has considered the impact of netting and any applicable credit enhancements, such as collateral postings and guarantees. Effective January 1, 2012, the Company made an election to use the exception in ASC 820-10-35-18D (commonly referred to as the “portfolio exception”) with respect to measuring counterparty credit risk for derivative instruments. |
No amounts were transferred in or out of Level 3 during 2012 or 2011.
The changes in the Company’s Level 3 balances during the year ended December 31, 2011, are as follows:
| Liabilities – Interest Rate Swaps December 31, 2011 |
||||
| Balance — beginning of year |
$ | 4,604 | ||
| Gains/losses in OCI |
216 | |||
| Gains/losses in earnings |
(1,115 | ) | ||
| Settlements |
(3,705 | ) | ||
|
|
|
|||
| Balance — end of year |
$ | — | ||
|
|
|
|||
F-60
Table of Contents
The following table presents the Company’s assets and liabilities that are measured at fair value on a nonrecurring basis during the years ended December 31, 2012 and 2011, and are categorized using the fair value hierarchy:
| Fair Value Measurements at December 31, 2012 | ||||||||||||||||
| Total | Quoted Prices in Active Markets for Identical Assets (Level 1) |
Significant Other Observable Inputs (Level 2) |
Significant Unobservable Inputs (Level 3) |
|||||||||||||
| Assets — repossessed vehicle inventory |
$ | 82,249 | $ | — | $ | 82,249 | $ | — | ||||||||
| Fair Value Measurements at December 31, 2011 | ||||||||||||||||
| Total | Quoted Prices in Active Markets for Identical Assets (Level 1) |
Significant Other Observable Inputs (Level 2) |
Significant Unobservable Inputs (Level 3) |
|||||||||||||
| Assets — repossessed vehicle inventory |
$ | 88,757 | $ | — | $ | 88,757 | $ | — | ||||||||
The Company estimates the fair value of its repossessed vehicle inventory using historical auction rates and current market levels of used car prices.
| 20. | Employee Benefit Plans |
SCUSA Compensation Plan — Beginning in 2012, the Company granted stock options to certain executives and other employees under a Management Equity Plan (the “Plan”). The Plan is administered by the Board of Directors and enables the Company to make stock awards up to a total of approximately 11 million common shares (net of shares canceled and forfeited), or 8.5% of the equity invested in the Company as of December 31, 2011. Stock options for approximately 9.3 million of the shares were granted at the original grant date in February 2012. Additional stock options were granted later in the year. At December 31, 2012, the Company had approximately 1.8 million shares that were available to grant under the Plan.
The stock options granted during 2012 were granted with an exercise price based on the fair market value of the Company’s common stock on the date of issuance, estimated to be equal to the value indicated by the December 31, 2011, equity transactions described in Note 3. The stock options expire after ten years and include both time vesting options and performance vesting options. The Company will issue new shares when options are exercised. As long as an option holder remains employed by the Company, the time vesting options become vested and exercisable in equal annual installments of 20% on each of the first five anniversaries of the December 31, 2011, equity transactions, while the performance vesting options have the same time requirements and additionally require certain annual or cumulative ROE targets to be met. These targets are an ROE of 27.5% for each of 2012 and 2013 and 18.0% for each of the years 2014 through 2016, or average annual ROE of 25.0% for the five-year period.
No shares obtained through exercise of stock options may be transferred until the later of December 31, 2016, and the Company’s execution of an IPO (the later date of which is referred to as the Lapse Date). Limited transfer rights exist after December 31, 2016 if an IPO has not yet occurred by that date. Until the Lapse Date, if an employee leaves the Company, the Company has the right to repurchase any or all of the stock obtained by the employee through option exercise. If the employee is terminated for cause (as defined in the Plan) or voluntarily leaves the Company without good reason (as defined in the Plan), the repurchase price is the lower of the strike price or fair market value at the date of repurchase. If the employee is terminated without cause or voluntarily leaves the Company with good reason, the repurchase price is the fair market value at the date of repurchase.
F-61
Table of Contents
Accounting for stock-based compensation requires that the cost resulting from all stock-based payments be recognized in the financial statements based on the grant-date fair value of the award, estimated using an option-pricing model. The Company uses the Black-Scholes option-pricing model, with assumptions relating to dividends, expected life of options granted, expected volatility, and risk-free interest rate, to determine the fair value of stock option awards. Expected dividends were determined based on management’s projections. The expected life of options granted represents the period of time for which the options are expected to be outstanding, taking into account the vesting period and expiration date. The expected volatility is based on the historical volatility of guideline public companies over the estimated expected life of the options. The risk-free interest rate is derived from the U.S. Treasury rate with a maturity date corresponding to the stock options’ expected life. The Company also estimated option forfeitures at the time of grant and will revise those estimates in subsequent periods if actual forfeitures significantly differ from those estimates.
The fair value of the stock options is amortized into income over the vesting period as time and performance conditions are met. Management believes the Company’s repurchase right causes the IPO event to constitute an implicit vesting condition; because an IPO had not been executed as of December 31, 2012, no stock compensation expense was recorded in 2012. As of December 31, 2012, there was approximately $148 million of total unrecognized compensation cost related to stock options granted but for which the IPO performance condition had not been met. That cost is expected to be recognized over a period beginning when an IPO occurs and ending on December 31, 2016, or entirely upon occurrence of an IPO if after that date.
A summary of the Company’s stock options and related activity as of and for the year ended December 31, 2012, is presented below:
| Shares | Weighted Average Exercise Price |
Weighted Average Remaining Contractual Term (Years) |
||||||||||||||
| Adjusted* | Original* | |||||||||||||||
| Options outstanding at January 1, 2012 |
— | $ | — | $ | — | |||||||||||
| Granted |
9,340,407 | 27.37 | 32.21 | |||||||||||||
| Exercised |
— | — | — | |||||||||||||
| Expired |
— | — | — | |||||||||||||
| Forfeited |
(53,870 | ) | 25.97 | 30.81 | ||||||||||||
|
|
|
|||||||||||||||
| Options outstanding at December 31, 2012 |
9,286,537 | 27.38 | 32.22 | 9.0 | ||||||||||||
|
|
|
|||||||||||||||
| Options exercisable at December 31, 2012 |
1,838,242 | 27.38 | 32.22 | 9.0 | ||||||||||||
|
|
|
|||||||||||||||
| * | Exercise prices have been retroactively adjusted to reflect a $4.84 dividend protection adjustment for dividends paid in 2012. |
A summary of the status and changes of the Company’s nonvested stock option shares as of and for the year ended December 31, 2012, is presented below:
| Weighted Average Grant Date Fair Value |
||||||||||||
| Shares | Adjusted* | Original* | ||||||||||
| Nonvested at January 1, 2012 |
— | $ | — | $ | — | |||||||
| Granted |
9,340,407 | 27.37 | 32.21 | |||||||||
| Vested |
(1,838,242 | ) | 27.38 | 32.22 | ||||||||
| Forfeited |
(53,870 | ) | 25.97 | 30.81 | ||||||||
|
|
|
|||||||||||
| Non-vested at December 31, 2012 |
7,448,295 | $ | 27.37 | $ | 32.21 | |||||||
|
|
|
|||||||||||
| * | Exercise prices have been retroactively adjusted to reflect dividend protection adjustment for dividends paid in 2012. |
F-62
Table of Contents
Santander Stock-Based Compensation Plan — Santander has established a stock-based compensation plan for certain employees of the Company. The compensation plan is linked to Santander’s earnings per share growth in comparison to similar financial institutions. The shares are awarded based on performance during specific cycles at various per share prices.
| • | Cycle one, from July 2007 through June 2009, had maximum authorized shares of 96,030 at a price of $19.38 per share. The cycle closed with total shares distributed of 77,469. |
| • | Cycle two, from July 2007 through June 2010, had maximum shares authorized of 144,120 at a price of $19.38 per share. The cycle closed with total shares distributed of 114,040. |
| • | Cycle three, from July 2008 through June 2011, had maximum shares authorized of 147,908 at a price of $7.29 per share. The cycle closed with total shares distributed of 120,732. |
| • | Cycle four, from July 2009 through June 2012, had maximum authorized shares of 157,611 at a price of $6.50 per share. The cycle closed with total shares distributed of 43,475. |
| • | Cycle five, from July 2010 through June 2013, has maximum authorized shares of 163,302 at a price of $6.87 per share. |
The shares are awarded at the end of each cycle; however, the awarding of these shares is contingent upon Santander meeting the specified performance requirements during each cycle and each employee’s continued employment with the Company.
The Company recognized compensation expense related to this plan totaling $608, $880 and $1,054 during the years ended December 31, 2012, 2011 and 2010, respectively.
Defined Contribution Plan — The Company sponsors a defined contribution plan offered to qualifying employees. Employees participating in the plan may contribute up to 15% of their base salary, subject to federal limitations on absolute amounts contributed. The Company will match up to 6% of their base salary, with matching contributions of 100% of employee contributions. The total amount contributed by the Company in 2012, 2011 and 2010, was $4,607, $3,940 and $2,954, respectively.
| 21. | Subsequent Events |
On February 6, 2013, the Company entered into an agreement with a significant U.S. vehicle manufacturer to serve as the manufacturer’s private label finance provider for consumer and dealer lending. In connection with this agreement, the Company entered into an additional agreement which allows for the manufacturer to acquire an equity interest, at market value, in the private label business, at the option of the manufacturer.
The Company has evaluated and disclosed subsequent events through July 3, 2013, the date these financial statements were available to be issued.
******
F-63
Table of Contents
Shares
Santander Consumer USA Holdings Inc.
Common Stock
Prospectus
Global Coordinators and Joint Book-Running Managers
| Citigroup | J.P. Morgan |
Joint Book-Running Managers
| BofA Merrill Lynch | Deutsche Bank Securities | Santander |
| Barclays | Goldman, Sachs & Co. |
Morgan Stanley |
RBC Capital Markets |
| BMO Capital Markets | Credit Suisse | UBS Investment Bank | Wells Fargo Securities | |||||
Co-Managers
| KKR | Sandler O’Neill + Partners, L.P. |
Stephens Inc. | LOYAL3 Securities | |||
, 2014
Until , 2014 (25 days after the date of this prospectus), all dealers that buy, sell or trade shares of our common stock, whether or not participating in this offering, may be required to deliver a prospectus. This is in addition to the dealers’ obligation to deliver a prospectus when acting as underwriters and with respect to their unsold allotments or subscriptions.
Table of Contents
INFORMATION NOT REQUIRED IN PROSPECTUS
Item 13. Other Expenses of Issuance and Distribution.
The following table sets forth the costs and expenses, other than underwriting discounts and commissions, payable by us in connection with the sale of the common stock being registered. All amounts, except the SEC registration fee and the FINRA filing fee, are estimates.
| SEC registration fee |
$ | 6,820 | ||
| FINRA filing fee listing fees and expenses |
* | |||
| Transfer agent and registrar fees and expenses |
* | |||
| Printing fees and expenses |
* | |||
| Legal fees and expenses |
* | |||
| Accounting fees and expenses |
* | |||
| Miscellaneous |
* | |||
| Total |
$ | * |
| * | To be furnished by amendment. |
Item 14. Indemnification of Directors and Officers.
Section 102(b)(7) of the Delaware General Corporation Law (the “DGCL”) permits a corporation to provide in its certificate of incorporation that a director of the corporation shall not be personally liable to the corporation or its stockholders for monetary damages for breach of fiduciary duty as a director, except for liability (1) for any breach of the director’s duty of loyalty to the corporation or its stockholders, (2) for acts or omissions not in good faith or which involve intentional misconduct or a knowing violation of law, (3) under Section 174 of the DGCL (regarding, among other things, the payment of unlawful dividends or unlawful stock purchases or redemptions) or (4) for any transaction from which the director derived an improper personal benefit. Our amended and restated certificate of incorporation provides for such limitation of liability.
Section 145(a) of the DGCL empowers a corporation to indemnify any director, officer, employee or agent, or former director, officer, employee or agent, who was or is a party or is threatened to be made a party to any threatened, pending or completed action, suit or proceeding, whether civil, criminal, administrative or investigative (other than an action by or in the right of the corporation), by reason of such person’s service as a director, officer, employee or agent of the corporation, or such person’s service, at the corporation’s request, as a director, officer, employee or agent of another corporation or enterprise, against expenses (including attorneys’ fees), judgments, fines and amounts paid in settlement actually and reasonably incurred by such person in connection with such action, suit or proceeding; provided that such director or officer acted in good faith and in a manner reasonably believed to be in or not opposed to the best interests of the corporation; and, with respect to any criminal action or proceeding, provided that such director or officer had no reasonable cause to believe his conduct was unlawful.
Section 145(b) of the DGCL empowers a corporation to indemnify any person who was or is a party or is threatened to be made a party to any threatened, pending or completed action or suit by or in the right of the corporation to procure a judgment in its favor by reason of the fact that such person is or was a director, officer, employee or agent of the corporation, or is or was serving at the request of the corporation as a director, officer, employee or agent of another enterprise, against expenses (including attorneys’ fees) actually and reasonably incurred in connection with the defense or settlement of such action or suit; provided that such director or officer acted in good faith and in a manner he or she reasonably believed to be in or not opposed to the best interests of the corporation, except that no indemnification may be made in respect of any claim, issue or matter as to which such director or officer shall have been adjudged to be liable to the corporation unless and only to the extent that the Delaware Court of Chancery or the court in which such action or suit was brought shall determine upon application that, despite the adjudication of liability but in view of all the circumstances of the case, such director or officer is fairly and reasonably entitled to indemnity for such expenses that the court shall deem proper.
II-1
Table of Contents
Notwithstanding the preceding sentence, except as otherwise provided in the by-laws, we shall be required to indemnify any such person in connection with a proceeding (or part thereof) commenced by such person only if the commencement of such proceeding (or part thereof) by any such person was authorized by the Board of Directors.
In addition, our amended and restated certificate of incorporation provides that we must indemnify our directors and officers to the fullest extent authorized by law. We are also expressly required to advance certain expenses to our directors and officers and carry directors’ and officers’ insurance providing indemnification for our directors and officers for some liabilities. We believe that these indemnification provisions and the directors’ and officers’ insurance are useful to attract and retain qualified directors and executive officers.
The proposed form of Underwriting Agreement filed as Exhibit 1.1 to this Registration Statement provides for indemnification of directors and officers of the Registrant by the underwriters against certain liabilities.
Item 15. Recent Sales of Unregistered Securities.
In the three years preceding the filing of this registration statement, Santander Consumer USA Inc., an Illinois corporation (“SCUSA Illinois”) has issued the following securities:
| • | On October 20, 2011, SCUSA Illinois, and Santander Holdings USA, Inc. entered into an investment agreement with Sponsor Auto Finance Holdings Series LP (“Auto Finance Holdings”). Auto Finance Holdings is jointly owned by investment funds affiliated with Warburg Pincus LLC, Kohlberg Kravis Roberts & Co. L.P. and Centerbridge Partners L.P., as well as DFS Sponsor Investments LLC, an entity affiliated with Thomas G. Dundon, the Chief Executive Officer of the Company, and another executive officer of SCUSA Illinois. On October 20, 2011, SCUSA Illinois also entered into an investment agreement with DDFS LLC (“DDFS”), an entity owned by Mr. Dundon. |
| • | On December 31, 2011, SCUSA Illinois completed the sale to Auto Finance Holdings of an aggregate number of 32,438,127.19 shares of common stock of SCUSA Illinois for an aggregate purchase price of $1.0 billion. On December 31, 2011, SCUSA Illinois also completed the sale to DDFS of 5,140,468.58 additional shares of common stock for aggregate consideration of $158.2 million. In addition, on December 31, 2011, SCUSA Illinois completed the sale to certain members of its management of 67,373.99 shares of common stock for an aggregate consideration of approximately $2.1 million. |
The issuances of the securities described in the preceding paragraphs were made in reliance upon the exemption from registration under Section 4(2) of the Securities Act, including the safe harbors established in Rules 144A and Regulation D, for transactions by an issuer not involving a public offering. SCUSA Illinois did not offer or sell the securities by any form of general solicitation or general advertising. SCUSA Illinois informed the purchasers that the securities had not been registered under the Securities Act and were subject to restrictions on transfer and made offers only to purchasers whom we believed had the knowledge and experience in financial and business matters to evaluate the merits and risks of an investment in the securities.
SCUSA Illinois granted certain of our employees and directors options to purchase an aggregate of 9,294,854 shares of our common stock under its 2011 Management Equity Plan. These grants were exempt from the registration requirements of the Securities Act pursuant to Rule 701 promulgated thereunder inasmuch as they were offered and sold under written compensatory benefit plans and otherwise in compliance with the provisions of Rule 701.
Item 16. Exhibits and Financial Statements Schedules.
| (a) | Exhibits: The list of exhibits is set forth under “Exhibit Index” at the end of this registration statement and is incorporated herein by reference. |
| (b) | Financial Statement Schedules: None. |
II-2
Table of Contents
Item 17. Undertakings.
| * (f) | The undersigned registrant hereby undertakes to provide to the underwriters at the closing specified in the underwriting agreement certificates in such denominations and registered in such names as required by the underwriters to permit prompt delivery to each purchaser. |
| * (h) | Insofar as indemnification for liabilities arising under the Securities Act of 1933 may be permitted to directors, officers and controlling persons of the registrant pursuant to the foregoing provisions or otherwise, the registrant has been advised that in the opinion of the Securities and Exchange Commission such indemnification is against public policy as expressed in the Act and is, therefore, unenforceable. In the event that a claim for indemnification against such liabilities (other than the payment by the registrant of expenses incurred or paid by a director, officer or controlling person of the registrant in the successful defense of any action, suit or proceeding) is asserted by such director, officer or controlling person in connection with the securities being registered, the registrant will, unless in the opinion of its counsel the matter has been settled by controlling precedent, submit to a court of appropriate jurisdiction the question of whether such indemnification by it is against public policy as expressed in the Act, and will be governed by the final adjudication of such issue. |
| * (i) | The undersigned registrant hereby undertakes that: |
| (1) | For purposes of determining any liability under the Securities Act of 1933, the information omitted from the form of prospectus filed as part of this registration statement in reliance upon Rule 430A and contained in a form of prospectus filed by us pursuant to Rule 424(b)(1) or (4) or 497(h) under the Securities Act shall be deemed to be part of this registration statement as of the time it was declared effective. |
| (2) | For the purpose of determining any liability under the Securities Act of 1933, each post-effective amendment that contains a form of prospectus shall be deemed to be a new registration statement relating to the securities offered therein and the offering of such securities at that time shall be deemed to be the initial bona fide offering thereof. |
| * | Paragraph references correspond to those of Regulation S-K, Item 512. |
II-3
Table of Contents
SIGNATURES
Pursuant to the requirements of the Securities Act of 1933, the Registrant has duly caused its registration statement to be signed on its behalf by the undersigned, thereunto duly authorized, in Dallas, Texas on January 6, 2014.
| Santander Consumer USA Holdings Inc. | ||||
| (Registrant) | ||||
| By: | /s/ Thomas G. Dundon | |||
| Name: | Thomas G. Dundon | |||
| Title: | Chief Executive Officer | |||
Pursuant to the requirements of the Securities Act of 1933, this registration statement has been signed below by the following persons in the capacities and on the dates indicated:
| Signature |
Title |
Date | ||
| /s/ Thomas G. Dundon Thomas G. Dundon |
Director and Chief Executive Officer (Principal Executive Officer) |
January 6, 2014 | ||
| /s/ Jason Kulas Jason Kulas |
President and Chief Financial Officer (Principal Financial and |
January 6, 2014 | ||
| * Gonzalo de Las Heras |
Director | January 6, 2014 | ||
| * Juan Carlos Alvarez |
Director | January 6, 2014 | ||
| * Roman Blanco |
Director | January 6, 2014 | ||
| * Stephen A. Ferriss |
Director | January 6, 2014 | ||
| * Matthew Kabaker |
Director | January 6, 2014 | ||
| * Tagar Olson |
Director | January 6, 2014 | ||
| * Alberto Sánchez |
Director | January 6, 2014 | ||
II-4
Table of Contents
| Signature |
Title |
Date | ||
| * Juan Andres Yanes |
Director | January 6, 2014 | ||
| * Daniel Zilberman |
Director | January 6, 2014 | ||
| *By: | /s/ Thomas G. Dundon | |
| Attorney-in-Fact |
II-5
Table of Contents
Exhibit Index
| Exhibit Number |
Description | |
| 1.1 | Form of Underwriting Agreement* | |
| 3.1 | Form of Amended and Restated Certificate of Incorporation* | |
| 3.2 | Form of Amended and Restated By-Laws* | |
| 4.1 | Specimen common stock certificate | |
| 4.2 | Form of Amended and Restated Shareholders Agreement, by and among Santander Consumer USA Holdings Inc., Santander Holdings USA, Inc., DDFS LLC, Thomas G. Dundon, Sponsor Auto Finance Holdings Series LP and Banco Santander, S.A.* | |
| 4.3 | Shareholders Agreement, dated as of December 31, 2011, between Santander Consumer USA Inc. and Eldridge Burns#^ | |
| 4.4 | Shareholders Agreement, dated as of December 31, 2011, between Santander Consumer USA Inc. and Matt Fitzgerald#^ | |
| 4.5 | Shareholders Agreement, dated as of December 31, 2011, between Santander Consumer USA Inc. and James Fugitt#^ | |
| 4.6 | Shareholders Agreement, dated as of December 31, 2011, between Santander Consumer USA Inc. and Jason Grubb#^ | |
| 4.7 | Shareholders Agreement, dated as of December 31, 2011, between Santander Consumer USA Inc. and Rich Morrin#^ | |
| 4.8 | Shareholders Agreement, dated as of December 31, 2011, between Santander Consumer USA Inc. and Michelle Whatley#^ | |
| 4.9 | Shareholders Agreement, dated as of December 31, 2011, between Santander Consumer USA Inc. and Steve Zemaitis#^ | |
| 4.10 | Shareholders Agreement, dated as of December 31, 2011, between Santander Consumer USA Inc. and Jason Kulas#^ | |
| 4.11 | Form of Shareholders Agreement between Santander Consumer USA Inc. and Management Equity Plan Participant# | |
| 4.12 | Santander Consumer USA Holdings Inc. has certain debt obligations outstanding. None of the instruments evidencing such debt authorizes an amount of securities in excess of 10% of the total assets of Santander Holdings USA, Inc. and its subsidiaries on a consolidated basis. Santander Consumer USA Holdings Inc. agrees to furnish copies to the SEC on request. | |
| 5.1 | Form of Opinion of Wachtell, Lipton, Rosen & Katz^ | |
| 10.1 | Investment Agreement, by and between Santander Consumer USA Inc. and Dundon DFS LLC, dated as of October 20, 2011 (incorporated by reference to Exhibit 10.3 of Santander Holdings USA, Inc.’s Annual Report on Form 10-K filed March 16, 2012) | |
| 10.2 | Investment Agreement, by and among Santander Consumer USA Inc., Santander Holdings USA, Inc. and Sponsor Auto Finance Holdings Series LP, dated as of October 20, 2011 (incorporated by reference to Exhibit 10.2 of Santander Holdings USA, Inc.’s Annual Report on Form 10-K filed March 16, 2012) | |
| 10.3 | Confidential Employment Agreement, dated May 1, 2009, by and between Santander Consumer USA Inc. and Eldridge A. Burns#^ | |
II-6
Table of Contents
| Exhibit Number |
Description | |
| 10.4 | Confidential Employment Agreement, dated May 1, 2009, by and between Santander Consumer USA Inc. and Jason W. Grubb#^ | |
| 10.5 | Confidential Employment Agreement, dated May 1, 2009, between Santander Consumer USA Inc. and Jason A. Kulas#^ | |
| 10.6 | Confidential Employment Agreement, dated August 24, 2011, between Santander Consumer USA Inc. and Richard Morrin#^ | |
| 10.7 | Amended and Restated Employment Agreement, executed as of December 31, 2011, by and among Santander Consumer USA Inc., Banco Santander, S.A. and Thomas G. Dundon#^ | |
| 10.8 | Santander Consumer USA Inc. 2011 Management Equity Plan#^ | |
| 10.9 | Form of Option Award Agreement under the Santander Consumer USA Inc. 2011 Management Equity Plan#^ | |
| 10.10 | Master Private Label Financing Agreement, dated as of February 6, 2013, by and between Santander Consumer USA Inc. and Chrysler Group LLC†^ | |
| 10.11 | Santander Consumer USA Inc. Omnibus Incentive Plan#* | |
| 21.1 | Subsidiaries of Santander Consumer USA Holdings Inc.^ | |
| 23.1 | Consent of Deloitte & Touche LLP | |
| 23.2 | Consent of Wachtell, Lipton, Rosen & Katz (included in Exhibit 5.1)^ | |
| 24.1 | Power of Attorney (included in signature page)^ | |
| 24.2 | Power of Attorney^ | |
| * | To be filed by amendment. |
| # | Indicates management contract or compensatory plan or arrangement. |
| † | Application has been made to the Securities and Exchange Commission for confidential treatment of certain provisions of this exhibit. Omitted material for which confidential treatment has been requested has been filed separately with the Securities and Exchange Commission. |
| ^ | Previously filed. |
II-7