Attached files
| file | filename |
|---|---|
| 8-K - 8-K - Zep Inc. | a14-1255_18k.htm |
| EX-99.1 - EX-99.1 - Zep Inc. | a14-1255_1ex99d1.htm |
Exhibit 99.2
|
|
Zep Inc. First Quarter Fiscal 2014 Earnings Conference Call January 6, 2014 John K. Morgan Chairman, President and Chief Executive Officer Mark R. Bachmann Executive Vice President and Chief Financial Officer © 2014 Zep Inc. - All rights reserved. |

|
|
Safe Harbor This presentation and our commentary contain forward-looking statements within the meaning of the Private Securities Litigation Reform Act of 1995. Specifically, forward-looking statements include, but are not limited to, statements relating to our future economic performance, business prospects, revenue, income, and financial condition; and statements preceded by, followed by, or that include the words "expects," "believes," "intends," "will," "anticipates," and similar terms that relate to future events, performance, or our results. Examples of forward-looking statements in this presentation and our commentary include but are not limited to: statements regarding the economic environment and the impact this environment has had or could have on our current and/or future financial results; statements regarding our expectations for pricing actions and gross margin performance; statements regarding benefits that we may realize from our acquisitions and our restructuring activities; statements regarding investments that may be made in the future to grow our business, either organically or otherwise, in accordance with our strategic plan, or that may be made for other purposes; and statements and related estimates concerning the benefits that the execution of our strategic initiatives are expected to have on future financial results. Specifically, the following statements are forward-looking statements within the meaning of the Private Securities Litigation Reform Act of 1995: Statements regarding our optimism about future results and our ability to implement measures that will result in profitable growth; statements regarding our ability to realize $9 million of cost savings in fiscal 2014 and reinvest a portion of those savings in strategic business initiatives; statements regarding our top-line results during fiscal 2014; statements regarding the impact of our restructuring and simplification activities on our free cash flow and outstanding indebtedness; statements regarding the expected magnitude of the reductions to our revenue from such activities and the timing of the reductions; statements regarding our second quarter fiscal 2014 gross margin, cash usage and earnings per share and statements regarding utilizing cash flow in our fiscal second half to make strategic investments, fund our dividend and reduce our debt balance. Our forward-looking statements are subject to certain risks and uncertainties that could cause actual results, expectations, or outcomes to differ materially from our historical experience as well as management's present expectations or projections. These risks and uncertainties include, but are not limited to: economic conditions in general; the cost or availability of raw materials; competition; our ability to realize anticipated benefits from strategic planning and restructuring initiatives and the timing of the benefits of such actions; market demand our ability to maintain our customer relationships; and litigation and other contingent liabilities, such as environmental matters. A variety of other risks and uncertainties could cause our actual results to differ materially from the anticipated results or other expectations expressed in our forward-looking statements. A number of those risks are discussed in Part I, "Item 1A. Risk Factors" of our Annual Report on Form 10-K for the fiscal year ended August 31, 2013. We believe the forward-looking statements are reasonable; however, undue reliance should not be placed on any forward-looking statements, which are based on current expectations. Further, forward-looking statements speak only as of the date they are made, and we undertake no obligation to update publicly any of them in light of new information or future events. 2 © 2014 Zep Inc. - All rights reserved. |
|
|
1st Quarter Financial Highlights Revenue grew 4.3% to $164.9 million Gross margins improved 70 basis points to 48.1% Adjusted EBITDA grew 17% to approximately $14.1 million 90 bps Adjusted EBITDA margin improvement Adjusted earnings per diluted share were $0.17, which excludes $0.03 per share of costs related to a California legal matter and acquisition integration expenses 3 © 2014 Zep Inc. - All rights reserved. Steady Progress on Restructuring Efforts & Integration of Zep Vehicle Care Contributed to 17% Adjusted EBITDA Growth |
|
|
1st Quarter Summary Quarter met our expectations with few surprises Experienced expected revenue losses from complexity-reduction and demand shaping Sales pipeline success helped offset organic declines Solid performance from Zep Vehicle Care Remain on-target with cost saving initiatives Solid working capital management drove cash flow 4 © 2014 Zep Inc. - All rights reserved. Straightforward Results... In-Line with Our Expectations |
|
|
Revenue Expectations & Pipeline Investments in strategic verticals producing promising early results Transportation Oil & Gas Sales pipeline is focusing teams where we can win Solid wins in Transportation & Industrial/MRO markets Supply chain achieving outstanding service levels 5 © 2014 Zep Inc. - All rights reserved. Sales Pipeline is Generating Results for Q1 and Beyond |
|
|
Zep Vehicle Care On schedule with integration of Zep Vehicle Care Final stages of exiting Transition Services Agreement with Ecolab Migrated ZVC processes and systems into Zep’s Shared Services and ERP platform No customer disruption Promotions: Darrin Baum promoted to VP, General Manager of Zep Vehicle Care Chelsea Beyer promoted to SVP Sales & Service of ZVC 6 © 2014 Zep Inc. - All rights reserved. Team is Energized Having Completed the Integration |
|
|
Cost Saving Initiatives Realizing the level of cost savings outlined last summer Consolidating distribution network Results in superior on-time delivery with lower expense structure Implementing Transportation Management System (TMS) New HR & payroll system consolidates eight systems into one comprehensive HR management tool 7 © 2014 Zep Inc. - All rights reserved. On-track to Realize $9 million of Cost Savings in 2014 |
|
|
Detailed Financial Performance |

|
|
9 1st Quarter ‘14 Revenue Drivers © 2014 Zep Inc. - All rights reserved. Revenues Increased 4.3% to $164.9 million ($10.5) |
|
|
1st Quarter ’14 North American Sales End-market Performance © 2014 Zep Inc. - All rights reserved. 10 Transportation Jan/San & Institutional Industrial/ MRO & Other +25% -8.4% Change from 1Q ‘13 to 1Q ’14 40% 24% 36% % of 1Q ‘14 North American Revenue 64% of North American Revenue from Transportation & Industrial/MRO & Other Markets -0.9% |
|
|
11 1st Quarter ‘14 Gross Profit Margin © 2014 Zep Inc. - All rights reserved. Year-over-Year +70bps Quarter-to-Quarter +130bps Mix Positively Impacting Margins (0.1% ) (0.6%) |
|
|
1st Quarter ‘14 Operating Expense 12 © 2014 Zep Inc. - All rights reserved. Selling, distribution and administrative expense increased by $4.6 million in the first fiscal quarter due to: Increased sales volume driving higher variable selling costs Inclusion of Zep Vehicle Care Legal expenses associated with the 2010 California sales representative litigation Increased depreciation expense resulting from our recent ERP implementation |
|
|
13 1st Quarter ‘14 EBITDA & Adjusted EBITDA © 2014 Zep Inc. - All rights reserved. ($2.8) ($0.9) Fiscal Q1 2014 Fiscal Q1 2013 Reported EBITDA $12.7 $10.4 Adjustments $1.4 $1.6 Adjusted EBITDA $14.1 $12.0 |
|
|
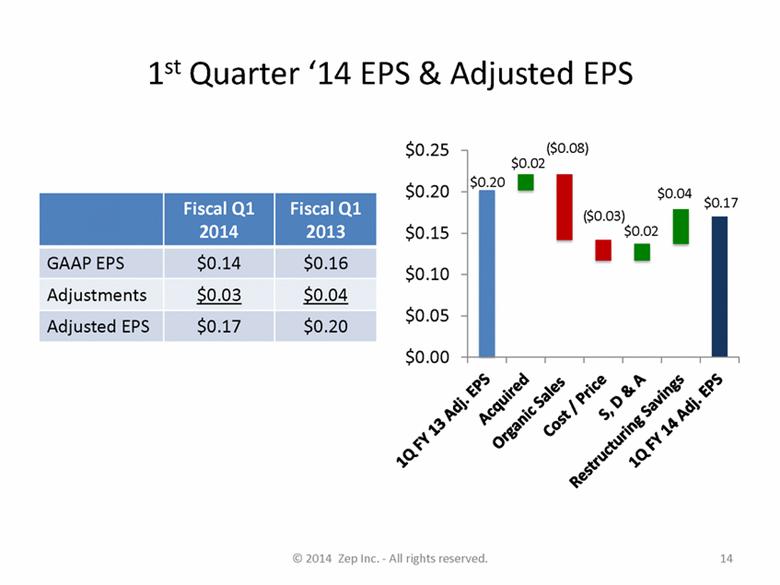
14 1st Quarter ‘14 EPS & Adjusted EPS © 2014 Zep Inc. - All rights reserved. ($0.08) ($0.03) $0.04 Fiscal Q1 2014 Fiscal Q1 2013 GAAP EPS $0.14 $0.16 Adjustments $0.03 $0.04 Adjusted EPS $0.17 $0.20 |
|
|
15 Adjusted Cash EPS Increased 8% from $0.25 to $0.27 © 2014 Zep Inc. - All rights reserved. Adjusted Cash EPS = Adjusted EPS + amortization expense per share |
|
|
Fixed Charge Coverage Ratio* Debt to EBITDA* Net Debt Position ($mm) Covenants Debt Position 16 © 2014 Zep Inc. - All rights reserved. Net debt decreased $2.8 million Stable performance against debt covenants In fiscal 2Q 2014, Debt/EBITDA decreases to 4.00x Fixed Charge Coverage ratio increases to 1.20x * As defined by Zep Inc.’s Credit Facility |
|
|
Near-Term Expectations Execute complexity-reduction and restructuring plans to optimize our earnings and cash flow More specifically... Sales muted due to the anniversary of the Zep Vehicle Care acquisition and complexity reduction initiatives, could result in 0-3% sales declines for next two quarters Gross margin historically declines on average 200 basis points sequentially in the second fiscal quarter Fixed costs continue to benefit from restructuring As a result... Second quarter EPS lower than last year Use cash in the second fiscal quarter Expect to generate significant cash flow in our fiscal second half for: Strategic investments Fund dividend Reduce our debt balance 17 © 2014 Zep Inc. - All rights reserved. |
|
|
Questions and Answers |