Attached files
| file | filename |
|---|---|
| 8-K - 8-K - Unum Group | d643202d8k.htm |
 2014 Outlook Meeting
December 16, 2013 | New York
Exhibit 99.1 |
 2
Safe Harbor Statement and Non-GAAP Financial Measures
Certain information in this presentation may be considered "forward-looking statements"
within the meaning of the Private Securities Litigation Reform Act of 1995. Forward-looking
statements are those not based on historical information, but rather relate to our outlook, future
operations, strategies, financial results, or other developments. Forward-looking statements
speak only as of the date made. We undertake no obligation to update these statements, even if
made available on our website or otherwise. These forward-looking statements are subject to
numerous assumptions, risks, and uncertainties, many of which are beyond our control. We caution readers that the following factors, in addition to other factors mentioned from time to
time, may cause actual results to differ materially from those contemplated by the forward-looking
statements: (1) unfavorable economic or business conditions, both domestic and foreign; (2)
sustained periods of low interest rates; (3) fluctuation in insurance reserve liabilities and claim payments due to changes in claim incidence, recovery rates, mortality rates, and offsets
due to, among other factors, the rate of unemployment and consumer confidence, the emergence of new
diseases, epidemics, or pandemics, new trends and developments in medical treatments, the
effectiveness of claims management operations, and changes in government programs; (4) legislative, regulatory, or tax changes, both domestic and foreign, including the
effect of potential legislation and increased regulation in the current political environment; (5)
investment results, including, but not limited to, changes in interest rates, defaults, changes in
credit spreads, impairments, and the lack of appropriate investments in the market which can be
acquired to match our liabilities; (6) effects of business disruption or economic contraction
due to disasters such as terrorist attacks, cyber attacks, other hostilities, or natural catastrophes,
including any related impact on the value of our investment portfolio, our disaster recovery
systems, cyber or other information security systems, and business continuity planning; (7)
ineffectiveness of our derivatives hedging programs due to changes in the economic environment,
counterparty risk, ratings downgrades, capital market volatility, changes in interest rates, and/or regulation; (8) increased competition from other insurers and financial services
companies due to industry consolidation or other factors; (9) changes in our financial strength and
credit ratings; (10) damage to our reputation due to, among other factors, regulatory
investigations, legal proceedings, external events, and/or inadequate or failed internal controls and
procedures; (11) actual experience that deviates from our assumptions used in pricing,
underwriting, and reserving; (12) actual persistency and/or sales growth that is higher or lower than
projected; (13) changes in demand for our products due to, among other factors, changes in
societal attitudes, the rate of unemployment, consumer confidence, and/or legislative and regulatory changes, including healthcare reform; (14) effectiveness of our risk
management program; (15) the level and results of litigation; (16) changes in accounting standards,
practices, or policies; (17) fluctuation in foreign currency exchange rates; (18) ability to
generate sufficient internal liquidity and/or obtain external financing; (19) availability of
reinsurance in the market and the ability of our reinsurers to meet their obligations to us; (20)
recoverability and/or realization of the carrying value of our intangible assets, long-lived
assets, and deferred tax assets. For further discussion of risks and uncertainties which could cause
actual results to differ from those contained in the forward-looking statements, see Part 1, Item
1A of our annual report on Form 10-K for the year ended December 31, 2012. All
subsequent written and oral forward-looking statements attributable to us or any person acting on
our behalf are expressly qualified in their entirety by these cautionary statements.
In analyzing performance, Unum sometimes uses non-GAAP financial measures that differ from what is
reported under GAAP. This presentation contains non-GAAP financial measures,
including operating earnings per share, operating return on equity, book value per share (excluding
accumulated other comprehensive income, or AOCI), and before tax operating earnings
(BTOE). Please refer to the Appendix for a reconciliation of the non-GAAP financial measures
used in this presentation to the most directly comparable GAAP measures. |
 3
Today’s Participants
Business Segment Presidents
Peter O’Donnell
President and Chief Executive Officer, Unum UK
President and Chief Executive Officer, Unum US
Mike Simonds
Jack McGarry
President and Chief Executive Officer, Closed Block
Randy Horn
President and Chief Executive Officer, Colonial Life
Rick McKenney
President and Chief Executive Officer
Tom Watjen
Kevin McCarthy
Executive Vice President and Chief Financial Officer
Executive Vice President and Chief Operating Officer
|
 4
Introduction
State of the Business
Financial Performance
Unum US
Unum UK
Colonial Life
Closed Block
Investment Performance
2014 Outlook
Closing Comments
Agenda |
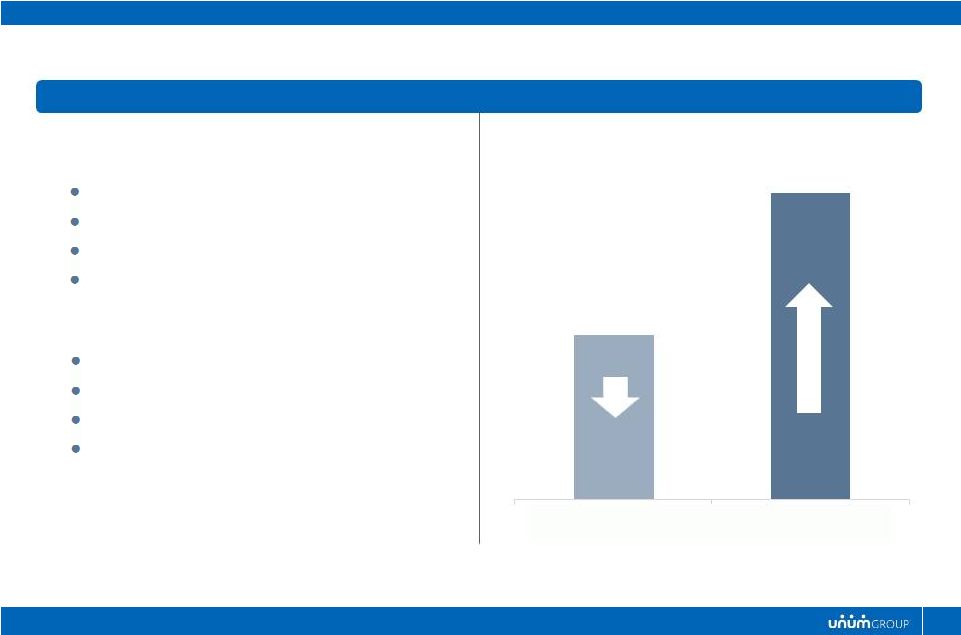
 Introduction |
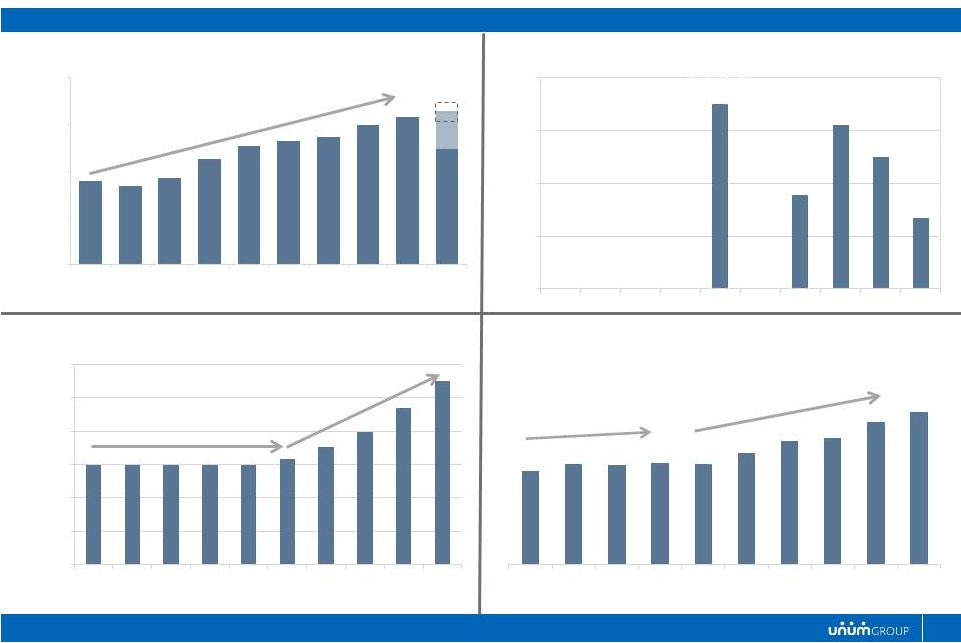 Introduction
A TRACK RECORD OF DELIVERING RESULTS
$0.00
$1.00
$2.00
$3.00
$4.00
2004*
2005*
2006*
2007*
2008
2009
2010
2011
2012
2013
OPERATING EPS
7.4%
CAGR*
* Does not reflect impact of ASU 2010-26 and special items.
+3-6%
STOCK REPURCHASE HISTORY
($ millions)
$-
$200
$400
$600
$800
2004
2005
2006
2007
2008
2009
2010
2011
2012
9M13
DIVIDEND HISTORY
$0.00
$0.10
$0.20
$0.30
$0.40
$0.50
$0.60
2004
2005
2006
2007
2008
2009
2010
2011
2012
2013
1.0%
CAGR
12.9%
CAGR
BOOK VALUE PER SHARE
(ex AOCI)
$19.37
$20.77
$20.74
$20.99
$20.84
$23.20
$25.69
$26.33
$29.55
$31.63
2004*
2005*
2006*
2007*
2008
2009
2010
2011
2012
3Q-13
9.1%
CAGR
* Does not reflect impact of ASU 2010-26 and special items.
2.7%
CAGR
6 |
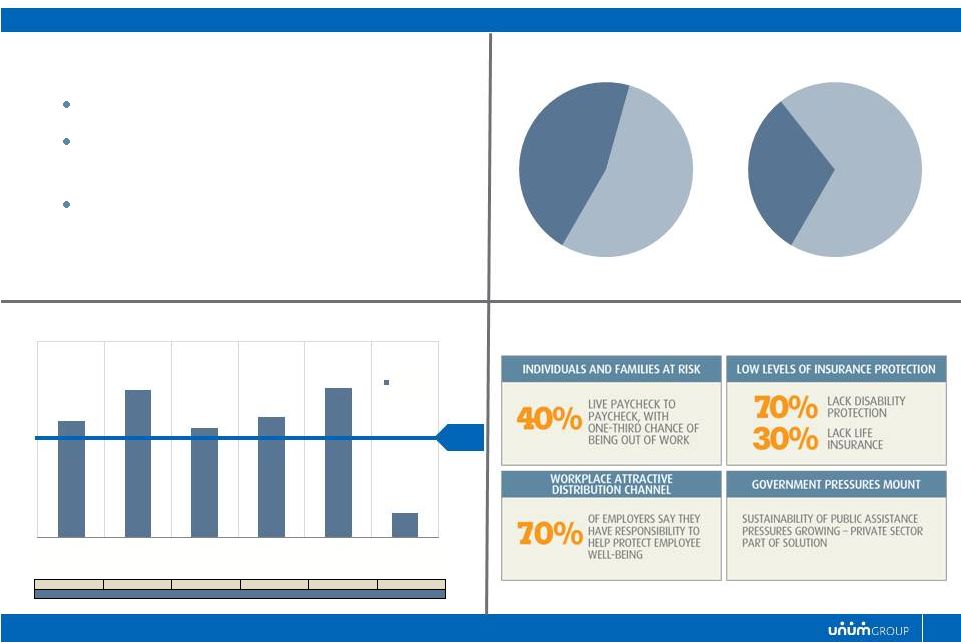 7
SOLID “MACROS”
Tremendous need for basic financial protection
The workplace is the most efficient way to
educate consumers and provide simple solutions
For most consumers, if they don’t get financial
protection in the workplace, they generally don’t
get it at all
Introduction
(as of
9/30/13)
FURTHER OPPORTUNITIES FOR GROWTH
STRONG OPERATING RETURN ON EQUITY
13.1%
16.6%
12.3%
13.5%
16.8%
2.8%
Unum UK
Colonial Life
Closed Block
3Q13 YTD
Actual
Total
11.6%
Employer
Paid
46%
Employee
Paid
54%
Employer
Paid
31%
Employee
Paid
69%
WHY…
GOOD BUSINESSES
20%
12%
22%
10%
15%
34%
YTD % AVERAGE CONSOLIDATED GAAP EQUITY
A CHANGING MARKETPLACE
(% Sales* with Employee Contribution)
2003
YTD 2013
*US Sales excluding IDI-RI and LTC
Unum US
Group
Disability
Unum US
Group Life and
AD&D
Unum US
Supplemental
& Voluntary
7
Average equity excludes negative allocation of corporate deficit and will therefore not add to
100% |
 8
Introduction
WHY…
A HISTORY OF TRANSPARENCY AND PROACTIVELY ADDRESSING ISSUES
8 |
 Introduction
WHY…
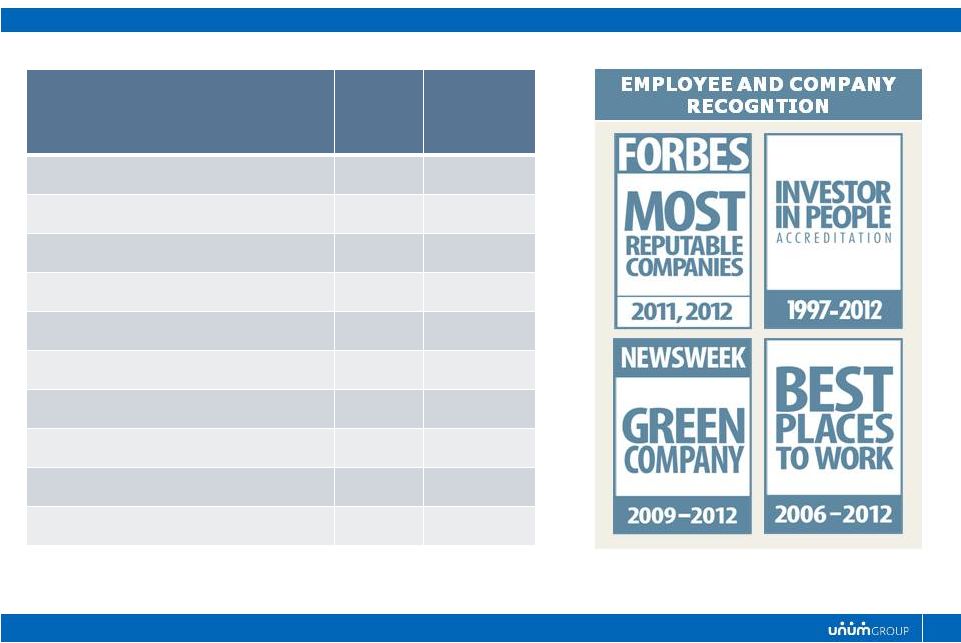
EXPERIENCED MANAGEMENT TEAM AND HIGHLY ENGAGED EMPLOYEES
Company Leaders
*
Years
with
Unum
Years
In
Financial
Services
Tom Watjen, President & CEO
19 yrs
32 Yrs
Kevin McCarthy, Chief Operating Officer
34 Yrs
37 Yrs
Rick McKenney, Chief Financial Officer
4 Yrs
20 Yrs
Randy Horn, CEO, Colonial Life
10 Yrs
36 Yrs
Jack McGarry, CEO, Closed Block
27 Yrs
32 Yrs
Peter O’Donnell, CEO, Unum UK
3 Yrs
25 Yrs
Mike Simonds, CEO, Unum US
15 Yrs
17 Yrs
Joe Foley, SVP, Corp Marketing & PR
35 Yrs
35 Yrs
Roger Martin, CFO, US Finance
28 Yrs
28 Yrs
Tom White, SVP, Investor Relations
31 Yrs
31 Yrs
* Represents those leaders in attendance at Investor Meeting
9 |
 Board Structure
•
Independence
•
Separate Chairman & CEO
•
Commitment to Diversity
92%
Yes
31%
Shareholder Rights
•
Staggered Board
•
Poison Pill
•
Say on Pay Frequency
Phasing Out
No
Annual
Compensation
•
Pay for Performance
•
Ownership Requirement
Significant alignment
SVP and above
Introduction
WHY…
SOUND CORPORATE GOVERNANCE
10 |
 State of the Business |
 Financial Performance |
 13
Continue to expect our 2013 full year operating earnings per share growth to
be in upper half of 0% to 6% target range
Loss ratio trends continue to be generally stable
Premiums on track but sales growth slower than planned in a dynamic market
Solid capital generation and active capital management
$300+ million share repurchase
UPIL (Bermuda) re-domestication completed
12% dividend increase
Financial Performance
2013 OUTLOOK |
 14
6.0%
+6%
$2.33
$2.47
9 mos -
2012
9 mos -
2013
Operating Earnings per Share
Financial Performance
PERFORMING AT HIGHER END OF OUR TARGET RANGE |
 15
Financial Performance
CONSISTENTLY STRONG RETURNS
YTD 2013 Operating Return on Equity
13.1%
16.6%
12.3%
13.5%
16.8%
2.8%
Unum
US
Group Disability
Unum
US
Group Life and AD&D
Unum US
Supplemental &
Voluntary
Unum UK
Colonial Life
Closed Block
3Q13 YTD Actual
Total
11.6%
Average
equity
excludes
negative
allocation
of
corporate
deficit
and
will
therefore
not
add
to
100%
20%
12%
22%
10%
15%
34%
YTD % AVERAGE CONSOLIDATED GAAP EQUITY
(as of
9/30/13) |
 16
Market Segmentation
Growth Trends in Premium Income
Financial Performance
MANAGED GROWTH IN OUR CORE BUSINESS SEGMENTS
2.6%
2.4%
5.0%
-2.4%
4Qtrs Ending 9/30/2013
Growth Markets
Unum
US
–
Core
Market
–
Employee
Benefits
Unum US –
Voluntary Benefits
Colonial Life
Unum UK –
Group LTD
Opportunistic Markets
Unum
US
–
Large
Case
–
Employee
Benefits
Unum US –
ID –
Recently Issued
Unum UK –
Group Life
Unum UK –
Supplemental and Voluntary
$4.1 billion
$2.2 billion
Opportunistic Markets
Growth Markets |
 17
Benefit Ratios
Other Expense Ratios
Financial Performance
STRONG RISK EXPERIENCE AND EXPENSE DISCIPLINE
* Year to Date through September 30, 2013
72.5%
72.7%
71.6%
2011
2012
2013*
Unum US
23.2%
22.3%
22.0%
2011
2012
2013*
Unum US
51.9%
52.5%
52.5%
2011
2012
2013*
Colonial Life
18.9%
18.2%
18.0%
2011
2012
2013*
Colonial Life |
 18
($ millions)
($ millions)
Financial Performance
CAPITAL GENERATION
* Statutory Net Income for traditional US Insurance Companies
†
Trailing twelve months
$574.0
$689.4
$850.3
$682.0
$741.2
$645.7
$664.0
$649.8
$740.6
-$8.2
-$64.1
-$58.3
-$141.2
-$102.0
-$16.9
-$21.1
-$25.3
-$35.6
2005
2006
2007
2008
2009
2010
2011
2012
3Q13†
After-tax Operating Income
Net Realized Investment Losses
Combined
Statutory
Net
Income
*
Capital Generation Model |
 19
Re-domestication of UPIL to a U.S.-domiciled entity finalized
Off-shore Bermuda-based captive is now a U.S. regulated entity
$300 million capital contribution from holding company
Reserves in UPIL at U.S. Statutory levels consistent with Unum America
Capitalization
consistent
with
U.S.
insurance
companies
(375%
-
400%
RBC)
Financial Performance
UPIL RE-DOMESTICATION |
 20
Financial Performance
ACTIVE CAPITAL DEPLOYMENT
•
YTD September 30, 2013
** Amounts in Millions
$ Amount
**
Share Repurchases (YTD)
*
$269
Dividend Payments (YTD)
*
109
Tailwind Debt Retirement (1Q-13)
63
Pension Funding (2Q-13)
53
SUBTOTAL
$494
UPIL Re-domestication
(4Q-13)
300
4Q Share Repurchases
TBD
4Q Dividends
38
TOTAL
$850-900 |
 21
Financial Performance
STRONG CAPITAL POSITION
Risk Based
Capital
Holding Companies’
Cash and
Marketable Securities
Year-End 2012 Actual
396%
$805 million
9/30/13 Actual
397%
$678 million
2013 Range
375% -
400%
$500 -
$600 million |
 22
(Excluding AOCI)
Financial Performance
BUILDING BOOK VALUE
9.1%
CAGR
10.4%
Book Value Per Share
Reported Book
Value per Share
$31.53
$33.20
$20.84
$23.20
$25.69
$26.33
$29.55
2008
2009
2010
2011
2012
$28.66
$31.63
9/30/2012
9/30/2013 |
 23
No expected change in the overall business environment
Loss ratios are expected to remain stable
Investment environment is expected to be generally consistent
with 2
nd
half of 2013
Operating EPS growth from 5-10%
Strong capital generation and active capital deployment:
$300 to $600 million of share repurchases
Increase in dividend payout ratio
Financial Performance
2014 OUTLOOK |
 Unum US |
 25
Products –
Financial protection products,
including:
Long Term and Short Term Disability
Group Life and AD&D
Individual Disability and Voluntary Products
Distribution –
Broker-driven distribution
backed by robust network of field offices
and extensive home office support
Market Position
Top 3 market share position across all major
product lines
Unum US
BUSINESS SNAPSHOT
Unum US
*
Earned Premium
$4.5 billion
Before Tax Operating Income
$847 million
Operating Return on Equity
13.8%
46%
29%
25%
Premium Distribution
*
($m)
Group Disability
Group Life/AD&D
Voluntary
Supplemental &
* Information as of 12/31/2012 |
 26
Our strategy is focused on expanding employee access to financial protection
benefits, broadening our employer client relationships, and building
collaborative marketplace partnerships.
We expect solid sales growth in 2014 as investments in new products and
capabilities offset marketplace headwinds.
Our business plan reflects continued investment in our strong value
proposition
while
maintaining
the
pricing
and
expense
discipline
that
has
yielded strong and predictable returns.
Unum US
2014 BUSINESS OUTLOOK |
 27
Unum US
2014 KEY PRIORITIES
Consumers
Clients
Partnerships
Risk
Management
Client management strategy
Claims service and reporting
United Healthcare partnership expansion
Exchange and benefit administration connectivity
Continued new business and renewal discipline
Foundational technology investments
Voluntary product and bundling enhancements
Data-driven consumer enrollment support |
 28
Sales Growth
7% to 10%
Premium Growth
0% to 2%
Op. Earnings Growth
1% to 3%
Operating ROE
12% to 14%
Unum US
2014 FINANCIAL OUTLOOK |
 Unum UK |
 30
Products –
Specializing in employer-paid
protection products, including:
Group Income Protection (GIP)
Group Life and Critical Illness
Sick Pay Insurance
Distribution –
Strong broker-driven
distribution backed by extensive home
office support
Recognized for many years by our
distribution partners as best provider in the
market
Market Position
#1 position in Group Income Protection
#4 position in Group Life
Unum UK
BUSINESS SNAPSHOT
Unum UK
*
Earned Premium
$695 million
Before Tax Operating Income
$131 million
Operating Return on Equity
12.2%
* Information as of 12/31/2012
59%
32%
9%
Premium Distribution
*
($m)
Group Disability
Group Life/AD&D
Supplemental &
Voluntary |
 31
Focused on expanding the Group Income Protection market by partnering with
brokers to encourage employers to expand or commence providing protection
to their employees
Actions taken during 2013 will lead to higher margins in 2014, with plans
focused on:
Completing the re-pricing of the Group Life block, while expanding our Group
Income Protection proposition
Maintaining strong risk results through pricing discipline, operational
performance and the use of reinsurance where appropriate and
attractive Continuing to drive efficiencies and effectiveness through
process simplification and by leveraging group capabilities
Top line growth in 2014 constrained by market headwinds; longer term
opportunities for accelerated growth driven by the evolving political agenda
and changes in regulation
Unum UK
2014 BUSINESS OUTLOOK |
 32
Unum UK
2014 KEY PRIORITIES
Distribution
Marketing
Operations
Risk
Management
Use analytics and targeted marketing to deliver awareness
campaigns to specific audiences
Enhance messages to HR and Finance Directors on the need
for financial protection
Strengthen analytical capability to maximise underwriting
competitive advantage in the marketplace
Drive process simplification to deliver enhanced broker and
customer proposition
Complete the re-pricing of the Group Life block and maintain
pricing discipline across all product lines
Maintain appropriate reinsurance arrangements where
appropriate and attractive
Maximise our relationship with existing distributors while
developing new distributors and channels
Invest in our sales organisation and solidify our position as
partner of choice for brokers |
 33
Unum UK
2014 FINANCIAL OUTLOOK
Growth rates shown in GBP
Sales Growth
4% to 7%
Premium Growth
0% to 2%
Op. Earnings Growth
5% to 8%
Operating ROE
16% to 18% |
 Colonial Life |
 35
Products –
Exclusive focus on voluntary
benefits market, including:
Accident, Sickness & Disability
Life
Cancer & Critical Illness
Distribution –
Agency-driven distribution
that is national in scope and backed by
extensive home office support
Market Position
More than 80,000 businesses served
Over 3 million policies in force
Colonial Life
BUSINESS SNAPSHOT
61%
17%
22%
Accident, Sickness,
Disability
Voluntary Life
Cancer/Critical
Illness
Colonial
*
Earned Premium
$1.2
billion
Before
Tax Operating Income
$274 million
Operating Return on Equity
16.8%
Premium Distribution*
($m)
* Information as of 12/31/2012 |
 36
Our business plan is centered on growth strategy execution, continuous
improvement, strong risk management practices, and talent development.
2014 sales growth will be primarily driven by distribution effectiveness and
opportunities in the core commercial and public sector segments.
We continue to invest in new products,
capabilities, and service offerings in
response
to
rapid
changes
in
the
market
environment
and
evolving
customer
expectations.
2014 operating earnings growth is expected to be in the 1-3% range, with
continued strong profit margins and operating ROE levels.
Colonial Life
2014 BUSINESS OUTLOOK |
 37
Colonial Life
2014 KEY PRIORITIES
Distribution
Segmentation
Products &
Services
Operational
Excellence
Build out target segment capabilities
Focus on customers who value an integrated approach to
benefits counseling, enrollment, and voluntary products
Maintain a balanced product and service portfolio that
meets consumer needs and distribution requirements
Align products and services with distribution strategy
Continued emphasis on risk discipline, continuous
improvement and cross-business collaboration
Acquisition and development of talent
Continue to strengthen our sales organization
Enhance our marketing focus and delivery |
 38
Colonial Life
2014 FINANCIAL OUTLOOK
Sales
Growth
4% to 7%
Premium
Growth
2% to 4%
Op. Earnings Growth
1% to 3%
Operating ROE
15% to 17% |
 Closed Block |
 40
Products –
Legacy block of discontinued
products, split primarily between:
Individual Disability
Long Term Care
Distribution
IDI sales discontinued in the mid-90s
ILTC sales discontinued in 2009
GLTC sales discontinued in 2011
Closed Block
BUSINESS SNAPSHOT
Closed Block
*
Earned Premium
$1.4 billion
Before Tax Operating Income
$95 million
Operating Return on Equity
2.8%
* Information as of 12/31/2012
Premium Distribution
*
($m)
Individual Disability
Long Term Care
54%
46% |
 41
In 2014, we expect BTOE growth of 6-9% driven by LTC asset growth and a
slight improvement in loss ratios.
The financial performance of individual disability block is stable with
predictable run-off of premium and capital.
Investment yields will continue to be a concern for LTC as we invest at below
portfolio rates.
Our near-term expenses will increase in the closed block as we continue to
make strategic investments in our resources and infrastructure.
Continued focus on capital efficiency.
Closed Block
2014 BUSINESS OUTLOOK |
 42
Closed Block
2014 KEY PRIORITIES
Operational
Effectiveness
Financial
Analysis
Rate Increases
Capital
Management
Improved analytics through new LTC actuarial platform
Use new experience analysis to drive deeper
Continue pursuit of justified rate increases
Stratify rate requests and enhance policyholder options
Implement structure changes to enhance flexibility
Keep abreast of developments in the capital markets
High quality claims management
Effective communication and implementation of approved
rate increases
understanding of underlying trends |
 43
Closed Block
2014 FINANCIAL OUTLOOK
Sales Growth
NA
Premium Growth
-4% to -6%
Op. Earnings Growth
6% to 9%
Operating ROE
2% to 4% |
 Investment Performance |
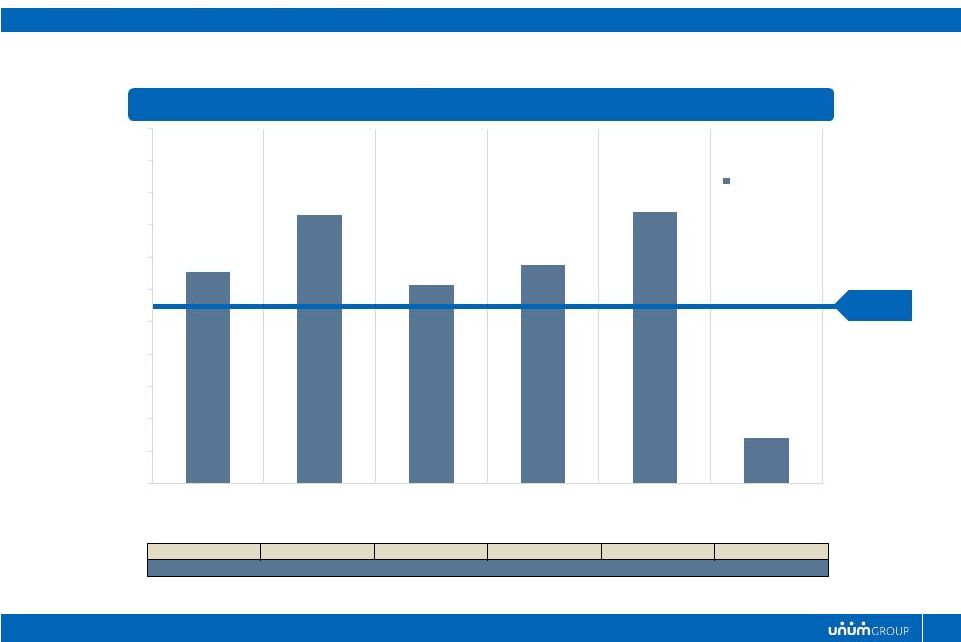
 45
Overall credit quality remains very
strong
Minimal watch list of potential problem
credits
Immaterial losses from sales and
write-downs
3Q13 realized losses reflect active
portfolio optimization
Average credit quality remains stable
in the single-A range
Investment Performance
STRONG CREDIT QUALITY
SALES AND WRITE-DOWNS OF INVESTMENTS
SALES AND WRITE-DOWNS OF INVESTMENTS
$0
$100
$200
$300
$400
$500
$600
$700
$800
WATCH LIST
WATCH LIST
$ millions
-$300
-$200
-$100
$0
$100
2007
2008
2009
2010
2011
2012
9M13
$ millions |
 46
2013 Results to Date
$3.1 billion invested
Overall portfolio yield down 15 bps to 6.32%
Interest Rate Headwinds
Investing new cash flows at lower rates
Adjustments to reserve discount rates as necessary
Mitigating Factors
Opportunistic deployment
Placement of premium rate increases
Measured reduction in interest reserve margins
Investment Performance
ENTERPRISE INTEREST RATE IMPACTS |
 47
Management of Interest Margin
Pricing flexibility
Discount rate adjustments
Margin build-up during credit crisis
Manageable amount of new cash flow
to invest
Investment Performance
INTEREST
RATE
MANAGEMENT
–
UNUM
US
LTD
40
50
60
70
80
90
100
110
2004
2005
2006
2007
2008
2009
2010
2011
2012
3Q-
13
UNUM US LTD INTEREST MARGIN
TARGET RANGE
*
Interest margin is the spread between the portfolio yield and the
aggregate discount rate |
 2014 Outlook |
 49
Slightly more favorable sales environment
Improved premium growth; 1-3% growth for core operations
Persistency remains favorable, generally consistent with 2013
Maintaining strong margins and profitability through disciplined
pricing and risk selection
Operating EPS growth from 5-10%
We will continue to execute our capital deployment plans in 2014:
$300 to $600 million of share repurchases
Increase in dividend payout ratio
2014 Outlook
KEY MESSAGES |
 50
2014 Outlook
CAPITAL OUTLOOK
Capital Management Criteria
3Q-2013
Actual
2013
Projection
2014
Projection
Risk-Based Capital Ratio for
Traditional U.S. Insurance Companies
397%
390% -
400%
375% -
400%
Holding Companies’
Cash and
Marketable
Securities
($
millions)
$678
$500 -
$600
>$500 |
 51
2014 Outlook
BUSINESS SEGMENT OUTLOOK
* Consolidated After-Tax Operating Earnings including Corporate
Segment Closed Block
(4 –
6%)
6 –
9%
2 –
4%
Total Operations*
3 –
6%
10 –
12%
Capital Management
3 –
5%
0 –
1%
Total
5 –
10%
11 –
12%
Sales
Growth
Premium
Growth
Operating
Earnings
Growth
Operating
ROE
Unum US
7 –
10%
0 –
2%
1 –
3%
12 –
14%
Unum UK (£)
4 –
7%
0 –
2%
5 –
8%
16 –
18%
Colonial Life
4 –
7%
2 –
4%
1 –
3%
15 –
17%
Core Operations
5 –
9%
1 –
3%
2 –
4%
13 –
15% |
 Closing Comments |
 53
Good operating businesses with positive long-term trends
…and a commitment to disciplined growth
An intense focus on the management of our closed block
…consistent with our history with these types of issues
Solid financial foundation and predictable cash flow remain an asset
…leading to significant financial flexibility
We
are
confident
we
are
taking
the
actions
needed
to
continue
to
build
value
…just as we have done in the past
Closing Comments |
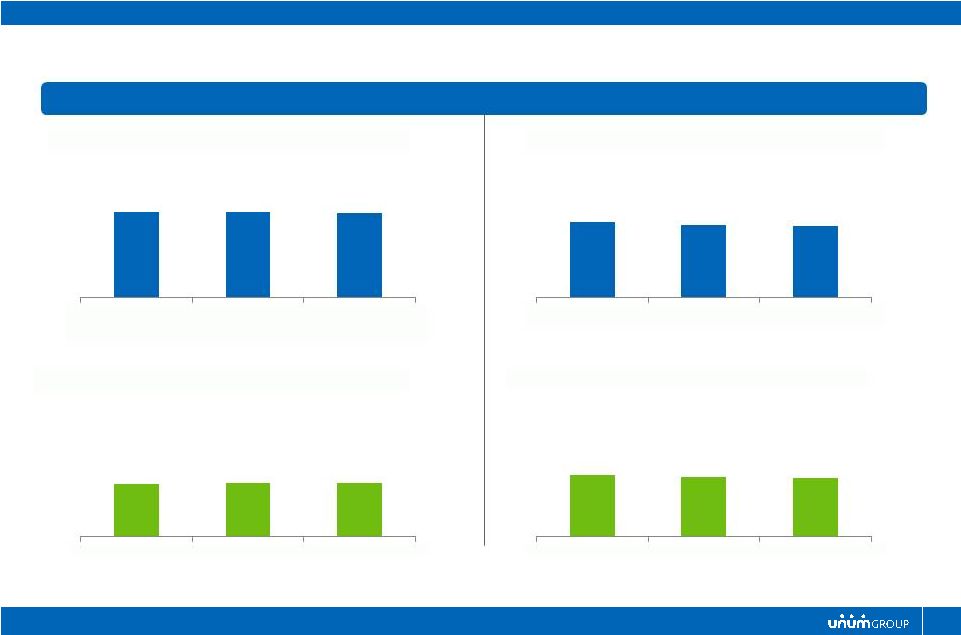
 Closing Comments
DIVIDEND HISTORY
1.0%
CAGR
12.9%
CAGR
BOOK VALUE PER SHARE
(ex AOCI)
BOOK VALUE PER SHARE
(ex AOCI)
9.1%
CAGR
2.7%
CAGR
STOCK REPURCHASE HISTORY
($ millions)
STOCK REPURCHASE HISTORY
($ millions)
OPERATING EPS
7.4%
CAGR
*
+3-6%
$0.00
$1.00
$2.00
$3.00
$4.00
2004*
2005*
2006*
2007*
2008
2009
2010
2011
2012
2013
* Does not reflect impact of ASU 2010
-
26 and special items.
$-
$200
$400
$600
$800
2004
2005
2006
2007
2008
2009
2010
2011
2012
9M13
$0.00
$0.10
$0.20
$0.30
$0.40
$0.50
$0.60
2004
2005
2006
2007
2008
2009
2010
2011
2012
2013
$19.37
$20.77
$20.74
$20.99
$20.84
$23.20
$25.69
$26.33
$29.55
$31.63
2004*
2005*
2006*
2007*
2008
2009
2010
2011
2012
3Q-13
* Does not reflect impact of ASU 2010-26 and special items.
A TRACK RECORD OF DELIVERING RESULTS
54 |
 Questions & Answers |
 Appendix
Reconciliation of Non-GAAP Financial Measures |
 57
Appendix
RECONCILIATION OF NON-GAAP FINANCIAL MEASURES
2012
2011
2010
2009
2008
2007**
2006**
2005**
2004**
After-tax Operating Income
3.15
$
2.98
$
2.73
$
2.64
$
2.54
$
2.25
$
1.85
$
1.69
$
1.78
$
Net Realized Investment Gain (Loss), Net of Tax
0.13
(0.01)
0.05
-
(0.89)
(0.12)
0.01
(0.02)
0.06
Non-operating Retirement-related Loss, Net of Tax
(0.11)
(0.07)
(0.06)
(0.09)
(0.03)
(0.04)
(0.05)
(0.05)
(0.04)
Deferred Acquisition Costs and Reserve Charges for
Closed Block, Net of Tax
-
(2.04)
-
-
-
-
-
-
(2.37)
Regulatory Reassessment Charges, Net of Tax
-
-
-
-
-
(0.10)
(0.79)
(0.16)
(0.29)
Special Tax Items and Debt Extinguishment Costs
-
0.08
(0.03)
-
-
(0.10)
0.23
0.14
0.17
Other, Net of Tax
-
-
-
-
-
-
(0.04)
0.01
0.01
Income (Loss) from Continuing Operations
3.17
0.94
2.69
2.55
1.62
1.89
1.21
1.61
(0.68)
Income (Loss) from Discontinued Operations
-
-
-
-
-
0.02
0.02
0.03
(0.18)
Net Income (Loss)
3.17
$
0.94
$
2.69
$
2.55
$
1.62
$
1.91
$
1.23
$
1.64
$
(0.86)
$
* Amounts per diluted common share.
** Does not reflect the impact of ASU 2010-26.
2013
2012
2012
2011
2010
2009
2008
2007*
2006*
2005*
2004*
Total Stockholders' Equity (Book Value)
33.20
$
31.53
$
31.87
$
27.91
$
26.80
$
24.25
$
17.94
$
22.28
$
22.53
$
24.66
$
24.36
$
Net Unrealized Gain on Securities
1.64
3.24
3.23
2.11
1.31
1.16
(2.53)
0.99
1.56
3.49
4.41
Net Gain on Cash Flow Hedges
1.52
1.46
1.48
1.39
1.14
1.12
1.38
0.50
0.57
0.91
0.80
Subtotal
30.04
26.83
27.16
24.41
24.35
21.97
19.09
20.79
20.40
20.26
19.15
Foreign Currency Translation Adjustment
(0.28)
(0.29)
(0.26)
(0.41)
(0.34)
(0.23)
(0.52)
0.35
0.34
0.07
0.33
Subtotal
30.32
27.12
27.42
24.82
24.69
22.20
19.61
20.44
20.06
20.19
18.82
Unrecognized Pension and Postretirement Benefit Costs
(1.31)
(1.54)
(2.13)
(1.51)
(1.00)
(1.00)
(1.23)
(0.55)
(0.68)
(0.58)
(0.55)
Total Stockholders' Equity, Excluding Accumulated
Other Comprehensive Income
31.63
$
28.66
$
29.55
$
26.33
$
25.69
$
23.20
$
20.84
$
20.99
$
20.74
$
20.77
$
19.37
$
* Does not reflect impact of ASU 2010-26 and special items.
Year Ended December 31*
September 30
December 31
(per share) |
 58
Appendix
RECONCILIATION OF NON-GAAP FINANCIAL MEASURES
After-Tax
Average
Annualized
Operating
Allocated
Operating
Income (Loss)
Equity
Return
On Equity
Nine Months Ended September 30, 2013
Unum US
Group Disability
151.0
$
1,534.9
$
13.1%
Group Life and Accidental Death and Dismemberment
113.2
907.2
16.6%
Supplemental and Voluntary
156.6
1,694.2
12.3%
Total Unum US
420.8
4,136.3
13.6%
Unum UK
74.8
737.5
13.5%
Colonial Life
140.1
1,112.5
16.8%
Closed Block
54.2
2,548.2
2.8%
Corporate
(31.2)
(943.1)
Total
658.7
$
7,591.4
$
11.6%
Twelve Months Ended December 31, 2012
Unum US
Group Disability
193.0
$
1,495.6
$
12.9%
Group Life and Accidental Death and Dismemberment
143.8
890.6
16.2%
Supplemental and Voluntary
218.5
1,637.9
13.3%
Total Unum US
555.3
4,024.1
13.8%
Unum UK
99.2
811.2
12.2%
Colonial Life
178.3
1,064.4
16.8%
Closed Block
62.3
2,234.2
2.8%
Corporate
(7.6)
(892.1)
Total
887.5
$
7,241.8
$
12.3%
(in millions) |
 59
Appendix
RECONCILIATION OF NON-GAAP FINANCIAL MEASURES
December 31
2013
2012
(in millions)
per share *
(in millions)
per share *
(in millions)
After-tax Operating Income
658.7
$
2.47
$
662.5
$
2.33
$
887.5
$
Net Realized Investment Gain (Loss), Net of Tax
(1.9)
(0.01)
20.7
0.07
37.1
Non-operating Retirement-related Loss, Net of Tax
(19.9)
(0.08)
(22.7)
(0.08)
(30.2)
Net Income
636.9
$
2.38
$
660.5
$
2.32
$
894.4
$
* Amounts per diluted common share.
September 30
2013
2012
2011
Total Stockholders' Equity, As Reported
8,669.9
$
8,612.6
$
8,169.7
$
Net Unrealized Gain on Securities
427.4
873.5
614.8
Net Gain on Cash Flow Hedges
397.2
401.6
408.7
Total Stockholders' Equity, As Adjusted
7,845.3
$
7,337.5
$
7,146.2
$
Average Equity, As Adjusted
7,591.4
$
7,241.8
$
December 31
2012
(in millions)
Operating Income (Loss) by Segment
Unum US
847.1
$
Unum UK
131.3
Colonial Life
274.3
Closed Block
95.5
Corporate
(108.5)
Total Before Tax Operating Earnings
1,239.7
Net Realized Investment Gain
56.2
Non-operating Retirement-related Loss
(46.4)
Income Tax
(355.1)
Net Income
894.4
$
December 31
(in millions)
2012
Nine Months Ended September 30 |