UNITED STATES
SECURITIES AND EXCHANGE COMMISSION
Washington, D.C. 20549
FORM 10-K
[X] ANNUAL REPORT UNDER SECTION 13 OR 15(D) OF THE SECURITIES EXCHANGE ACT OF 1934
FOR FISCAL YEAR ENDED: August 31, 2013
OR
[ ] TRANSITION REPORT UNDER SECTION 13 OR 15(D) OF THE SECURITIES EXCHANGE ACT OF 1934
For the transition period from ___________ to ___________
Commission file number: 333-85072
DIGITAL BRAND MEDIA & MARKETING GROUP, INC.
(Name of small business issuer in its charter)
| | |
| Florida | 59-3666743 |
| (State or other jurisdiction of incorporation or organization) | (IRS Employer Identification No.) |
747 Third Avenue, 2nd FL.
New York, NY 10017
(Address of principal executive offices)
(646) 722-2706
(Issuer's telephone number)
Securities registered under Section 12(b) of the Exchange Act:
| | | |
Title of each class |
| Name of exchange on which registered |
| None |
| None |
Securities registered under Section 12(g) of the Exchange Act:
| | | |
Title of each class |
| Name of exchange on which registered |
| None |
| None |
Indicate by check mark if the Registrant is a well-known seasoned issuer, as defined in Rule 405 of the Securities Act. Yes [ ] No [x]
Indicate by check mark if the Registrant is not required to file reports pursuant to Section 13 or 15(d) of the Act. Yes [ ] No [x]
Indicate by check mark whether the Registrant (1) has filed all reports required to be filed by Section 13 or 15(d) of the Securities Exchange Act of 1934 during the preceding 12 months (or for such shorter period that the registrant was required to file such reports), and (2) has been subject to such filing requirements for the past 90 days. Yes [x] No [ ]
Indicate by check mark whether the registrant: (1) has filed all reports required to be filed by Section 13 or 15(d) of the Securities Exchange Act of 1934 during the preceding 12 months (or for such shorter period that the registrant was required to submit and post such files). Yes [ ] No [x]
Indicate by check mark if disclosure of delinquent filers pursuant to Item 405 of Regulation S-K(§229.405 of this chapter) is not contained herein, and will not be contained, to the best of the Registrant’s knowledge, in definitive proxy or information statements incorporated by reference in Part III of this Form 10-K or any amendment to this Form 10-K. [ ]
Indicate by check mark whether the Registrant is a large accelerated filer, an accelerated filer, a non-accelerated filer or a smaller reporting company. See definitions of “large accelerated filer,” “accelerated filer” and “smaller reporting company” in Rule 12b-2 of the Exchange Act.
| | | |
|
| Large accelerated filer [ ] | Accelerated filer [ ] |
|
| Non-accelerated filer [ ] | Smaller reporting company [x] |
Indicate by check mark whether the Registrant is a shell company (as defined in Rule 12b-2 of the Exchange Act). Yes [ ] No [X]
State the number of shares outstanding of each of the issuer's classes of common equity, as of the latest practicable date:
| | | |
| Common Stock, par value $.001 per share: |
| 199,819,885 |
| (Class) |
| (Outstanding as of December 12, 2013) |
DOCUMENTS INCORPORATED BY REFERENCE
None.
The accompanying consolidated August 31, 2013 financial statements are in the process of being audited by the Company’s independent registered public accounting firm, RBSM, LLP, in accordance with SEC Regulation S-X and, therefore, contain only pre-audit numbers. There was considerable additional work because of a re-audit requirement of previous years which caused a delay. Once the August 31, 2013 consolidated financial statement have been audited and confirmed by the Company’s independent registered public accounting firm, the Company shall file and include the accountants audit report and financial statements by amendment on SEC Form 10-K/A. It is anticipated the audited financials for fiscal year 2013 shall be available shortly.
| | | |
| FORM 10-K For the Fiscal Year Ended August 31, 2013 TABLE OF CONTENTS | ||
|
|
| Page |
| PART 1 |
|
|
|
|
|
|
Item 1. | Description of Business | 4 |
Item 1A. | Risk Factors | 10 |
Item 1B. | Unresolved Staff Comments | 10 |
Item 2: | Description of Property | 10 |
Item 3. | Legal Proceedings | 10 |
Item 4. | Reserved | 10 |
|
|
|
PART II |
|
|
|
|
|
Item 5. | Market for Registrant’s Common Equity, Related Stockholder Matters and Issuer Purchases of Equity Securities | 11 |
Item 6. | Selected Financial Data | 13 |
Item 7. | Management’s Discussion and Analysis of Financial Condition and Results of Operation | 13 |
Item 8. | Consolidated Financial Statements and Supplementary Data (Unaudited) | 20 |
Item 9. | Changes in and Disagreements with Accountants on Accounting and Financial Disclosure | 37 |
Item 9A (T). | Controls and Procedure | 37 |
Item 9B. | Other Information | 37 |
|
|
|
PART III |
|
|
|
|
|
Item 10. | Directors and Executive Officers of the Registrant | 38 |
Item 11. | Executive Compensation | 40 |
Item 12. | Security Ownership of Certain Beneficial Owners and Management and Related Stockholder Matters | 41 |
Item 13. | Certain Relationships and Related Transactions | 42 |
Item 14. | Principal Accountant Fees and Services | 42 |
|
|
|
PART IV |
|
|
|
|
|
Item 15. | Exhibits | 43 |
|
|
|
Signatures |
| 44 |
PART I
SPECIAL NOTE REGARDING FORWARD-LOOKING STATEMENTS
This Unaudited Annual Report contains forward-looking statements. These forward-looking statements are based largely on our expectations and are subject to a number of risks and uncertainties, many of which are beyond our control. Actual results could differ materially from these forward-looking statements as a result of, among other factors, risks related to the large amount of our outstanding term loan; history of net losses and accumulated deficits; reliance on third parties to market, sell and distribute our products; future capital requirements; competition and technical advances; dependence on the oil services market for pipe and well cleaners; ability to protect our patents and proprietary rights; reliance on a small number of customers for a significant percentage of our revenues; and other risks. In light of these risks and uncertainties, there can be no assurance that the forward-looking information contained in this Annual Report will in fact occur.
Item 1. Description of Business
General
Digital Brand Media & Marketing Group, Inc. (“we”, “us”, “our”, “DBMM”, “DBMM Group”, the “Company”) f/k/a RTG Ventures, Inc. (“RTG”) is an OTC:QB listed company. The Company was organized under the laws of the State of Florida on September 29, 1998.
On March 20, 2007, we entered into a Share Exchange Agreement (the "Agreement") with Atlantic Network Holdings Limited, New Media Television (Europe) Limited ("NMTV"), and Certain Outside Stockholders to acquire all of the outstanding shares of NMTV. Atlantic Network Holdings Limited is a Guernsey company limited by shares and NMTV is a United Kingdom private company limited by shares. The transaction was subject to the fulfillment of certain conditions, including the satisfactory completion of the audit of NMTV's financial statements for each of its past three fiscal years. The conditions of closing were not met by ANHL and the agreement was rescinded via 8-K/A on March 30, 2010.
DBMM entered into a Share Exchange Agreement (the “Exchange Agreement”), on March 31, 2010, with Cloud Channel Limited which was subsequently re-named as RTG Ventures (Europe) Limited in July 2010 (“RTG Ventures (Europe)”). Pursuant to the Exchange Agreement, the Company acquired 100% of the outstanding capital stock of RTG Ventures (Europe) from its stockholders for consideration consisting of Convertible Preferred Shares of RTG Ventures, Inc. according to the derivative valuation methodologies outlined in the Share Exchange Agreement of Stylar Limited, a/k/a Digital Clarity. RTG Ventures (Europe) has been valued 12 months forward “notionally” one year hence. An 8-K/A was filed in September 2010 containing audited financials of the acquisition of Stylar Limited which completed the transaction. Shareholders converted the preferred shares into common stock using the average share price of the 30 days preceding September 3, 2011 which provided a share price of $0.016083. The methodology provided a valuation of 4X net profit. All preferred stock was held by DBMM's transfer agent for the 12 month period ending September 3, 2011. All voting shares were held by management.
Subsequent to the close of the fiscal year 2011 following substantial investment, the Company conducted a structural review of its total product and services offering. The review was carried out by the Board of Directors. The result was to bring technology development being outsourced directly into the Company to steward on a daily basis and any activities which were not revenue generating in the near term were eliminated. Certain business lines were eliminated from the Business Plan immediately. In October, 2011 the joint venture with iPayu was mutually withdrawn and in December, 2011 the acquisition of Bitemark Ltd. was rescinded. The companies reverted to the same position each held prior to the contracts. The rescission of the Bitemark Ltd. share purchase agreement was included as an exhibit to the filing for the 2011 fiscal year even though it constituted a subsequent event at the time.
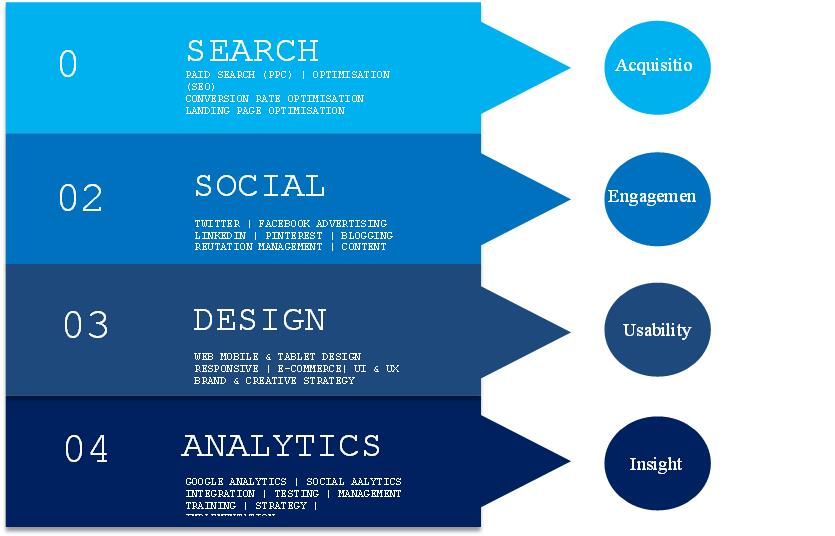
As a further result of the review, the Company also agreed to strategically focus on developing the business of its wholly owned and revenue generating online marketing services company, Digital Clarity. With deep DNA in its operating market, blending the services of an experienced professional workforce, leveraging a technology offering positions the Company in a strong, forward looking structure. Digital Clarity operates in the growing area of digital marketing that helps companies make the most the digital economy focusing on areas such as Search
Engine Marketing (Google, Yahoo! & Bing), Social Media (Twitter, Facebook & LinkedIn) and Internet Strategy Planning including Design, Analytics and Mobile Marketing.
During the last quarter of fiscal 2012, the Company entered into an agreement with BrandEntertain. Digital Brand Media & Marketing Group, Inc. (f/k/a RTG Ventures, Inc.) and Brand Entertain have agreed to restructure their agreement retroactively to June 11, 2012. BrandEntertain is a partnership and there were certain issues with partnership financials which suggested the business combination be construed as a collaboration/cooperative venture, rather than an acquisition. Upon analysis, one year following the initial transaction, the agreement was rescinded and no consideration was received by BrandEntertain.
On March 5, 2013, Digital Brand Media & Marketing Group, Inc. filed a Certificate of Amendment to its Articles of Incorporation to change its name from “RTG Ventures, Inc.” to “Digital Brand Media & Marketing Group, Inc.” In connection with the name change, the Company’s trading symbol changed from “RTGV” to “DBMM” (the “Symbol Change”). The Amendment was effective as of March 20, 2013. The Name Change and Symbol Change have been reflected in the Company’s ticker symbol as of April 8, 2013.
Also on March 5, 2013, Digital Brand Media & Marketing Group, Inc. received approval from the Financial Industry Regulatory Authority (FINRA) for its 100 to 1 reverse stock split.
A summary of the business is: DBMM Group crafts, designs and executes digital marketing strategies across multiple ad platforms and social media networks for a broad array of clients to help each of them establish a uniform brand identity across the digital universe. The product offering is a unique value proposition of intelligent analytics provided by an experienced digital marketing and technology team. Therefore DBMM Group is a blend of data, strategy and creative execution.
Digital Clarity is a trading brand for Stylar Limited, a wholly owned company of DBMM, through its office in London, England. The Company is a multi-service digital marketing agency which specializes in creating effective strategies and campaigns for clients across a range of vertical markets, working in three key areas:
§ SearchEngine Marketing – for search engines like Google, Yahoo etc.
§ WebDesign – building sites for web, mobile and tablet devices
§ SocialMedia – planning and measuring social metrics digitally in order to diagnose strategy
DBMM Group can leverage its team’s experience in digital media and provide leading strategy, deployment and measurement to its core markets in many industry sectors, from creative to traditional corporate. Entertainment, Fashion and Sports industries, as well as Automotive and Ecommerce are target markets.
The Company is rolling out the services of both the technology and marketing service offering of the business from its current base in London, England, and during 2013 into larger markets in the United States, namely Los Angeles and New York. The intent in fiscal year 2014 is to grow into many geographic areas through partnerships in order to develop multiple revenue streams following the model developed this year.
Fiscal year 2013 reflected the Company’s continued progress in making inroads into the United States by being awarded contracts for a number of clients in the search marketing sector. One of the successful contract models the Company utilized, leveraged its expertise in the web design arena by building a website with a media partner that it intends to expand globally and build upon in 2013 and beyond. This is an example of developing an ongoing relationship with a client which allows our Company to grow in tandem with a client company.
Sales and Marketing
Our sales team focuses on adding new advertisers to our business, while our business development and partnership initiatives focuses on adding new reseller partnerships, selectively adding new distribution partnerships and servicing existing partnerships. Our marketing department focuses on promoting our services through online customer acquisition, affiliate relationships, press coverage, strategic marketing campaigns and industry exposure. Advertising and promotion of our services is broken into four main categories: direct sales, reseller partnerships, online acquisition, and referral agreements. The Directors also take an active role in business development.
Research and Development
The Company has a strong forward looking focus in building out a robust and lean platform that will provide revenue generation through the business model described.
There is a current need for investment in building out the development team and creating a proprietary infrastructure to scale and evolve the technology platform and to market to end users.
Employees
In fiscal 2013, the Company had five full-time employees.
Competition
There is strong competition in the digital marketing arena, though with the right level of investment and marketing, Digital Clarity has a confident outlook in using its experience to win new business in both local and international markets. DBMM has significant business relationships in place.
DBMM Group’s Current Markets
§ Entertainment/Fashion/Sports/Automotive/Ecommerce Technology Solutions
§ Digital Marketing Strategic Consulting Services
The Growth of Social Technology and Search
THE MARKET ENVIRONMENT – SEARCH
Businesses now spend 24% of total marketing budget on paid search![[rtgventures_10k083113002.gif]](rtgventures_10k083113002.gif)
Digital Marketing Services
Digital Clarity is a specialist Digital Marketing Agency that has been at the forefront of online marketing. The company is a multi-service digital marketing agency who specialize in creating effective strategies and campaigns for clients and agencies across a wide range of verticals.
Specializing in Search Engine Marketing, Web Design, Social Media including Digital Analysis, the company works with both major brands and medium sized companies to help leverage online brand presence and new customer acquisition strategy. Digital Clarity also delivers consultancy and strategy planning for both client companies and advertising agency partners.
The Company Profile:
§ Revenue Generating Company
§ Cash Flow Positive
§ Experienced Team
§ Strong Client Base
§ Centers of Excellence Today – US & Europe
§ Future Geographic Reach – UAE & Asia
§ Reach to Celebrity & A-List Performers
§ Established Relationships with Media Groups like Google
§ Poised for the Growth in Digital Marketing & Advertising
Services Offered by Digital Clarity continue to grow with client relationships. Led by the Head of US Operations, Steve Baughman, the Company has begun to leverage with an objective to potentially integrate his music and entertainment contacts to help build on its existing service offering.
Pay per Click Advertising (PPC)
Pay per click (PPC) (also called Cost per click) is an Internet advertising model used to direct traffic to websites, where advertisers pay the publisher (typically a website owner) when the ad is clicked. With search engines, advertisers typically bid on keyword phrases relevant to their target market. Content sites commonly charge a fixed price per click rather than use a bidding system. PPC "display" advertisements are shown on web sites with related content that have agreed to show ads.
Search Engine Optimization (SEO)
Search engine optimization (SEO) is the process of improving the visibility of a website or a web page in search engines via the "natural" or un-paid ("organic" or "algorithmic") search results. In general, the earlier (or higher ranked on the search results page), and more frequently a site appears in the search results list, the more visitors it will receive from the search engine's users. SEO may target different kinds of search, including image search, local search, video search, academic search, news search and industry-specific vertical search engines.
As stated in Eric Siu, “24 Eye Popping SEO Statistics” in searchenginejournal.com and the Interactive Advertising Bureau’s “IAB Advertising Report” of October 2013, search engines are the most important tool today in website optimization. 93% of online experiences begin with a search engine and 82.6% of internet users use search. Furthermore, 88.1% of US internet users ages 14+ researched products online in 2012 and there are over 100 billion global searches being conducted each month.
Analytics
The measurement, collection, analysis and reporting of internet data for purposes of understanding and optimizing web usage.
Email Marketing
Description: Email marketing is a form of direct marketing which uses email as a means of communicating commercial or fund-raising messages to an audience. In its broadest sense, every email sent to a potential or current customer could be considered email marketing.
SMS Marketing
Users of an SMS service can exchange text messages either from mobile to mobile or through a specialist internet website to a handset about anything from promotional offers, to general information regarding a product or service. Messages are usually sent using a short code system. Short codes are around 5 or 6 digits in length and work by asking customers to text a certain keyword to a specific code. E.g. ‘Text WIN to 84841’.
Web Design & Development
To lead a highly competitive environment, the process of planning and creating a website requires both art and technology prowess. Text, images, digital media and interactive elements are used by Digital Clarity’s designers to produce the page seen on the web browser. As a whole, the process of web design can include conceptualization, planning, producing, post-production, research, and advertising. The site itself can be divided into it pages. The site is navigated by using hyperlinks commonly these are blue and underlined but can be made to look like anything the client wishes.
Item 1A. Risk Factors
Smaller reporting companies are not required to provide the information required by this item.
Item 1B. Unresolved Staff Comments
Not applicable.
Item 2. Description of Property
DBMM’s corporate address is 747 Third Avenue, 2nd FL, New York, NY 10017. The Company has a one year renewable lease. In April 2012, Stylar Limited entered in to a 5 year lease. Under the terms of the current lease the annual base rent is approximately $17,000. This office is located in the UK.
Item 3. Legal Proceedings
None
Item 4. Reserved
PART II
Item 5. Market for Common Equity, Related Stockholder Matters and Issuer Purchases of Equity Securities
Market Information
Our common stock is currently listed for quotation on the OTC:QB under the symbol "DBMM".
Per Share Market Price Data
The following table sets forth, for the fiscal quarters indicated, the high and low closing bid prices per share for our common stock, as reported by on PinkSheets.com. Such quotations reflect inter-dealer prices, without retail markup, markdown or commission and may not represent actual transactions.
| | | |
| Year Ended August 31, 2013: | High | Low |
| First Quarter | $0.06 | $0.05 |
| Second Quarter | $0.035 | $0.035 |
| Third Quarter | $0.02 | $0.02 |
| Fourth Quarter | $0.018 | $0.01 |
|
|
|
|
| Year Ended August 31, 2012: | High | Low |
| First Quarter | $0.0039 | $0.0039 |
| Second Quarter | $0.0048 | $0.0035 |
| Third Quarter | $0.004 | $0.0031 |
| Fourth Quarter | $0.0015 | $0.001 |
The last reported sale price of our common stock on the OTC Electronic Bulletin Board on December 9, 2013 was $0.0013 per share. As of December 12, 2013, there were 130 holders of record of our common stock as well as over 1,200 shareholders under beneficial ownership through brokerage firms.
Dividends
We have never declared any cash dividends with respect to our common stock. Future payment of dividends is within the discretion of our board of directors and will depend on our earnings, capital requirements,
financial condition and other relevant factors. Although there are no material restrictions limiting, or that are likely to limit our ability to pay dividends on our common stock, we presently intend to retain future earnings, if any, for use in our business and have no present intention to pay cash dividends on our common stock.
Equity Compensation Plan Information
We did not issue any securities pursuant to equity compensation plans during the years ended August 31, 2013 or 2012.
Recent issuances of Unregistered Securities
In September, 2011, 65,000 shares of common stock were valued at $58,000 to consultants under the terms of the agreements for services.
In January 2012, 268,367 shares of preferred stock were issued to satisfy $228,929 in accrued salary due to an officer of the Company.
In January 2012, 471,345 shares of preferred stock were issued to three officers of the Company.
In March 2012, 97,596 shares of preferred stock were converted into 5,176,894 shares of common stock for the minority shareholders pursuant to the share exchange agreement with Stylar Limited a/k/a Digital Clarity.
In May 2012, the Company announced the appointment of an executive officer as Head, US Operations and issued him 50,000 shares of preferred stock as a sign on bonus.
During the year ended August 31, 2012, 3,797,719 shares of common stock were issued to satisfy approximately $250,499 of convertible notes payable and 119,215 shares of common stock were issued to satisfy $8,120 in accrued interest.
During the year ended August 31, 2012, 1,489,375 shares of common stock were issued to satisfy $228,499 of loans payable. These conversions resulted in a modification expense of $172,694.
In June 2012, the Company entered into a cooperative venture agreement with BrandEntertain. Under the terms of the agreement, 2,000,000 Series 2 preferred shares were issued for the officers of BrandEntertain.
In the quarter ended August, 2012 the Company partially converted a convertible debenture for $26,464 at an average price of $0.00065 and issued 47,000,000 shares.
In the quarter ended August, 2012, a note holder received 16,132,389 shares for $26,500 valued at an average price of $0.0017 per share in connection with the partial conversion of a loan payable.
In November 2012, 41,995 shares of Preferred Stock-Series 1 Designation were issued for an accrual to satisfy a debt of $35,824.
In November 2012, 433,637 shares of Preferred Stock-Series 1 Designation were issued to four officers of the Company in connection with compensation.
On March 5, 2013, Digital Brand Media & Marketing Group, Inc. received approval from the Financial Industry Regulatory Authority (FINRA) for its 100 to 1 reverse stock split. All shares have been retroactively adjusted to reflect the 100 to 1 reverse stock split.
In April 2013, 496,118 shares of Preferred Stock-Series 1 Designation were converted into 26,314,099 shares of restricted common stock by an officer of the Company.
In August 2013, 41,995 shares of Preferred Stock-Series 1 Designation were converted into 2,227,415 shares of restricted common stock by a consultant.
During the year ended August 31, 2013, 2,027,995 shares of restricted common stock were issued to satisfy $67,022 of convertible debt.
During the year ended August 31, 2013, 2,000,000 Preferred Shares-Series 2 were cancelled as a result of the termination of the arrangement with BrandEntertain. As a result the consideration associated with the transaction totaling $219,797 was reversed and reflected in the statement of operations as a reduction to expense.
Item 6. Selected Financial Data
As a “smaller reporting company”, as defined by Rule 10(f)(1) of Regulation S-K, the Company is not required to provide this information.
Item 7. Management’s Discussion and Analysis of Financial Condition and Results of Operation
Readers are cautioned that certain statements contained herein are forward-looking statements and should be read in conjunction with our disclosures under the heading "Forward-Looking Statements" on page 1. These statements are based on current expectations and assumptions that are subject to risks and uncertainties. This discussion also should be read in conjunction with the notes to our consolidated financial statements contained in Item 8. "Financial Statements and Supplementary Data" of this Report.
Background
DBMM is an OTC:QB listed company. Subsequent to the close of the fiscal year 2011 following substantial investment, the Company conducted a structural review of its total product and services offering. The review was carried out by the Board of Directors. The result was to bring technology development being outsourced directly into the Company to steward on a daily basis and any activities which were not revenue generating in the near term were eliminated. It was unanimously agreed that the company would adopt a lean approach that focused on the relationships and partnerships. To that end, the Company has added significant partnerships through Letters of Intent, Joint Ventures and various collaborative structures involving revenue sharing arrangements.
Operations Overview/Outlook
Operationally, 2013 has been important in continuing the direction of the Company and steering it toward a scaled, sustainable growth plan. The model developed in fiscal 2012 has been reinforced and is differentiating to clients, therefore, the model will continue into fiscal 2014.
Entertainment/Fashion/Sports/Automotive/Ecommerce Solutions
DBMM is taking its strengths including its relationships to build its business focus on a wide array of industries. The Company, under very competitive global market conditions and growing development needs, continues to identify partnership opportunities. Utilizing successful models with existing clients, the outlook remains strong for the future.
The heart of the business is the marketing consultancy. Understanding each client and developing the model to individualize the outlook has been essential. This kind of close relationship with the client resulted in Digital Clarity being considered a close professional advisor.
In fiscal year 2014, the Company will continue to focus on the positive results of the last year and use that model to expand geographic reach with existing and new partners.
Digital Marketing Services
2013 continues to see exponential growth in the adoption of Social Media as a communication, marketing and engagement avenues. An acceptance of change is driving revenue. The future growth in mobile search is on of the fastest growing ancillary businesses. It was clear that the direction, talent and growth of the Company is in its human capital and outside relationships which must be proactive in order to differentiate itself from competition
The clear opportunity is at the foundation of the Company, namely the need to expedite and encourage development in the digital marketing services sector. The marketing services product is labor intensive and thus the Company must jumpstart the growth by significant capital infusion in fiscal year 2014 to grow simultaneously in multiple geographies.
As a foundation, the financial review showed that Digital Clarity continued to be revenue generating and remained cash flow positive.
Key Milestones
During 2013, Digital Clarity continued to make inroads into established and emerging markets. In 2012, as part of this emphasis, that was greatly enhanced and supported by the Head of US Operations, Steven Baughman, the company won a major deal with a US based entertainment group. The group was seeking a seasoned agency that could fulfil its complex specifications and grow with its aggressive expansion plans throughout the US and beyond. Digital Clarity was awarded the contract, removing the competitors to win the design and development of the new website centered on an intelligent design as well as a strong understanding and execution of social media integration. This model became the template for contracts going forward.
DBMM signed a Letter of Intent with Video Media Holdings, Inc. (VMS) to become its reseller in Europe with other revenue streams being explored as well. The value proposition for VMS strengthens DBMM’s offering to its clients. VMS Holdings, Inc. develops a mobile application for sharing videos. Its mobile application allows companies and users to send and receive video content to and from a mobile phone; subscribe for a favorite celebrity, actor, TV-channel, or team and get video updates; and create your own channel and become a broadcaster, as well as serves as a tool for mobile marketing and sales. The company's mobile application is available for Android, BlackBerry, iPhone, and Symbian devices. It distributes its mobile application through distributors, and mobile device and application stores in Africa, Europe, Asia, North America, and South Africa. It serves mobile operators and media companies, government organizations and law enforcement agencies, premium content providers and retailers, sports clubs, and celebrities worldwide.
DBMM finalized an agreement with New York based digital marketing automation platform, BRANDmini LLC, to strategically broaden BRANDmini's delivery of its SaaS (Software as a Service) application; primarily looking after those larger clients seeking to leverage a more bespoke digital marketing service abroad. BRANDmini is a transactional marketing automation platform for creating, serving, and measuring marketing campaigns across multiple online channels and mobile devices. Our platform is integrated with leading ad networks, publishers, mobile platforms and social sites. BRANDmini's innovative In-Page technology empowers brands to engage and transact with consumers while they are browsing. Now anyone can build branded transactional ads, gadgets, social landing pages and run campaigns anywhere your customers are.
These two partnerships illustrate the execution of DBMM’s strategic direction which strengthens the Company through its revenue sharing relationships resulting in additional revenue streams.
Many clients in the UK such as Mercedes Benz, UK, Wharfside and Duvet & Pillow Warehouse have experienced increases in revenue and increases in conversion as a result of Digital Clarity’s strategic direction. These case studies are excellent resources for new clients.
Digital Clarity Named in Top Ten Best Social Media Marketing Firms in the UK for 2013
"Topseos.co.uk , an independent research firm, revealed the listing of the top 10 best social media marketing agencies in the UK based on their strength and competitive advantage. Social media marketing companies are put through a methodical analysis to ensure the rankings contain the absolute best companies the search marketing industry has to offer."
Digital Clarity was awarded a spot in the top 10. The process for researching and declaring social media marketing agencies in the UK is based on the use of a set of analysis criteria and learning more about their solutions and their communications with their customers through references. The teso.co.uk independent analysis team communicates directly with the clients in order to inquire about the solutions and achievement from the client's perspective.
Key Differentiators
2013 has been about establishing strong foundations by restructuring financially, continuing to streamline operations and assessing activities on a cost benefit basis while developing new partnerships and relationships. This focus has allowed the Company to enhance brand value for its clients. 2014 will continue to be about growth and outreach.
As the internet and mobile arena continues to mature, the need to make sense of and manage companies through this often complex market is clearly an area of massive growth. The company is confident that the talent and experience within the digital marketing team is poised for a major springboard in 2014, but must be expanded significantly in order to support the global reach intended.
Artist Collaboration, driven by Co-Chief Operating Officer and Head, US Operations, Steve Baughman, is an area that will see exponential growth in the coming 12 months and beyond. Artists and brands that look to leverage their celebrity status will look to companies such as Digital Clarity to help drive and develop their brand in the growing and complex arena of social media.
Market Reach
The Company has reach and experience across a large number of vertical markets including, but not limited to: Entertainment/Fashion/Sports/Automotive/Ecommerce.
Relationships and Industry Contacts
The team at Digital Clarity have professional and personal contacts, including some long-term relationships, at companies such as Google, Microsoft and Facebook, often being invited to attend strategic market briefings and insights.
Partnerships and agency management have allowed Digital Clarity to work on some of the biggest brands, sitting behind the agencies as a support and resource to deliver very high quality service and results to their clients.
Team Expertise
![[rtgventures_10k083113004.gif]](rtgventures_10k083113004.gif)
Examples:
§ PPC campaign experience especially Google AdWords existed
§ SEO evolution from aggressive link building and onsite SEO through to strategic marketing integration of inbound marketing
§ Website design and development based on results driven design and planning
§ Brand consultancy
§ Social media management and advertising. Several clients have been “won” directly via Digital Clarity’s internal social media strategy
§ Sales and account management experience from multi-disciplined backgrounds
Evolution and Flexibility
The market is continually changing. Digital Clarity has always remained ahead of the curve and given their clients peace of mind by remaining a true strategic partner.
Creative, Individualized Solutions and Customer Service
Case Studies and testimonials reflect the client-centric approach of Digital Clarity. Being selected over larger more established firms, support that we provide the client with skills that are differentiating. The Digital Clarity Brand is being established positively.
Growth opportunities in the Market
As the use of web mobile sites and applications grow, so do the complexities and challenges of using these sites and platforms commercially. Digital Clarity directs business through the maze of an often confusing and sophisticated set of barriers, to create a clear path for the customer to our clients product or service. As this market matures, the need for companies to rely on the services from Digital Clarity can only grow. Here we look at some of the growth areas in Digital Clarity’s arsenal.
Growth & Opportunities in Design
§ 644,275,754– number of active web pages 1st QTR 2012 - NetCraft
§ 6 million domains added in quarterly - Verisign
§ By 2015, Mobile Internet Usage Will Increase by Factor of 26 - CISCO
§ 665 million media tablets in use worldwide By end of 2016 - Gartner Group
Growth & Opportunities in Search
§ The North American Search industry will grow from $19.3 bn in 2011 to $26.8bn in 2013 - SEMPO
§ Revenue from Localized Mobile Ads to Reach $5.8 Billion in U.S. by 2016 - BIA/Kelsey
§ U.S. search spend grew by 11 percent Year over Year, while ROI improved by 26 percent - Adobe
§ 72% of Consumers Want Mobile-Friendly Sites - Google Research
§ 2million search queries are made on Google, every minute - Google
§ Growthin Corporate Search - 50% of Fortune 100 Companies have a Google+ Account
Growth & Opportunities in Social Media
Fortune Global 100 companies have more accounts on each platform than ever before with an average:
§ 10.1 Twitter accounts
§ 10.4 Facebook pages
§ 8.1 YouTube channels
§ 2.6 Google Plus pages
§ 2.0 Pinterest accounts
§ Seventy-four percent of companies studied have a Facebook page.
§ Ninety-three percent of corporate Facebook pages are updated weekly.
§ Forty-eight percent of companies are now on Google Plus.
§ Twenty-five percent of companies have Pinterest accounts.
§ Each corporate Facebook page has an average of 6,101 people talking about it.
The need for DBMM to reach Global Markets
It is clear that the economy continues its slow recovery from the global effect of market forces which impact on all areas of commerce and trade. As the markets remain volatile, the opportunity for a company like DBMM to approach new business with its proven track record, increases. The core markets remain US and English speaking European markets. Emerging markets are a target for 2014. BRIC countries (Brazil, Russia, India and China) will be the next targets from the emerging markets.
Internet usage is poised for explosive growth across Asia, driving massive consumer demand for digital content and services. The biggest challenge for businesses hoping to meet this demand is how to make money will while creating low-cost content. According to McKinsey & Co, India and China are driving the next digital revolution via new mobile devices.
The Company intends to further extend its services in the Middle Eastern market initially then review the successes using a lean methodology and continuous improvement along the way, and then roll out to the BRIC markets.
US
The US remains the center of the entertainment, technology and digital industries and as such the emphasis looking forward to 2014 and building on the recent success in the last quarter of the 2013 calendar year means that DBMM and its agency Digital Clarity are perfectly positioned to spring board into this market using the successful models established over the last two years.
The digital market continues to be focused on New York and Los Angeles therefore DBMM’s triangle of London/New York/LA is strategically sound. We are establishing a strong digital marketing presence in the Los Angeles area to cover the entertainment and music market and then plan to have the same model in New York. Our corporate offices are located in New York, however Los Angeles remains a key regional base from which to build and expand relationships, while a New York presence is equally important to serve and build relationships in the largest advertising market in the US.
The Asian American Market - An Unusually Attractive Opportunity
• Fast Growing: -Current Population - 13+ Million - 49% population growth 1990-2000; 29% growth 2000-2008.
• Educated & Affluent: -44% holding BA degree - vs. 28% of Non-Hispanic Whites -Median HH income almost $10K greater than Non-Hispanic Whites
• Geographically Concentrated: -More than 50% reside in 3 states alone: CA, NY, TX.
• Money to Spend:
• $509 billion in annual purchasing power.
• Entrepreneurial and Driven -Own and operate 1.1 million business nationally, generating $343 billion in annual revenue.
• Cost Efficient Reach -Almost 1,000 targeted media outlets reaching Asians nationally, with lowest CPMs of all consumer segments.
Europe
As the current base of the digital marketing agency is in London England, it is perfectly placed to reach out to the broader European market to replicate the Company’s model in the stronger economies in this region. As with the relationships mentioned in the US, opportunities were advanced with US partners to leverage Digital Clarity’s reach in this region and help take established US agencies into the European region.
In 2013, the execution of this aspect of the business plan is illustrated by the agreements with VMS and Brandmini to represent them outside the United States, initially in Europe.
Middle East
The Middle East is a fertile market for heritage based US and European brands looking for entry into this lucrative market. The fastest area for growth in this sector is to leverage on the luxury arena. Digital Clarity is already in discussions with a number of different luxury groups each with different brands within the group.
Given the complexity of the region as well as the enormous potential, it is important that Digital Clarity aligns itself with established players in local markets. With this in mind, Digital Clarity will look to collaborate with some digital agency partners where there is already a relationship and create a strategy that allows the company to look at the breakdown of current digital competence of these brands focusing on various touch points such as tablets, sites, mobile & social reach in the Middle East.
Our value proposition is very much about creating digital penetration of the Middle Eastern market for a particular group and how those brands would be positioned to create brand value – a byproduct of which would be sales.
Support for growth in the Middle East
§ Worldwide luxury goods continues double-digit annual growth; global market now tops €200 billion
§ Dubai commands around 30 per cent of Middle East luxury market and around 60 per cent of the UAE’s luxury market
§ The Dubai Mall accounts for around 50 per cent of Dubai’s luxury purchases
§ Each year, more “HENRYs” (High Earnings, Not Rich Yet) become potential customers, with ten times as many HENRYs as ultra-affluent individuals
§ The rise of the middle class in emerging countries is polarizing the competitive arena, becoming a “new baby-boom sized generation” for luxury brands to target.
Financial Overview/Outlook
DBMM began the 2013 fiscal year with significant challenges while continuing to streamline the Company which resulted in a reduction of 39% in operating expenses couple with a decrease in other expenses of 56%. While the Company is still operating at a loss, the loss was 46% less than 2012. The focus remains on the growth of digital marketing services and technology driven through Digital Clarity. The cost of sales has decreased by 19% while gross profit increased by 3%. DBMM is a marketing services company which is labor intensive in order to provide a differentiating product to its clients. As such, it is imperative to raise a significant amount of capital to hire professionals who can deliver profit to the Company within a quarter. The proven model carried in our financials is each new hire/client averages a margin of 35%-55%, straight line and simple. On that basis, our target is to recruit 10-20 new staff to represent a critical mass and scale up our revenues proportionately.
The Company restructured through a reverse stock split in early 2013 coincident with a name change and trading symbol change effective in April, 2013.
Unfortunately all of the corporate realignment took a significant portion of the fiscal year, thus a significant capital raise was deferred until 2014 in order to follow the fiscal year 2013 audit. In the interim, the Company relied on short-term financing, a practice which we do not expect to continue in 2014 when it will be replaced by long term financing.
However, the weakened share price remains a challenge to the Company. In the last two years having revenues of approximately $500,000 would suggest a conservative market multiple of x10-x16, the latter being the manufacturing average, the market cap of DBMM should be a minimum of $5,000,000. The multiples for media tend to be at the higher end of the spectrum, therefore, compared to other companies in this sector, DBMM is significantly undervalued. The issue will be addressed as a priority early in the 2014 fiscal year. Professional advisors suggested that in order to position the Company successfully with the long-term financial community, a restructuring was required. The Company concluded its reverse split and name change and post - fiscal year 2013
filing of the 10-K, will be in a good position to continue discussions with a number of target groups. In addition an investment bank in New York is collaborating with DBMM in the identification of a significant acquisition in our industry sector. Initial due diligence is now taking place.
In summary, DBMM’s financing efforts have always been in short term, small amounts of working capital. That is going to change in 2014. Going forward, DBMM intends to embark on a significant capital raise to allow the Company to scale up geographically and maximize our global reach through partnered relationships. This strategy is the most efficient and effective path to grow DBMM quickly into multiple revenue streams. We have proven the model in the last year. Our marketing services’ offering is a labor intensive endeavor, wherein human capital is a key differentiator of knowledge and/or relationships. What we have discussed here is organic growth which will be conducted in conjunction with concluding an acquisition in the digital technology/marketing services sector.
After a very difficult year, fraught with challenges and hurdles, we see 2014 as poised for growth on multiple fronts. With capital infusion, which will allow us to bring in new clients, grow existing successful clients and service them accordingly, coupled with an offer of a deferred tax asset to attract partners with significant revenue and expansion patterns, we will have a model in place which will be sustainable.
Off-Balance Sheet Arrangements
We are not currently a party to, or otherwise involved with, any off-balance sheet arrangements that have or are reasonably likely to have a current or future material effect on our financial condition, changes in financial condition, revenues or expenses, results of operations, liquidity, capital expenditures or capital resources.
Recently Issued Accounting Pronouncements
Management does not believe that any recently issued, but not yet effective, accounting standards, if currently adopted, could have a material effect on the accompanying financial statements.
Reclassifications
Certain amounts in the prior period financial statements have been reclassified to conform with the current period presentation.
Significant and Critical Accounting Policies
Our discussion of the financial condition and results of operations is based upon our consolidated financial statements, which have been prepared in conformity with accounting principles generally accepted in the United States. The preparation of our consolidated financial statements requires management to make estimates and assumptions that affect the reported amounts of assets and liabilities, revenues and expenses, and related disclosure of any contingent assets and liabilities at the date of the financial statements. Management regularly reviews its estimates and assumptions, which are based on historical factors and other factors that are believed to be relevant under the circumstances. Actual results may differ from these estimates under different assumptions, estimates or conditions.
Critical accounting policies are defined as those that are reflective of significant judgments and uncertainties, and potentially result in materially different results under different assumptions and conditions. See “Notes to Consolidated Financial Statements” for additional disclosure of the application of these and other accounting policies.
LIQUIDITY AND CAPITAL RESOURCES
After the Board’s strategic review post-2011 fiscal year, we have migrated the technology in-house and are concentrating on activities which will grow Digital Clarity organically and by acquisition. We spent fiscal year 2012 establishing a client model for existing and new customers which can be exported geographically.
FISCAL YEAR 2013
We had $0 cash at August 31, 2013, though we had substantial cash in the first week of fiscal 2014. Our working capital deficit amounted to approximately $2.2 million at August 31, 2013.
During fiscal 2013, we used cash in our operating activities amounting to approximately $334,000. Our cash used in operating activities was comprised of our net loss from continuing operations of approximately $670,000 adjusted for the following:
| | | |
|
| · | Fair value of shares issued of approximately $28,000 |
|
| · | Amortization of debt discount of approximately $248,000 |
|
| · | Change in fair value of derivative liability of approximately $51,000 |
|
| · | Bad debt expense of approximately $7,000 |
|
| · | Depreciation of approximately $3,000 |
Additionally, the following variations in operating assets and liabilities impacted our cash used in operating activity:
| | | |
|
| · | An increase in our accounts payable and accrued expenses of approximately $119,000, resulting from slower payment processing due to our financial condition. |
|
| · | An increase in our accrued salaries of approximately $144,000, resulting from partial payments made due to our financial condition. |
|
| · | A decrease in our accounts receivable of $33,000 resulting from a decrease in sales coupled with the Company’s ability to successfully collect its fees. |
During fiscal 2013, we used cash from investing activities of approximately $600, for purchase of fixed assets.
During fiscal 2013, we generated cash from financing activities of $307,000, which consist of the proceeds from the issuance of loans and convertible notes offset by principal repayments on such debt amounting to approximately $55,000.
FISCAL YEAR 2012
We had $78,131 cash at August 31, 2012. Our working capital deficit amounted to approximately $1.5 million at August 31, 2012.
During fiscal 2012, we used cash in our operating activities amounting to approximately $489,000. Our cash used in operating activities was comprised of our net loss from continuing operations of approximately $1.3 million adjusted for the following:
| | | |
|
| · | Fair value of shares issued of approximately $319,000; |
|
| · | Amortization of debt discount of approximately $264,000; |
|
| · | Change in fair value of derivative liability of approximately $51,000; |
|
| · | Bad debt expense of approximately $25,000; |
|
| · | Interest related to modification of conversion price of debt of approximately $173,000; |
|
| · | Depreciation of approximately $2,000; |
Additionally, the following variations in operating assets and liabilities impacted our cash used in operating activity:
| | | |
|
| · | An increase in our accounts payable and accrued expenses of approximately $1,000, resulting from slower payment processing due to our financial condition as well as an increase in expenditures of RTG Ventures (Europe). |
|
| · | An increase in our accrued salaries of approximately $92,000, resulting from partial payments made due to our financial condition. |
|
| · | A decrease in our accounts receivable of $7,000 resulting from sales made by acquisition. |
During fiscal 2012, we used cash from investing activities of approximately $2,000, for purchase of fixed assets.
During fiscal 2012, we generated cash from financing activities of approximately $509,000, which consist of the proceeds from the issuance of loans, convertible notes, and capital contributions of approximately $548,000 offset by principal repayments on such debt amounting to approximately $40,000.
RESULTS OF OPERATIONS
Comparison of the Results for the Years Ended August 31, 2013 and 2012
We currently generate revenue through our Pay-Per-Click Advertising, Search Engine Marketing, Search Engine Optimization Services, Web Design, Social Media, Digital analytics and Advisory Services.
Revenue for the years ended August 31, 2013 and 2012 was approximately $409,000 and $458,000, respectively. In 2013 our primary sources of revenue are the Per-Click Advertising, Web Design Fee Income and Search Engine Optimization Services. These primary sources amounted to greater than 84% of our revenues or approximately $343,000. Our secondary sources of revenue are SMS Fee Income, Social Fee Income, Email Media Income and SMS Media. These secondary sources amounted to approximately 16% of our revenues or approximately $50,000. In 2012 our primary sources of revenue are the Per-Click Advertising, Web Design Fee Income and Search Engine Optimization Services. These primary sources amounted to greater than 88% of our revenues or approximately $405,000. Our secondary sources of revenue are SMS Fee Income, Social Fee Income, Email Media Income and SMS Media. These secondary sources amounted to approximately 11% of our revenues or approximately $50,000.
We recognize revenue upon the completion of our performance obligation, provided that: (1) evidence of an arrangement exists; (2) the arrangement fee is fixed and determinable; and (3) collection is reasonably assured.
Cost of sales for the years ended August 31, 2013 and 2012 was approximately $234,000 and $288,000, respectively. In 2013, 100% of cost of sales included advertising, salaries and media spend. This resulted in gross margins of approximately $174,000 for the fiscal year 2013. In 2012, 100% of cost of sales included advertising, salaries and media spend. This resulted in gross margins of approximately $170,000 for the fiscal year 2012.
General and administrative costs decreased 12% to approximately $212,000 from approximately $242,000 for the fiscal years ended August 31, 2013 and 2012, respectively. This is primarily attributable to the streamlining of overhead in the parent company in the US resulting in a decrease in expenditures.
Payroll increased in 2013 by 13% to approximately $232,000 as a result of the Company’s increase in the number of employees as well as a full year of partial accrued compensation relating to one of the Company’s Co Chief Operating Officer.
Professional fees (which include accounting/auditing, consulting and legal fees) decreased by approximately $460,000 for the fiscal year ended August 31, 2013. This decrease is primarily attributable to the decreased consulting and legal fees in 2013 as well as the reversal of the consideration associated with the BrandEntertain agreement totaling $219,797.
Amortization and depreciation for the years ended August 31, 2013 and 2012 was approximately $251,000 and $266,000 respectively. The decrease is due to the full amortization of existing notes as well as the decrease in the number of new convertible notes.
Interest expense for the years ended August 31, 2013 and 2012 was approximately $176,000 and $92,000 respectively. An increase of approximately $85,000 or 92% which is the result of interest associated with the notes payable issued in 2013 and 2012 which were not converted and continue to accrue interest.
ITEM 7A. QUANTITATIVE AND QUALITATIVE DISCLOSURES ABOUT MARKET RISK.
As a “smaller reporting company”, as defined by Rule 10(f)(1) of Regulation S-K, the Company is not required to provide this information.
EXPLANATORY NOTE
The accompanying consolidated August 31, 2013 financial statements are in the process of being audited by the Company’s independent registered public accounting firm, RBSM, LLP, in accordance with SEC Regulation S-X and, therefore, contain only pre-audit numbers. There was considerable additional work because of a re-audit requirement of previous years which caused a delay. Once the August 31, 2013 consolidated financial statement have been audited and confirmed by the Company’s independent registered public accounting firm, the Company shall file and include the accountants audit report and financial statements by amendment on SEC Form 10-K/A. It is anticipated the audited financials for fiscal year 2013 shall be available shortly.
ITEM 8. CONSOLIDATED FINANCIAL STATEMENTS
| | |
|
|
|
| Consolidated Balance Sheets (Unaudited) | F-1 |
|
|
|
| Consolidated Statements of Operations (Unaudited) | F-2 |
|
|
|
| Consolidated Statements of Cash Flows (Unaudited) | F-3 |
|
|
|
| Consolidated Statement of Stockholders' Deficit (Unaudited) | F-4 |
|
|
|
| Notes to Consolidated Financial Statements (Unaudited) | F-5 – F-16 |
| DIGITAL BRAND MEDIA & MARKETING GROUP, INC. AND SUBSIDIARIES | ||||
| CONSOLIDATED BALANCE SHEETS | ||||
| (UNAUDITED) | ||||
| | | | | |
| | | August 31, | | August 31, |
| | | 2013 | | 2012 |
| | | | | |
| ASSETS | ||||
| CURRENT ASSETS | | | | |
| Cash | | $ - | | $ 78,131 |
| Accounts receivable, net | | 35,520 | | 61,444 |
| Prepaid expenses and other current assets | | 6,357 | | - |
| Total current assets | | 41,877 | | 139,575 |
| | | | | |
| Property and equipment - net | | 1,915 | | 4,287 |
| | |
| |
|
| TOTAL ASSETS | | $ 43,792 | | $ 143,862 |
| | | | | |
| LIABILITIES AND STOCKHOLDERS' DEFICIT | ||||
| | | | | |
| CURRENT LIABILITIES | | | | |
| Accounts payable and accrued expenses | | $ 372,737 | | $ 294,138 |
| Bank overdraft | | 5,135 | | - |
| Accrued salaries | | 860,094 | | 716,475 |
| Loans payable | | 512,000 | | 269,500 |
| Derivative liability | | 151,329 | | 112,828 |
| Convertible debentures, net | | 321,588 | | 250,642 |
| | | | | |
| TOTAL CURRENT LIABILITIES | | 2,222,883 | | 1,643,583 |
| | | | | |
| STOCKHOLDERS' DEFICIT | | | | |
| Preferred stock, Series 1, par value .001; authorized 2,000,000 | | | | |
| shares; 893,407 and 955,888 shares issued and outstanding | | 893 | | 955 |
| Preferred stock, Series 2, par value .001; authorized 2,000,000 | | | | |
| shares; 0 and 2,000,000 shares issued and outstanding | | - | | 2,000 |
| Common stock, par value .001; authorized 1,000,000,000 | | | | |
| shares; 38,069,488 and 7,500,000 shares issued | | | | |
| and outstanding | | 38,069 | | 7,500 |
| Additional paid in capital | | 8,660,202 | | 8,698,712 |
| Other comprehensive loss | | (4,452) | | (3,441) |
| Accumulated deficit | | (10,873,803) | | (10,205,447) |
| | |
| | |
| TOTAL STOCKHOLDERS' DEFICIT | | (2,179,091) | | (1,499,721) |
| | | | | |
| TOTAL LIABILITIES AND STOCKHOLDERS' DEFICIT | | $ 43,792 | | $ 143,862 |
| | | | | |
| See Notes to Unaudited Consolidated Financial Statements | ||||
| DIGITAL BRAND MEDIA & MARKETING GROUP, INC. AND SUBSIDIARIES |
| ||||||||||||||||||
| CONSOLIDATED STATEMENTS OF OPERATIONS |
| ||||||||||||||||||
| (UNAUDITED) |
| ||||||||||||||||||
| | | | | | |
| |||||||||||||
| | | For the Year Ended August 31, |
| ||||||||||||||||
| | | 2013 | | | 2012 |
| |||||||||||||
| | | | | | |
| |||||||||||||
| SALES | | $ 408,505 | | | $ 457,814 |
| |||||||||||||
| | | | | | |
| |||||||||||||
| COST OF SALES | | 234,369 | | | 288,292 |
| |||||||||||||
| | | | | | |
| |||||||||||||
| GROSS PROFIT | | 174,136 | | | 169,522 |
| |||||||||||||
| | | | | | |
| |||||||||||||
| COSTS AND EXPENSES: | | | | | |
| |||||||||||||
| General and administrative | | 211,462 | | | 241,640 |
| |||||||||||||
| Payroll | | 231,600 | | | 204,610 |
| |||||||||||||
| Legal and professional fees | | 55,748 | | | 515,408 |
| |||||||||||||
| Amortization and depreciation | | 250,805 | | | 265,878 |
| |||||||||||||
| | | | | | |
| |||||||||||||
| TOTAL OPERATING EXPENSES | | 749,615 | | | 1,227,536 |
| |||||||||||||
| | | | | | |
| |||||||||||||
| OPERATING LOSS | | (575,479) | | | (1,058,014) |
| |||||||||||||
| | | | | | |
| |||||||||||||
| OTHER INCOME (EXPENSE): | | | | | |
| |||||||||||||
| Interest expense | | (176,527) | | | (91,757) |
| |||||||||||||
| Gain on foreign currency translation | | - | | | 662 |
| |||||||||||||
| Gain (Loss) on derivative liability | | 50,499 | | | 51,370 |
| |||||||||||||
| Gain on settlement of debt | | 33,151 | | | - |
| |||||||||||||
| Other Interest - Modification Expense | | - | | | (172,694) |
| |||||||||||||
| TOTAL OTHER INCOME (EXPENSE) | | (92,877) | | | (212,419) |
| |||||||||||||
| | | | | | |
| |||||||||||||
| NET LOSS | | $ (668,356) | | | $ (1,270,433) |
| |||||||||||||
| | | | | | |
| |||||||||||||
| OTHER COMPREHENSIVE INCOME: | | | | | |
| |||||||||||||
| Foreign exchange translation | | (1,011) | | | (1,393) |
| |||||||||||||
| COMPREHENSIVE LOSS | | $ (669,367) | | | $ (1,271,826) |
| |||||||||||||
| | | | | | |
| |||||||||||||
| NET LOSS PER SHARE | | | | | |
| |||||||||||||
| Basic and diluted | | $ (0.04) | | | $ (0.28) |
| |||||||||||||
| | | | | | |
| |||||||||||||
| WEIGHTED AVERAGE NUMBER OF SHARES | | | | | |
| |||||||||||||
| Basic and diluted | | 18,544,305 | | | 4,617,423 |
| |||||||||||||
| | | | | | |
| |||||||||||||
| See Notes to Unaudited Consolidated Financial Statements |
| ||||||||||||||||||
| DIGITAL BRAND MEDIA & MARKETING GROUP, INC. AND SUBSIDIARIES |
| ||||||||||||||||||
| | | | | | |||||||||||||||
| CONSOLIDATED STATEMENTS OF CASH FLOWS | |||||||||||||||||||
| (UNAUDITED) | |||||||||||||||||||
| | | | | | |||||||||||||||
| | | Year Ended August 31, | |||||||||||||||||
| | | 2013 | | 2012 | |||||||||||||||
| CASH FLOWS FROM OPERATING ACTIVITIES | | | | | |||||||||||||||
| Net loss | | $ (668,356) | | $ (1,270,433) | |||||||||||||||
| | | | | | |||||||||||||||
| Adjustments to reconcile net loss to net cash used in | | | | | |||||||||||||||
| operating activities: | | | | | |||||||||||||||
| Fair value of preferred shares issued for compensation | | - | | 219,798 | |||||||||||||||
| Fair value of shares issued for services | | - | | 58,500 | |||||||||||||||
| Fair value of preferred shares issued for bonus | | 27,600 | | 32,539 | |||||||||||||||
| Fair value of common stock issued for interest | | - | | 8,120 | |||||||||||||||
| Depreciation | | 2,983 | | 2,247 | |||||||||||||||
| Amortization of debt discount | | 247,965 | | 263,585 | |||||||||||||||
| Change in fair value of derivative liability | | (50,499) | | (51,370) | |||||||||||||||
| Additional compensation for debt restructuring | | 77,430 | | - | |||||||||||||||
| Reversal of preferred shares cancelled | | (219,798) | | - | |||||||||||||||
| Gain on settlement of debt | | (33,151) | | - | |||||||||||||||
| Bad debt expense |
| (7,207) | | (24,816) | |||||||||||||||
| Interest related to modification of conversion price of debt | | - | | 172,694 | |||||||||||||||
| Changes in operating assets and liabilities: | | | | | |||||||||||||||
| Accounts receivable | | 33,131 | | 6,692 | |||||||||||||||
| Prepaid expenses and other current assets | | (6,357) | | - | |||||||||||||||
| Accrued salaries | | 143,619 | | 92,364 | |||||||||||||||
| Accounts payable and accrued expenses | | 119,073 | | 1,266 | |||||||||||||||
| | | | | | |||||||||||||||
| NET CASH USED IN OPERATING ACTIVITIES | | (333,567) | | (488,814) | |||||||||||||||
| | | | | | |||||||||||||||
| CASH FLOWS FROM INVESTING ACTIVITIES | | | | | |||||||||||||||
| Purchase of fixed assets | | (611) | | (2,304) | |||||||||||||||
| | | | | | |||||||||||||||
| NET CASH USED IN INVESTING ACTIVITIES | | (611) | | (2,304) | |||||||||||||||
| | | | | | |||||||||||||||
| CASH FLOWS FROM FINANCING ACTIVITIES | | | | | |||||||||||||||
| Bank overdraft | | 5,135 | | - | |||||||||||||||
| Proceeds from convertible notes payable | | 157,500 | | 248,156 | |||||||||||||||
| Proceeds from loans payable | | 149,500 | | 235,500 | |||||||||||||||
| Payments made for loans payable | | (55,000) | | (10,000) | |||||||||||||||
| Payments made for convertible notes payable | | - | | (29,625) | |||||||||||||||
| Capital contribution | | - | | 64,500 | |||||||||||||||
| | | | | | |||||||||||||||
| NET CASH PROVIDED BY FINANCING ACTIVITIES | | 257,135 | | 508,531 | |||||||||||||||
| | | | | | |||||||||||||||
| NET DECREASE IN CASH | | (77,043) | | 17,413 | |||||||||||||||
| | | | | | |||||||||||||||
| EFFECT OF VARIATION OF EXCHANGE RATE OF CASH | | | | | |||||||||||||||
| HELD IN FOREIGN CURRENCY | | (1,088) | | (1,393) | |||||||||||||||
| | | | | | |||||||||||||||
| CASH - BEGINNING OF YEAR | | 78,131 | | 62,111 | |||||||||||||||
| | | | | | |||||||||||||||
| CASH - END OF YEAR | | $ - | | $ 78,131 | |||||||||||||||
| | | | | | |||||||||||||||
| Supplemental disclosures of cash flow information: | | | | | |||||||||||||||
| Cash paid for interest | | $ 5,000 | | $ (13,659) | |||||||||||||||
| Cash paid for income taxes | | $ - | | $ - | |||||||||||||||
| | | | | | |||||||||||||||
| Non-cash investing and financing activities: | | | | | |||||||||||||||
| Debt contributed to capital | | $ - | | $ 30,500 | |||||||||||||||
| Restructuring of convertible debt | | $ 110,000 | | $ - | |||||||||||||||
| Assignment of officer salary to loan holder | | $ - | | $ 150,000 | |||||||||||||||
| Assignment of loan payable to convertible loan | | $ 44,000 | | $ 100,000 | |||||||||||||||
| Conversion of convertible notes payable into common stock | | $ 67,021 | | $ 250,500 | |||||||||||||||
| Conversion of interest expense into convertible notes payable | | $ - | | $ 10,667 | |||||||||||||||
| Conversion of loans payable into common stock | | $ - | | $ 228,500 | |||||||||||||||
| Conversion of accrued salaries into preferred stock | | $ 2,673 | | $ 228,929 | |||||||||||||||
| Debt discount associated with derivative liability | | $ 89,000 | | $ 164,198 | |||||||||||||||
| Debt discount associated with convertible debt | | $ 112,500 | | $ 136,560 | |||||||||||||||
| | | | | | |||||||||||||||
| See Notes to Unaudited Consolidated Financial Statements | |||||||||||||||||||
| DIGITAL BRAND MEDIA & MARKETING GROUP, INC. AND SUBSIDIARIES |
| ||||||||||||||||||||||||||||||||||||||||||||||||||||||||||||||||||||||||||||||||||
| CONSOLIDATED STATEMENT OF STOCKHOLDERS' DEFICIT |
| ||||||||||||||||||||||||||||||||||||||||||||||||||||||||||||||||||||||||||||||||||
| (UNAUDITED) |
| ||||||||||||||||||||||||||||||||||||||||||||||||||||||||||||||||||||||||||||||||||
| | | | | | | | | | | | | | | | | | | | | ||||||||||||||||||||||||||||||||||||||||||||||||||||||||||||||||
| | Series 1 | | Series 2 | | | | | | Additional | | | | Other | | Total |
| |||||||||||||||||||||||||||||||||||||||||||||||||||||||||||||||||||
| | Preferred Stock | | Preferred Stock | | Common Stock | | Paid in | | Accumulated Deficit | | Comprehensive | | Stockholders' |
| |||||||||||||||||||||||||||||||||||||||||||||||||||||||||||||||||||||
| | Shares |
| Amount | | Shares |
| Amount | | Shares |
| Amount | | Capital | | Total | | Income(Loss) | | Deficit | ||||||||||||||||||||||||||||||||||||||||||||||||||||||||||||||||
| Balance, August 31, 2011 | 263,772 | | 264 | | - | | - | | 1,976,903 | | 1,977 | | 7,275,786 | | (8,935,014) | | (2,048) | | (1,659,035) | ||||||||||||||||||||||||||||||||||||||||||||||||||||||||||||||||
| | | | | |
| | | | | | | | | | | | | | | ||||||||||||||||||||||||||||||||||||||||||||||||||||||||||||||||
| Shares issued for services | | | | | | | | | 65,000 | | 65 | | 58,435 | | | | | | 58,500 | ||||||||||||||||||||||||||||||||||||||||||||||||||||||||||||||||
| | | | | | | | | | | | | | | | | | | | | ||||||||||||||||||||||||||||||||||||||||||||||||||||||||||||||||
| Common stock issued in connection with convertible debt | | | | | | | | | 3,797,719 | | 3,798 | | 246,701 | | | | | | 250,499 | ||||||||||||||||||||||||||||||||||||||||||||||||||||||||||||||||
| | | | | | | | | | | | | | | | | | | | | ||||||||||||||||||||||||||||||||||||||||||||||||||||||||||||||||
| Common stock issued for accrued interest | | | | | | | | | 119,234 | | 119 | | 8,001 | | | | | | 8,120 | ||||||||||||||||||||||||||||||||||||||||||||||||||||||||||||||||
| | | | | | | | | | | | | | | | | | | | | ||||||||||||||||||||||||||||||||||||||||||||||||||||||||||||||||
| Interest related to modification of conversion price of debt | | | | | | | | | | | | | 172,696 | | | | | | 172,696 | ||||||||||||||||||||||||||||||||||||||||||||||||||||||||||||||||
| | | | | | | | | | | | | | | | | | | | | ||||||||||||||||||||||||||||||||||||||||||||||||||||||||||||||||
| Common stock issued in connection with loan payable | | | | | | | | | 1,489,375 | | 1,489 | | 227,010 | | | | | | 228,499 | ||||||||||||||||||||||||||||||||||||||||||||||||||||||||||||||||
| | | | | | | | | | | | | | | | | | | | | ||||||||||||||||||||||||||||||||||||||||||||||||||||||||||||||||
| Common stock issued in connection with conversion of preferred shares | (97,596) | | (98) | | | | | | 51,769 | | 52 | | 46 | | | | | | - | ||||||||||||||||||||||||||||||||||||||||||||||||||||||||||||||||
| | | | | | | | | | | | | | | | | | | | | ||||||||||||||||||||||||||||||||||||||||||||||||||||||||||||||||
| Capital Contribution | | | | | | | | | | | | | 95,000 | | | | | | 95,000 | ||||||||||||||||||||||||||||||||||||||||||||||||||||||||||||||||
| | | | | |
| | | | | | | | | | | | | | | ||||||||||||||||||||||||||||||||||||||||||||||||||||||||||||||||
| Preferred shares issued for conversion of accrued salary | 268,367 | | 268 | | | | | | | | | | 228,661 | | | | | | 228,929 | ||||||||||||||||||||||||||||||||||||||||||||||||||||||||||||||||
| | | | | | | | | | | | | | | | | | | | | ||||||||||||||||||||||||||||||||||||||||||||||||||||||||||||||||
| Preferred shares issued to officers | 521,345 | | 521 | | | | | | | | | | 32,018 | | | | | | 32,539 | ||||||||||||||||||||||||||||||||||||||||||||||||||||||||||||||||
| | | | | | | | | | | | | | | | | | | | | ||||||||||||||||||||||||||||||||||||||||||||||||||||||||||||||||
| Beneficial conversion feature in connection with convertible debt | | | | | | | | | | | | | 136,560 | | | | | | 136,560 | ||||||||||||||||||||||||||||||||||||||||||||||||||||||||||||||||
| | | | | | | | | | | | | | | | | | | | | ||||||||||||||||||||||||||||||||||||||||||||||||||||||||||||||||
| Preferred shares issued for compensation | | | | | 2,000,000 | | 2,000 | | | | | | 217,798 | | | | | | 219,798 | ||||||||||||||||||||||||||||||||||||||||||||||||||||||||||||||||
| | | | | | | | | | | | | | | | | | | | | ||||||||||||||||||||||||||||||||||||||||||||||||||||||||||||||||
| Other Comprehensive Loss | | | | | | | | | | | | | | | | | | | | ||||||||||||||||||||||||||||||||||||||||||||||||||||||||||||||||
| | | | | | | | | | | | | | | | | | | | | ||||||||||||||||||||||||||||||||||||||||||||||||||||||||||||||||
| Net loss | | | | | | | | | | | | | - | | (1,270,433) | | | | (1,270,433) | ||||||||||||||||||||||||||||||||||||||||||||||||||||||||||||||||
| Other Comprehensive Loss | | | | | | | | | | | | | | | | | (1,393) | | (1,393) | ||||||||||||||||||||||||||||||||||||||||||||||||||||||||||||||||
| Subtotal | | | | | | | | | | | | | | | | | | | (1,271,826) | ||||||||||||||||||||||||||||||||||||||||||||||||||||||||||||||||
| | | | | | | | | | | | | | | | | | | | | ||||||||||||||||||||||||||||||||||||||||||||||||||||||||||||||||
| Balance, August 31, 2012 | 955,888 | | 955 | | 2,000,000 | | 2,000 | | 7,500,000 | | 7,500 | | 8,698,712 | | (10,205,447) | | (3,441) | | (1,499,721) | ||||||||||||||||||||||||||||||||||||||||||||||||||||||||||||||||
| | | | | | | | | | | | | | | | | | | | | ||||||||||||||||||||||||||||||||||||||||||||||||||||||||||||||||
| Common stock issued in connection with convertible debt | | | | | | | | | 2,027,975 | | 2,028 | | 64,994 | | | | | | 67,022 | ||||||||||||||||||||||||||||||||||||||||||||||||||||||||||||||||
| | | | | | | | | | | | | | | | | | | | | ||||||||||||||||||||||||||||||||||||||||||||||||||||||||||||||||
| | | | | | | | | | | | | | | | | | | | | ||||||||||||||||||||||||||||||||||||||||||||||||||||||||||||||||
| Shares issued for conversion of accounts payable | 41,995 | | 42 | | | | | | | | | | 2,631 | | | | | | 2,673 | ||||||||||||||||||||||||||||||||||||||||||||||||||||||||||||||||
| | | | | | | | | | | | | | | | | | | | | ||||||||||||||||||||||||||||||||||||||||||||||||||||||||||||||||
| Shares issued to officers as bonus | 433,637 | | 434 | | | | | | | | | | 27,166 | | | | | | 27,600 | ||||||||||||||||||||||||||||||||||||||||||||||||||||||||||||||||
| | | | | | | | | | | | | | | | | | | | | ||||||||||||||||||||||||||||||||||||||||||||||||||||||||||||||||
| Cancellation of preferred shares issued for compensation | | | | | (2,000,000) | | (2,000) | | | | | | (217,798) | | | | | | (219,798) | ||||||||||||||||||||||||||||||||||||||||||||||||||||||||||||||||
| | | | | | | | | | | | | | | | | | | | | ||||||||||||||||||||||||||||||||||||||||||||||||||||||||||||||||
| Common stock issued in connection with conversion of preferred shares | (538,113) | | (538) | | | | | | 28,541,514 | | 28,541 | | (28,003) | | | | | | - | ||||||||||||||||||||||||||||||||||||||||||||||||||||||||||||||||
| | | | | | | | | | | | | | | | | | | | | ||||||||||||||||||||||||||||||||||||||||||||||||||||||||||||||||
| Beneficial conversion feature in connection with convertible debt | | | | | | | | | | | | | 112,500 | | | | | | 112,500 | ||||||||||||||||||||||||||||||||||||||||||||||||||||||||||||||||
| | | | | | | | | | | | | | | | | | | | | ||||||||||||||||||||||||||||||||||||||||||||||||||||||||||||||||
| Net loss | | | | | | | | | | | | | - | | (668,356) | | | | (668,356) | ||||||||||||||||||||||||||||||||||||||||||||||||||||||||||||||||
| Other Comprehensive Loss | | | | | | | | | | | | | | | | | (1,011) | | (1,011) | ||||||||||||||||||||||||||||||||||||||||||||||||||||||||||||||||
| Subtotal | | | | | | | | | | | | | | | | | | | (669,367) | ||||||||||||||||||||||||||||||||||||||||||||||||||||||||||||||||
| | | | | | | | | | | | | | | | | | | | | ||||||||||||||||||||||||||||||||||||||||||||||||||||||||||||||||
| Balance, August 31, 2013 | 893,407 | | $ 893 | | - | | $ - | | 38,069,489 | | $ 38,069 | | $ 8,660,202 | | $ (10,873,803) | | $ (4,452) | | $ (2,179,091) | ||||||||||||||||||||||||||||||||||||||||||||||||||||||||||||||||
| | | | | | | | | | | | | | | | | | | | | ||||||||||||||||||||||||||||||||||||||||||||||||||||||||||||||||
| | | | | | | | | | | | | | | | | | | | | ||||||||||||||||||||||||||||||||||||||||||||||||||||||||||||||||
| See Notes to Unaudited Consolidated Financial Statements |
| ||||||||||||||||||||||||||||||||||||||||||||||||||||||||||||||||||||||||||||||||||
DIGITAL BRAND MEDIA & MARKETING GROUP, INC.
NOTES TO (UNAUDITED) CONSOLIDATED FINANCIAL STATEMENTS
NOTE 1 – ORGANIZATION, BASIS OF PRESENTATION AND GOING CONCERN
Nature of Business and History of the Company
Digital Brand Media & Marketing Group, Inc. (f/k/a RTG Ventures, Inc.) is an OTC:QB listed company. The Company was organized under the laws of the State of Florida on September 29, 1998.
On March 20, 2007, we entered into a Share Exchange Agreement (the "Agreement") with Atlantic Network Holdings Limited ("ANHL"), New Media Television (Europe) Limited ("NMTV"), and Certain Outside Stockholders to acquire all of the outstanding shares of NMTV. ANHL was a Guernsey company limited by shares and NMTV is a United Kingdom private company limited by shares. The transaction was subject to the fulfillment of certain conditions, including the satisfactory completion of the audit of ANHL/NMTV's financial statements for each of its past three fiscal years. The conditions of closing were not met by ANHL/NMTV et al and the agreement was rescinded via 8-K/A on March 30, 2010.
Digital Brand Media & Marketing Group, Inc. (f/k/a RTG Ventures, Inc.) (the “Company”) entered into a Share Exchange Agreement (the “Exchange Agreement”), on March 31, 2010, with Cloud Channel Limited which was subsequently re-named as RTG Ventures (Europe) Limited in July 2010 (“RTG Ventures (Europe)”). Pursuant to the Exchange Agreement, the Company acquired 100% of the outstanding capital stock of RTG Ventures (Europe) from its stockholders for consideration consisting of Convertible Preferred Shares of Digital Brand Media & Marketing Group, Inc. (f/k/a RTG Ventures, Inc.) according to the derivative valuation methodologies outlined in the Share Exchange Agreement of Stylar Limited, a/k/a Digital Clarity. RTG Ventures (Europe) has been valued 12 months forward “notionally” one year hence. An 8-K/A was filed in September 2010 containing audited financials of the acquisition of Stylar Limited which completed the transaction. Shareholders converted the preferred shares into common stock using the average share price of the 30 days preceding September 3, 2011 which provided a share price of $0.016083. The methodology provided for a valuation of 4X net profit. All preferred stock was held by Digital Brand Media & Marketing Group's transfer agent for the 12 month period ending September 3, 2011. All voting shares are held by management.
Subsequent to the close of the fiscal year 2011 following substantial investment, the Company conducted a structural review of its total product and services offering. The review was carried out by the Board of Directors. The result was to bring technology development being outsourced directly into the Company to steward on a daily basis and any activities which were not revenue generating in the near term were eliminated.
Certain business lines were eliminated from the Business Plan immediately. In October, 2011 the joint venture with iPayu was mutually withdrawn and in December, 2011 the acquisition of Bitemark Ltd. was rescinded. The companies reverted to the same position each held prior to the contracts. The rescission of the Bitemark Ltd. share purchase agreement was included as an exhibit to the filing for the 2011 fiscal year even though it constituted a subsequent event at the time.
As a further result of the review, the Company has also agreed to strategically focus on developing the business of its wholly owned and revenue generating online marketing services company, Digital Clarity. With deep DNA in its operating market, blending the services of an experienced professional workforce leveraging a technology offering would position the company in a strong, forward looking structure. Digital Clarity operates in the growing area of digital marketing that helps companies make the most the digital economy focusing on areas such as Search Engine Marketing (Google, Yahoo! & Bing), Social Media (Twitter, Facebook & LinkedIn) and Internet Strategy Planning including Design, Analytics and Mobile Marketing.
During the last quarter of fiscal 2012, the Company entered into an agreement with BrandEntertain. Digital Brand Media & Marketing Group, Inc. (f/k/a RTG Ventures, Inc.) and Brand Entertain have agreed to restructure their agreement retroactively to June 11, 2012. BrandEntertain is a partnership and there were certain issues with partnership financials which suggested the business combination be construed as a collaboration/cooperative
venture, rather than an acquisition. Upon analysis, one year following the initial transaction, the agreement was rescinded and no consideration was received by BrandEntertain.
On March 5, 2013, Digital Brand Media & Marketing Group, Inc. filed a Certificate of Amendment to its Articles of Incorporation to change its name from “RTG Ventures, Inc.” to “Digital Brand Media & Marketing Group, Inc.” In connection with the name change, the Company’s trading symbol changed from “RTGV” to “DBMM” (the “Symbol Change”). The Amendment was effective as of March 20, 2013. The Name Change and Symbol Change have been reflected in the Company’s ticker symbol as of April 8, 2013.
Also on March 5, 2013, Digital Brand Media & Marketing Group, Inc. received approval from the Financial Industry Regulatory Authority (FINRA) for its 100 to 1 reverse stock split.
Going Concern
The accompanying unaudited consolidated financial statements have been prepared on a going concern basis. The Company has an accumulated deficit of approximately $10,874,000 and a negative working capital at August 31, 2013 of approximately $2,181,000. The Company has incurred a net loss of approximately $662,000 for the year ended August 31, 2013. The Company's ability to continue as a going concern is dependent upon its ability to obtain the necessary financing to meet its obligations and repay its liabilities arising from normal business operations when they come due, and to generate profitable operations in the future. Management plans to continue to provide for its capital requirements by seeking long term financing which may be in the form of additional equity securities and debt. The outcome of these matters cannot be predicted at this time and there are no assurances that if achieved, the Company will have sufficient funds to execute its business plan or generate positive operating results.
These matters, among others, raise substantial doubt about the ability of the Company to continue as a going concern. These consolidated financial statements do not include any adjustments to the amounts and classification of assets and liabilities that may be necessary should the Company be unable to continue as a going concern.
Basis of Presentation
The accompanying consolidated financial statements have been prepared, in accordance with accounting principles generally accepted in the United States (“U.S. GAAP”) and pursuant to the rules and regulations of the Securities and Exchange Commission (the “SEC”). The accompanying consolidated financial statements include the accounts of the Company and its wholly owned subsidiaries. All intercompany transactions have been eliminated in consolidation.
NOTE 2 - SIGNIFICANT ACCOUNTING POLICIES
Basis of Consolidation
The consolidated financial statements include the accounts of the Company and its wholly owned subsidiary RTG Ventures (Europe), Ltd. All significant inter-company transactions are eliminated.
Cash and Cash Equivalents
Cash and cash equivalents consist primarily of cash in banks. The Company considers cash equivalents to include all highly liquid investments with original maturities of three months or less to be cash equivalents.
Accounts Receivable and Allowance for Doubtful Accounts
Accounts receivable are recorded at the invoiced amount and do not bear interest. Accounts receivable are presented net of allowance for doubtful accounts.
The Company has a policy of reserving for uncollectible accounts based on its best estimate of the amount of probable credit losses in its existing accounts receivable. The Company periodically reviews its accounts receivable
to determine whether an allowance is necessary based on an analysis of past due accounts and other factors that may indicate that the realization of an account may be in doubt. Account balances deemed to be uncollectible are charged to the bad debt expense after all means of collection have been exhausted and the potential for recovery is considered remote. At August 31, 2013 and August 31, 2012, the Company recognized $7,207 and $0 as allowance for doubtful accounts, respectively.
Property and Equipment
Property and equipment is stated at cost, less accumulated depreciation. Depreciation is provided using the straight-line method over the estimated useful lives of the related assets (primarily three to five years).
Revenue Recognition
The Company follows the guidance of ASC Topic 605, formerly, SAB 104 for revenue recognition. In general, the Company records revenue when persuasive evidence of an arrangement exists, services have been rendered, the sales price to the customer is fixed or determinable, and collectability is reasonably assured.
Revenues from services are recognized when the services are performed, evidence of an arrangement exists, the fee is fixed and determinable and collectability is probable.
Use of Estimates
The preparation of financial statements in conformity with accounting principles generally accepted in the United States of America requires management to make estimates and assumptions that affect the reported amounts of assets and liabilities, and disclosure of contingent assets and liabilities, at the date of the financial statements and the reported amounts of revenues and expenses during the reporting period. Actual results could differ from those estimates.
Reclassifications
Certain amounts in the prior period financial statements have been reclassified to conform with the current period presentation.
Income Taxes
The Company accounts for income taxes utilizing the liability method of accounting. Under the liability method, deferred taxes are determined based on differences between financial statement and tax bases of assets and liabilities at enacted tax rates in effect in years in which differences are expected to reverse. Valuation allowances are established, when necessary, to reduce deferred tax assets to amounts that are expected to be realized.
Earnings (loss) per common share
The Company utilizes the guidance per FASB Codification “ASC 260 "Earnings Per Share". Basic earnings per share is calculated on the weighted effect of all common shares issued and outstanding, and is calculated by dividing net income available to common stockholders by the weighted average shares outstanding during the period. Diluted earnings per share, which is calculated by dividing net income available to common stockholders by the weighted average number of common shares used in the basic earnings per share calculation, plus the number of common shares that would be issued assuming conversion of all potentially dilutive securities outstanding, is not presented separately as it is anti-dilutive. Such securities have been excluded from the per share computations as of August 31, 2013 and 2012.
Derivative Liabilities
The Company assessed the classification of its derivative financial instruments as of August 31, 2013, which consist of convertible instruments and rights to shares of the Company’s common stock, and determined that such derivatives meet the criteria for liability classification under ASC 815.
ASC 815 generally provides three criteria that, if met, require companies to bifurcate conversion options from their host instruments and account for them as free standing derivative financial instruments. These three criteria include circumstances in which (a) the economic characteristics and risks of the embedded derivative instrument are not clearly and closely related to the economic characteristics and risks of the host contract, (b) the hybrid instrument that embodies both the embedded derivative instrument and the host contract is not re-measured at fair value under otherwise applicable generally accepted accounting principles with changes in fair value reported in earnings as they occur and (c) a separate instrument with the same terms as the embedded derivative instrument would be considered a derivative instrument subject to the requirements of ASC 815. ASC 815 also provides an exception to this rule when the host instrument is deemed to be conventional, as described.
During the year ended August 31, 2013, the Company had notes payable outstanding in which the conversion rate was variable and undeterminable. Accordingly, the Company has recognized a derivative liability in connection with such instruments. The Company uses judgment in determining the fair value of derivative liabilities at the date of issuance at every balance sheet thereafter and in determining which valuation is most appropriate for the instrument (e.g., Black Scholes), the expected volatility, the implied risk free interest rate, as well as the expected dividend rate.
Fair Value of Financial Instruments
Effective January 1, 2008, the Company adopted FASB ASC 820-Fair Value Measurements and Disclosures, or ASC 820, for assets and liabilities measured at fair value on a recurring basis. ASC 820 establishes a common definition for fair value to be applied to existing generally accepted accounting principles that require the use of fair value measurements establishes a framework for measuring fair value and expands disclosure about such fair value measurements. The adoption of ASC 820 did not have an impact on the Company’s financial position or operating results, but did expand certain disclosures.
ASC 820 defines fair value as the price that would be received to sell an asset or paid to transfer a liability in an orderly transaction between market participants at the measurement date. Additionally, ASC 820 requires the use of valuation techniques that maximize the use of observable inputs and minimize the use of unobservable inputs. These inputs are prioritized below:
| | |
|
|
|
| Level 1: | Observable inputs such as quoted market prices in active markets for identical assets or liabilities |
| | |
|
|
|
| Level 2: | Observable market-based inputs or unobservable inputs that are corroborated by market data |
| | |
|
|
|
| Level 3: | Unobservable inputs for which there is little or no market data, which require the use of the reporting entity’s own assumptions. |
The Company did not have any Level 2 or Level 3 assets or liabilities as of August 31, 2013, with the exception of its convertible notes payable and derivative liability. The carrying amounts of these liabilities at August 31, 2013 approximate their respective fair value based on the Company’s incremental borrowing rate.
Cash is considered to be highly liquid and easily tradable as of May 31, 2013 and therefore classified as Level 1 within our fair value hierarchy.
In addition, FASB ASC 825-10-25 Fair Value Option, or ASC 825-10-25, was effective for January 1, 2008. ASC 825-10-25 expands opportunities to use fair value measurements in financial reporting and permits entities to choose to measure many financial instruments and certain other items at fair value. The Company did not elect the fair value options for any of its qualifying financial instruments.
Convertible Instruments
The Company evaluates and accounts for conversion options embedded in its convertible instruments in accordance with professional standards for “Accounting for Derivative Instruments and Hedging Activities”.
Professional standards generally provides three criteria that, if met, require companies to bifurcate conversion options from their host instruments and account for them as free standing derivative financial instruments. These three criteria include circumstances in which (a) the economic characteristics and risks of the embedded derivative instrument are not clearly and closely related to the economic characteristics and risks of the host contract, (b) the hybrid instrument that embodies both the embedded derivative instrument and the host contract is not re-measured at fair value under otherwise applicable generally accepted accounting principles with changes in fair value reported in earnings as they occur and (c) a separate instrument with the same terms as the embedded derivative instrument would be considered a derivative instrument. Professional standards also provide an exception to this rule when the host instrument is deemed to be conventional as defined under professional standards as “The Meaning of “Conventional Convertible Debt Instrument”.
The Company accounts for convertible instruments (when it has determined that the embedded conversion options should not be bifurcated from their host instruments) in accordance with professional standards when “Accounting for Convertible Securities with Beneficial Conversion Features,” as those professional standards pertain to “Certain Convertible Instruments.” Accordingly, the Company records, when necessary, discounts to convertible notes for the intrinsic value of conversion options embedded in debt instruments based upon the differences between the fair value of the underlying common stock at the commitment date of the note transaction and the effective conversion price embedded in the note. Debt discounts under these arrangements are amortized over the term of the related debt to their earliest date of redemption. The Company also records when necessary deemed dividends for the intrinsic value of conversion options embedded in preferred shares based upon the differences between the fair value of the underlying common stock at the commitment date of the note transaction and the effective conversion price embedded in the note.
ASC 815-40 provides that, among other things, generally, if an event is not within the entity’s control could or require net cash settlement, then the contract shall be classified as an asset or a liability.
Stock Based Compensation
We account for the grant of stock options and restricted stock awards in accordance with ASC 718, “Compensation-Stock Compensation.” ASC 718 requires companies to recognize in the statement of operations the grant-date fair value of stock options and other equity based compensation.
Foreign Currency Translation
Assets and liabilities of subsidiaries operating in foreign countries are translated into U.S. dollars using both the exchange rate in effect at the balance sheet date or historical rate, as applicable. Results of operations are translated using the average exchange rates prevailing throughout the year. The effects of exchange rate fluctuations on translating foreign currency assets and liabilities into U.S. dollars are included in a separate component of stockholders’ equity (accumulated other comprehensive loss), while gains and losses resulting from foreign currency transactions are included in operations.
Customer Concentration
Three of the Company's customers accounted for approximately 17%, 14% and 12% respectively of its revenues during the year ending August 31, 2013 and three of the Company's customers accounted for approximately 18%, 17% and 12% respectively of its revenues during the year ending August 31, 2012.
Business Combinations
In accordance with Accounting Standards Codification 805, "Business Combinations" ("ASC 805") the Company records acquisitions under the purchase method of accounting, under which the acquisition purchase price is allocated to the assets acquired and liabilities assumed based upon their respective fair values. The Company utilizes management estimates and, in some instances, may require an independent third-party valuation firm to assist in
determining the fair values of assets acquired, liabilities assumed and contingent consideration granted. Such estimates and valuations require us to make significant assumptions, including projections of future events and operating performance.
Recently Issued Accounting Pronouncements
A variety of accounting standards have been issued or proposed by FASB that do not require adoption until a future date. We regularly review all new pronouncements that have been issued since the filing of our Form 10-K for the year ended August 31, 2013 to determine their impact, if any, on our financial statements. The Company does not expect the adoption of any of these standards to have a material impact once adopted.
NOTE 3 - PROPERTY AND EQUIPMENT
Property and equipment consisted of the following:
|
|
|
| August 31, | | August 31, | |
|
| Estimated life |
| 2013 | | 2012 | |
| (Unaudited) | (Unaudited) | |||||
| Computer and office equipment | 3 to 5 years |
| $ | 8,990 | | $ 8,379 |
| Less: Accumulated depreciation |
|
| | (7,074 | ) | (4,092) |
|
|
|
| $ | 1,915 | | $ 4,287 |
Depreciation expense amounted to $3,022 and $1,496 for the quarters ended August 31, 2013 and 2012 respectively.
NOTE 4 - LOANS PAYABLE
|
| | August 31, | | August 31, | ||
|
|
| 2013 | | 2012 | ||
| (Unaudited) | (Unaudited) | |||||
| Loans payable |
| $ | 512,000 | | $ | 269,500 |
During the year ended August 31, 2011 a shareholder loaned the Company $30,500. The debt is due on demand and bears no interest. The loan was assumed by an officer of the Company and simultaneously contributed to capital.
During the year ended August 31, 2012, $30,500 of the loan payable was assumed by an officer and $100,000 was assigned to a nonaffiliated third party. In addition this shareholder purchased $150,000 of debt that was owed to an officer of the Company and funded the Company $225,500. As of August 31, 2012, the Company has issued 1,489,375 common shares as a partial repayment of the debt amounting to $228,500 and made cash payments of $10,000. The balance remaining amounted to $269,500 which is due on demand and bears no interest.
On August 8, 2013 a shareholder loaned the Company $15,000. The debt is due on demand and bears interest totaling $5,000.
During the year ended August 31, 2013 a shareholder loaned the Company $134,500. The debt is due on demand and bears no interest. On January 8, 2013, the shareholder assigned $44,000 of debt to a third party and the debt was restructured to a convertible note. On April 30, 2013, the Company repaid $10,000 of principal and $2,000 of interest relating to the outstanding loans and on August 30, 2013, the Company repaid $20,000 of principal and $3,000 of interest relating to the outstanding loans.
During the year ended August 31, 2013, the Company and an issuer of two convertible debentures totaling $110,000 and accrued interest of $4,570 restructured the convertible notes to a non-convertible loan totaling $185,000. The Company recorded the additional $70,430 as interest expense. As of August 31, 2013, the Company repaid $25,000 relating to this loan.
NOTE 5 – CONVERTIBLE NOTES PAYABLE
At August 31, 2013 and August 31, 2012 convertible debentures consisted of the following:
|
|
|
August 31, | ||||
|
|
| 2013 |
| 2012 | ||
| (Unaudited) | (Unaudited) | |||||
| Convertible notes payable |
| $ | 412,831 |
| $ | 388,351 |
| Unamortized debt discount |
|
| (91,243) |
|
| (137,709) |
| Total |
| $ | 321,588 |
| $ | 250,642 |
In March, 2010, the Company issued a convertible debenture in the amount of $25,000 at 0% interest. The note matured in September 2010 and was convertible into shares of the Company’s common stock at $.01 per share.
In March 2011, the Company received $81,653 from a non-affiliated third party in the form of a convertible debenture at 0% interest and is due on demand. This note is convertible into approximately 80,000 shares of common stock.
Effective September 1, 2010 the Company adopted (FASB ASC 815-40-15-5) ("ASC 815") "Determining Whether an Instrument (or Embedded Feature) Is Indexed to an Entity's Own Stock" which outlines new guidance for being indexed to an entity's own stock and the resulting liability or equity classification based on that conclusion. The adoption of ASC 815 affects the accounting for convertible instruments with provisions that protect holders from declines in the stock price ("down - round" provisions).
In March, April, May and July 2011, the Company entered into agreements with a third party non-affiliate to four 8% interest bearing convertible debentures for $203,000 due in nine months (“The 8% Convertible Notes”), with the conversion features commencing 6 months after the loan issuance date. The loans are convertible at an average share price computed on the 30 days prior to conversion. In connection with these debentures, the Company recorded a $207,705 discount on debt, related to the beneficial conversion feature of the note to be amortized over the life of the note or until the note was converted or repaid. As of August 31, 2012 these notes have been converted into 2,663,719 shares of common stock which were sold into the public market under Rule 144 completed April 2012. The Company has recorded amortization expense amounting to $100,533 for the year ended August 31, 2012.
During the year ended August 31, 2012, the Company entered into convertible loans with third party non-affiliates in which $100,000 of debt was assigned from a shareholder and $248,156 was received in cash. These loans bear interest ranging from 0% - 15% and mature in one year or less. They are convertible in six months or less at a discount based on average share prices ranging between 10 and 30 days. As a result the Company recorded $300,758 in debt discount related to the beneficial conversion feature. In connection with these debentures, the Company has recorded amortization expense amounting to $263,585 for the years ended August 31, 2012 with $137,709 net discount balance remaining. As of August 31, 2012, $250,500 of debt was converted into 3,797,719 shares of common stock and $29,625 has been paid in cash. As of August 31, 2012, the balance of the Company’s convertible debt amounts to $250,642, net of discount.
During the year ended August 31, 2013, the Company and an issuer of two convertible debentures totaling $110,000 and accrued interest of $4,570 restructured the convertible notes to a non-convertible loan totaling $185,000.
During the year ended August 31, 2013, the Company entered into convertible loans with third party non-affiliates in which $157,500 was received in cash. In addition, on January 8, 2013, a $44,000 loan payable was assigned to a third party and the debt was restructured as a convertible debt. These loans bear interest ranging from 5% - 12% and mature in one year or less. They are convertible in one year or less at a discount based on average share prices ranging between 10 and 30 days. As a result, the Company recorded $201,500 in debt discount related to the
beneficial conversion feature in connection with these debentures, $89,000 of which was initially recorded as a derivative liability due to the variable convertible terms and $157,500 was recorded in additional paid in capital. During the year ended August 31, 2013, the Company has recorded amortization expense amounting to $247,965 with $91,241 net discount balance remaining. As of August 31, 2013, the balance of the Company’s convertible debt amounts to $321,588, net of discount.
NOTE 6 - DERIVATIVE LIABILITIES
The Company accounts for the embedded conversion features included in its convertible instruments. The aggregate fair value of derivative liabilities at August 31, 2013 and August 31, 2012 amounted to $151,329 and $112,828, respectively. In addition, for the years ended August 31, 2013 and 2012, the Company has recorded a gain (loss) related to the change in fair value of the derivative liability amounting to $50,499 and $(213,323), respectively. At each measurement date, the fair value of the embedded conversion features was based on the binomial and the Black Scholes method, respectively.
NOTE 7 – ACCRUED PAYROLL
As of August 31, 2013 and August 31, 2012 the Company owes $860,094 and $716,475 respectively, in accrued salary to its employees. The amounts are non-interest bearing.
NOTE 8 - COMMON STOCK AND PREFERRED STOCK
In September, 2011, 65,000 shares of common stock were valued at $58,500 to consultants under the terms of the agreements for services.
In January 2012, 268,367 shares of Preferred Stock-Series 1 Designation were issued to satisfy $228,929 in accrued salary due to an officer of the Company.
In January 2012, 471,345 shares of Preferred Stock-Series 1 Designation were issued to three officers of the Company.
In March 2012, 97,596 shares of Preferred Stock-Series 1 Designation were converted into 51,769 shares of common stock for the minority shareholders pursuant to the share exchange agreement with Stylar Limited a/k/a Digital Clarity.
In May 2012, the Company announced the appointment of an executive officer as Head, US Operations and issued him 50,000 shares of Preferred Stock-Series 1 Designation as a sign on bonus.
During the year ended August 31, 2012, 3,797,719 shares of common stock were issued to satisfy approximately $250,499 of convertible notes payable and 119,215 shares of common stock were issued to satisfy $8,120 in accrued interest.
During the year ended August 31, 2012, 1,489,375 shares of common stock were issued to satisfy $228,499 of loans payable. These conversions resulted in a modification expense of $172,694.
In November 2012, 41,995 shares of Preferred Stock-Series 1 Designation were issued for an accrual to satisfy a debt of $35,824.
In November 2012, 433,637 shares of Preferred Stock-Series 1 Designation were issued to four officers of the Company.
On March 5, 2013, Digital Brand Media & Marketing Group, Inc. received approval from the Financial Industry Regulatory Authority (FINRA) for its 100 to 1 reverse stock split. All shares have been retroactively adjusted to reflect the 100 to 1 reverse stock split.
In April 2013, 496,118 shares of Preferred Stock-Series 1 Designation were converted into 26,314,099 shares of restricted common stock by an officer of the Company.
In August 2013, 41,995 shares of Preferred Stock-Series 1 Designation were converted into 2,227,415 shares of restricted common stock by a consultant.
During the year ended August 31, 2013, 2,027,995 shares of restricted common stock were issued to satisfy $67,022 of convertible debt.
During the year ended August 31, 2013, 2,000,000 Preferred Shares-Series 2 were cancelled as a result of the termination of the arrangement with BrandEntertain. As a result the consideration associated with the transaction totaling $219,797 was reversed and reflected in the statement of operations as a reduction to expense.
As of August 31, 2013 there are 2,000,000 shares authorized of $.001 par value Preferred Stock-Series 1 Designation, of which 893,407 were outstanding.
As of August 31, 2013 there are 2,000,000 shares authorized of $.001 par value Preferred Stock-Series 2, of which 0 were outstanding.
As of August 31, 2013 there are 1,000,000,000 shares authorized of $.001 par value common stock, of which 38,069,488 were issued and outstanding.
NOTE 9 – CAPITAL CONTRIBUTION
During the year ended August, 2011 an officer of the Company made contributions of $190,000 to assist with Company accounts payable and various professional fees. These contributed funds are considered paid in capital.
During the year ended August, 2012 an officer of the Company made contributions of $95,000 to assist with Company accounts payable and various professional fees. These contributed funds are considered paid in capital.
NOTE 10 - EMPLOYMENT AND CONSULTING AGREEMENTS
In April, 2010 a term sheet was agreed with Neil Gray as Chairman and Executive Director of the Company. The term was an initial three years, renewable annually beginning on September 1st, the beginning of the fiscal year.
In September 2010 a term sheet was agreed with a company officer, Linda Perry, for annual remuneration of $150,000 for her role as a consultant and as Executive Director for US interface to provide oversight external regulatory reporting requirements. In addition, Ms. Perry is lead executive for capital funding requirements and business development.
In April, 2011 a term sheet was agreed with a Company Officer, Reggie James, where remuneration was split between his duties as Senior Vice President and Executive Director of DBMM and Digital Clarity. Mr. James was appointed Co-Chief Operating Officer during fiscal year 2013.
In June, 2012 a term sheet was agreed with a Company Officer, Steve Baughman, as Head, US Operations with a sign on bonus of 50,000 preferred shares, compensation is performance-based, reflecting multiple projects and business development activities. Mr. Baughman was appointed Co-Chief Operating Officer during fiscal year 2013.
NOTE 11 - INCOME TAXES
For the years ended August 31, 2013 and 2012, the benefit for income taxes differed from the amounts computed by applying the statutory federal income tax rate of 34 percent to loss before provision for income taxes. The reconciliation is as follows:
| | | | | | | | | |
|
|
| Year Ended August 31, |
| |||||
|
|
| 2013 |
|
| 2012 |
| ||
| (Unaudited) | (Unaudited) | |||||||
| Benefit computed at statutory rate |
| $ | (432,000) |
|
| $ | (432,000 | ) |
| State tax (benefit), net of federal affect |
|
| (51,000) |
|
|
| (51,000 | ) |
| Permanent differences (primarily non deductible compensation) |
|
| 451,000 |
|
|
| 451,000 |
|
| Increase in valuation allowance |
|
| 32,000 |
|
|
| 32,000 |
|
|
|
|
|
|
|
|
|
|
|
| Net income tax benefit |
| $ | - |
|
| $ | - |
|
The Company has net operating loss carry-forwards for income tax totaling purposes approximately $3,189,000 at August 31, 2013 which expire at various times through 2033. A significant portion of these carry-forwards is subject to annual limitations due to "equity structure shifts" or "owner shifts" involving "five percent shareholders" (as defined in the Internal Revenue Code) which results in a more than fifty percent change in ownership.
The net deferral asset is as follows:
| | | |
| |
| Tax benefit of net operating loss carry-forward |
| $ | 1,212,000 |
|
| Accrued officer compensation |
|
| 366,000 |
|
| Compensation paid with options |
|
| 67,000 |
|
| Other |
|
| 55,000 |
|
| Valuation allowance |
|
| (1,700,000 | ) |
|
|
|
|
|
|
| Net deferred tax asset |
| $ | - |
|
NOTE 14 - FOREIGN OPERATIONS
As of August 31, 2013, all of our revenues and a majority of our assets are associated with subsidiaries located in the United Kingdom. Assets at August 31, 2013 and revenues for fiscal 2013 were as follows:
| | | | | | | | | | | | | | | |
|
|
| United States |
|
| Great Britain |
|
|
|
| Total |
| |||
| (Unaudited) | (Unaudited) | (Unaudited) | ||||||||||||
| Revenues |
| $ | - |
|
| $ | 408,505 |
|
|
|
| $ | 408,505 |
|
| Total revenues |
| $ | - |
|
| $ | 408,505 |
|
|
|
| $ | 408,505 |
|
| Identifiable assets at August 31, 2013 |
| $ | - |
|
| $ | 43,792 |
|
|
|
| $ | 43,792 |
|
ITEM 9. CHANGES IN AND DISAGREEMENTS WITH ACCOUNTANTS ON ACCOUNTING AND FINANCIAL DISCLOSURE.
There are not currently and have not been any disagreements between us and our accountants on any matter of accounting principles, practices or financial statement disclosure.
ITEM 9A(T). CONTROLS AND PROCEDURES.
Evaluation of Disclosure Controls and Procedures
As of August 31, 2013, our management evaluated the effectiveness of our disclosure controls and procedures pursuant to Rule 13a-15(b) promulgated under the Exchange Act. Based upon that evaluation, our management concluded that, as of August 31, 2013, our disclosure controls and procedures were effective in ensuring that material information required to be disclosed in the reports that we file or submit under the Exchange Act is recorded, processed, summarized and reported within the time periods specified in the Securities and Exchange Commission’s rules and forms, including ensuring that such material information is accumulated and communicated to our management, as appropriate to allow timely decisions regarding required disclosure.
Changes in Internal Control Over Financial Reporting
Our management has determined that no change in our internal control over financial reporting occurred during or subsequent to the year ended August 31, 2013 that has materially affected, or is (as that term is defined in Rules 13(a)-15(f) and 15(d)-15(f) of the Securities Exchange Act of 1934) reasonably likely to materially affect, our internal control over financial reporting.
Management’s Annual Report on Internal Control Over Financial Reporting
Our management is responsible for establishing and maintaining adequate internal control over financial reporting as such term is defined in Exchange Act Rule 13a-15(f). Our internal control system was designed to provide reasonable assurance to our management and the Board of Directors regarding the preparation and fair presentation of published financial statements. All internal control systems, no matter how well designed have inherent limitations. Therefore, even those systems determined to be effective can provide only reasonable assurance with respect to financial statement preparation and presentation. Our management assessed the effectiveness of our internal control over financial reporting as of August 31, 2013. In making this assessment, our management used the criteria set forth by the Committee of Sponsoring Organizations of the Treadway Commission (“COSO”) in Internal Control – Integrated Framework - Guidance for Smaller Public Companies (the COSO criteria). Centralized US operations and reporting provides further assurance that the internal controls regarding financial systems are in a state of continuous improvement.
This annual report does not include an attestation report of our registered public accounting firm regarding internal control over financial reporting. Our management's report was not subject to attestation by our registered public accounting firm pursuant to temporary rules of the Securities and Exchange Commission that permit us to provide only management's report in this annual report.
ITEM 9B. OTHER INFORMATION.
There are no items requiring disclosure hereunder.
PART III MANAGEMENT
Item 10. Directors, Executive Officers and Corporate Governance
Executive Officers and Directors
The following table sets forth certain information, as of August 31, 2013, with respect to our directors and executive officers.
Directors serve until the next annual meeting of the stockholders; until their successors are elected or appointed and qualified, or until their prior resignation or removal. Officers serve for such terms as determined by our board of directors. Each officer holds office until such officer’s successor is elected or appointed and qualified or until such officer's earlier resignation or removal. No family relationships exist between any of our present directors and officers.
| | | |
| Name |
| Position |
Neil Gray |
| Chairman and Executive Director |
|
|
|
Reggie James |
| Co-Chief Operating Officer, Senior Vice President and Executive Director |
|
|
|
Linda Perry |
| Executive Director, Chair Nomination/Compensation and Audit Committees |
|
|
|
The following is a brief account of the business experience of each of our Directors and Executive Officers:
Neil Gray. Mr. Gray has served as Chairman and Executive Director of DBMM since April 1, 2010. Between 1999 and 2007, Gray was involved as an officer and equity participant of a privately held UK based Healthcare Group. Prior to leaving the group, a stable, conservative growth model was created to establish growth organically and by acquisition through operational knowledge and accurate prediction of cash flow/interest rates within the group’s debt/equity structure. The group’s interests were not restricted to the UK with alliances and interests developed into the European Union. From 1994 to 1999, a “Hands On” approach to operational involvement and investment with personal financial incentives was garnered whist working in different cultural and geographical locations. These locations were Africa (South-West and West), South America (Equatorial), Spain (Mainland and The Canary Islands) and the Black Sea. The projects developed and entered into were engineering, textiles and import/export with the UK and EU. The initial development of Gray’s understanding of business strategy was as part of a “think tank” team of individuals in a UK based insurance company between 1989 and 1994. The team’s role was to understand, develop and test their ideas against actuarial professionals. Gray sought out risk management knowledge and understanding of the global business of his employer during this time. Gray’s formative years were spent as an employee of a UK based electrical engineering firm based in Northern England from 1985 to 1989 and in the engineering department of a British Coal deep mine colliery between 1979 and 1985.
Linda Perry. As of April 1, 2010 Ms. Perry serves as Executive Director and Chair Nomination/Compensation and Audit Committees. She had served as our President, Chief Executive Officer and a Director until March 31, 2010 (excepting the period from April 19, 2005 to April 24, 2006). She has had an extensive career in global and entrepreneurial businesses. Ms. Perry consults to several companies globally and is industry agnostic. While living in Europe, she was the senior advisor to the Board of Directors of The Balli Group, where her role was to integrate the acquisition of Klockner & Co. The acquisition resulted in the creation of the world's largest steel, multi-metal, distribution and trading company. Prior to that, she was appointed a director and a member of the Executive Committee of Churchill Insurance Group, Plc., a division of the Credit Suisse Group. Ms. Perry was President of GWR Enterprises, Inc., from 1997-1999, focused on new business opportunities through private equity and special situation investments. She was a senior executive at ExxonMobil Corporation from 1983-1996, holding general management positions with global responsibility in finance, marketing and organization (described as corporate governance, management succession and executive compensation.) The latter role was under the aegis of the Board of Directors, entitled Compensation, Organization and Executive Development Committee/COED, of which she was a member. Ms. Perry holds an MBA from Harvard University. She has been a
visiting lecturer/professor at IMD, Lausanne, Switzerland, INSEAD, Fontainebleau, France and the Stern School of Business at New York University throughout her career.
Reggie James. As of April 1, 2011, Mr. Reggie James has served as Senior Vice President of Marketing and Communications and Executive Director. Mr. James also is the Managing Director of Digital Clarity. In 2013, he was appointed Co-Chief Operating Officer with Steve Baughman. Mr. James has been involved in the commercial element of the internet since its inception and has been instrumental in driving forward business models that are common place today. Mr. James is founder of Digital Clarity, a leading Digital Advertising Agency and a wholly owned business of DBMM. The company helps major brands and medium sized companies take advantage of the digital economy focusing on areas such as Search Engine Marketing (Google, Yahoo! & Bing), Social Media (Twitter, Facebook & LinkedIn) and Internet Strategy Planning including Design, Analytics and Mobile Marketing. Mr. James launched the European division of a VoIP technology company that became the first dot com to list of the Singapore Stock Exchange that was acquired by Spice Communications. In turn, Spice has been acquired by Idea Cellular, the 3rd largest mobile services operator in India. Mr. James is also the co-founder of an internet analytics technology software house as well as shareholder in an AIM listed marketing services company. AIM is the London Stock Exchange’s international market for smaller growing companies. Previously, Mr. James was involved with publishing groups VNU & Ziff-Davis where he launched titles such as Management Consultancy and IT Week. Prior to launching Digital Clarity, Mr. James was part of the global sales team at leading search company AltaVista where he managed global brands such as Compaq and Hewlett Packard (HP). AltaVista is now part of Yahoo! Inc.
Board Committees
We currently have standing committees on our Board of Directors. The audit committee and nomination/compensation committee are listed below.
Audit Committee
We have established an Audit Committee of the Board of Directors. The Audit Committee duties include a recommendation to our Board of Directors the engagement of independent auditors to audit our financial statements and to review our accounting and auditing principles. The audit committee will review the scope, timing and fees for the annual audit and the results of audit examinations performed by the internal auditors and independent public accountants, including their recommendations to improve the system of accounting and internal controls.
Nomination/Compensation Committee
We have established a Nomination/Compensation Committee of the Board of Directors. The Nomination/Compensation Committee reviews and approves our total remuneration, including compensation of executive officers. The Nomination/Compensation Committee will also administer our stock option plans and recommend and approve grants of stock options under such plans.
Compensation of Directors
All directors are officers and their compensation is included on the summary compensation table (Item 11).
Compliance with Section 16(A) of the Exchange Act
Our common stock was not registered pursuant to Section 12 of the Exchange Act during the fiscal year ended August 31, 2013. Accordingly, our officers, directors and principal shareholders were not subject to the beneficial ownership reporting requirements of Section 16(a) of the Exchange Act during such year.
Code of Ethics
In December 1, 2004 we adopted a Code of Ethics that applies to our Principal Executive Officer, Principal Financial Officer, Principal Accounting Officer and Controller and to persons performing similar functions. A copy of our Code of Ethics was previously filed as an Exhibit to our annual report on Form 10-KSB for the year ended
August 31, 2004. A copy of our Code of Ethics will be provided to any person requesting same without charge. To request a copy of our Code of Ethics please make written request to DBMM.
Item 11. Executive Compensation
SUMMARY COMPENSATION TABLE
None of our executive officers or employees received compensation in excess of $100,000 during the year ended August 31, 2013, or 2012, except as follows:
| | | | | | | | | |
| Name and | Fiscal year |
|
|
|
|
|
| All |
| principal | Ended |
|
| Other | Options/ | Restricted | LTIP | other |
| position | August 31, | Salary | Bonus | Compensation | SARs | stock awards | Payouts | Compensation |
|
|
|
|
|
|
|
|
|
|
| Neil Gray | 2013 (1) | 0 | 0 | (6) | 0 | 0 | 0 | 0 |
| Chairman/Executive Director | 2012 (1) | 0 | 0 | (5) | 0 | 0 | 0 | 0 |
|
|
|
|
|
|
|
|
|
|
| Fitch Montague McLennan Limited/ | 2013 | (3) | 0 | (6) | 0 | 0 | 0 | 0 |
| Reggie James | 2012 (2) | 164,509 (2) | 0 | (5) | 0 | 0 | 0 | 0 |
| Executive Director/Senior Vice President |
|
|
|
|
|
|
|
|
|
|
|
|
|
|
|
|
|
|
| Linda Perry | 2013 | 150,000 (4) | 0 | (6) | 0 | 0 | 0 | 0 |
| Executive Director | 2012 | 150,000 (4) | 0 | (5) | 0 | 0 | 0 | 0 |
| | |
| (1) | For the fiscal years ended August 31, 2013 and 2012, Mr. Gray earned $0 each year. |
|
|
|
| (2) | For the fiscal year ending August 31, 2012, Mr. James earned $164,509 of which $110,509 has been paid to Reggie James/Fitch Montague McLennan Limited. Mr. James is the sole shareholder, officer and director of Fitch Montague McLennan Limited. $54,000 has not been paid. |
|
|
|
| (3) | For the fiscal year ending August 31, 2013, Mr. James earned $175,930 of which 121,930 has been paid to Reggie James/Fitch Montague McLennan Limited. Mr. James is the sole shareholder, officer and director of Fitch Montague McLennan Limited. $54,000 has not been paid. |
|
|
|
| (4) | For the fiscal years ended August 31, 2013 and 2012, Ms. Perry earned $150,000 each year of which $0 has been paid. |
|
|
|
| (5) | Preferred Shares Series 1 were designated in fiscal year 2012 by Corporate Resolution, as follows: Value Per Preferred Share: $0.016083 Conversion Ratio – Preferred Shares to Common Shares: 1:53.04 739,712 Restricted Preferred Shares have been allocated to the above officers |
|
|
|
| (6) | Preferred Shares Series 1 were designated in fiscal year 2013 by Corporate Resolution, as follows: Value Per Preferred Share: $0.016083 Conversion Ratio – Preferred Shares to Common Shares: 1:53.04 386,502 Restricted Preferred Shares have been allocated to the above officers |
|
|
|
OPTION/SAR GRANTS IN LAST FISCAL YEAR
No stock appreciation rights were granted to the named executives during the fiscal years ended August 31, 2013 and 2012.
Long Term Incentive Plan Awards
No long-term incentive plan awards to the named executive officers during the fiscal year ended August 31, 2013 and 2012.
Employment Contracts, Termination of Employment, and Change-in-Control Arrangements
In April, 2010 a term sheet was agreed with Neil Gray as Chairman and Executive Director of the Company. The term was an initial three years, renewable annually beginning on September 1st, the beginning of the fiscal year.
In September 2010 a term sheet was agreed with a company officer, Linda Perry, for annual remuneration of $150,000 for her role as a consultant and as Executive Director for US interface to provide oversight external regulatory reporting requirements. In addition, Ms. Perry is lead executive for capital funding requirements and business development.
In April, 2011 a term sheet was agreed with a Company Officer, Reggie James, where remuneration was split between his duties as Senior Vice President and Executive Director of DBMM and Digital Clarity. Mr. James was appointed Co-Chief Operating Officer during fiscal year 2013.
In June, 2012 a term sheet was agreed with a Company Officer, Steve Baughman, as Head, US Operations with a sign on bonus of 50,000 preferred shares, compensation is performance-based, reflecting multiple projects and business development activities. Mr. Baughman was appointed Co-Chief Operating Officer during fiscal year 2013.
Report on Repricing of Options/Sars
During the fiscal year ended August 31, 2013 we did not adjust or amend the exercise price of any stock options or SARs.
Item 12. Security Ownership of Certain Beneficial Owners and Management and Related Stockholder Matters.
The following table sets forth information with respect to the beneficial ownership of our common stock known by us as of August 31, 2013 by, (i) each of our directors, (ii) each of our executive officers, and (iii) all of our directors and executive officers as a group. The percentages in the table have been calculated on the basis of treating as outstanding for a particular person, all shares of our common stock outstanding on such date and all shares of our common stock issuable to such holder in the event of exercise of outstanding options, warrants, rights or conversion privileges owned by such person at said date which are exercisable within 60 days of such date. Except as otherwise indicated, the persons listed below have sole voting and investment power with respect to all shares of our common stock owned by them, except to the extent such power may be shared with a spouse.
Name of Beneficial Owner and/or Beneficially Own Shares of Restricted Common Stock percentage owned:
| | | | | | | | | |
| (1) Neil Gray* |
|
| 60,000 |
|
|
| 0.03 | % |
| (2) Reggie James* |
|
| 26,326,599 |
|
|
| 13.18 | % |
| (3) Steve Baughman* |
|
| 10,467,040 |
|
|
| 5.24 | % |
| (4) Linda Perry* |
|
| 16,588,933 |
|
|
| 8.30 | % |
| All Directors and Executive Officers as a Group (4 persons) |
|
| 79,176,794 |
|
|
| 26.75 | % |
· * The officers as a group hold 893,407 Restricted Preferred Shares, under the designation terms of Preferred Stock-Series 1.
Item 13. Certain Relationships and Related Transactions
None.
Item 14. Principal Accountant Fees and Services.
Audit Fees
The aggregate fees billed to us by our principal accountants for services rendered during the fiscal years ended August 31, 2013 and 2012 are set forth in the table below:
| | | | | | | | | |
|
|
| August 31, 2013 |
|
| August 31, 2012 |
| ||
| Audit Fees(1) |
| $ | 45,000 |
|
| $ | 43,000 |
|
(1) Audit fees represent fees for professional services provided in connection with the audit of our annual financial statements and review of our quarterly financial statements and audit services provided in connection with other statutory or regulatory filings.
Audit Committee's Pre-Approval Practice.
During fiscal year ended August 31, 2013, the Audit Committee pre-approved all audit and permissible non-audit services provided by our independent auditors
PART IV
Item 15. Exhibits
The following Exhibits are being filed with this Annual Report on Form 10-K:
| | |
| Exhibit Number | Description |
3.1(1) | Articles of Incorporation of the Registrant, as amended. |
3.2(8) | By-laws of the Registrant, as amended. |
10.3(4) | Share Exchange Agreement, dated March 20, 2007, by and among the Company, Atlantic Network Holdings Limited, New Media Television (Europe) Limited and the Outside Stockholders Listed on Exhibit A Thereto. |
10.1(5) | Share Exchange Agreement, dated March 30, 2010, between Digital Brand Media & Marketing Group, Inc., and Cloud Channel Limited. |
10.2(5) | Recession Resolution of Share Exchange Agreement, dated March 20, 2007, by and among Digital Brand Media & Marketing Group, Inc., Atlantic Network Holdings Limited, the Outside Stockholders Listed on Exhibit A thereto and New Media Television (Europe) Limited. |
10.3(5) | Share purchase Agreement between Cloud Channel Limited and Bitemark MC Limited. |
10.4(5) | Share purchase Agreement between Cloud Channel Limited and Stylar Limited. |
10.4(6) | Amendment to Share Exchange Agreement, dated March 31, 2010, between Digital Brand Media & Marketing Group, Inc., and Cloud Channel Limited. |
10.5(6) | Amendment to Share Purchase Agreement between Cloud Channel Limited and Bitemark MC Limited. |
10.6(6) | Amendment to Share Purchase Agreement between Cloud Channel Limited and Stylar Limited. |
10.7(8) | Rescission Resolution of Share Exchange Agreement, dated March 31, 2010, between Digital Brand Media & Marketing Group, Inc. and Bitemark MC Limited |
10.8(9) | Agreement to purchase LLC interests |
10.9(10) | Amendment to agreement to purchase LLC interests |
10.10(11) | Mutual Rescission and Release |
14.1(3) | Code of Ethics |
31.1* | Section 302 Certification of Executive Director |
32.1* | Section 906 Certification of Executive Director |
101.INS** | XBRL Instance Document |
101.SCH** | XBRL Taxonomy Extension Schema Document |
101.CAL** | XBRL Taxonomy Extension Calculation Linkbase Document |
101.DEF** | XBRL Taxonomy Extension Definition Linkbase Document |
101.LAB** | XBRL Taxonomy Extension Label Linkbase Document |
101.PRE** | XBRL Taxonomy Extension Presentation Linkbase Document |
(1) Previously filed as an exhibit to the Company's Quarterly Report on Form 10-QSB for the quarter ended May 31, 2005.
(2) Previously filed as an exhibit to the Company's Current Report on Form 8-K Filed with the Commission on October 6, 2004.
(3) Previously filed as an exhibit to the Company's Annual Report on Form 10-KSB for the year ended August 31, 2004.
(4) Previously filed as an exhibit to the Company's Current Report on Form 8-K filed with the Commission on March 21, 2007.
(5) Previously filed as an exhibit to the Company's Current Report on Form 8-KA filed with the Commission on April 9, 2010.
(6) Previously filed as an exhibit to the Company's Current Report on Form 8-KA filed with the Commission on July 15,, 2010.
(7) Previously filed as an exhibit to the Company's Current Report on Form 8-KA filed with the Commission on September 8, 2010.
(8) Previously filed as an exhibit to the Company's Annual Report on Form 10-K for the year ended August 31, 2011.
(9) Previously filed as an exhibit to the Company's Current Report on Form 8-K Filed with the Commission on June 12, 2012.
(10) Previously filed as an exhibit to the Company's Annual Report on Form 10-K for the year ended August 31, 2012.
(11) Previously filed as an exhibit to the Company's Quarterly Report on Form 10-Q for the quarter ended May 31, 2013.
* Filed herewith
** Furnished herewith. XBRL (Extensible Business Reporting Language) information is furnished and not filed or a part of a registration statement or prospectus for purposes of Sections 11 or 12 of the Securities Act of 1933, as amended, is deemed not filed for purposes of Section 18 of the Securities Exchange Act of 1934, as amended, and otherwise is not subject to liability under these sections.
Signatures
Pursuant to the requirements of Section 13 or 15(d) of the Securities Exchange Act of 1934, as amended, the registrant has duly caused this report to be signed on its behalf by the undersigned, thereunto duly authorized.
| | | | |
|
| DIGITAL BRAND MEDIA & MARKETING GROUP, INC. | ||
|
|
|
|
|
| Date: December 16, 2013 | By: | /s/ Linda Perry |
|
|
|
| Executive Director |
|
In accordance with the Exchange Act, this report has been signed below by the following persons on behalf of the registrant and in the capacities and on the dates indicated.
| | | | |
| Date: December 16, 2013 |
| /s/ Linda Perry |
|
|
|
| Executive Director (Executive Director) |
|