Attached files
| file | filename |
|---|---|
| 8-K - CHINA FUND INC | fp0008945_8k.htm |
|
Nov 30, 2013
|
Monthly Insight
The China Fund, Inc. (CHN)
|
|
Investment Objective
|
The investment objective of the Fund is to achieve long term capital appreciation. The Fund seeks to achieve its objective through investment in the equity securities of companies and other entities with significant assets, investments, production activities, trading or other business interests in China or which derive a significant part of their revenue from China.
The Fund has an operating policy that the Fund will invest at least 80% of its assets in China companies. For this purpose, ‘China companies’ are (i) companies for which the principal securities trading market is in China; (ii) companies for which the principal securities trading market is outside of China or in companies organized outside of China, that in both cases derive at least 50% of their revenues from goods or services sold or produced, or have a least 50% of their assets in China; or (iii) companies organized in China. Under the policy, China means the People’s Republic of China, including Hong Kong, and Taiwan. The Fund will provide its stockholders with at least 60 days’ prior notice of any change to this policy.
|
Performance Overview
|
|
Performance History
|
1 month
|
3 months
|
YTD
|
1 Year
|
3 Years
|
5 Years
|
10 Years
|
Since
|
|
(p.a.)
|
(p.a.)
|
(p.a.)
|
Inception
|
|
NAV (%)
|
2.83
|
10.83
|
17.36
|
22.47
|
2.16
|
19.09
|
14.24
|
11.10
|
|
Market price (%)
|
3.62
|
12.83
|
9.67
|
20.00
|
0.47
|
19.20
|
10.74
|
10.05
|
|
Benchmark (%)
|
2.13
|
10.12
|
8.61
|
11.60
|
3.98
|
17.24
|
10.28
|
N/A
|
|
Performance History
|
2012
|
2011
|
2010
|
2009
|
2008
|
2007
|
2006
|
2005
|
|
NAV (%)
|
12.07
|
-24.37
|
27.25
|
72.82
|
-46.95
|
86.20
|
57.10
|
6.09
|
|
Market price (%)
|
20.46
|
-27.51
|
23.60
|
72.19
|
-40.65
|
50.24
|
65.67
|
-21.51
|
|
Benchmark (%)
|
22.65
|
-18.36
|
13.60
|
67.12
|
-49.37
|
37.97
|
39.50
|
10.27
|
Source: State Street Bank and Trust Company. Source for index data: MSCI as at Nov 30, 2013.
|
Portfolio Analysis
|
|
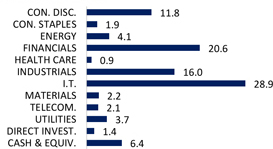
Sector allocation (%)
|
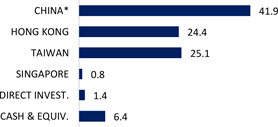
Country allocation (%)
|
 |
 |
|
Source: State Street Bank and Trust Company as at Nov 30, 2013.
|
* China includes A-shares (5.3%), A-share equity linked securities (7.3%), B-shares (0.0%), H-shares (13.1%) and Red-chips (16.2%).
|

The China Fund, Inc. (CHN)
|
Portfolio Analysis (continued)
|
|
Top 10 Holdings
|
Sector
|
%
|
|
CHINA EVERBRIGHT INTERNATIONAL, LTD.
|
INDUSTRIALS
|
6.4
|
|
TAIWAN SEMICONDUCTOR MANUFACTURING CO., LTD.
|
I.T.
|
5.4
|
|
HAND ENTERPRISE SOLUTIONS CO., LTD.
|
I.T.
|
5.3
|
|
INDUSTRIAL & COMMERCIAL BANK OF CHINA
|
FINANCIALS
|
4.2
|
|
ENN ENERGY HOLDINGS, LTD.
|
UTILITIES
|
3.7
|
|
CNOOC, LTD.
|
ENERGY
|
3.5
|
|
TENCENT HOLDINGS, LTD.
|
I.T.
|
3.4
|
|
SUN HUNG KAI PROPERTIES, LTD.
|
FINANCIALS
|
3.2 |
|
CHINA MINSHENG BANKING CORP., LTD.
|
FINANCIALS
|
3.0
|
|
BEIJING ENTERPRISES HOLDINGS, LTD.
|
INDUSTRIALS
|
2.5
|
|
Total
|
40.6
|
|
|
Direct Investments
|
Sector
|
%
|
|
GOLDEN MEDITECH HOLDINGS, LTD. 15.0%, 11/16/13
|
OTHERS
|
1.4
|
|
Total
|
1.4
|
Source: State Street Bank and Trust Company as at Nov 30, 2013.
|
Fund Details
|
|
NAV
|
$26.50
|
|
Market price
|
$23.48
|
|
Premium/Discount
|
-11.40%
|
|
Market cap
|
US$368.21m
|
|
Shares outstanding
|
15,682,029
|
|
Exchange listed
|
NYSE
|
|
Listing date
|
July 10, 1992
|
|
Benchmark
|
MSCI Golden Dragon Index (Total Return)
|
|
Fund Manager
|
Christina Chung
|
|
Listed and direct investment manager
|
RCM Asia Pacific Limited
|
Source: State Street Bank and Trust Company as at Nov 30, 2013.
|
Distribution History (10 years)
|
|
Declaration
date |
Ex-dividend
date
|
Record
date |
Payable
date |
Dividend/
Share |
Income
|
Long-term Capital
|
Short-term Capital
|
|
10 Dec 2012
|
20 Dec 2012
|
24 Dec 2012
|
28 Dec 2012
|
3.2517
|
0.3473
|
2.9044
|
0.0000
|
|
8 Dec 2011
|
21 Dec 2011
|
23 Dec 2011
|
29 Dec 2011
|
2.9964
|
0.1742
|
2.8222
|
0.0000
|
|
8 Dec 2010
|
21 Dec 2010
|
24 Dec 2010
|
29 Dec 2010
|
2.2742
|
0.3746
|
1.8996
|
0.0000
|
|
9 Dec 2009
|
22 Dec 2009
|
24 Dec 2009
|
29 Dec 2009
|
0.2557
|
0.2557
|
0.0000
|
0.0000
|
|
8 Dec 2008
|
22 Dec 2008
|
24 Dec 2008
|
23 Jan 2009
|
5.8174
|
0.4813
|
5.3361
|
0.0000
|
|
7 Dec 2007
|
19 Dec 2007
|
21 Dec 2007
|
25 Jan 2008
|
12.1200
|
0.2800
|
9.0000
|
2.8400
|
|
8 Dec 2006
|
19 Dec 2006
|
21 Dec 2006
|
29 Dec 2006
|
4.0117
|
0.2996
|
2.7309
|
0.9812
|
|
9 Dec 2005
|
19 Dec 2005
|
21 Dec 2005
|
29 Dec 2005
|
2.5119
|
0.2172
|
2.2947
|
0.0000
|
|
13 Dec 2004
|
20 Dec 2004
|
22 Dec 2004
|
7 Jan 2005
|
3.5701
|
0.1963
|
3.2664
|
0.1074
|
|
19 Dec 2003
|
29 Dec 2003
|
31 Dec 2003
|
15 Jan 2004
|
1.7800
|
0.0700
|
0.6700
|
1.0400
|
Source : State Street Bank and Trust Company as at December 31, 2012. Dividend/Share includes Income, Long-term Capital gains and Short-term Capital gains.
2
The China Fund, Inc. (CHN)
The China Fund Inc. NAV Performance of USD $10,000 since inception (with dividends reinvested at NAV price)
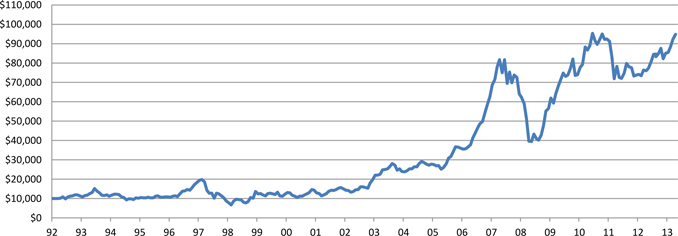
Past performance is not a guide to future returns.
Source: State Street Bank and Trust Company as at Nov 30, 2013.
The China Fund Inc. Premium / Discount
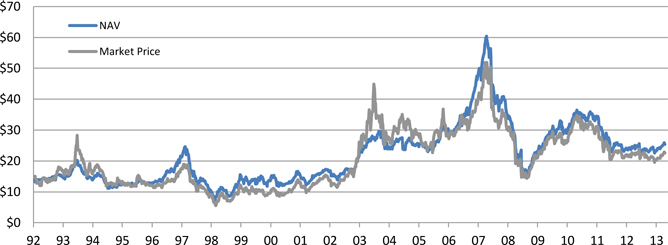
Past performance is not a guide to future returns.
Source: State Street Bank and Trust Company as at Nov 30, 2013.
3
The China Fund, Inc. (CHN)
Manager’s Commentary
Market Review
In November the Chinese government released a communique following the third Party Plenum session. The lack of any positive surprises or details on the reform plans initially disappointed equity market participants, which prompted the unveiling of the more comprehensive blueprint on economic and social reforms. On the economic front the blueprint pledged a more ‘decisive’ role for market forces in driving economic activity. More emphasis was placed on the quality and sustainability of growth instead of the pace of growth as it tried to address the structural problems in the Chinese economy. It also dealt with initiatives for improving social equality and gave details of Xi Jinping’s plans for the centralization of power to implement these reforms. This detailed release drew a positive response from investors and the Hang Seng Index edged up towards the 24,000 level.
China’s economy continued to grow at a steady rate through the month while inflation remained benign. Against this backdrop we expect monetary policy to remain relatively neutral and fiscal policy to be moderately expansionary.
In Hong Kong, the property market remained in consolidation mode. Activity picked up in the primary market as developers accelerated property launches through favorable pricing. At the sector level, insurance and brokerage stocks performed well, benefitting from sector rotation given that their share prices had lagged the market.
In Taiwan, the macroeconomic numbers were worse than expected in November. Export orders were hurt by domestic cooking oil safety and contaminated food concerns. While the food sector was the worst underperformer, selective cyclical sectors, such as cement and rubber outperformed on strong demand from China during the fourth quarter peak season.
Fund Review
The Fund outperformed the benchmark in November, which was attributable to stock selection. Stock picking in the industrials and utilities sectors contributed most to the Fund’s relative performance. Conversely, stock selection in healthcare and consumer discretionary sectors hurt the most.
The top two contributors for the month were China Everbright International and ENN Energy. The environmental and clean energy sectors remain strong themes as they are direct beneficiaries of the Chinese government’s policy initiatives. Among the detractors, the share price of Digital China was undermined by its disappointing second quarter earnings result.
Outlook
In the short term, news flow on specific reform areas will continue to support the market. However, for equity markets to sustain upward momentum, investors need to have better visibility on the reform time table as well as on its implementation. In this regard, we would expect more information to be released over the next six months that will help to improve investors' confidence on the progress of reforms. This will support the recovery of China equities to normalized valuations with further re-rating potential driven by any positive surprise from reform progress.
The Taiwan economy remains weak with the rising expectation over interest rate hikes. However, there will be potential positives from cross straits deregulation. For tech companies, we are positive on LED components, industrial computers and upstream semiconductor names.
Source : RCM Asia Pacific Limited as at November 30, 2013.
4
The China Fund, Inc. (CHN)
Portfolio Holdings
|
CUSIP
|
Security Description
|
Cost Base
|
Base MV
|
Shares
|
Percentage of Net Assets
|
|
663094902
|
China Everbright International, Ltd.
|
10,746,421
|
26,507,297
|
23,730,000
|
6.4
|
|
688910900
|
Taiwan Semiconductor Manufacturing Co., Ltd.
|
17,081,578
|
22,572,481
|
6,362,000
|
5.4
|
|
B3VN92906
|
HAND Enterprise Solutions Co., Ltd.
|
1,481,143
|
22,066,462
|
7,890,573
|
5.3
|
|
B1G1QD902
|
Industrial & Commercial Bank of China
|
16,829,555
|
17,523,337
|
24,390,000
|
4.2
|
|
633393905
|
Enn Energy Holdings, Ltd.
|
606,420
|
15,564,871
|
2,204,000
|
3.7
|
|
B00G0S903
|
CNOOC, Ltd.
|
14,516,684
|
14,454,825
|
7,048,000
|
3.5
|
|
B01CT3905
|
Tencent Holdings, Ltd.
|
6,794,264
|
14,060,488
|
243,100
|
3.4
|
|
685992000
|
Sun Hung Kai Properties, Ltd.
|
13,850,327
|
13,270,688
|
1,034,000
|
3.2
|
|
B57JY2909
|
China Minsheng Banking Corp., Ltd.
|
11,551,016
|
12,440,295
|
10,315,000
|
3.0
|
|
608169900
|
Beijing Enterprises Holdings, Ltd.
|
8,539,048
|
10,528,652
|
1,177,000
|
2.5
|
|
674842901
|
Ruentex Development Co., Ltd.
|
4,180,803
|
10,136,560
|
4,933,904
|
2.4
|
|
644806002
|
Hutchison Whampoa, Ltd.
|
8,096,189
|
9,846,149
|
773,000
|
2.4
|
|
913BMZ902
|
Ping An Insurance (Group) Company of China, Ltd.
Access Product (expiration 06/30/15)
|
9,494,980
|
9,610,104
|
1,418,047
|
2.3
|
|
17313A533
|
Gree Electric Appliances, Inc. Access Product
(expiration 01/17/14)
|
6,453,442
|
9,354,522
|
1,838,546
|
2.3
|
|
B2R2ZC908
|
CSR Corp., Ltd.
|
7,466,210
|
9,247,754
|
9,930,000
|
2.2
|
|
671815900
|
Qingling Motors Co., Ltd.
|
8,718,221
|
8,853,128
|
28,960,000
|
2.1
|
|
607355906
|
China Mobile, Ltd.
|
8,371,940
|
8,788,737
|
816,000
|
2.1
|
|
626073902
|
Delta Electronics, Inc.
|
4,550,608
|
8,622,356
|
1,615,000
|
2.1
|
|
635186901
|
Digital China Holdings, Ltd.
|
13,205,899
|
8,470,239
|
7,256,000
|
2.0
|
|
B3WH02907
|
Hermes Microvision, Inc.
|
7,867,215
|
8,371,596
|
269,000
|
2.0
|
|
658444906
|
Merida Industry Co., Ltd.
|
6,624,016
|
8,370,616
|
1,126,000
|
2.0
|
|
637248907
|
MediaTek, Inc.
|
6,194,126
|
8,235,588
|
559,000
|
2.0
|
|
620267906
|
Advantech Co., Ltd.
|
4,104,778
|
7,939,853
|
1,284,000
|
1.9
|
|
644094906
|
Taiwan FamilyMart Co., Ltd.
|
817,531
|
7,284,332
|
1,128,652
|
1.8
|
|
619376908
|
China Resources Land, Ltd.
|
5,128,719
|
7,049,925
|
2,554,000
|
1.7
|
|
B58J1S907
|
Chailease Holding Co., Ltd.
|
6,043,939
|
6,589,802
|
2,478,000
|
1.6
|
|
B1L8PB906
|
Tong Hsing Electronic Industries, Ltd.
|
5,127,409
|
6,402,395
|
1,203,000
|
1.5
|
|
923HKD007
|
Golden Meditech Holdings, Ltd. (acquired 11/16/12) 1.0%, 12/20/13
|
7,509,916
|
6,008,010
|
58,222,500
|
1.4
|
|
628625907
|
Li & Fung, Ltd.
|
5,939,877
|
5,489,323
|
4,030,000
|
1.3
|
|
626735906
|
Hong Kong Exchanges and Clearing, Ltd.
|
4,947,274
|
5,384,649
|
306,500
|
1.3
|
|
B236JB905
|
Tiangong International Co., Ltd.
|
5,449,044
|
4,791,239
|
18,480,000
|
1.2
|
|
613623909
|
Hengan International Group Co., Ltd.
|
3,889,897
|
4,732,105
|
375,500
|
1.1
|
|
645166901
|
Largan Precision Co., Ltd.
|
3,937,557
|
4,206,596
|
118,000
|
1.0
|
|
B0Y91C906
|
China National Building Material Co., Ltd.
|
4,158,278
|
4,193,727
|
3,750,000
|
1.0
|
|
B633D9904
|
Zhongsheng Group Holdings, Ltd.
|
3,919,603
|
4,058,386
|
2,996,500
|
1.0
|
|
643280902
|
Chipbond Technology Corp.
|
3,949,251
|
4,007,583
|
1,916,000
|
1.0
|
|
17313X574
|
China State Construction Engineering Corp., Ltd. (expiration 01/17/14)
|
4,674,320
|
3,946,038
|
7,375,772
|
0.9
|
|
665157905
|
Comba Telecom Systems Holdings, Ltd.
|
7,565,579
|
3,774,090
|
10,958,500
|
0.9
|
|
643055908
|
Golden Meditech Holdings, Ltd.
|
4,555,715
|
3,751,388
|
35,040,000
|
0.9
|
|
B16NHT900
|
Shui On Land, Ltd.
|
4,155,622
|
3,593,592
|
11,055,500
|
0.9
|
|
B6VG8G904
|
Asian Pay Television Trust
|
4,074,574
|
3,232,130
|
5,200,000
|
0.8
|
|
993HWH901
|
Daqin Railway Co., Ltd. Access Product (expiration 11/02/16)
|
2,786,924
|
3,159,969
|
2,449,968
|
0.8
|
|
651795908
|
Natural Beauty Bio-Technology, Ltd.
|
4,906,910
|
3,015,472
|
47,710,000
|
0.7
|
|
ACI009HH0
|
China Suntien Green Energy Corp., Ltd.
|
2,153,804
|
2,471,345
|
6,451,000
|
0.6
|
|
972ZGS900
|
Gree Electric Appliances, Inc. Access Product (expiration 06/30/15)
|
1,898,593
|
2,189,107
|
430,249
|
0.5
|
|
42751U205
|
Hermes Microvision, Inc.
|
1,368,073
|
1,459,293
|
46,900
|
0.4
|
|
B1B25Q909
|
Daqin Railway Co., Ltd. Access Product (expiration 01/20/15)
|
1,246,037
|
1,380,665
|
1,070,283
|
0.3
|
|
BD04NT905
|
Integrated Waste Solutions Group Holdings, Ltd.
|
7,974,083
|
1,119,966
|
25,314,000
|
0.3
|
|
972ZHB906
|
China State Construction Engineering Corp., Ltd. (expiration 07/28/14)
|
886,370
|
832,221
|
1,555,844
|
0.2
|
|
ACI0090H8
|
Zong Su Foods (acquired 09/21/10)
|
15,000,034
|
0
|
2,677
|
0.0
|
Source: State Street Bank and Trust Company as at Nov 30, 2013.
5
The China Fund, Inc. (CHN)
The information contained herein has been obtained from sources believed to be reliable but RCM (an Allianz Global Investors company) and its affiliates do not warrant the information to be accurate, complete or reliable. The opinions expressed herein are subject to change at any time and without notice. Past performance is not indicative of future results. This material is not intended as an offer or solicitation for the purchase or sale of any financial instrument. Investors should consider the investment objectives, risks, charges and expenses of any mutual fund carefully before investing. This and other information is contained in the fund’s annual and semiannual reports, proxy statement and other fund information, which may be obtained by contacting your financial advisor or visiting the fund’s website at www.chinafundinc.com. This information is unaudited and is intended for informational purposes only. It is presented only to provide information on investment strategies and opportunities. The Fund seeks to achieve its objective through investment in the equity securities of companies and other entities with significant assets, investments, production activities, trading or other business interests in China or which derive a significant part of their revenue from China. Investing in non-U.S. securities entails additional risks, including political and economic risk and the risk of currency fluctuations, as well as lower liquidity. These risks, which can result in greater price volatility, will generally be enhanced in less diversified funds that concentrate investments in a particular geographic region. The Fund is a closed-end exchange traded management investment company. This material is presented only to provide information and is not intended for trading purposes. Closed-end funds, unlike open-end funds, are not continuously offered. After the initial public offering, shares are sold on the open market through a stock exchange, where shares may trade at a premium or a discount. Holdings are subject to change daily.