Attached files
| file | filename |
|---|---|
| 8-K - CHIMERA INVESTMENT CORPORATION 8-K - CHIMERA INVESTMENT CORP | a50768121.htm |
| EX-99.1 - EXHIBIT 99.1 - CHIMERA INVESTMENT CORP | a50768121-ex991.htm |
Exhibit 99.2
WWW.CHIMERAREIT.COM Financial Update December 2013
Disclaimer This material is not intended to be exhaustive, is preliminary in nature and may be subject to change. In addition, much of the information contained herein is based on various assumptions (some of which are beyond the control of Chimera Investment Corporation, the “Company”) and may be identified by reference to a future period or periods or by the use of forward-looking terminology, such as “believe,” “expect,” “anticipate,” “estimate,” “plan,” “continue,” “intend,” “should,” “may,” “would,” “projected,” “will” or similar expressions, or variations on those terms or the negative of those terms. The Company’s forward-looking statements are subject to numerous risks, uncertainties and other factors, including the impact of the transition to a new independent registered public accounting firm and the Company’s ability to timely complete the process necessary to file its quarterly and annual reports for the quarters and year subsequent to September 30, 2012. Furthermore, none of the financial information contained in this material has been audited or approved by the Company’s independent registered public accounting firm.
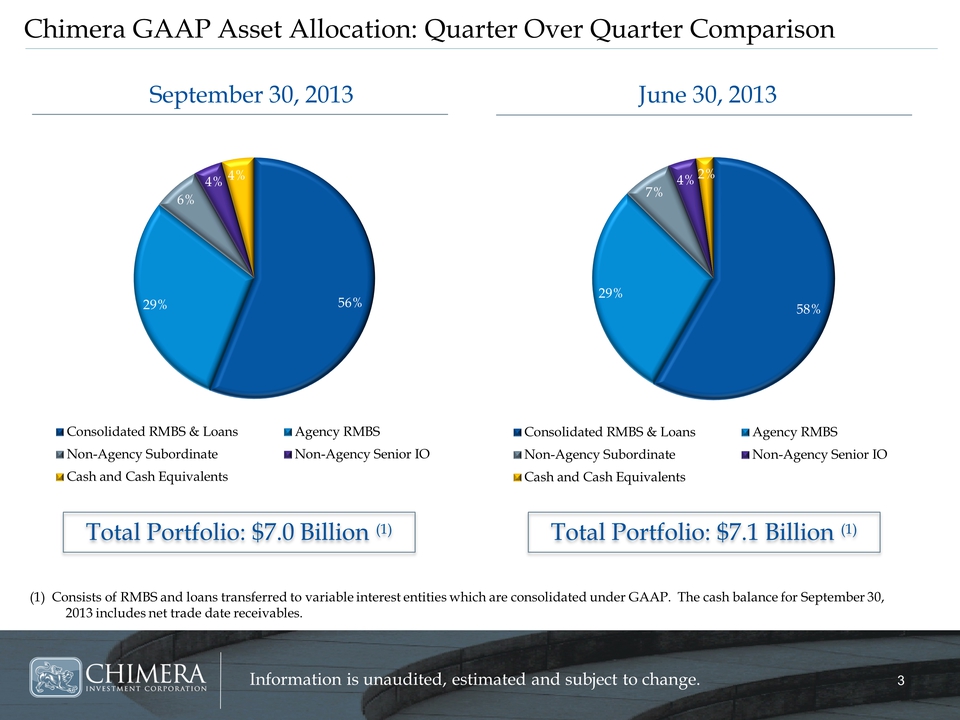
3 Information is unaudited, estimated and subject to change. 56% 29% 6% 4% 4% Consolidated RMBS & Loans Agency RMBS Non-Agency Subordinate Non-Agency Senior IO Cash and Cash Equivalent 58% 29% 7% 4% 2% Consolidated RMBS & Loans Agency RMBS Non-Agency Subordinate Non-Agency Senior IO Cash and Cash Equivalents Chimera GAAP Asset Allocation: Quarter Over Quarter Comparison (1) Consists of RMBS and loans transferred to variable interest entities which are consolidated under GAAP. The cash balance for September 30, 2013 includes net trade date receivables. September 30, 2013 June 30, 2013 Total Portfolio: $7.0 Billion (1) Total Portfolio: $7.1 Billion (1)
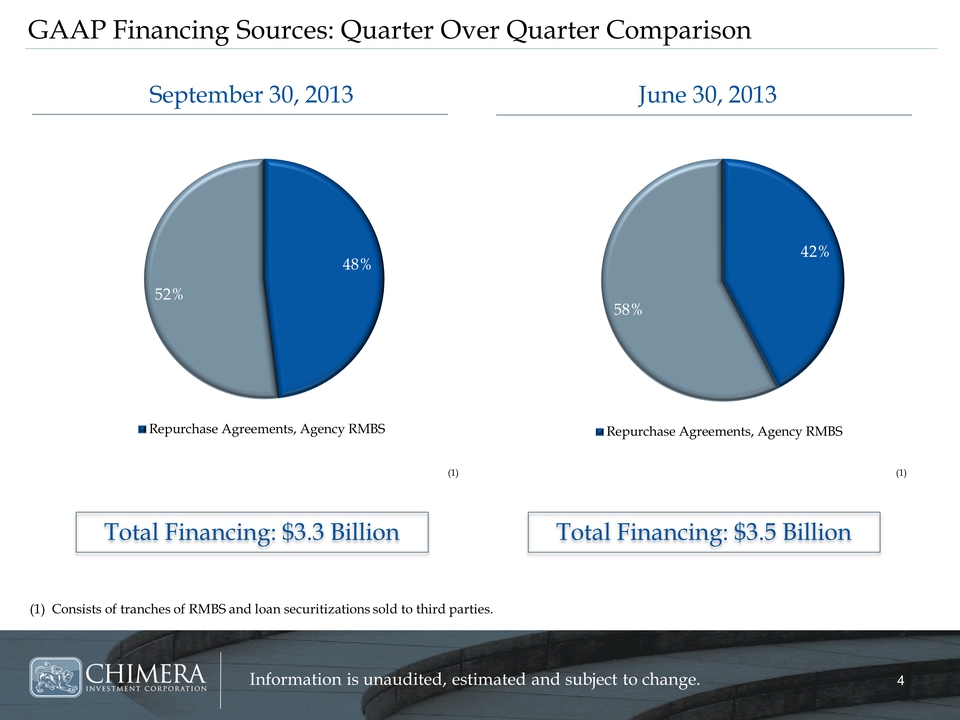
4 4 Information is unaudited, estimated and subject to change. 48% 52% Repurchase Agreements, Agency RMBS 42% 58% Repurchase Agreements, Agency RMBS GAAP Financing Sources: Quarter Over Quarter Comparison (1) Consists of tranches of RMBS and loan securitizations sold to third parties. September 30, 2013 June 30, 2013 Total Financing: $3.3 Billion Total Financing: $3.5 Billion (1) (1)
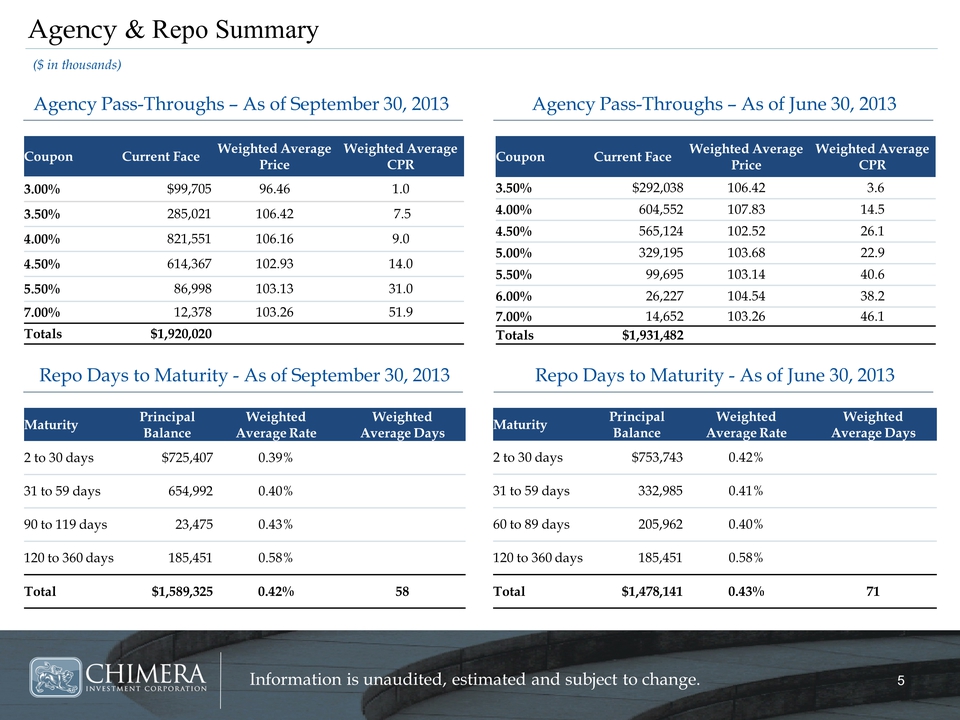
5 5 Information is unaudited, estimated and subject to change. Maturity Principal Balance Weighted Average Rate Weighted Average Days 2 to 30 days $753,743 0.42% 31 to 59 days 332,985 0.41% 60 to 89 days 205,962 0.40% 120 to 360 days 185,451 0.58% Total $1,478,141 0.43% 71 Coupon Current Face Weighted Average Price Weighted Average CPR 3.50% $292,038 106.42 3.6 4.00% 604,552 107.83 14.5 4.50% 565,124 102.52 26.1 5.00% 329,195 103.68 22.9 5.50% 99,695 103.14 40.6 6.00% 26,227 104.54 38.2 7.00% 14,652 103.26 46.1 Totals $1,931,482 Agency & Repo Summary Agency Pass-Throughs – As of September 30, 2013 Repo Days to Maturity - As of September 30, 2013 Agency Pass-Throughs – As of June 30, 2013 Repo Days to Maturity - As of June 30, 2013 Maturity Principal Balance Weighted Average Rate Weighted Average Days 2 to 30 days $725,407 0.39% 31 to 59 days 654,992 0.40% 90 to 119 days 23,475 0.43% 120 to 360 days 185,451 0.58% Total $1,589,325 0.42% 58 ($ in thousands) Coupon Current Face Weighted Average Price Weighted Average CPR 3.00% $99,705 96.46 1.0 3.50% 285,021106.42 7.5 4.00% 821,551 106.16 9.0 4.50% 614,367 102.93 14.0 5.50% 86,998 103.13 31.0 7.00% 12,378 103.26 51.9 Totals $1,920,020
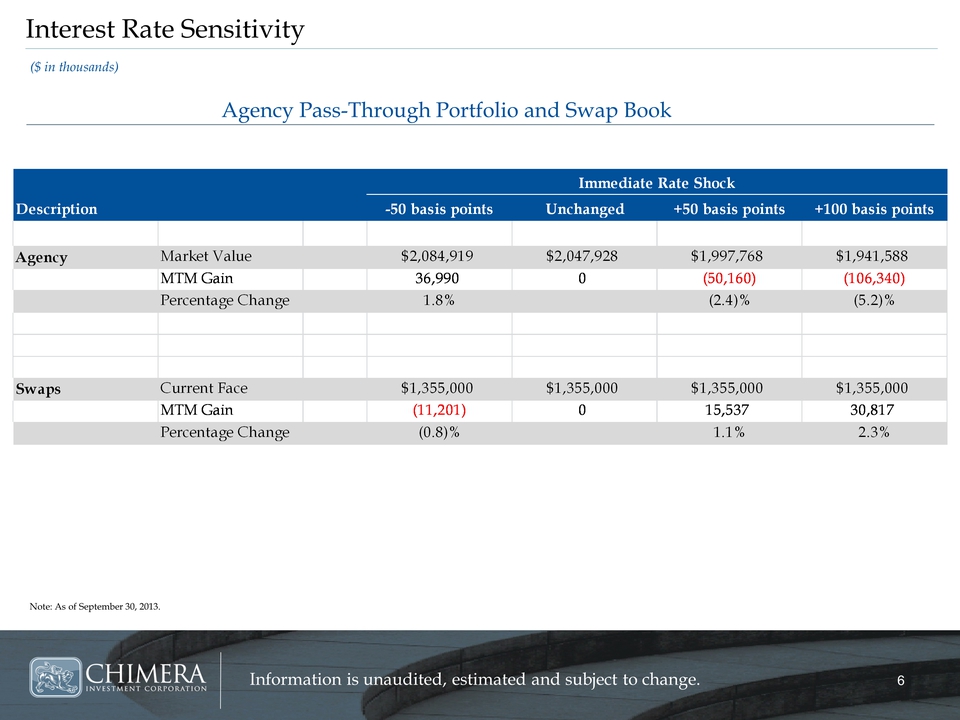
6 6 Information is unaudited, estimated and subject to change.Interest Rate Sensitivity Agency Pass-Through Portfolio and Swap Book Note: As of September 30, 2013. ($ in thousands)
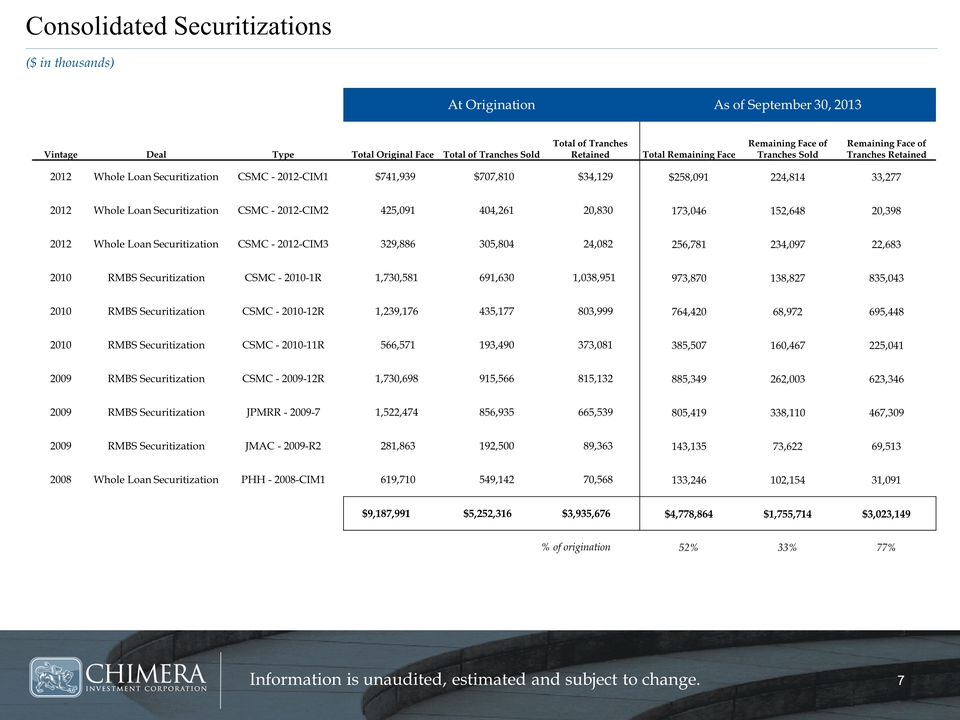
7 7 Information is unaudited, estimated and subject to change. Consolidated Seuritizations ($ in thousands) At Origination As of September 30, 2013 Vintage Deal Type Total Original Face Total of Tranches Sold Total of Tranches Retained Total Remaining Face Remaining Face of Tranches Sold Remaining Face of Tranches Retained 2012 Whole Loan Securitization CSMC - 2012-CIM1 $741,939 $707,810 $34,129 $258,091 224,814 33,277 2012 Whole Loan Securitization CSMC - 2012-CIM2 425,091 404,261 20,830 173,046 152,648 20,398 2012 Whole Loan Securitization CSMC - 2012-CIM3 329,886 305,804 24,082 256,781 234,097 22,683 2010 RMBS Securitization CSMC - 2010-1R 1,730,581 691,630 1,038,951 973,870 138,827 835,043 2010 RMBS Securitization CSMC - 2010-12R 1,239,176 435,177 803,999 764,420 68,972 695,448 2010 RMBS Securitization CSMC - 2010-11R 566,571 193,490 373,081 385,507 160,467 225,041 2009 RMBS Securitization CSMC - 2009-12R 1,730,698 915,566 815,132 885,349 262,003 623,346 2009 RMBS Securitization JPMRR - 2009-7 1,522,474 856,935 665,539 805,419 338,110 467,309 2009 RMBS Securitization JMAC - 2009-R2 281,863 192,500 89,363 143,135 73,622 69,513 2008 Whole Loan Securitization PHH - 2008-CIM1 619,710 549,142 70,568 133,246 102,154 31,091 $9,187,991 $5,252,316 $3,935,676 $4,778,864 $1,755,714 $3,023,149 % of origination 52% 33% 77%
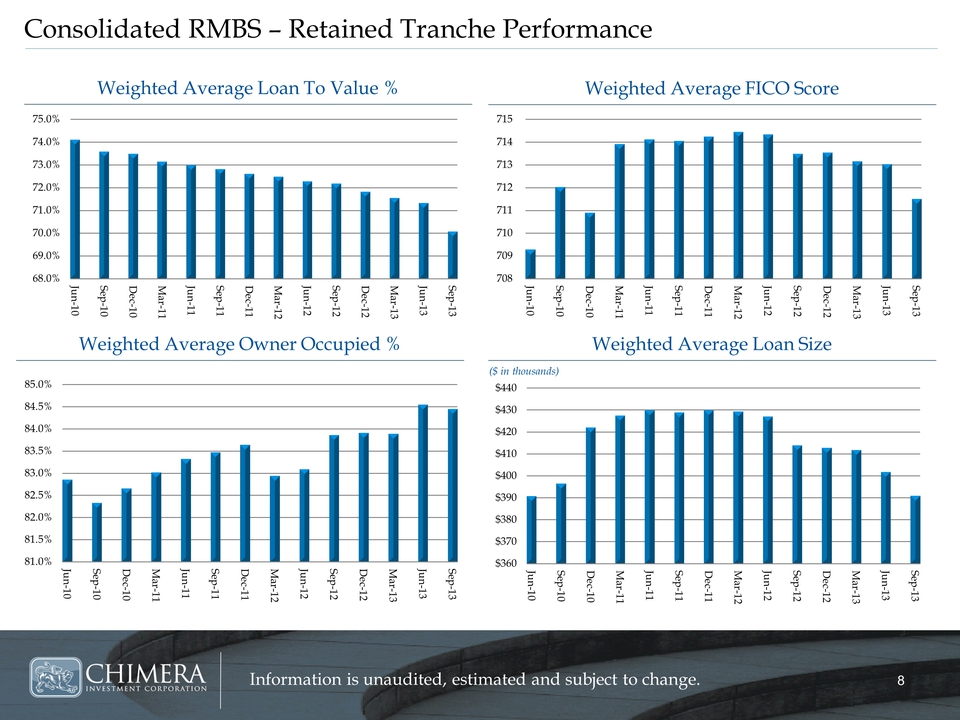
8 8 Information is unaudited, estimated and subject to change. Consolidated RMBS – Retained Tranche Performance Weighted Average Loan To Value % Weighted Average FICO Score Weighted Average Loan Size Weighted Average Owner Occupied % ($ in thousands) 68.0% 69.0% 70.0% 71.0% 72.0% 73.0% 74.0% 75.0% Jun-10 Sep-10 Dec-10 Mar-11 Jun-11 Sep-11 Dec-11 Mar-12 Jun-12 Sep-12 Dec-12 Mar-13 Jun-13 Sep-13 708 709 710 711 712 713 714 715 Jun-10 Sep-10 Dec-10 Mar-11 Jun-11 Sep-11 Dec-11 Mar-12 Jun-12 Sep-12 Dec-12 Mar-13 Jun-13 Sep-13 81.0% 81.5% 82.0% 82.5% 83.0% 83.5% 84.0% 84.5% 85.0% Jun-10 Sep-10 Dec-10 Mar-11 Jun-11Sep-11Dec-11Mar-12 Jun-12 Sep-12 Dec-12 Mar-13 Jun-13 Sep-13 $360 $370 $380 $390 $400 $410 $420 $430 $440 Jun-10 Sep-10 Dec-10 Mar-11 Jun-11 Sep-11 Dec-11 Mar-12 Jun-12 Sep-12 Dec-12 Mar-13 Jun-13 Sep-13
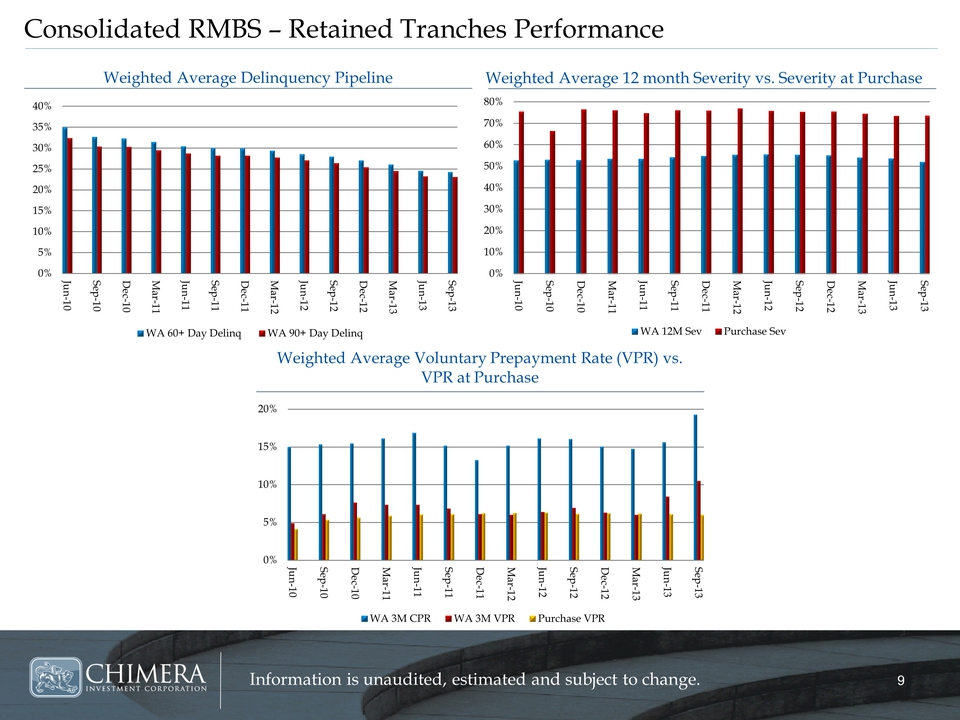
9 9 Information is unaudited, estimated and subject to change. Consolidated RMBS – Retained Tranches Performance Weighted Average Delinquency Pipeline Weighted Average 12 month Severity vs. Severity at Purchase Weighted Average Voluntary Prepayment Rate (VPR) vs. VPR at Purchase 0% 5% 10% 15% 20% 25% 30% 35% 40% Jun-10 Sep-10Dec-10 Mar-11 Jun-11 Sep-11 Dec-11 Mar-12 Jun-12 Sep-12 Dec-12 Mar-13 Jun-13 Sep-13 WA 60+ Day Delinq WA 90+ Day Delinq 0% 10% 20% 30% 40% 50% 60% 70% 80% Jun-10 Sep-10 Dec-10 Mar-11 Jun-11 Sep-11 Dec-11 Mar-12 Jun-12 Sep-12 Dec-12 Mar-13 Jun-13 Sep-13 WA 12M Sev Purchase Sev 0% 5% 10% 15% 20% Jun-10 Sep-10 Dec-10 Mar-11 Jun-11 Sep-11 Dec-11 Mar-12 Jun-12 Sep-12 Dec-12 Mar-13 Jun-13 Sep-13 WA 3M CPR WA 3M VPR Purchase VPR
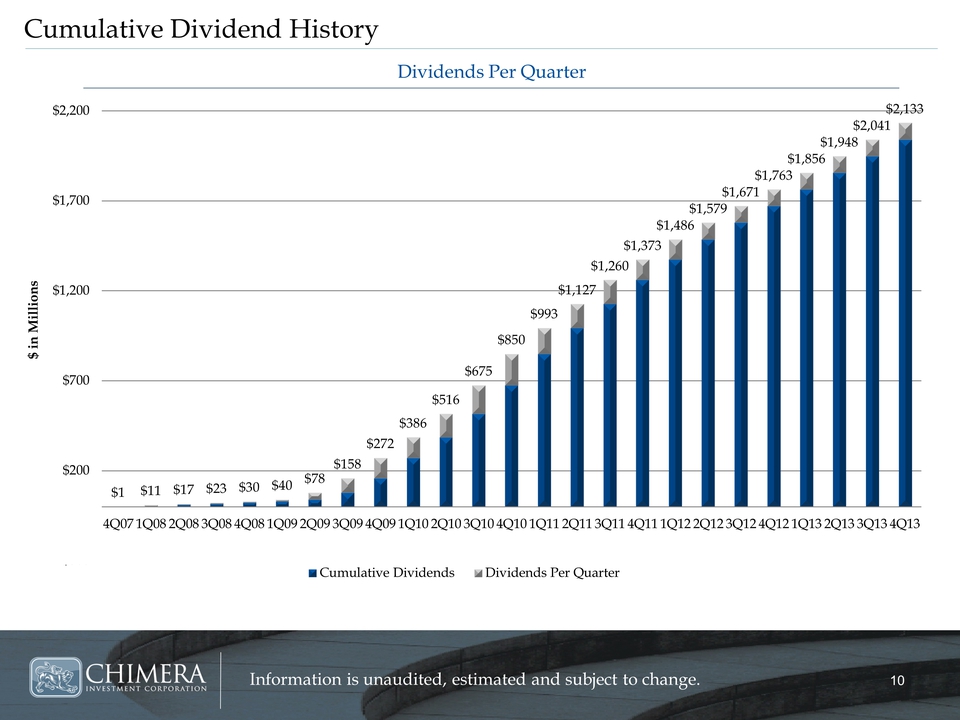
10 10 Information is unaudited, estimated and subject to change. Cumulative Dividend History Dividends Per Quarter $1 $11 $17 $23 $30 $40 $78 $158 $272 $386 $516 $675 $850 $993 $1,127 $1,260 $1,373 $1,486 $1,579 $1,671 $1,763 $1,856 $1,948 $2,041 $2,133 -$300 $200 $700 $1,200 $1,700 $2,200 4Q07 1Q08 2Q08 3Q08 4Q08 1Q09 2Q09 3Q09 4Q09 1Q10 2Q10 3Q10 4Q10 1Q11 2Q11 3Q11 4Q11 1Q12 2Q12 3Q12 4Q12 1Q13 2Q13 3Q13 4Q13 $ in Millions Cumulative Dividends Dividends Per Quarter