Attached files
| file | filename |
|---|---|
| 8-K - 8-K - Summit Materials, LLC | d638509d8k.htm |
| EX-12.1 - EX-12.1 - Summit Materials, LLC | d638509dex121.htm |
Exhibit 99.1
CAUTIONARY NOTE REGARDING FORWARD-LOOKING STATEMENTS
This current report on Form 8-K (this “Report”) contains “forward-looking statements” within the meaning of the federal securities laws, which involve risks and uncertainties. Forward-looking statements include all statements that do not relate solely to historical or current facts, and you can identify forward-looking statements because they contain words such as “believes,” “expects,” “may,” “will,” “should,” “seeks,” “intends,” “plans,” “estimates,” “projects” or “anticipates” or similar expressions that concern our strategy, plans or intentions. All statements made relating to our estimated and projected earnings, margins, costs, expenditures, cash flows, growth rates and financial results are forward-looking statements. These forward-looking statements are subject to risks and uncertainties that may change at any time, and, therefore, our actual results, performance or achievements may differ materially from those expected. We derive many of our forward-looking statements from our operating budgets and forecasts, which are based upon many detailed assumptions. While we believe that our assumptions are reasonable, it is very difficult to predict the affect of known factors, and, of course, it is impossible to anticipate all factors that could affect our actual results.
Some of the important factors that could cause actual results to differ materially from our expectations are disclosed under “Risk Factors” and elsewhere in this Report. All subsequent written and oral forward-looking statements attributable to us, or persons acting on our behalf, are expressly qualified in their entirety by these cautionary statements.
In light of the significant uncertainties inherent in the forward-looking statements included herein, the inclusion of such information should not be regarded as a representation by us or any other person that the results or conditions described in such statements or our objectives and plans will be realized. Important factors could affect our results and could cause results to differ materially from those expressed in our forward-looking statements, including but not limited to the factors discussed in the section entitled “Risk Factors” in our prospectus dated June 10, 2013 (the “Prospectus”), filed with the Securities and Exchange Commission (the “SEC”) in accordance with Rule 424(b) of the Securities Act of 1933, as amended, on June 10, 2013, any factors discussed in the section entitled “Risk Factors” of this report, and the following:
| • | our substantial current level of indebtedness; |
| • | our dependence on the construction industry and the strength of the local economies in which we operate; |
| • | our ability to acquire other businesses in our industry, successfully integrate them with our existing operations and retain key employees of such acquired businesses; |
| • | the cyclical nature of our business; |
| • | declines in public sector construction and reductions in governmental funding, including the funding of transportation authorities and other state agencies; |
| • | conditions in the credit markets; |
| • | our ability to accurately estimate the overall risks, requirements or costs when we bid on or negotiate a contract that is ultimately awarded to us; |
| • | risks related to weather and seasonality; |
| • | competition within our local markets; |
| • | our dependence on securing and permitting aggregate reserves in strategically located areas; |
| • | risks associated with our capital-intensive business; |
| • | any failure to meet schedule or performance requirements of our contracts; |
| • | changes in environmental, health, safety and climate change laws or governmental requirements or policies concerning zoning and land use; |
| • | our dependence on senior management and inability to attract and retain qualified management personnel; |
| • | special hazards related to our operations that may cause personal injury or property damage not covered by insurance; |
| • | material costs and losses as a result of claims that our products do not meet regulatory requirements or contractual specifications; |
| • | cancellation of significant contracts or our disqualification from bidding for new contracts; |
| • | our reliance on exemptions from certain disclosure requirements due to our status as an “emerging growth company”; |
| • | interruptions in our information technology systems and infrastructure; and |
| • | other factors as described in the Prospectus. |
1
All subsequent written and oral forward-looking statements attributable to us, or persons acting on our behalf, are expressly qualified in their entirety by these cautionary statements.
Any forward-looking statement that we make speaks only as of the date of this report. We undertake no obligation to publicly update or revise any forward-looking statement as a result of new information, future events or otherwise, except as otherwise required by law.
CERTAIN DEFINITIONS
As used in this Report, unless otherwise noted or the context otherwise requires,
| • | “we,” “our,” “us,” and “the Company” refer to Summit Materials, LLC and its subsidiaries as a combined entity, including Summit Materials Finance Corp., the co-issuer of the notes; |
| • | “Parent” refers only to Summit Materials Holdings L.P., our indirect parent entity; |
| • | “Summit Materials” refers only to Summit Materials, LLC and not its subsidiaries; |
| • | “Finance Corp.” refers only to Summit Materials Finance Corp., a wholly-owned subsidiary of Summit Materials; |
| • | “the Issuers” refers to Summit Materials and Finance Corp. as co-issuers of the notes but not to any of their subsidiaries; |
| • | “Harper Contracting” refers collectively to substantially all the assets of Harper Contracting, Inc., Harper Sand and Gravel, Inc., Harper Excavating, Inc., Harper Ready Mix Company, Inc. and Harper Investments, Inc.; |
| • | “Norris” refers to Norris Quarries, LLC; |
| • | “Kay & Kay” refers to certain assets of Kay & Kay Contracting, LLC; |
| • | “Sandco” refers to certain assets of Sandco Inc.; |
| • | “Lafarge” refers to Lafarge North America, Inc.; and |
| • | “Westroc” refers to Westroc, LLC. |
| • | “Blackstone” refers to certain investment funds affiliated with Blackstone Capital Partners V L.P.; |
| • | “Sponsors” refers to Blackstone and certain investment funds affiliated with Silverhawk Summit, L.P.; |
2
UNAUDITED PRO FORMA CONDENSED CONSOLIDATED FINANCIAL INFORMATION
The following unaudited pro forma condensed consolidated financial information has been prepared to give effect to our acquisitions of Norris, Kay & Kay and Sandco, which were completed on February 29, 2012, October 5, 2012 and November 30, 2012, respectively, as if they occurred on January 1, 2012. The acquisitions of Norris, Kay & Kay and Sandco are considered business combinations in accordance with Financial Accounting Standards Board Accounting Standards Codification 805, “Business Combinations.”
The following unaudited pro forma condensed consolidated financial information has been derived from our audited consolidated financial statements for the year ended December 29, 2012 included elsewhere in this Report along with the pre-acquisition financial information for Norris, Kay & Kay and Sandco. The historical consolidated financial information has been adjusted in the accompanying unaudited pro forma condensed consolidated statements of operations to give effect to pro forma events that are (i) directly attributable to the transaction, (ii) factually supportable, and (iii) expected to have a continuing effect on us. The unaudited pro forma condensed consolidated statements of operations exclude $1.7 million in non-recurring charges directly attributable to the Norris, Kay & Kay and Sandco acquisitions, including transaction-related costs such as financial advisory, accounting and legal fees.
The unaudited pro forma condensed consolidated financial information is presented for illustrative and informative purposes only and is not intended to represent or be indicative of what our results of operations would have been had the acquisitions of Norris, Kay & Kay and Sandco actually occurred on January 1, 2012. The unaudited pro forma condensed consolidated financial information should be read in conjunction with the information contained in “Selected Historical Consolidated Financial Data,” “Management’s Discussion and Analysis of Financial Condition and Results of Operations of Summit Materials, LLC” and the audited consolidated financial statements of Summit Materials included elsewhere in this Report. The unaudited pro forma condensed consolidated financial information should not be considered representative of our future results of operations or financial position.
Unaudited Pro Forma Condensed Consolidated Statements of Operations
for the year ended December 29, 2012
| Summit Materials, LLC | ||||||||||||||||
| (in thousands) | Summit Materials, LLC |
Pre- acquisition results of Norris, Kay & Kay and Sandco 1/1/2012 – 11/30/2012 |
Pro Forma adjustments for the acquisition of Norris, Kay & Kay and Sandco |
Pro Forma Combined |
||||||||||||
| Revenue |
$ | 926,254 | $ | 13,895 | $ | — | $ | 940,149 | ||||||||
| Cost of revenue (exclusive of items shown separately below) |
713,346 | 11,502 | — | 724,848 | ||||||||||||
| General and administrative expenses |
127,215 | 1,000 | — | 128,215 | ||||||||||||
| Depreciation, depletion, amortization and accretion |
68,290 | 1,008 | 81 | (a) | 69,379 | |||||||||||
| Transaction costs |
1,988 | — | (1,742 | ) (b) | 246 | |||||||||||
|
|
|
|
|
|
|
|
|
|||||||||
| Operating income |
15,415 | 385 | 1,661 | 17,461 | ||||||||||||
|
|
|
|
|
|
|
|
|
|||||||||
| Other (income) expense, net |
(1,182 | ) | 15 | — | (1,167 | ) | ||||||||||
| Loss on debt refinancing |
9,469 | — | — | 9,469 | ||||||||||||
| Interest expense |
58,079 | 2 | 200 | (c) | 58,281 | |||||||||||
|
|
|
|
|
|
|
|
|
|||||||||
| (Loss) income from continuing operations before income taxes |
$ | (50,951 | ) | $ | 368 | $ | 1,461 | $ | (49,122 | ) | ||||||
|
|
|
|
|
|
|
|
|
|||||||||
See accompanying notes to unaudited pro forma condensed consolidated financial information, which are an integral part of this information.
3
Notes to Unaudited Pro Forma Condensed Consolidated Financial information
| (a) | The depreciation expense adjustment relates to the step up in fair value of fixed assets acquired in the Norris, Kay & Kay and Sandco acquisitions. A summary of the effects of the adjustment to depreciation expense for the year ended December 29, 2012 is as follows (dollars in thousands): |
| Estimated depreciation expense |
$ | 330 | ||
| Elimination of historical depreciation expense |
(249 | ) | ||
|
|
|
|||
| Depreciation expense adjustment |
$ | 81 | ||
|
|
|
| (b) | This adjustment is to eliminate historical transaction costs incurred in connection with the Norris acquisition, principally legal and financial advisory fees due to the non-recurring nature of these expenses. There was no income tax benefit recorded on the transaction costs in the historical consolidated results of operations, accordingly, no pro forma tax adjustment has been recorded for this adjustment. The transaction costs removed for the year ended December 29, 2012 is $1.7 million. |
| (c) | A summary of the effects of the adjustment to interest expense for the year ended December 29, 2012 is as follows (dollars in thousands): |
| Estimated interest expense on debt from Norris acquisition(i) |
$ | 196 | ||
| Elimination of historical interest expense(ii) |
(2 | ) | ||
| Estimated interest associated with acquisition liabilities(iii) |
6 | |||
|
|
|
|||
| Interest expense adjustment |
$ | 200 | ||
|
|
|
| (i) | This adjustment is to reflect the estimated incremental interest expense based on the average interest rate between January 1, 2012 and February 29, 2012, the acquisition date, of approximately 4.75% on the debt incurred for the Norris acquisition as if incurred on January 1, 2012. |
| (ii) | This adjustment is to eliminate the interest expense in the historical statements of operations. |
| (iii) | We recorded certain acquisition-related liabilities at present value; accordingly, we began to record interest expense on the accretion of those liabilities. This adjustment is to record additional interest expense for the pre-acquisition period, assuming we had acquired Norris and recorded the acquisition-related liabilities at present value on January 1, 2012. |
4
SELECTED HISTORICAL CONSOLIDATED FINANCIAL DATA
The following table sets forth, for the periods and as of the dates indicated, our selected predecessor and successor consolidated financial data. For financial statement presentation purposes, Hamm, Inc., which had a fiscal year end of March 31 prior to its acquisition by Summit Materials on August 26, 2009, has been identified as the predecessor. The selected predecessor statements of operations data for the period from April 1, 2009 to August 25, 2009 and for the year ended March 31, 2009 are derived from the audited consolidated financial statements not included in this Report. Summit Materials is the successor company. The selected successor statements of operations data for the three years ended December 29, 2012, December 31, 2011 and December 31, 2010 and the selected balance sheet data as of December 29, 2012 and December 31, 2011 are derived from our audited consolidated financial statements included elsewhere in this Report. The selected successor statements of operations data for the period from August 26, 2009 to December 31, 2009 and the selected balance sheet data as of December 31, 2010 and December 31, 2009 are derived from audited consolidated financial statements not included in this Report. The predecessor selected balance sheet data as of March 31, 2009 is derived from Hamm’s audited financial statements not included in this report. In 2011, Summit Materials adopted a “4-4-5” fiscal calendar in place of the calendar year it previously used. Under the 4-4-5 fiscal period, each year is divided into four quarters and each quarter consists of two four week “months” and one five week “month.” Historical results are not indicative of the results to be expected in the future.
You should read the following information together with the more detailed information contained in “Management’s Discussion and Analysis of Financial Condition and Results of Operations of Summit Materials, LLC” and the consolidated financial statements and the accompanying notes appearing elsewhere in this Report.
| Summit Materials, LLC (Successor) | Hamm, Inc. (Predecessor) | |||||||||||||||||||||||||
| ($ in thousands) | Year Ended December 29, 2012(1) |
Year Ended December 31, 2011(1) |
Year Ended December 31, 2010(1) |
Period from August 26, 2009 to December 31, 2009 |
Period From April 1, 2009 to August 25, 2009 |
Year Ended March 31, 2009 |
||||||||||||||||||||
| Statements of Operations Data: |
||||||||||||||||||||||||||
| Revenue |
$ | 926,254 | $ | 789,076 | $ | 405,297 | $ | 29,348 | $ | 36,195 | $ | 104,407 | ||||||||||||||
| Cost of revenue (exclusive of items shown separately below) |
713,346 | 597,654 | 284,336 | 21,582 | 24,940 | 83,152 | ||||||||||||||||||||
| General and administrative expenses |
127,215 | 95,826 | 48,557 | 4,210 | 1,639 | 2,993 | ||||||||||||||||||||
| Depreciation, depletion, amortization and accretion |
68,290 | 61,377 | 33,870 | 3,148 | 3,187 | 8,101 | ||||||||||||||||||||
| Transaction costs |
1,988 | 9,120 | 22,268 | 4,682 | ||||||||||||||||||||||
|
|
|
|
|
|
|
|
|
|
|
|
|
|||||||||||||||
| Operating income (loss) |
15,415 | 25,099 | 16,266 | (4,274 | ) | 6,429 | 10,161 | |||||||||||||||||||
| Other (income) expense, net |
(1,182 | ) | (21,244 | ) | 1,583 | 192 | 484 | (1,220 | ) | |||||||||||||||||
| Loss on debt refinancing |
9,469 | — | 9,975 | — | — | — | ||||||||||||||||||||
| Interest expense |
58,079 | 47,784 | 25,430 | 574 | — | — | ||||||||||||||||||||
|
|
|
|
|
|
|
|
|
|
|
|
|
|||||||||||||||
| (Loss) income from continuing operations before income taxes |
(50,951 | ) | (1,441 | ) | (20,722 | ) | (5,040 | ) | 5,945 | 11,381 | ||||||||||||||||
| Income tax (benefit) expense |
(3,920 | ) | 3,408 | 2,363 | 216 | 2,303 | 4,152 | |||||||||||||||||||
|
|
|
|
|
|
|
|
|
|
|
|
|
|||||||||||||||
| (Loss) income from continuing operations |
$ | (47,031 | ) | $ | (4,849 | ) | $ | (23,085 | ) | $ | (5,256 | ) | $ | 3,642 | $ | 7,229 | ||||||||||
|
|
|
|
|
|
|
|
|
|
|
|
|
|||||||||||||||
| Cash Flow Data: |
||||||||||||||||||||||||||
| Net cash provided by (used for): |
||||||||||||||||||||||||||
| Operating activities |
$ | 62,279 | $ | 23,253 | $ | (20,529 | ) | $ | 3,897 | $ | 6,320 | $ | 17,430 | |||||||||||||
| Investing activities |
(85,340 | ) | (192,331 | ) | (499,381 | ) | (46,669 | ) | 31,255 | (18,492 | ) | |||||||||||||||
| Financing activities |
7,702 | 146,775 | 575,389 | 52,379 | (44,649 | ) | (2,045 | ) | ||||||||||||||||||
| Balance Sheet Data (as of period end): |
||||||||||||||||||||||||||
| Cash and cash equivalents |
$ | 27,431 | $ | 42,790 | $ | 65,093 | $ | 9,614 | $ | 10,419 | ||||||||||||||||
| Total assets |
1,281,213 | 1,284,265 | 1,101,581 | 111,775 | 100,719 | |||||||||||||||||||||
| Total debt (including current portion of long-term debt) |
639,843 | 608,981 | 559,980 | 28,750 | — | |||||||||||||||||||||
| Capital leases |
3,092 | 3,158 | 3,217 | — | — | |||||||||||||||||||||
| Total member’s interest |
382,428 | 436,372 | 345,993 | — | — | |||||||||||||||||||||
| Redeemable Noncontrolling interests |
22,850 | 21,300 | 21,300 | — | — | |||||||||||||||||||||
| Other Financial Data (as of period end): |
||||||||||||||||||||||||||
| Total hard assets(2) |
$ | 906,584 | $ | 906,166 | $ | 775,457 | $ | 92,309 | $ | 32,571 | ||||||||||||||||
| Ratio of earnings to fixed charges(3) |
0.1 | 1.0 | 0.2 | N/A | 364.0 | 341.4 | ||||||||||||||||||||
| (1) | Amounts are shown net of the results of operations associated with certain non-core businesses sold or wound down in 2013 and 2012 and classified as discontinued operations. |
| (2) | Defined as the balance sheet book value of the sum of (a) property, plant and equipment, net and (b) inventories. |
| (3) | The ratio of earnings to fixed charges is determined by dividing earnings, as adjusted, by fixed charges. Fixed charges consist of interest on all indebtedness plus that portion of operating lease rentals representative of the interest factor (deemed to be 33% of operating lease rentals). Earnings were insufficient to cover fixed charges for the period from August 26, 2009 to December 31, 2009 by $5.6 million. |
5
MANAGEMENT’S DISCUSSION AND ANALYSIS OF FINANCIAL CONDITION
AND RESULTS OF OPERATIONS OF SUMMIT MATERIALS, LLC
You should read the following discussion of our results of operations and financial condition with the “Unaudited Pro Forma Condensed Consolidated Financial Information” and the “Selected Historical Consolidated Financial Data” sections of this Report and our audited consolidated financial statements for the years ended December 29, 2012, December 31, 2011 and December 31, 2010 and the related notes thereto included elsewhere in this Report. This discussion contains forward-looking statements and involves numerous risks and uncertainties. Factors that may cause differences between actual results and those contemplated by forward-looking statements include, but are not limited to, those discussed in the section entitled “Risk Factors” in the Prospectus and any factors discussed in the sections entitled “Cautionary Note Regarding Forward-Looking Statements”. Our actual results may differ materially from those contained in any forward-looking statements.
Overview
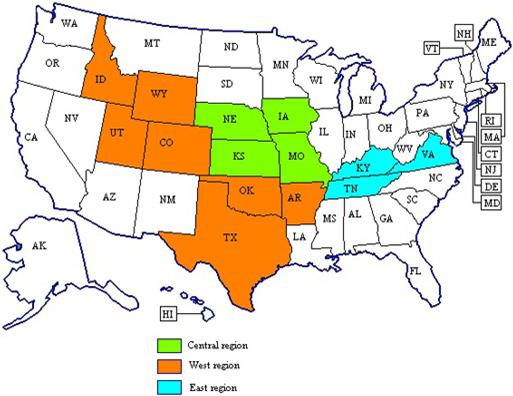
We are a leading, vertically-integrated, geographically-diverse heavy-side building materials company. We supply aggregates, cement and related downstream products such as asphalt paving mix, ready-mixed concrete, concrete products and paving and related construction services for a variety of end-uses in the U.S. construction industry, including public infrastructure projects, as well as private residential and non-residential construction. We have organized the business by geographic region and have three operating segments, which are also our reporting segments: Central; West; and East regions. Across the three regions, we believe we are a top 15 supplier of aggregates, a top 20 supplier of cement, a top 10 producer of asphalt paving mix and a major producer of ready-mixed concrete in the United States by volume. As of December 29, 2012, we had 1.2 billion tons and 0.4 billion tons of proven and probable aggregates reserves serving our aggregates and cement businesses, respectively, and operated over 120 sites and plants. We believe that we have adequate road, barge and/or railroad access to all of our sites and plants. We do not perform annual reserve audits. From time to time, in connection with certain acquisitions, we engage a third party engineering firm to perform a reserve audit.
Our production volumes and average selling prices for our primary products in 2012, 2011 and 2010 are as follows:
| 2012 | 2011 | 2010 | ||||||||||||||||||||||
| Volume(1) | Average Selling Price(2) |
Volume(1) | Average Selling Price(2) |
Volume(1) | Average Selling Price(2) |
|||||||||||||||||||
| Aggregate |
16,728 | $ | 8.49 | 13,844 | $ | 8.17 | 7,972 | $ | 8.82 | |||||||||||||||
| Asphalt |
4,553 | 53.31 | 4,074 | 48.17 | 1,590 | 50.29 | ||||||||||||||||||
| Ready-mixed concrete |
1,210 | 88.29 | 1,053 | 89.48 | 352 | 77.63 | ||||||||||||||||||
| (1) | Volumes are shown in tons for aggregates and asphalt and in cubic yards for ready-mixed concrete. |
| (2) | Average selling prices are shown on a per ton basis for aggregates and asphalt and on a per cubic yard basis for ready-mixed concrete. |
The growth in our volumes in 2012 and 2011 is primarily a result of our acquisitions, which have also affected our average selling prices, as we entered into new markets with different pricing structures. Our cement volume has increased, but pricing has decreased as a result of changes in customer mix.
Our estimate of proven and probable reserves for which we have permits for extraction and that we consider to be recoverable aggregates of suitable quality for economic extraction by segment are shown in the table below along with average annual production over the past three years. The number of producing quarries shown on the table below includes the underground mine supporting our cement plant, which is currently in development.
| Number of producing quarries |
Tonnage of reserves for each general type of aggregate |
Annual production (tons) |
Average years until depletion at current production |
Percent of reserves owned and percent leased |
||||||||||||||||||||||||
| Hard Rock | Sand & Gravel |
|||||||||||||||||||||||||||
| Segment |
Owned | Leased* | ||||||||||||||||||||||||||
| (in thousands) | ||||||||||||||||||||||||||||
| Central |
53 | 865,142 | 18,672 | 9,902 | 89 | 17 | % | 83 | % | |||||||||||||||||||
| West |
38 | 148,905 | 170,756 | 4,586 | 70 | 37 | % | 63 | % | |||||||||||||||||||
| East |
21 | 419,519 | 5,614 | 4,194 | 101 | 33 | % | 67 | % | |||||||||||||||||||
| Total |
112 | 1,433,566 | 195,042 | 18,682 | ||||||||||||||||||||||||
| * | Lease terms range from monthly to on-going with an average lease expiry in 2020. |
6
We were formed in September 2008. Since July 2009, the Sponsors and certain of our officers, directors and employees have made $794.5 million of funding commitments to Parent. We have grown rapidly as a result of our disciplined acquisition strategy, utilizing approximately $457.3 million of the $463.9 million of equity commitments funded to Parent by the Sponsors and certain other investors. Today, our nine operating companies make up our three distinct geographic segments that span 18 states and 23 metropolitan areas. We believe each of our operating companies has a top three market share position in its local market area and an extensive operating history, averaging over 35 years. Our highly experienced management team, led by 30-year industry veteran, CEO Tom Hill has successfully enhanced the operations of acquired companies by focusing on scale advantages, cost efficiencies and pricing discipline to improve profitability and cash flow.
Of the 18 states in which we operate, we currently have assets in 14 states. The map below illustrates our geographic footprint:
Our revenue is derived from multiple end-use markets, including public infrastructure construction as well as private residential and non-residential construction. For the year ended December 29, 2012, approximately 62% of our revenue related to public infrastructure construction and the remaining 38% related to residential and non-residential construction. Public construction includes spending by federal, state and local governments for roads, highways, bridges, airports and other public infrastructure construction projects. A significant portion of our construction revenues are from public construction projects, a historically more stable portion of state and federal budgets. Our acquisitions to date are focused in states with constitutionally-protected transportation funding sources, which we believe serves to limit our exposure to state and local budgetary uncertainties. Private construction includes both new residential and non-residential construction and repair and remodel markets, which have been significantly affected by the downturn in the overall economy and the construction industry, in particular. We believe exposure to various markets affords us greater stability through economic cycles and positions us to capitalize on upside opportunities when recoveries in residential and non-residential construction occur.
Business Trends and Conditions
The U.S. heavy-side building materials industry is composed of four primary sectors: (i) aggregates; (ii) cement; (iii) asphalt paving mix; and (iv) ready-mixed concrete, each of which is widely used in most forms of construction activity. Participants in these sectors typically range from small, privately-held companies focused on a single product or market to multinational corporations that offer a wide array of construction materials and services. Markets are defined in part by the distance materials may be efficiently transported, resulting in largely local or regional operations.
7
Transportation infrastructure projects, driven by both state and federal funding programs, represent a significant share of the U.S. heavy-side building materials market. In July 2012, Moving Ahead for Progress in the 21st Century (“MAP-21”) was enacted and took effect in October 2012. MAP-21 is a 27-month, approximately $105 billion transportation funding program that provides for $40.4 billion and $41.0 billion in highway infrastructure investments in fiscal years 2013 and 2014, respectively. The spending levels are consistent with the preceding federal transportation funding program. In addition to federal funding, highway construction and maintenance funding is also available through state, county and local agencies. Our five largest states by revenue (Texas, Kansas, Kentucky, Missouri and Utah, which represented approximately 28%, 17%, 15%, 12% and 11%, respectively, of our total revenue for the year ended December 29, 2012) each have funds whose revenue sources are constitutionally protected and may only be spent on transportation projects:
| • | Texas’ 2012 - 2013 Department of Transportation budget is $19.8 billion, a $3.9 billion increase from the previous 2010-2011 biennium budget |
| • | Kansas has a 10-year $8.2 billion highway bill that was passed in May 2010 |
| • | Kentucky has a two-year $4.5 billion highway bill that was passed in April 2012 |
| • | Missouri has an estimated $0.7 billion in annual construction funding committed to essential road and bridge programs |
| • | Utah’s fiscal year 2013 transportation fund increased to $12.0 billion |
Currently, there is uncertainty as to what will succeed MAP-21, which expires in September 2014. We are hopeful a new highway bill will be passed by the end of 2014, which will require Continuing Resolutions between September 2014 and the date a new bill is passed. We are not expecting a significant change in funding levels through the Continuing Resolutions or a new bill. Within many of our markets, the federal, state and local governments have taken actions to maintain or grow highway funding during a time in which many areas of spending are facing significant cuts. However, we could still be affected by any economic improvement or slowdown, which could vary by local region and market. Our sales and earnings are sensitive to national, regional and local economic conditions and particularly to cyclical changes in construction spending, especially in the private sector.
In addition to being subject to cyclical changes in the economy, our business is seasonal in nature. Almost all of our products are produced and consumed outdoors. Severe weather, seasonal changes and other weather-related conditions can significantly affect the production and sales volumes of our products. Normally, the highest sales and earnings are in the second and third quarters and the lowest are in the first and fourth quarters. Winter weather months are generally periods of lower sales as we, and our customers, normally cannot cost-effectively mobilize and demobilize equipment and manpower during this period under adverse weather conditions. Periods of heavy rainfall also adversely affect our work patterns and therefore demand for our products. Our working capital may vary greatly during these peak periods, but generally return to average levels as our operating cycle is completed each fiscal year.
Financial Highlights
The principal factors in evaluating our financial condition and operating results for fiscal year 2012 compared to 2011 are:
| • | Total revenue of $926.3 million in 2012, increased 17.4%, or $137.2 million, from 2011, primarily as a result of acquisitions. Approximately 64% of our revenue is from product sales, which is the result of sales volume and pricing across our product lines. As presented in the table below, our volumes increased from 2011 to 2012, primarily from acquisitions, across all of our product lines. The 18.0% increase in cement volumes was organic, as we had no acquisitions in 2012 or 2011 affecting our cement sales. |
| Volume Increases in 2012 Compared to 2011 |
||||
| Aggregates |
20.8 | % | ||
| Asphalt |
11.8 | % | ||
| Ready-mixed concrete |
14.9 | % | ||
| Cement |
18.0 | % | ||
In 2012, we experienced modest price growth across our product lines. We realized increases in aggregates and asphalt average selling prices across the Company and a decrease in ready-mixed concrete due to a shift in product mix, despite increased prices across the ready-mixed concrete products on a like-for-like basis. The average selling price for cement decreased 2.2% per ton from 2011 to 2012 due to a change in customer mix.
8
| Average Selling Prices in 2012 Compared to 2011 |
||||
| Aggregates |
3.8 | % | ||
| Asphalt |
10.7 | % | ||
| Ready-mixed concrete |
(1.3 | )% | ||
| Cement |
(2.2 | )% | ||
| • | Operating income of $15.4 million compared to $25.1 million in 2011. The decrease in operating income is primarily attributable to $8.0 million of charges recorded in 2012 on an indemnification agreement in the West region, compared to $1.9 million in 2011, and low-margin legacy contracts and cost overruns in our construction business. These losses were offset by increased operating income from 2012 to 2011 acquisitions. |
| • | Cash provided by operations of $62.3 million improved from $23.3 million in 2011 due primarily to improved cash management. |
| • | Cash paid for acquisitions of $48.8 million decreased from $161.1 million in 2011. We acquired three companies in 2012, compared to eight in 2011. |
Acquisitions
On February 29, 2012, we acquired certain assets of Norris Quarries, LLC in Missouri. The Norris acquisition expanded our market position in the Central region. It is a 100% aggregates company geographically situated between existing businesses in Missouri and Kansas.
On October 5, 2012, we acquired certain assets of Kay & Kay Contracting, LLC in Kentucky. The Kay & Kay acquisition expands our market presence in the southeastern region of Kentucky producing both aggregates and asphalt.
On November 30, 2012, we acquired the stock of Sandco, Inc. in Colorado. The Sandco acquisition expands our market presence in the western region of Colorado producing both aggregates and ready-mixed concrete.
Discontinued Operations
As part of our strategy to focus on our core business as a heavy-side building materials company, we have exited certain activities, including certain concrete paving operations, our railroad construction and maintenance business (referred to herein as the “railroad business”), which involved building and repairing railroad sidings, and our environmental remediation business, which primarily involved the repair of retaining walls along highways in Kentucky and the removal and remediation of underground fuel storage tanks. The concrete paving operations were wound down in the second quarter of 2013; management expects the related assets to be sold within the next twelve months. The railroad and environmental remediation businesses were sold in separate transactions in 2012 for an aggregate of $3.1 million. Prior to recognition as discontinued operations, all of these businesses were included in the East region’s operations.
Aggregates
According to the February 2013 U.S. Geological Survey, approximately 1.28 billion tons of crushed stone with a value of approximately $11.5 billion was produced in the United States in 2012, in line with 1.28 billion tons in 2011. Sand and gravel production was approximately 907 million tons in 2012 valued at approximately $6.25 billion, up from 894 million tons in 2011. The U.S. aggregate industry is highly fragmented relative to other building product markets, with numerous participants operating in localized markets and the top six players controlling approximately 30% of the national market in 2011. The January 2013 U.S. Geological Survey reported that a total of 1,550 companies operating 4,000 quarries and 91 underground mines produced or sold crushed stone in 2012 in the United States.
We believe that the long-term growth of the market for aggregates is largely driven by growth in population, jobs and households, which affect transportation infrastructure spending and changes in population density. In the past few years, the recession in the United States has led to a decrease in overall private construction activity. Despite the increase in federal stimulus spending, public construction activity has declined over this period, albeit less than private construction markets. Through the prior three U.S. recessions (July 1990 through March 1991, March 2001 through November 2001 and December 2007 through June 2009), highway spending in real dollars grew 1.8% annually on average in years with a recession as compared to 0.9% annually on average in years without a recession. While short-term demand for aggregates fluctuates with economic cycles, the declines have historically been followed by strong recovery, with each peak establishing a new historical high.
9
Cement
Cement production is a capital-intensive business with variable costs dominated by raw materials and energy required to fuel the kiln. Building new plants is challenging given the extensive permitting that is required and significant costs. New plant construction costs in the United States are estimated at $250-300 per ton according to the PCA. Assuming construction costs of $275 per ton, a 1.25 million ton facility, such as the one Continental Cement operates, would cost approximately $343.8 million to construct.
As reported by the PCA in the 2012 North American Cement Industry Annual Yearbook, consumption is down significantly from the industry peak of 141 million tons in 2005 to 79 million tons in 2011 because of the decline in U.S. construction sector activity. Domestic cement consumption has at times outpaced domestic production capacity with the shortfall being supplied with imports, primarily from China, Canada, Columbia, Mexico and South Korea. The PCA reports that cement imports have declined since their peak of 39 million tons in 2006 to 7 million tons in 2011, in a manner indicative of the industry’s general response to the current demand downturn. Despite the reduction in imports, capacity utilization declined from 95% in 2006 to 59% in 2011 according to the PCA. Continental Cement operated at 75% capacity utilization in 2011 and 81% in 2012, which is above the 2011 industry mean of 68% capacity utilization as its markets did not suffer the pronounced demand declines seen in states like Florida, California and Arizona. Demand is seasonal in nature with nearly two-thirds of U.S. consumption occurring between May and October, coinciding with end-market construction activity.
In the cement industry, calcium oxide (“CaO”) content is the traditional measurement of limestone quality and purity. Limestone of 100% purity as measured by calcium carbonate (“CaCO3”) contains 56% CaO. Continental Cement’s mineable reserves have an average grade of 51.9% CaO, or 92.7% CaCO3. The mineable reserve calculation is based on a 70-foot mining height and a recovery ratio of 71.3% over the approximately 3,000 acre plant site.
Cement production in the United States is distributed among 101 production facilities located across 36 states. The EPA has new emission standards for Portland cement plants (“NESHAP”) that are due to come into effect in 2015. On December 20, 2012, the EPA signed the NESHAP final rule, which was less stringent than the previous draft. The PCA had estimated based on the draft rule that 18 plants could be forced to close due to the inability to meet NESHAP standards or because the compliance investment required may not be justified on a financial basis. These potential closures represent approximately 20 million tons of clinker capacity, or 20% of current capacity in the United States.
Continental Cement’s plant utilizes coal, petroleum coke and alternative fuel (hazardous and non-hazardous) and, as a result, is subject to HWC-MACT standards, rather than NESHAP. We expect HWC-MACT standards to generally conform to NESHAP, for which we are mostly in compliance, ahead of the effective date of the NESHAP standards. Any additional costs to comply with the NESHAP standards are not expected to have a material adverse effect on our financial position, results of operations or liquidity.
Asphalt Paving Mix
Asphalt paving mix is produced by mixing aggregates and asphalt cement, a petroleum based product that serves as the binder, at elevated temperatures. These high production temperatures are needed to allow the asphalt binder to become viscous enough to completely coat the aggregates in the paving mix, have good workability during laying and compaction, and provide durability during traffic exposure. A high weight-to-value ratio and the need to maintain the asphalt paving mix at a sufficiently high temperature during the paving process typically limits the delivery time to a one-hour haul from production plant to the paving location. Consequently, the asphalt paving mix market is highly localized with a fragmented ownership base.
According to the National Asphalt Pavement Association, there are approximately 4,000 asphalt paving mix plants in the United States. As reported by the National Asphalt Pavement Association, an estimated 366 million tons of asphalt paving mix was produced in 2011 which was broadly in line with the estimated 360 million tons produced in 2010.
The use of warm mix asphalt (“WMA”) or “green” asphalt is gaining popularity. The immediate benefit to producing WMA is the reduction in energy consumption required by burning fuels to heat traditional hot mix asphalt (“HMA”) to temperatures in excess of 300°F at the production plant. WMA can reduce the temperature by 50 to 70°F, resulting in lower emissions, fumes and odors generated at the plant and the paving site.
The asphalt paving mix sector is heavily exposed to public infrastructure spending as the vast majority of public roads and highways are paved with asphalt. Demand is seasonal in nature and focused on the April to November period in most states as asphalt paving requires a certain minimum ambient temperature to achieve the desired performance. Asphalt cement or liquid asphalt is a major input material. As a petroleum product, its price is driven by many factors and a fluctuation in the price of inputs, such as asphalt cement and burner fuel, which is typically either natural gas or recycled oil, may not be immediately recovered from the end customer.
10
Ready-Mixed Concrete
As a result of the transportation constraints, the ready-mixed concrete market is highly localized, with an estimated 5,500 ready-mixed concrete plants in the United States, per the NRMCA. According to the NRMCA, 291 million cubic yards of ready-mixed concrete was produced in 2012, which is a 9% increase from the 266 million cubic yards in 2011, but a 36% decrease from the industry peak of 458 million cubic yards in 2005. Ready mixed concrete demand is driven in large part by private residential and non-residential building demand and the decline of demand since 2005 is strongly correlated with the decline in construction spending in these end-use markets during this period.
The major raw material inputs for ready-mixed concrete are aggregates and cement, the price of which has generally tended to increase over time in a predictable manner. Ready-mixed concrete is almost always delivered to the end-user by the supplier via purposely designed vehicles. Consequently, fuel prices are also an important cost component. Many suppliers reduce their exposure to changes in fuel costs by including sales price adjustment provisions for changes in fuel prices.
Components of Operating Results
Revenue
We derive our revenue predominantly by selling construction materials and providing construction services. Construction materials consist of aggregates and related downstream products, including asphalt, ready-mixed concrete, cement and concrete products. Construction services primarily relate to asphalt paving and other highway construction services.
The following summarizes our revenue recognition policy with respect to construction materials and services:
| • | Revenue derived from construction material sales are recognized when risks associated with ownership have passed to unaffiliated customers. Typically this occurs when products are shipped. Product revenue generally includes sales of aggregates and related downstream products, cement and other materials to customers, net of discounts, allowances and taxes, if any. |
| • | Revenue derived from construction service contracts are recognized on the percentage-of-completion method, measured by the cost incurred to date compared to estimated total cost of each project. This method is used because management considers cost incurred to be the best available measure of progress on these contracts. Due to the inherent uncertainties in estimating costs, it is at least reasonably possible that the estimates used will change over the life of the contract. |
Operating costs and expenses
The key components of our operating costs and expenses consist of the following:
Cost of revenue (excluding items shown separately below)
Cost of revenue consists of all production and delivery costs and primarily includes labor, repair and maintenance, utilities, raw materials, fuel, transportation, subcontractor costs and manufacturing overhead. Our cost of revenue is directly affected by fluctuations in commodity energy prices, primarily diesel fuel, liquid asphalt and other petroleum-based resources. As a result, our operating profit margins can be significantly affected by changes in the underlying cost of certain raw materials if they are not recovered through corresponding changes in revenue. We attempt to limit our exposure to changes in commodity energy prices by entering into forward purchase commitments when appropriate. In addition, we have sales price adjustment provisions that provide for adjustments based on fluctuations outside a limited range in certain energy-related production costs. These provisions are in place for most of our public contracts and we aggressively seek to include similar price adjustment provisions in our private contracts.
General and administrative expenses
General and administrative expenses consist primarily of salaries and personnel costs for our sales and marketing, administration, finance and accounting, legal, information systems and human resources employees. Additional expenses include audit, consulting and professional fees, travel, insurance and other corporate expenses.
Transaction costs
Transaction costs consist primarily of third party accounting, legal, valuation and financial advisory fees incurred in connection with acquisitions.
11
Depreciation, depletion, amortization and accretion
Our business is relatively capital-intensive. We carry property, plant and equipment at cost, net of applicable depreciation, depletion and amortization on our balance sheet. Depreciation on property, plant and equipment is computed on a straight-line basis or based on the economic usage over the estimated useful life of the asset. The general range of depreciable lives by fixed asset category, excluding mineral reserves which are depleted based on the units of production method on a quarry-by-quarry basis, is as follows:
| Buildings and improvements |
7 - 40 years | |||
| Plant, machinery and equipment |
3 - 40 years | |||
| Truck and auto fleet |
3 - 10 years | |||
| Mobile equipment and barges |
3 - 20 years | |||
| Landfill airspace and improvements |
5 - 60 years | |||
| Other |
2 - 10 years |
Amortization expense is the periodic expense related to our intangible assets, which were acquired as part of certain of our acquisitions. The intangible assets are amortized on a straight-line basis over the estimated useful lives of the assets.
Accretion of accrued mining reclamation liabilities and landfill closure and post-closure liabilities is recorded using the effective interest method.
Results of Operations
The following discussion of our results of operations is focused on the material financial measures we use to evaluate the performance of our business from both a consolidated and operating segment perspective. We have three operating segments, which are also our reporting segments: Central; West; and East regions. Operating income and margins are discussed in terms of changes in volume, pricing and mix of revenue source (e.g., type of product sales or service revenue). The majority of our service revenue is generated by long-term contracts. As discussed further under “—Components of Operating Results” above, we generally account for revenue under these contracts using the percentage of completion method of accounting. Under this method, revenue is recognized as work progresses. Performance on service contracts refers to changes in contract earnings rates during the term of the contract based on revisions to estimates of profit at completion on individual contracts. These revisions result from increases or decreases to the estimated value of the contract and/or the estimated costs required to complete the contract. The following discussion of results of operations provides additional disclosure to the extent that a significant or unusual event causes a material change in the profitability of a contract.
The following table includes revenue and operating income (loss) by segment for the periods indicated. Operating income (loss) by segment is computed as earnings from continuing operations before interest, taxes and other income / expense.
| 2012 | 2011 | 2010 | ||||||||||||||||||||||
| (in thousands) |
Revenue | Operating income (loss) |
Revenue | Operating income (loss) |
Revenue | Operating income (loss) |
||||||||||||||||||
| Central |
$ | 302,113 | $ | 37,560 | $ | 264,008 | $ | 38,105 | $ | 211,238 | $ | 27,178 | ||||||||||||
| West |
484,922 | (6,625 | ) | 362,577 | (455 | ) | 59,337 | (4,691 | ) | |||||||||||||||
| East |
139,219 | (245 | ) | 162,491 | 2,687 | 134,722 | 4,287 | |||||||||||||||||
| Corporate(1) |
— | (15,275 | ) | — | (15,238 | ) | — | (10,508 | ) | |||||||||||||||
|
|
|
|
|
|
|
|
|
|
|
|
|
|||||||||||||
| Total |
$ | 926,254 | $ | 15,415 | $ | 789,076 | $ | 25,099 | $ | 405,297 | $ | 16,266 | ||||||||||||
|
|
|
|
|
|
|
|
|
|
|
|
|
|||||||||||||
| (1) | Corporate results primarily consist of compensation expense for employees included in our headquarters. |
Non-GAAP Performance Measures
Our chief operating decision maker evaluates the performance of our segments and allocates resources to them based on several factors, including a measure we call segment profit, or Adjusted EBITDA by segment. We define Adjusted EBITDA as earnings (loss) before loss from discontinued operations, income tax (benefit) expense, interest expense and depreciation, depletion, amortization and accretion. Accretion expense is recognized on our asset retirement obligations and reflects the time value of money. Given that accretion is similar in nature to interest expense, it is treated consistently with interest expense in determining Adjusted EBITDA. Adjusted EBITDA is determined before considering the loss from discontinued operations as results from discontinued operations are not viewed by management as part of our core business. When management assesses the performance of our segments and the allocation of resources, it is not included in Adjusted EBITDA. Adjusted EBITDA reflects an additional way of viewing aspects of our business that, when viewed with our GAAP results and the accompanying reconciliations to GAAP financial measures included in the tables below, may provide a more complete understanding of factors and trends affecting our business. However, it should not be construed as being more important than other comparable GAAP measures and must be considered in conjunction with GAAP measures. In addition, non-GAAP financial measures are not standardized; therefore it may not be possible to compare such financial measures with other companies’ non-GAAP financial measures having the same or similar names. We strongly encourage investors to review our consolidated financial statements in their entirety and not rely on any single financial measure.
12
| Reconciliation of Net Loss to Adjusted EBITDA | 2012 | 2011 | 2010 | |||||||||
| (in thousands) | ||||||||||||
| Net loss |
$ | (50,577 | ) | $ | (10,050 | ) | $ | (23,863 | ) | |||
| Income tax (benefit) expense |
(3,920 | ) | 3,408 | 2,363 | ||||||||
| Interest expense |
58,079 | 47,784 | 25,430 | |||||||||
| Depreciation, depletion and amortization |
67,665 | 60,687 | 33,345 | |||||||||
| Accretion |
625 | 690 | 525 | |||||||||
| Loss from discontinued operations |
3,546 | 5,201 | 778 | |||||||||
|
|
|
|
|
|
|
|||||||
| Adjusted EBITDA |
$ | 75,418 | $ | 107,720 | $ | 38,578 | ||||||
|
|
|
|
|
|
|
|||||||
| Adjusted EBITDA by Segment | ||||||||||||
| (in thousands) | ||||||||||||
| Central |
$ | 65,767 | $ | 65,651 | $ | 43,639 | ||||||
| West |
14,429 | 36,442 | (1,710 | ) | ||||||||
| East |
10,782 | 15,504 | 7,045 | |||||||||
| Corporate |
(15,560 | ) | (9,877 | ) | (10,396 | ) | ||||||
|
|
|
|
|
|
|
|||||||
| Adjusted EBITDA |
$ | 75,418 | $ | 107,720 | $ | 38,578 | ||||||
|
|
|
|
|
|
|
|||||||
In 2011, we adopted a “4-4-5” fiscal calendar in the place of the calendar year we previously used.
13
Consolidated Results of Operations
The tables below set forth our consolidated results from operations for the fiscal years indicated.
| 2012 | 2011 | 2010 | ||||||||||
| (in thousands) | ||||||||||||
| Revenue |
$ | 926,254 | $ | 789,076 | $ | 405,297 | ||||||
| Cost of revenue (excluding items shown separately below) |
713,346 | 597,654 | 284,336 | |||||||||
| General and administrative expenses |
127,215 | 95,826 | 48,557 | |||||||||
| Depreciation, depletion, amortization and accretion |
68,290 | 61,377 | 33,870 | |||||||||
| Transaction costs |
1,988 | 9,120 | 22,268 | |||||||||
|
|
|
|
|
|
|
|||||||
| Operating income |
15,415 | 25,099 | 16,266 | |||||||||
| Other (income) expense, net |
(1,182 | ) | (21,244 | ) | 1,583 | |||||||
| Loss on debt financings |
9,469 | — | 9,975 | |||||||||
| Interest expense |
58,079 | 47,784 | 25,430 | |||||||||
|
|
|
|
|
|
|
|||||||
| Loss from continuing operations before taxes |
(50,951 | ) | (1,441 | ) | (20,722 | ) | ||||||
| Income tax (benefit) expense |
(3,920 | ) | 3,408 | 2,363 | ||||||||
|
|
|
|
|
|
|
|||||||
| Loss from continuing operations |
(47,031 | ) | (4,849 | ) | (23,085 | ) | ||||||
| Loss from discontinued operations |
3,546 | 5,201 | 778 | |||||||||
|
|
|
|
|
|
|
|||||||
| Net loss |
(50,577 | ) | (10,050 | ) | (23,863 | ) | ||||||
| Net income attributable to noncontrolling interest |
1,919 | 695 | 86 | |||||||||
|
|
|
|
|
|
|
|||||||
| Net loss attributable to member of Summit Materials, LLC |
$ | (52,496 | ) | $ | (10,745 | ) | $ | (23,949 | ) | |||
|
|
|
|
|
|
|
|||||||
Fiscal year 2012 compared to 2011
| ($ in thousands) | 2012 | 2011 | Variance | |||||||||||||
| Revenue |
$ | 926,254 | $ | 789,076 | $ | 137,178 | 17.4 | % | ||||||||
| Operating income |
15,415 | 25,099 | (9,684 | ) | (38.6 | )% | ||||||||||
| Operating margin |
1.7 | % | 3.2 | % | (46.9 | )% | ||||||||||
| Adjusted EBITDA |
$ | 75,418 | $ | 107,720 | $ | (32,302 | ) | (30.0 | )% | |||||||
|
Revenue in 2012 increased to $926.3 million compared to $789.1 million in 2011. The $137.2 million increase was driven by acquisitions and $17.7 million from net pricing increases. Revenue from business acquired in 2012 totaled $24.7 million and the incremental revenue in 2012 from business acquired in 2011 was $149.7 million. Revenue growth from price increases and acquisitions was partially offset by $16.3 million of volume decreases across our product lines; excluding our cement business where we had an 18% increase from 2011 and from a decline in construction services revenue.
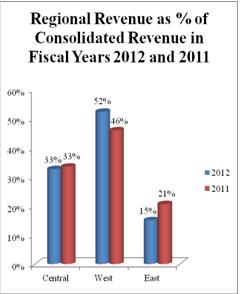
The West region experienced the most revenue growth in 2012 as compared to 2011. It was established in the second half of 2010 and grew significantly in 2011 through acquisitions. As a result, 2012 was the first year with a full year of results from these acquisitions. The West region composed 52% of consolidated revenue in 2012 compared to 46% in 2011 and the East region revenue declined from 21% to 15% of consolidated revenue. Revenue, as a percentage of consolidated revenue, remained constant in the Central region in 2012 as compared to 2011. |
14
Operating income decreased $9.7 million from $25.1 million in 2011 to $15.4 million in 2012. Operating income reflects our profit after taking into consideration cost of revenue, general and administrative expenses, depreciation, depletion, amortization and accretion and transaction costs. The components of cost of revenue generally increase ratably with revenue as labor, transportation costs and subcontractor costs are recorded in cost of revenue. As a result of our revenue growth occurring primarily through acquisitions, our general and administrative costs and depreciation, depletion, amortization and accretion generally have grown ratably with revenue. Our transaction costs fluctuate with the number and size of acquisitions consummated each year.
We are subject to commodity price risk with respect to price changes in liquid asphalt and energy, including fossil fuels and electricity for aggregates, cement, asphalt paving mix and ready-mixed concrete production, natural gas for hot mix asphalt production and diesel fuel for distribution vehicles and production related mobile equipment. Liquid asphalt escalators in most of our public contracts, other than those in Texas, limit our exposure to price fluctuations in this commodity. We often obtain similar escalators on private and commercial contracts. In addition, we enter into various firm purchase commitments with terms generally less than one year for certain raw materials, including commodities, in the ordinary course of business. As a result of the contract escalation clauses and effective use of the firm purchase commitments, commodity prices did not have a material effect on our results of operations in 2012 as compared to 2011.
As a percentage of revenue, the individual components of operating income remained relatively consistent from 2011 to 2012; operating margin, which we define as operating income as a percentage of revenue, declined from 3.2% in 2011 to 1.7% in 2012. Operating margin was affected by $8.0 million of costs recognized in connection with an indemnification agreement in 2012, compared to $1.9 million recognized in 2011, low-margin contracts and higher costs on certain construction projects, primarily in the West region. During 2012, we performed work on certain grading and structural projects that were generally bid and awarded prior to our acquisition of the respective entities. These non-core structural projects were bid without cost escalators for raw materials, fuel, etc., which resulted in cost escalations in 2012 as work was performed on the projects. In addition, in the East region, we were affected by low margins on certain projects from a highly competitive environment.
We experienced a decline in Adjusted EBITDA from $107.7 million in 2011 to $75.4 million in 2012 related to the following:
| • | In 2012, we recognized $8.0 million in losses on an indemnification agreement, compared to $1.9 million in 2011. |
| • | In 2012, a $9.5 million loss associated with a debt refinancing was recognized. |
| • | In 2011, we recognized $12.1 million of bargain purchase gains on certain acquisitions in the West region. The amount of the bargain purchase gain is equal to the amount by which the fair value of net assets acquired exceeded the consideration transferred. We believe that the resulting bargain purchase gain is reasonable as the sellers were highly motivated. For a further discussion of the bargain purchase gain, see note 2 to our audited consolidated financial statements included elsewhere in this Report. |
| • | In 2011 we recognized a $10.3 million favorable fair value adjustment on contingent consideration, compared to $0.4 million in 2012. The $10.3 million adjustment in 2011 was due primarily to revised estimates of the probability of achieving the specified targets related to certain acquisitions. |
| • | Transaction fees decreased $7.1 million in 2012 due to a decrease in acquisition activity. We closed eight acquisitions in 2011 with an average purchase price of $23.6 million compared to three in 2012 for an average purchase price of $19.8 million. |
Other Financial Information
Other income, net
Other income decreased to $1.2 million in 2012 from $21.2 million in 2011. Included in other income in 2011 were $12.1 million of bargain purchase gains on certain acquisitions in the West region and a $10.3 million gain from fair value adjustments to contingent consideration, compared to a $0.4 million fair value adjustment in 2012.
Loss on debt refinancing
We refinanced our long-term debt and accrued interest in January 2012 resulting in a $9.5 million charge. We did not refinance our long-term debt in 2011.
Interest expense
Interest expense increased $10.3 million, or 21.5%, to $58.1 million in 2012 compared to $47.8 million in 2011. The increase in our interest expense reflects an increase in our average debt. Our debt, without giving effect to original issuance discount, increased to $648.0 million at December 29, 2012 from $609.0 million at December 31, 2011. In addition, although our outstanding borrowings on our revolver were zero at year-end 2012, we carried an average balance of $36.7 million during 2012. The additional borrowings were primarily used to fund acquisitions ($48.8 million) and seasonal working capital requirements.
15
Income tax expense
Summit Materials is a limited liability company and passes its tax attributes for federal and state tax purposes to its parent entities and is generally not subject to federal or state income tax. However, the consolidated financial statements of the Company include federal and state income tax provisions for subsidiaries organized as taxable entities. In 2012, we recorded an income tax benefit of $3.9 million compared to expense of $3.4 million in 2011. The decrease in the income tax expense is due to taxable losses incurred by taxable entities in 2012.
Discontinued operations
As part of our strategy to focus on our core business as a heavy-side building materials company, we have exited certain activities, including concrete paving in the East region, our railroad business, which involved building and repairing railroad sidings, and our business of repairing retaining walls along highways in Kentucky and the removal and remediation of underground fuel storage tanks (referred to herein as the environmental remediation business). The concrete paving operations were wound down in the second quarter of 2013; management expects the related assets to be sold within the subsequent twelve months. The railroad and environmental remediation businesses were sold in 2012 in separate transactions for an aggregate $3.1 million. Prior to recognition as discontinued operations, all of these businesses were reported in the East region’s operations. Revenue from these discontinued operations was $50.2 million and $49.5 million in 2012 and 2011, respectively. The loss from discontinued operations, inclusive of the immaterial gain on the sale, was $3.5 million and $5.2 million in 2012 and 2011, respectively.
Fiscal year 2011 compared to 2010
| ($ in thousands) | 2011 | 2010 | Variance | |||||||||||||
| Revenue |
$ | 789,076 | $ | 405,297 | $ | 383,779 | 94.7 | % | ||||||||
| Operating income (loss) |
25,099 | 16,266 | 8,833 | 54.3 | % | |||||||||||
| Operating margin |
3.2 | % | 4.0 | % | (20.0 | )% | ||||||||||
| Adjusted EBITDA |
$ | 107,720 | $ | 38,578 | $ | 69,142 | 179.2 | % | ||||||||
Our revenue increased significantly in 2011 to $789.1 million compared to $405.3 million in 2010. The $383.8 million increase was almost entirely driven by acquisitions. Revenue from business acquired in 2011 totaled $117.0 million and the incremental revenue in 2011 from business acquired in 2010 was $248.1 million.
|
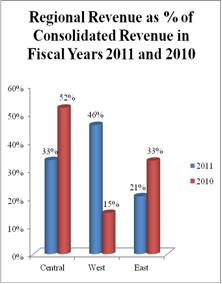
The West region saw the most revenue growth in 2011 as compared to 2010. It was established in the second half of 2010 and grew significantly in 2011 through acquisitions. As a result of this growth, the West region composed 46% of consolidated revenue in 2011 compared to 15% in 2010, thereby reducing the percentage of consolidated revenue contributed by the Central and East regions. Revenue, as a percentage of consolidated revenue, decreased 19% and 12% in the Central and East regions, respectively, in 2011 as compared to 2010.
Operating income increased $8.8 million from $16.3 million in 2010 to $25.1 million in 2011. Operating income reflects our profit after taking into consideration cost of revenue, general and administrative expenses, depreciation, depletion, amortization and accretion and transaction costs. The components of cost of revenue generally increase ratably with revenue as labor, transportation costs and subcontractor costs are recorded in cost of revenue. As a result of our revenue growth occurring primarily through acquisitions, our general and administrative costs and depreciation, depletion, amortization and accretion generally have grown ratably with revenue. Our transaction costs fluctuate with the number and size of acquisitions consummated each year. |
16
We are subject to commodity price risk with respect to price changes in liquid asphalt and energy, including fossil fuels and electricity for aggregates, cement, asphalt paving mix and ready-mixed concrete production, natural gas for hot mix asphalt production and diesel fuel for distribution vehicles and production related mobile equipment. Liquid asphalt escalators in most of our public contracts, other than those in Texas, limit our exposure to price fluctuations in this commodity. We often obtain similar escalators on private and commercial contracts. In addition, we enter into various firm purchase commitments with terms generally less than one year for certain raw materials, including commodities, in the ordinary course of business. As a result of the contract escalation clauses and effective use of the firm purchase commitments, commodity prices did not have a material effect on our results of operations in 2011 as compared to 2010.
As a percentage of revenue, the individual components of operating income remained relatively consistent from 2010 to 2011 with the exception of the West region, the effect of which led to a decline in operating margin, from 4.0% in 2010 to 3.2% in 2011. The West region’s operating margin is the lowest of our three regions and with their operations representing a higher proportion of the consolidated company, operating margins contracted in 2011. The West region’s operating margins, as compared to the other regions, have been affected by the timing of the acquisitions. We acquired two businesses in Austin, Texas in August and October 2011. Our business is seasonal with our peak earnings occurring between April and November of each year. With these acquisitions occurring late in the season, coupled with transaction fees associated with the acquisitions, an operating loss was recognized in 2011 in the West region. West region acquisitions were similarly timed in 2010 (August and November 2010) resulting in operating losses in 2010 as well. Underperformance on certain construction and paving contracts also affected operating margins in the West region.
We experienced significant Adjusted EBITDA growth in 2011 from $38.6 million in 2010 to $107.7 million primarily related to the following:
| • | Adjusted EBITDA from 2011 acquisitions was $21.2 million, which includes a $12.1 million bargain purchase gain recognized with certain acquisitions in the West region |
| • | Incremental Adjusted EBITDA in 2011 from 2010 acquisitions was $26.7 million, which includes a $10.3 million favorable fair value adjustment recognized on contingent consideration in the West and East regions |
| • | Transaction fees decreased $13.1 million in 2011 due to a decrease in acquisition activity. We closed eight acquisitions in 2011 with an average purchase price of $20.1 million compared to twelve acquisitions in 2010 with an average purchase price of $40.2 million |
| • | In 2010, a $10.0 million loss associated with two debt refinancings was recognized |
Other Financial Information
Other (income) expense, net
Other income increased to $21.2 million in 2011 from expense of $1.6 million in 2010. Included in other income in 2011 were $12.1 million of bargain purchase gains on certain acquisitions in the West region and a $10.3 million gain from fair value adjustments to contingent consideration.
Loss on debt refinancing
We refinanced our term debt in February 2010 and again in December 2010 resulting in a $10.0 million charge for financing fees. We did not refinance our long-term debt in 2011.
Interest expense
Interest expense increased $22.4 million, or 87.9%, to $47.8 million in 2011 compared to $25.4 million in 2010. The increase in our interest expense reflects an increase in our term loan in December 2010 from $136.4 million to $400.0 million, and the increase in borrowings under our revolver facility associated with our 2011 acquisition activity. We amended one of our credit facilities in December 2010 to fund future acquisitions and take advantage of more favorable interest rates.
17
Income tax expense
Summit Materials is a limited liability company and passes its tax attributes for federal and state tax purposes to its parent entities and is generally not subject to federal or state income tax. However, the consolidated financial statements of the Company include federal and state income tax provisions for subsidiaries organized as taxable entities. In 2011, we recorded income tax expense of $3.4 million compared to $2.4 million in 2010. The increase in the income tax expense is due to an increase in taxable income from the taxable entities.
Discontinued operations
As part of our strategy to focus on our core business as a heavy-side building materials company, we have exited certain activities, including concrete paving in the East region, our railroad business, which involved building and repairing railroad sidings, and our business of repairing retaining walls along highways in Kentucky and the removal and remediation of underground fuel storage tanks (referred to herein as the environmental remediation business). The concrete paving operations were wound down in the second quarter of 2013; management expects the related assets to be sold within the subsequent twelve months. The railroad and environmental remediation businesses were sold in 2012 in separate transactions for an aggregate $3.1 million. Prior to recognition as discontinued operations, all of these businesses were reported in the East region’s operations. Revenue from these discontinued operations was $49.5 million and $45.6 million in 2011 and 2010, respectively. The loss from discontinued operations was $5.2 million and $0.8 million in 2011 and 2010, respectively.
Segment results of operations
Central region fiscal year 2012 compared to 2011
| (in thousands) |
2012 | 2011 | Variance | |||||||||||||
| Revenue |
$ | 302,113 | $ | 264,008 | $ | 38,105 | 14.4 | % | ||||||||
| Operating income |
37,560 | 38,105 | (545 | ) | (1.4 | )% | ||||||||||
| Operating margin |
12.4 | % | 14.4 | % | ||||||||||||
| Adjusted EBITDA |
$ | 65,767 | $ | 65,651 | $ | 116 | 0.2 | % | ||||||||
Revenue in the Central region increased $38.1 million, or 14.4%, in 2012 to $302.1 million from $264.0 million in 2011 due to acquisitions and a $15.4 million increase in cement sales, driven by a 17% increase in cement volumes. Revenue from a business acquired in 2012 totaled $23.3 million and the incremental revenue in 2012 from a business acquired in 2011 was $1.5 million.
Operating margin declined in 2012 to 12.4% from 14.4% in 2011 primarily due to a $3.4 million gain on landfill closure obligations in 2011, as a result of revisions to landfill closure plans. After adjusting for this non-recurring gain, operating margin in 2012 was generally consistent with 2011.
Adjusted EBITDA remained relatively consistent from $65.7 million in 2011 to $65.8 million in 2012.
Central region fiscal year 2011 compared to 2010
| (in thousands) |
2011 | 2010 | Variance | |||||||||||||
| Revenue |
$ | 264,008 | $ | 211,238 | $ | 52,770 | 25.0 | % | ||||||||
| Operating income |
38,105 | 27,178 | 10,927 | 40.2 | % | |||||||||||
| Operating margin |
14.4 | % | 12.9 | % | ||||||||||||
| Adjusted EBITDA |
$ | 65,651 | $ | 40,790 | $ | 24,861 | 60.9 | % | ||||||||
Revenue in the Central region increased $52.8 million, or 25.0%, in 2011 to $264.0 million compared to $211.2 million in 2010 due primarily to acquisitions. Revenue from a business acquired in 2011 totaled $2.4 million and the incremental revenue in 2011 from businesses acquired in 2010 was $57.5 million. These revenue increases were partially offset by completion of a significant construction project with the Kansas Turnpike Authority in northeast Kansas which contributed approximately $10.9 million of additional revenue in 2010 as compared to 2011.
Operating margin improved in 2011 to 14.4% from 12.9% in 2010 primarily due to a $3.4 million gain on landfill closure obligations, as a result of revisions to landfill closure plans. After adjusting for this non-recurring gain, operating margin in 2011 was generally consistent with 2010.
18
The Adjusted EBITDA growth of $24.9 million from $40.8 million in 2010 to $65.7 million in 2011 was primarily due to the following:
| • | Adjusted EBITDA from 2011 acquisitions was $0.9 million. |
| • | Incremental Adjusted EBITDA in 2011 from 2010 acquisitions was $12.4 million. |
| • | $3.4 million gain on landfill closure obligations as a result of revisions to landfill closure plans. |
| • | $8.7 million decrease in transactions costs. In 2010, we acquired four entities for an average purchase price of $66.0 million compared to one acquisition in 2011 for $8.7 million. |
West region fiscal year 2012 compared to 2011
| (in thousands) |
2012 | 2011 | Variance | |||||||||||||
| Revenue |
$ | 484,922 | $ | 362,577 | $ | 122,345 | 33.7 | % | ||||||||
| Operating income |
(6,625 | ) | (455 | ) | (6,170 | ) | (1,356.0 | )% | ||||||||
| Operating margin |
(1.4 | )% | (0.1 | )% | ||||||||||||
| Adjusted EBITDA |
$ | 14,429 | $ | 36,442 | $ | (22,013 | ) | (60.4 | )% | |||||||
Revenue in the West region increased $122.3 million, or 33.7%, in 2012 to $484.9 million compared to $362.6 million in 2011. The majority of the increase is due to a full year of revenue from the six acquisitions that expanded our presence in Utah, Texas and Colorado in 2011. Incremental revenue from businesses acquired in 2011 totaled $147.4 million. These increases were partially offset by volume declines in the Utah market.
Operating margin remained relatively consistent at (0.1)% in 2011 and (1.4)% in 2012. The negative margin in 2011 was affected by $6.0 million of transaction costs related to the acquisitions, while 2012 was affected by $8.0 million in losses on an indemnification agreement, compared to $1.9 million in 2011, and lower margins on legacy construction projects due to cost overruns.
Adjusted EBITDA declined $22.0 million from $36.4 million in 2011 to $14.4 million in 2012 primarily due the following:
| • | In 2012, we recognized $8.0 million in losses on an indemnification agreement, compared to $1.9 million in 2011. |
| • | In 2011, we recognized $12.1 million of bargain purchase gains on our acquisitions in Colorado. |
| • | In 2011, we recognized a $4.8 million gain from a fair value adjustment to contingent consideration, compared to $0.4 million in 2012. |
West region fiscal year 2011 compared to 2010
| (in thousands) |
2011 | 2010 | Variance | |||||||||||||
| Revenue |
$ | 362,577 | $ | 59,337 | $ | 303,240 | 511.0 | % | ||||||||
| Operating income |
(455 | ) | (4,691 | ) | 4,236 | 90.3 | % | |||||||||
| Operating margin |
(0.1 | )% | (7.9 | )% | ||||||||||||
| Adjusted EBITDA |
$ | 36,442 | $ | (1,710 | ) | $ | 38,152 | 2,231.1 | % | |||||||
Our West region was established in 2010 with five acquisitions in Utah and in northeast Texas and expanded in 2011 with an additional six acquisitions expanding our presence in Utah, and into Austin, Texas and Colorado. The revenue growth in 2011 from 2010 was primarily due to these acquisitions. Revenue from businesses acquired in 2011 totaled $110.5 million and the incremental revenue in 2011 from businesses acquired in 2010 was $183.8 million.
Operating margin improved from (7.9)% in 2010 to (0.1)% in 2011. The negative margin in 2011 and 2010 was affected by $4.1 million and $6.0 million, respectively, of transaction costs related to the acquisitions. The reduction in these transaction costs attributed to the improved operating margin in 2011.
The Adjusted EBITDA growth of $38.2 million from a loss of $1.7 million in 2010 to $36.4 million in 2011 is primarily due the following:
| • | Adjusted EBITDA from 2011 acquisitions was $18.6 million, including $12.1 million bargain purchase gains related to the Colorado acquisitions. |
| • | Incremental Adjusted EBITDA in 2011 from 2010 acquisitions was $16.9 million. |
| • | In 2011, we recognized a $4.8 million gain from a fair value adjustment to contingent consideration. |
19
East region fiscal year 2012 compared to 2011
| (in thousands) | 2012 | 2011 | Variance | |||||||||||||
| Revenue |
$ | 139,219 | $ | 162,491 | $ | (23,272 | ) | (14.3 | )% | |||||||
| Operating income (loss) |
(245 | ) | 2,687 | (2,932 | ) | (109.1 | )% | |||||||||
| Operating margin |
(0.2 | )% | 1.7 | % | (111.8 | )% | ||||||||||
| Adjusted EBITDA |
$ | 10,782 | $ | 15,504 | $ | (4,722 | ) | (30.5 | )% | |||||||
Our East region’s revenue decreased $23.3 million from $162.5 million in 2011 to $139.2 million in 2012 due to a decline in construction and paving activities in Kentucky.
Operating margin in the East region decreased from 1.7% in 2011 to (0.2)% in 2012 due primarily to cost overruns on certain construction projects.
Adjusted EBITDA declined $4.7 million from $15.5 million in 2011 to $10.8 million in 2012 due primarily to a $3.7 million charge associated with the January 2012 debt refinancing and cost overruns of certain legacy construction projects.
East region fiscal year 2011 compared to 2010
| (in thousands) | 2011 | 2010 | Variance | |||||||||||||
| Revenue |
$ | 162,491 | $ | 134,722 | $ | 27,769 | 20.6 | % | ||||||||
| Operating income (loss) |
2,687 | 4,287 | (1,600 | ) | (37.3 | )% | ||||||||||
| Operating margin |
1.7 | % | 3.2 | % | (46.9 | )% | ||||||||||
| Adjusted EBITDA |
$ | 15,504 | $ | 7,045 | $ | 8,459 | 120.1 | % | ||||||||
Our East region’s revenue increased $27.8 million from 2010 as a result of revenue from a business acquired in 2011 ($4.0 million), incremental revenue in 2011 from businesses acquired in 2010 ($6.8 million) and $8.4 million of additional revenue on two large concrete paving projects that began in 2009 and increased volume in the construction business.
Operating margin in the East region decreased from 3.2% in 2010 to 1.7% in 2011 due primarily to the two large concrete paving projects, which earned lower margins in 2011 due to cost overruns.
The Adjusted EBITDA growth of $8.5 million from $7.0 million in 2010 to $15.5 million in 2011 was primarily due to the following:
| • | Adjusted EBITDA from a 2011 acquisition was $1.7 million. |
| • | Incremental Adjusted EBITDA in 2011 from 2010 acquisitions was a loss of $2.7 million. |
| • | Transaction costs from acquisitions decreased $4.9 million. |
| • | In 2010, we recognized a $5.5 million finance charge associated with two debt refinancings. |
Liquidity and Capital Resources
Our primary sources of liquidity include cash on-hand, cash provided by our operations and amounts available for borrowing under our credit facilities. We had $27.4 million in cash and working capital of $114.4 million as of December 29, 2012. Working capital is calculated as current assets less current liabilities, excluding the current portion of long term debt and outstanding borrowings on our revolver facility.
Given the seasonality of our business, we typically experience significant fluctuations in working capital needs and balances during our peak summer season; these amounts are converted to cash over the course of our normal operating cycle. We believe we have sufficient financial resources from our liquidity sources to fund our business and operations for at least the next twelve months, including contractual obligations, capital expenditures, debt service obligations and potential future acquisitions. Our growth strategy contemplates future acquisitions for which we believe we have sufficient capital through committed funds from our Sponsors and our borrowing capacity. There were no restricted cash balances as of December 29, 2012.
On April 1, 2013, we acquired certain assets of Lafarge in Wichita, Kansas and membership interests of Westroc near Salt Lake City, Utah funded through borrowings on the Senior Secured Revolving Credit Facility.
20
Our Credit Facilities
Refer to “Description of Other Indebtedness” and to the notes to the consolidated financial statements included elsewhere in this Report for detailed information on our long-term debt and revolving credit facility, scheduled maturities of long-term debt and affirmative and negative covenants, including the maximum allowable consolidated leverage ratios.
At December 29, 2012, $648.0 million of total debt, without giving effect to original issuance discount, was outstanding under the respective debt agreements, including the revolving credit facility, and the Company was in compliance with all debt covenants.
January 2012 Financing Transactions
On January 30, 2012 Summit and its wholly-owned subsidiary, Summit Materials Finance Corp. (collectively, the “Issuers”), issued $250.0 million aggregate principal amount of 10.5% Senior Notes due January 31, 2020 (“Senior Notes”) under an indenture dated as of January 30, 2012 (as amended and supplemented, the “Indenture”) among the Issuers, the guarantors party thereto and Wilmington Trust, National Association, as trustee. The Senior Notes are fully and unconditionally guaranteed on a joint and several senior unsecured basis by all of our existing and future wholly-owned domestic restricted subsidiaries that guarantee indebtedness under our senior secured credit facilities and by our non wholly-owned subsidiary Continental Cement. Concurrently with the issuance of the Senior Notes, on January 30, 2012, Summit entered into a senior secured credit facility which provided for term loans in an initial aggregate amount of $400.0 million and revolving credit commitments in an initial aggregate amount of $150.0 million (the “Senior Secured Credit Facility”). The borrowings under the Senior Secured Credit Facility and net proceeds from the issuance of the Notes were used to refinance Summit’s pre-existing credit facility and the Continental Cement debt.
Proceeds from the Senior Secured Credit Facility and the Senior Notes were used primarily for (i) repayment of $451.0 million of borrowings under the existing credit facility, consisting of $396.0 million of term debt and $55.0 million of revolving credit facility debt, (ii) repayment of $142.7 million of secured debt of Continental Cement consisting of $39.0 million of first lien debt, $3.7 million of first lien revolving credit facility debt and $100.0 million of second lien debt, (iii) repayment of $13.0 million due under a promissory note by and between Continental Cement and a related party, (iv) payment of $4.5 million of accrued interest related to the pre-existing credit facility and the Continental Cement debt, (v) payment of $12.9 million of fees and (vi) $16.5 million of cash on hand. The refinancing of the existing credit facility was partially accounted for as an extinguishment. As a result of this transaction, $9.5 million was charged to earnings in January 2012 and $15.0 million in deferred financing fees will be amortized over the term of the debt using the effective interest method. The original issuance discounts of $9.5 million were recorded as a reduction to debt in January 2012 and will be accreted with a charge to earnings over the term of the debt.
The Indenture contains covenants limiting, among other things, Summit and its restricted subsidiaries’ ability to incur additional indebtedness or issue certain preferred shares, pay dividends, redeem stock or make other distributions, make certain investments, sell or transfer certain assets, create liens, consolidate, merge, sell or otherwise dispose of all or substantially all of Summit’s assets, enter into certain transactions with affiliates, and designate subsidiaries as unrestricted subsidiaries. The Indenture also contains customary events of default. We entered into a registration rights agreement with the initial purchasers of the Senior Notes pursuant to which we have filed the registration statement on Form S-4. In the event that the exchange offer has not been consummated or a shelf registration statement covering resales of the notes has not been declared effective by the SEC, then the interest rate on the notes eligible for inclusion in such registration statement will be increased by certain specified rates pursuant to the registration rights agreement.
In February 2013, we entered into amendments to our Senior Secured Credit Facility that, among other things: (i) reduced the applicable margins used to calculate interest rates for term loans under our Senior Secured Credit Facility by 1.0%; (ii) reduced the applicable margins used to calculate interest rates for $131.0 million of tranche A revolving credit loans available under the Senior Secured Credit Facility by 1.0% (with no reductions to the applicable margins for the remaining $19.0 million of available revolving credit loans); (iii) increased term loans borrowed under our term loan facility by $25.0 million with the same terms as the existing term loans (bringing total term loan borrowings to approximately $422.0 million); (iv) included a requirement that we pay a fee equal to 1.0% of the principal amount of term loans repaid in connection with certain repricing or refinancing transactions within six months after February 5, 2013; and (v) created additional flexibility under the financial maintenance covenants, which are tested quarterly, by increasing the applicable maximum Consolidated First Lien Net Leverage Ratio and reducing the applicable minimum Interest Coverage Ratio (each as defined in the credit agreement governing our Senior Secured Credit Facility).
21
Cash Flows
The following table summarizes our net cash provided by or used for operating, investing and financing activities and our capital expenditures for the periods indicated (in thousands):
| Year Ended | ||||||||||||
| December 29, 2012 |
December 31, 2011 |
December 31, 2010 |
||||||||||
| Net cash provided by (used for): |
||||||||||||
| Operating activities |
$ | 62,279 | $ | 23,253 | $ | (20,529 | ) | |||||
| Investing activities |
(85,340 | ) | (192,331 | ) | (499,381 | ) | ||||||
| Financing activities |
7,702 | 146,775 | 575,389 | |||||||||
| Cash paid for capital expenditures |
$ | (45,488 | ) | $ | (38,656 | ) | $ | (21,145 | ) | |||
Operating activities
For the year ended 2012, cash provided by operating activities was $62.3 million primarily as a result of:
| • | Non-cash expenses, including $72.2 million of depreciation, depletion, amortization and accretion, which increased in 2012 in connection with our 2011 and 2012 acquisitions, and a $9.5 million loss on our January 2012 debt refinancing; |
| • | Accounts receivable and costs and estimated earnings in excess of billings provided $12.1 million of additional cash from December 31, 2011 to December 29, 2012 due to an increased focus on processing billings and collecting on outstanding receivables in a more timely manner during 2012 as compared to 2011; and |
| • | Accounts payable and accrued expenses provided additional cash from operations, on a net basis, of $11.1 million from December 31, 2011 to December 29, 2012 due primarily to a $16.0 million increase in accrued interest. The interest on our Senior Notes, issued in January 2012, are payable in January and July of each year and the interest on our Senor Secured Credit Facilities is payable on the last business day of each calendar quarter, which resulted in our December 2012 payment being accrued at year-end 2012 and paid in the first quarter of 2013. The increase in accrued interest was partially offset by improvement in our cash management policy with respect to accounts payable. |
For the year ended 2011, cash provided by operating activities was $23.3 million primarily as a result of:
| • | Non-cash expenses, including $65.0 million of depreciation, depletion, amortization and accretion, a $12.1 million bargain purchase gain and $10.3 million gain on the revaluation of contingent consideration; |
| • | Accounts receivable and costs and estimated earnings in excess of billings provided $13.3 million of additional cash from December 31, 2010 to December 31, 2011 due to an increased focus on timely billings and cash collections as compared to the legacy processes of the businesses acquired in 2010; |
| • | Inventory utilizing $12.6 million of cash from December 31, 2010 to December 31, 2011 as we increased our inventory balances to support the growth in business activities (revenue grew 94.7% from 2010 to 2011); and |
| • | Billings in excess of costs and estimated earnings utilizing $8.2 million of cash from December 31, 2010 to December 31, 2011 due to certain contracts that were completed in 2011. |
For the year ended 2010, cash used for operating activities was $20.5 million. The $23.9 million net loss was adjusted for $35.5 million of depreciation, depletion, amortization and accretion and the $10.0 million loss on the 2010 debt refinancings. Operating cash flows in 2010 were reduced by $25.3 million of primarily interest charges incurred with the payment of legacy debt owed by Continental Cement. The interest was paid from the cash used to acquire approximately a 70% interest in Continental Cement.
Investing activities
For the year ended 2012, cash used for investing activities was $85.3 million. We paid $48.8 million for three acquisitions and $45.5 million for capital expenditures. The 2012 acquisitions expanded our presence in certain of our existing markets. Approximately half of our 2012 capital expenditures were to replace or maintain equipment and the remaining portion reflects capital investments in the business, the most significant of which is the development of an underground mine at our cement plant. We spent $5.0 million on the underground mine development in 2012.
For the year ended 2011, cash used for investing activities was $192.3 million. The company paid $161.1 million for eight acquisitions and $38.7 million for capital expenditures. Six of the eight acquisitions were in the West region through which we entered the western Colorado and Austin, Texas markets as well as expanded our presence in Utah and Idaho.
22
For the year ended 2010, cash used for investing activities was $499.4 million. Investing activity was primarily driven by several large acquisitions totaling $482.3 million. In 2010, we established the West region in Utah and Texas and the East region in Kentucky, as well as expanded the Central region’s presence in Kansas and entered Missouri.
Financing activities
For the year ended 2012, cash provided by financing activities was $7.7 million, which is primarily composed of $16.5 million of proceeds from the January 2012 financing transactions, offset by the use of cash for $7.5 million of payments under deferred consideration, and noncompete and contingent consideration arrangements entered into with various acquisitions. In 2012, all acquisitions were funded with cash-on-hand and debt. Accordingly, we had no proceeds from investments from our member in 2012.
For the year ended 2011, cash provided by financing activities was $146.8 million. The $103.6 million capital contributions from our member were used to fund certain acquisitions. The remaining cash provided by financing activities primarily reflects the $47.7 million of proceeds from new debt issuances, which were also used to fund acquisitions, and $4.6 million of payments under deferred consideration and noncompete arrangements entered into with various acquisitions.
For the year ended 2010, cash provided by financing activities was $575.4 million, primarily driven by $338.6 million of capital contributions from our member, and $239.5 million of borrowings used to fund $499.4 million of acquisitions and working capital needs.
Cash paid for capital expenditures
We expended approximately $45.5 million in capital expenditures in 2012 compared to $38.7 million in 2011. A significant portion of the increase in capital expenditures in 2012 relates to development of an underground mine to extract limestone on our Hannibal, Missouri property where our cement plant is located. We spent an additional $4.8 million on the underground mine development in 2012 as compared to 2011.
We estimate that we will incur between $54.0 million and $62.0 million in capital expenditures in 2013, which we expect to fund through cash on hand, cash from operations, outside financing sources and available borrowings under our credit facilities. A significant portion of our anticipated future capital expenditures relates to development of the underground mine referred to above. We expect to spend approximately $12.0 million in total during 2013 and 2014 on this project. We believe this project will eliminate the need to strip away overburden that covers the limestone and ultimately save about $1.50 to $2.00 per ton of limestone costs off our average historical mining cost.
Contractual Obligations
The following table presents, as of December 29, 2012, our obligations and commitments to make future payments under contracts and contingent commitments (in thousands):
| Total | 2013 | 2014-2015 | 2016-2017 | Thereafter | ||||||||||||||||
| Contractual Obligations |
||||||||||||||||||||
| Short term borrowings and long-term debt, including current portion |
$ | 648,000 | $ | 4,000 | $ | 8,000 | $ | 9,000 | $ | 627,000 | ||||||||||
| Capital lease obligations |
6,330 | 360 | 720 | 720 | 4,530 | |||||||||||||||
| Operating lease obligations |
13,391 | 3,614 | 5,193 | 3,095 | 1,489 | |||||||||||||||
| Interest payments(1) |
345,287 | 50,305 | 99,881 | 98,911 | 96,190 | |||||||||||||||
| Acquisition-related liabilities |
46,430 | 9,525 | 13,998 | 9,654 | 13,253 | |||||||||||||||
| Royalty payments |
17,554 | 1,593 | 3,207 | 3,245 | 9,509 | |||||||||||||||
| Defined benefit plans(2) |
27,308 | 2,773 | 5,557 | 5,516 | 13,462 | |||||||||||||||
| Asset retirement obligation payments |
28,191 | 356 | 6,059 | 1,258 | 20,518 | |||||||||||||||
| Other |
708 | 164 | 330 | 214 | — | |||||||||||||||
|
|
|
|
|
|
|
|
|
|
|
|||||||||||
| Total contractual obligations(3) |
$ | 1,133,199 | $ | 72,690 | $ | 142,945 | $ | 131,613 | $ | 785,951 | ||||||||||
|
|
|
|
|
|
|
|
|
|
|
|||||||||||
| (1) | Future interest payments were calculated using the applicable fixed and floating rates charged by our lenders in effect as of December 29, 2012 and may differ from actual results. |
| (2) | Amounts represent estimated future payments to fund our defined benefit plans. |
| (3) | Any future payouts on the redeemable noncontrolling interest are excluded from total contractual obligations as the expected timing of settlement is not estimable. |
23
Commitments and contingencies
In the normal course of business, we have commitments, lawsuits, claims, and contingent liabilities. In the opinion of management, the ultimate disposition of these matters will not have a material adverse effect on our consolidated financial position, results of operations or liquidity.
We are obligated under an indemnification agreement entered into with the sellers of Harper for the sellers’ ownership interests in a joint venture agreement. Summit has the rights to any benefits under the joint venture as well as the assumption of any obligations, but does not own equity interests in the joint venture. The joint venture has incurred significant losses on a highway project in Utah, which have resulted in requests for funding from the joint venture partners and, ultimately, from us. Through December 29, 2012, we have funded $8.8 million, $4.0 million of which was funded in 2012. As of December 29, 2012, an accrual of $4.3 million is recorded in other noncurrent liabilities as our best estimate of future funding obligations.
Off-Balance sheet arrangements
As of December 29, 2012, we had no material off-balance sheet arrangements, such as financing or unconsolidated variable interest entities, that either have or are reasonably likely to have a current or future material effect on our results of operations, financial position, liquidity, capital expenditures or capital resources.
Critical Accounting Policies
We are an “emerging growth company” under the JOBS Act and are eligible to take advantage of certain exemptions from various public company reporting requirements. Section 107 of the JOBS Act provides that an “emerging growth company” may take advantage of the extended transition period provided in Section 7(a)(2)(B) of the Securities Act to comply with new or revised accounting standards. In other words, an “emerging growth company” can delay the adoption of certain accounting standards until those standards would otherwise apply to private companies. As an “emerging growth company,” we may elect to delay adoption of new or revised accounting standards applicable to public companies until such standards are made applicable to private companies. As a result, our financial statements may not be comparable to the financial statements of issuers who are required to comply with the effective dates for new or revised accounting standards that are applicable to public companies. We may take advantage of the extended transition period provided in Section 7(a)(2)(B) of the Securities Act until we (i) are no longer an “emerging growth company” or (ii) affirmatively and irrevocably “opt-out” of the extended transition period provided in Section 7(a)(2)(B) of the Securities Act. Accordingly, until the date we are no longer an “emerging growth company,” or affirmatively and irrevocably “opt-out” of the exemption provided by Section 7(a)(2)(B) of the Securities Act, upon the issuance of a new or revised accounting standard that applies to our financial statements and that has a different effective date for public and private companies, we will disclose the date on which adoption is required for non-emerging growth companies and the date on which we will adopt the recently issued accounting standard.
Additionally, we are in the process of evaluating the benefits of relying on the other reduced reporting requirements provided by the JOBS Act. Subject to certain conditions set forth in the JOBS Act, as an “emerging growth company,” we may choose to rely on certain exemptions. See “Risk Factors—Risks Related to Our Business and Our Industry—As an “emerging growth company” under the JOBS Act, we are permitted to, and intend to, rely on exemptions from certain disclosure requirements.”
Our management’s discussion and analysis of our financial condition and results of operations is based on our consolidated financial statements, which have been prepared in accordance with GAAP. The preparation of these consolidated financial statements requires management to make estimates and assumptions that affect the reported amounts of assets and liabilities, disclosure of contingent assets and liabilities at the date of the consolidated financial statements and the reported amounts of revenue and expenses during the reported period.
On an ongoing basis, management evaluates its estimates, including those related to revenue recognition, allowance for doubtful accounts, inventories, asset retirement obligations, taxes and goodwill. We base our estimates and judgments on historical experience and on various other factors that we believe to be reasonable under the circumstances, the results of which form the basis for making judgments about the carrying values of assets and liabilities that are not readily apparent from other sources. Actual results may differ from these estimates under different assumptions or conditions.
Acquisitions—Purchase price allocation
We regularly review strategic long-term plans, including potential investments in value-added acquisitions of related or similar businesses, which would increase our market share and/or are related to our existing markets. When an acquisition is completed, our consolidated statement of operations includes the operating results of the acquired business starting from the date of acquisition, which is the date that control is obtained. The purchase price is determined based on the fair value of assets given to and liabilities assumed from the seller as of the date of acquisition. We allocate the purchase price to the fair values of the tangible and intangible assets
24
acquired and liabilities assumed as valued at the date of acquisition. Goodwill is recorded for the excess of the purchase price over the net of the fair value of the identifiable assets acquired and liabilities assumed as of the acquisition date. The purchase price allocation is a critical accounting policy because the estimation of fair values of acquired assets and assumed liabilities is judgmental and requires various assumptions. Further, the amounts and useful lives assigned to depreciable and amortizable assets versus amounts assigned to goodwill, which is not amortized, can significantly affect the results of operations in the period of and in periods subsequent to a business combination.
Fair value is the price that would be received to sell an asset or paid to transfer a liability in an orderly transaction, and, therefore, represents an exit price. A fair value measurement assumes the highest and best use of the asset by market participants, considering the use of the asset that is physically possible, legally permissible, and financially feasible at the measurement date. We assign the highest level of fair value available to assets acquired and liabilities assumed based on the following options:
| • | Level 1—Quoted prices in active markets for identical assets and liabilities |
| • | Level 2—Quoted prices for similar assets or liabilities in active markets, quoted prices for identical assets or liabilities in inactive markets, inputs that are observable that are not prices and inputs that are derived from or corroborated by observable markets. |
| • | Level 3—Unobservable inputs, which includes the use of valuation models |
Level 2 fair values are typically used to value acquired machinery, equipment and land and assumed liabilities for asset retirement obligations, environmental remediation and compliance obligations and contingencies.
Level 3 fair values are used to value acquired mineral reserves, mineral interests and separately-identifiable intangible assets.
There is a measurement period after the acquisition date during which we may adjust the amounts recognized for a business combination. Any such adjustments are based on us obtaining additional information that existed at the acquisition date regarding the assets acquired or the liabilities assumed. Measurement period adjustments are generally recorded as increases or decreases to the goodwill recognized in the transaction. Material adjustments are applied retroactively to the date of acquisition and reported retrospectively. The measurement period ends once we have obtained all necessary information that existed as of the acquisition date, but does not extend beyond one year from the date of acquisition. Any adjustments to assets acquired or liabilities assumed beyond the measurement period are recorded in earnings.
We have invested $48.8 million and $161.1 million in business combinations and allocated this amount to assets acquired and liabilities assumed during the years ended December 29, 2012 and December 31, 2011, respectively.
Goodwill and goodwill impairment
Goodwill is tested annually for impairment and in interim periods if certain events occur indicating that the carrying amounts may be impaired. The impairment evaluation involves the use of significant estimates and assumptions and considerable management judgment. Our judgments regarding the existence of impairment indicators and future cash flows are based on operational performance of our businesses, market conditions and other factors. Although there are inherent uncertainties in this assessment process, the estimates and assumptions we use, including estimates of future cash flows, volumes, market penetration and discount rates, are consistent with our internal planning. The estimated future cash flows are derived from internal operating budgets and forecasts for long-term demand and pricing in our industry and markets. If these estimates or their related assumptions change in the future, we may be required to record an impairment charge on all or a portion of our goodwill. Furthermore, we cannot predict the occurrence of future impairment-triggering events nor the affect such events might have on our reported values. Future events could cause us to conclude that impairment indicators exist and that goodwill associated with our acquired businesses are impaired. Any resulting impairment loss could have an adverse effect on our financial position and results of operations.
Under the two-step quantitative impairment test, the evaluation of impairment involves comparing the current fair value of each reporting unit to its carrying value, including goodwill. We use a discounted cash flow (“DCF”) model to estimate the current fair value of our reporting units when testing for impairment, as management believes forecasted cash flows are the best indicator of such fair value. A number of significant assumptions and estimates are involved in the application of the DCF model to forecast operating cash flows, including macroeconomic trends in the public and private construction industry, the timing of work embedded in our backlog, our performance and profitability under our contracts, our success in securing future sales and the appropriate interest rate used to discount the projected cash flows. Most of these assumptions vary significantly among the reporting units. This discounted cash flow analysis is corroborated by “top-down” analyses, including a market assessment of our enterprise value.
We assessed the fair value of our reporting units in relation to their carrying values, which resulted in the estimated fair values of these reporting units being substantially in excess of their carrying values by a range of 26% to 133%. We have recorded no goodwill impairment charges in the current year or in previous years.
25
Impairment of long-lived assets, excluding goodwill
We evaluate the carrying value of long-lived assets, including intangible assets subject to amortization, when events and circumstances indicate that the carrying value may not be recoverable. The impairment evaluation is a critical accounting policy because long-lived assets are material to our total assets (as of December 29, 2012, property, plant and equipment, net represents 63.5% of total assets) and the evaluation involves the use of significant estimates and assumptions and considerable management judgment. Such indicators may include deterioration in general economic conditions, negative developments in equity and credit markets, adverse changes in the markets in which an entity operates, increases in input costs that have a negative effect on earnings and cash flows, or a trend of negative or declining cash flows over multiple periods, among others. A one year increase or decrease in the average useful lives of our property, plant and equipment would have affected depreciation expense by ($5.2) million or $6.1 million, respectively, in 2012. An impairment charge could be material to our financial condition and results of operations. The carrying value of long-lived assets is considered impaired when the estimated undiscounted cash flows from such assets are less than their carrying value. In that event, we recognize a loss equal to the amount by which the carrying value exceeds the fair value of the long-lived assets.
Fair value is determined by primarily using an undiscounted cash flow methodology that requires considerable management judgment and long-term assumptions. Our estimate of net future cash flows is based on historical experience and assumptions of future trends, which may be different from actual results. There were no material long-lived asset impairments during the years ended December 29, 2012 or December 31, 2011, nor were there any changes to the useful lives of assets having a material effect on our results of operations or financial position.
Revenue recognition
We account for revenue and earnings on our long-term construction contracts as service revenue using the percentage-of-completion method of accounting. Under the percentage-of-completion method, we recognize contract revenue as services are rendered. We estimate profit as the difference between total estimated revenue and total estimated cost of a contract and recognize that profit over the remaining life of the contract based on input measures (e.g., costs incurred). We generally measure progress toward completion on long-term construction contracts based on the proportion of costs incurred to date relative to total estimated costs at completion. We include revisions of estimated profits on contracts in earnings under the cumulative catch-up method, under which the effect of revisions in estimates is recognized immediately. If a revised estimate of contract profitability reveals an anticipated loss on the contract, we recognize the loss in the period it is identified.
The percentage-of-completion method of accounting involves the use of various estimating techniques to project costs at completion, and in some cases includes estimates of recoveries asserted against the customer for changes in specifications or other disputes. Contract estimates involve various assumptions and projections relative to the outcome of future events over a period of multiple years, including future labor productivity and availability, the nature and complexity of the work to be performed, the cost and availability of materials, the effect of delayed performance, and the availability and timing of funding from the customer. These estimates are based on our best judgment. A significant change in one or more of these estimates could affect the profitability of one or more of our contracts. We review our contract estimates regularly to assess revisions in contract values and estimated costs at completion. No material contract adjustments were recognized in 2012 or 2011.
We recognize revenue arising from claims either as income or as an offset against a potential loss only when the amount of the claim can be estimated reliably and its realization is probable. In evaluating these criteria, we consider the contractual/legal basis for the claim, the cause of any additional costs incurred, the reasonableness of those costs and the objective evidence available to support the claim.
Revenue for product sales is recognized when evidence of an arrangement exists, the fee is fixed or determinable, title passes, which generally is when the product is shipped, and collection is reasonably assured. Revenue from the receipt of waste fuels are based on fees charged for waste transfer and disposal and is recognized upon acceptance of the waste. Product revenue generally includes sales of aggregates, cement and other materials to customers, net of discounts or allowances, if any, and generally include freight and delivery charges billed to customers. Freight and delivery charges associated with cement sales are recorded on a net basis.
Mining reclamation obligations
We incur reclamation obligations as part of our mining activities. Our quarry activities require the removal and relocation of significant levels of overburden to access stone of usable quantity and quality. The same overburden material is used to reclaim depleted mine areas, which must be sloped to a certain gradient and seeded to prevent erosion in the future. Reclamation methods and requirements can differ depending on the quarry and state rules and regulations in existence for certain locations. This differentiation affects the potential obligation required at each individual subsidiary. As of December 29, 2012, our undiscounted reclamation obligations totaled $17.7 million, of which 18.2% is expected to be settled within the next five years and the remaining 81.8% thereafter.
26
Reclamation costs resulting from the normal use of long-lived assets, either owned or leased, are recognized over the period the asset is in use only if there is a legal obligation to incur these costs upon retirement of the assets. The obligation, which cannot be reduced by estimated offsetting cash flows, is recorded at fair value as a liability at the obligating event date and is accreted through charges to operating expenses. The fair value is based on our estimate for a third party to perform the legally required reclamation tasks including a reasonable profit margin. This fair value is also capitalized as part of the carrying amount of the underlying asset and depreciated over the estimated useful life of the asset.
The mining reclamation reserve is based on management’s estimate of future cost requirements to reclaim property at both currently operating and closed quarry sites. Costs are estimated in current dollars and inflated until the expected time of payment using a future estimated inflation rate and then discounted back to present value using a credit-adjusted, risk-free rate on obligations of similar maturity adjusted to reflect the Company’s credit rating. We review reclamation obligations at least every three years for a revision to the cost or a change in the estimated settlement date. Additionally, reclamation obligations are reviewed in the period that a triggering event occurs that would result in either a revision to the cost or a change in the estimated settlement date. Examples of events that would trigger a change in the cost include a new reclamation law or amendment to an existing mineral lease. Examples of events that would cause a change in the estimated settlement date include the acquisition of additional reserves or the closure of a facility. Any affect to earnings from cost revisions is included in cost of revenue.
New Accounting Standards
For a discussion of accounting standards recently adopted and the effect such accounting changes will have on our results of operations, financial position or liquidity, see note 1 to our audited consolidated financial statements included elsewhere in this Report.
Quantitative and Qualitative Disclosures About Market Risk
We are exposed to certain market risks arising from transactions that are entered into in the normal course of business. Our operations are highly dependent upon the interest rate-sensitive construction industry as well as the general economic environment. Consequently, these marketplaces could experience lower levels of economic activity in an environment of rising interest rates or escalating costs. Management has considered the current economic environment and its potential effect to our business. Demand for aggregates products, particularly in the nonresidential and residential construction markets, could decline if companies and consumers are unable to obtain financing for construction projects or if the economic recession causes delays or cancellations to capital projects. Additionally, declining tax revenue and state budget deficits have negatively affected states’ abilities to finance infrastructure construction projects.
Pension expense
Our subsidiary, Continental Cement, sponsors two non-contributory defined benefit pension plans for hourly and salaried employees, as well as healthcare and life insurance benefits for certain eligible retired employees. As of January 1, 2012, the pension and postretirement plans have been frozen to new entrants. Our results of operations are affected by our net periodic benefit cost from these plans, which totaled $0.3 million in the three month period ended March 30, 2013. Assumptions that affect this expense include the discount rate and, for the pension plans only, the expected long-term rate of return on assets. Therefore, we have interest rate risk associated with these factors. A one percentage-point increase or decrease in assumed health care cost trend rates would have affected estimated accumulated postretirement benefit obligation by $1.6 million or ($1.3) million, respectively, at December 29, 2012.
Commodity and energy price risk
We are subject to commodity price risk with respect to price changes in liquid asphalt and energy, including fossil fuels and electricity for aggregates, cement, asphalt paving mix and ready-mixed concrete production, natural gas for hot mix asphalt production and diesel fuel for distribution vehicles and production related mobile equipment. Liquid asphalt escalators in most of our public contracts, other than those in Texas, limit our exposure to price fluctuations in this commodity and we seek to obtain escalators on private and commercial contracts.
Inflation risk
Overall inflation rates in recent years have not been a significant factor in our revenue or earnings due to our ability to recover increasing costs by obtaining higher prices for our products through sale price escalators in place for most public sector contracts. Inflation risk varies with the level of activity in the construction industry, the number, size and strength of competitors and the availability of products to supply a local market.
27
Variable-Rate Borrowing Facilities
We have $150.0 million revolving credit commitments under the Senior Secured Credit Facility, which bear interest at a variable rate. In February 2013, we entered into amendments to our Senior Secured Credit Facility that, among other things reduced the applicable margins used to calculate interest rates for term loans under our Credit Facility by 1.0% and reduced the applicable margins used to calculate interest rates for $131.0 million of $150.0 million Tranche A revolving credit loans available under the Senior Secured Credit Facility by 1.0%. Had this reduction been in place throughout 2012, our interest expense would have been reduced by $4.4 million.
28
Report of Independent Registered Public Accounting Firm
The Board of Directors
Summit Materials, LLC:
We have audited the accompanying consolidated balance sheet of Summit Materials, LLC and subsidiaries as of December 29, 2012, and the related consolidated statements of operations, comprehensive (loss) income, cash flows and changes in redeemable noncontrolling interest and member’s interest for the year then ended. The consolidated financial statements are the responsibility of the Company’s management. Our responsibility is to express an opinion on the consolidated financial statements based on our audit.
We conducted our audit in accordance with the standards of the Public Company Accounting Oversight Board (United States). Those standards require that we plan and perform the audit to obtain reasonable assurance about whether the financial statements are free of material misstatement. An audit includes examining, on a test basis, evidence supporting the amounts and disclosures in the financial statements. An audit also includes assessing the accounting principles used and significant estimates made by management, as well as evaluating the overall financial statement presentation. We believe that our audit provides a reasonable basis for our opinion.
In our opinion, the consolidated financial statements referred to above present fairly, in all material respects, the financial position of Summit Materials, LLC and subsidiaries as of December 29, 2012, and the results of their operations and their cash flows for the year then ended in conformity with U.S. generally accepted accounting principles.
/s/ KPMG LLP
McLean, Virginia
March 27, 2013, except as to
Notes 3, 20, 21, and 22 which are as of December 11, 2013
29
REPORT OF INDEPENDENT REGISTERED PUBLIC ACCOUNTING FIRM
To the Board of Directors and Member of
Summit Materials, LLC and Subsidiaries
Washington, D.C.
We have audited the accompanying consolidated balance sheet of Summit Materials, LLC and Subsidiaries (the “Company”) as of December 31, 2011, and the related consolidated statements of operations, comprehensive (loss) income, changes in redeemable noncontrolling interest and member’s interest, and cash flows for each of the years ended December 31, 2011 and 2010. These financial statements are the responsibility of the Company’s management. Our responsibility is to express an opinion on these financial statements based on our audits.
We conducted our audits in accordance with the standards of the Public Company Accounting Oversight Board (United States). Those standards require that we plan and perform the audit to obtain reasonable assurance about whether the financial statements are free of material misstatement. The Company is not required to have, nor were we engaged to perform, an audit of its internal control over financial reporting. Our audits included consideration of internal control over financial reporting as a basis for designing audit procedures that are appropriate in the circumstances, but not for the purpose of expressing an opinion on the effectiveness of the Company’s internal control over financial reporting. Accordingly, we express no such opinion. An audit also includes examining, on a test basis, evidence supporting the amounts and disclosures in the financial statements, assessing the accounting principles used and significant estimates made by management, as well as evaluating the overall financial statement presentation. We believe that our audits provide a reasonable basis for our opinion.
In our opinion, such consolidated financial statements present fairly, in all material respects, the financial position of Summit Materials, LLC and Subsidiaries as of December 31, 2011, and the results of their operations and their cash flows for each of the years ended December 31, 2011 and 2010, in conformity with accounting principles generally accepted in the United States of America.
As discussed in Note 3 to the consolidated financial statements, the accompanying 2011 and 2010 consolidated financial statements have been retrospectively adjusted for discontinued operations.
/s/ DELOITTE & TOUCHE LLP
McLean, Virginia
May 1, 2012 (December 11, 2013 as to Note 3)
30
SUMMIT MATERIALS, LLC AND SUBSIDIARIES
Consolidated Balance Sheets
December 29, 2012 and December 31, 2011
(In thousands)
| 2012 | 2011 | |||||||
| Assets | ||||||||
| Current assets: |
||||||||
| Cash |
$ | 27,431 | $ | 42,790 | ||||
| Accounts receivable, net |
100,298 | 105,233 | ||||||
| Costs and estimated earnings in excess of billings |
11,575 | 18,506 | ||||||
| Inventories |
92,977 | 84,263 | ||||||
| Other current assets |
10,068 | 12,382 | ||||||
|
|
|
|
|
|||||
| Total current assets |
242,349 | 263,174 | ||||||
| Property, plant and equipment, net |
813,607 | 821,903 | ||||||
| Investments in affiliates |
12,989 | 13,123 | ||||||
| Goodwill |
179,120 | 153,375 | ||||||
| Intangible assets, net |
8,606 | 9,179 | ||||||
| Other assets |
24,542 | 23,511 | ||||||
|
|
|
|
|
|||||
| Total assets |
$ | 1,281,213 | $ | 1,284,265 | ||||
|
|
|
|
|
|||||
| Liabilities, Redeemable Noncontrolling Interest and Member’s Interest |
||||||||
| Current liabilities: |
||||||||
| Current portion of long-term debt |
$ | 4,000 | $ | 7,960 | ||||
| Current portion of acquisition-related liabilities |
9,525 | 8,465 | ||||||
| Accounts payable |
61,634 | 69,643 | ||||||
| Accrued expenses |
49,822 | 33,995 | ||||||
| Billings in excess of costs and estimated earnings |
6,926 | 4,336 | ||||||
|
|
|
|
|
|||||
| Total current liabilities |
131,907 | 124,399 | ||||||
| Long-term debt |
635,843 | 601,021 | ||||||
| Acquisition-related liabilities |
23,919 | 20,238 | ||||||
| Other noncurrent liabilities |
84,266 | 80,935 | ||||||
|
|
|
|
|
|||||
| Total liabilities |
875,935 | 826,593 | ||||||
|
|
|
|
|
|||||
| Commitments and contingencies (see note 13) |
||||||||
| Redeemable noncontrolling interest |
22,850 | 21,300 | ||||||
| Member’s interest: |
||||||||
| Member’s equity |
484,584 | 482,707 | ||||||
| Accumulated deficit |
(94,085 | ) | (40,932 | ) | ||||
| Accumulated other comprehensive loss |
(9,130 | ) | (6,577 | ) | ||||
|
|
|
|
|
|||||
| Member’s interest |
381,369 | 435,198 | ||||||
| Noncontrolling interest |
1,059 | 1,174 | ||||||
|
|
|
|
|
|||||
| Total member’s interest |
382,428 | 436,372 | ||||||
|
|
|
|
|
|||||
| Total liabilities, redeemable noncontrolling interest and member’s interest |
$ | 1,281,213 | $ | 1,284,265 | ||||
|
|
|
|
|
|||||
See accompanying notes to consolidated financial statements.
31
SUMMIT MATERIALS, LLC AND SUBSIDIARIES
Consolidated Statements of Operations
Years ended December 29, 2012, December 31, 2011 and December 31, 2010
(In thousands)
| 2012 | 2011 | 2010 | ||||||||||
| Revenue: |
||||||||||||
| Product |
$ | 588,762 | $ | 427,419 | $ | 240,120 | ||||||
| Service |
337,492 | 361,657 | 165,177 | |||||||||
|
|
|
|
|
|
|
|||||||
| Total revenue |
926,254 | 789,076 | 405,297 | |||||||||
|
|
|
|
|
|
|
|||||||
| Cost of revenue (excluding items shown separately below): |
||||||||||||
| Product |
444,569 | 317,360 | 181,901 | |||||||||
| Service |
268,777 | 280,294 | 102,435 | |||||||||
|
|
|
|
|
|
|
|||||||
| Total cost of revenue |
713,346 | 597,654 | 284,336 | |||||||||
|
|
|
|
|
|
|
|||||||
| General and administrative expenses |
127,215 | 95,826 | 48,557 | |||||||||
| Depreciation, depletion, amortization and accretion |
68,290 | 61,377 | 33,870 | |||||||||
| Transaction costs |
1,988 | 9,120 | 22,268 | |||||||||
|
|
|
|
|
|
|
|||||||
| Operating income |
15,415 | 25,099 | 16,266 | |||||||||
| Other (income) expense, net |
(1,182 | ) | (21,244 | ) | 1,583 | |||||||
| Loss on debt financings |
9,469 | — | 9,975 | |||||||||
| Interest expense |
58,079 | 47,784 | 25,430 | |||||||||
|
|
|
|
|
|
|
|||||||
| Loss from continuing operations before taxes |
(50,951 | ) | (1,441 | ) | (20,722 | ) | ||||||
| Income tax (benefit) expense |
(3,920 | ) | 3,408 | 2,363 | ||||||||
|
|
|
|
|
|
|
|||||||
| Loss from continuing operations |
(47,031 | ) | (4,849 | ) | (23,085 | ) | ||||||
| Loss from discontinued operations |
3,546 | 5,201 | 778 | |||||||||
|
|
|
|
|
|
|
|||||||
| Net loss |
(50,577 | ) | (10,050 | ) | (23,863 | ) | ||||||
| Net income attributable to noncontrolling interest |
1,919 | 695 | 86 | |||||||||
|
|
|
|
|
|
|
|||||||
| Net loss attributable to member of Summit Materials, LLC |
$ | (52,496 | ) | $ | (10,745 | ) | $ | (23,949 | ) | |||
|
|
|
|
|
|
|
|||||||
See accompanying notes to consolidated financial statements.
32
SUMMIT MATERIALS, LLC AND SUBSIDIARIES
Consolidated Statements of Comprehensive (Loss) Income
Years ended December 29, 2012, December 31, 2011 and December 31, 2010
(In thousands)
| 2012 | 2011 | 2010 | ||||||||||
| Net loss |
$ | (50,577 | ) | $ | (10,050 | ) | $ | (23,863 | ) | |||
| Other comprehensive loss: |
||||||||||||
| Pension and postretirement adjustment |
(3,648 | ) | (5,675 | ) | (2,708 | ) | ||||||
|
|
|
|
|
|
|
|||||||
| Comprehensive loss |
(54,225 | ) | (15,725 | ) | (26,571 | ) | ||||||
| Less comprehensive income (loss) attributable to the noncontrolling interest |
824 | (675 | ) | (350 | ) | |||||||
|
|
|
|
|
|
|
|||||||
| Comprehensive loss attributable to member of Summit Materials, LLC |
$ | (55,049 | ) | $ | (15,050 | ) | $ | (26,221 | ) | |||
|
|
|
|
|
|
|
|||||||
See accompanying notes to consolidated financial statements.
33
SUMMIT MATERIALS, LLC AND SUBSIDIARIES
Consolidated Statements of Cash Flows
Years ended December 29, 2012, December 31, 2011 and December 31, 2010
(In thousands)
| 2012 | 2011 | 2010 | ||||||||||
| Cash flow from operating activities: |
||||||||||||
| Net loss |
$ | (50,577 | ) | $ | (10,050 | ) | $ | (23,863 | ) | |||
| Adjustments to reconcile net loss to net cash provided by (used in) operating activities: |
||||||||||||
| Depreciation, depletion, amortization and accretion |
72,179 | 64,983 | 35,456 | |||||||||
| Share-based compensation expense |
2,533 | 2,484 | 1,169 | |||||||||
| Financing fee amortization |
3,266 | 2,335 | 2,067 | |||||||||
| Deferred income tax benefit |
(3,468 | ) | (1,974 | ) | (2,022 | ) | ||||||
| Loss on sale of property, plant and equipment |
2,564 | 2,349 | 242 | |||||||||
| Bargain purchase gain |
— | (12,133 | ) | — | ||||||||
| Revaluation of asset retirement obligations |
— | (3,420 | ) | — | ||||||||
| Revaluation of contingent consideration |
(409 | ) | (10,344 | ) | — | |||||||
| Loss on debt refinancing |
9,469 | — | 9,975 | |||||||||
| Other |
(465 | ) | 894 | 656 | ||||||||
| Decrease (increase) in operating assets, net of acquisitions: |
||||||||||||
| Accounts receivable |
5,201 | 13,901 | 12,242 | |||||||||
| Costs and estimated earnings in excess of billings |
6,931 | (613 | ) | (5,088 | ) | |||||||
| Inventories |
(1,726 | ) | (12,643 | ) | 184 | |||||||
| Other current assets |
3,494 | (4,823 | ) | (245 | ) | |||||||
| Other assets |
1,189 | (1,016 | ) | 3,164 | ||||||||
| (Decrease) increase in operating liabilities, net of acquisitions: |
||||||||||||
| Accounts payable |
(6,076 | ) | 6,612 | (14,128 | ) | |||||||
| Accrued expenses |
17,175 | (6,455 | ) | (28,547 | ) | |||||||
| Billings in excess of costs and estimated earnings |
2,589 | (8,209 | ) | (4,828 | ) | |||||||
| Other liabilities |
(1,590 | ) | 1,375 | (6,963 | ) | |||||||
|
|
|
|
|
|
|
|||||||
| Net cash provided by (used in) operating activities |
62,279 | 23,253 | (20,529 | ) | ||||||||
|
|
|
|
|
|
|
|||||||
| Cash flow from investing activities: |
||||||||||||
| Acquisitions, net of cash acquired |
(48,757 | ) | (161,073 | ) | (482,333 | ) | ||||||
| Purchases of property, plant and equipment |
(45,488 | ) | (38,656 | ) | (21,145 | ) | ||||||
| Proceeds from the sale of property, plant and equipment |
8,836 | 7,157 | 4,700 | |||||||||
| Other |
69 | 241 | (603 | ) | ||||||||
|
|
|
|
|
|
|
|||||||
| Net cash used for investing activities |
(85,340 | ) | (192,331 | ) | (499,381 | ) | ||||||
|
|
|
|
|
|
|
|||||||
| Cash flow from financing activities: |
||||||||||||
| Proceeds from investment by member |
— | 103,630 | 338,639 | |||||||||
| Net proceeds from debt issuance |
713,361 | 96,748 | 485,373 | |||||||||
| Payments on long-term debt |
(697,438 | ) | (49,000 | ) | (245,855 | ) | ||||||
| Payments on acquisition-related liabilities |
(7,519 | ) | (4,593 | ) | (2,721 | ) | ||||||
| Other |
(702 | ) | (10 | ) | (47 | ) | ||||||
|
|
|
|
|
|
|
|||||||
| Net cash provided by financing activities |
7,702 | 146,775 | 575,389 | |||||||||
|
|
|
|
|
|
|
|||||||
| Net (decrease) increase in cash |
(15,359 | ) | (22,303 | ) | 55,479 | |||||||
| Cash — beginning of period |
42,790 | 65,093 | 9,614 | |||||||||
|
|
|
|
|
|
|
|||||||
| Cash — end of period |
$ | 27,431 | $ | 42,790 | $ | 65,093 | ||||||
|
|
|
|
|
|
|
|||||||
See accompanying notes to consolidated financial statements.
34
SUMMIT MATERIALS, LLC AND SUBSIDIARIES
Consolidated Statements of Changes in Redeemable Noncontrolling Interest and Member’s Interest
Years ended December 29, 2012, December 31, 2011 and December 31, 2010
(In thousands)
| Total member’s interest | ||||||||||||||||||||||||
| Member’s equity |
Retained earnings/ accumulated deficit |
Accumulated other comprehensive income (loss) (AOCI) |
Noncontrolling interest |
Total member’s interest |
Redeemable noncontrolling interest |
|||||||||||||||||||
| Balance — December 31, 2009 |
$ | 36,785 | $ | (5,256 | ) | $ | — | $ | — | $ | 31,529 | $ | — | |||||||||||
| Contributed capital |
338,639 | — | — | 1,274 | 339,913 | 21,300 | ||||||||||||||||||
| Accretion / redemption value adjustment |
— | (350 | ) | — | — | (350 | ) | 350 | ||||||||||||||||
| Net (loss) income |
— | (23,949 | ) | — | — | (23,949 | ) | 86 | ||||||||||||||||
| Other comprehensive loss |
— | — | (2,272 | ) | — | (2,272 | ) | (436 | ) | |||||||||||||||
| Share-based compensation |
1,169 | — | — | — | 1,169 | — | ||||||||||||||||||
| Payment of dividends |
— | — | — | (47 | ) | (47 | ) | — | ||||||||||||||||
|
|
|
|
|
|
|
|
|
|
|
|
|
|||||||||||||
| Balance — December 31, 2010 |
376,593 | (29,555 | ) | (2,272 | ) | 1,227 | 345,993 | 21,300 | ||||||||||||||||
| Contributed capital |
103,630 | — | — | — | 103,630 | — | ||||||||||||||||||
| Accretion / redemption value adjustment |
— | (632 | ) | — | — | (632 | ) | 632 | ||||||||||||||||
| Net (loss) income |
— | (10,745 | ) | — | (43 | ) | (10,788 | ) | 738 | |||||||||||||||
| Other comprehensive loss |
— | — | (4,305 | ) | — | (4,305 | ) | (1,370 | ) | |||||||||||||||
| Share-based compensation |
2,484 | — | — | — | 2,484 | — | ||||||||||||||||||
| Payment of dividends |
— | — | — | (10 | ) | (10 | ) | — | ||||||||||||||||
|
|
|
|
|
|
|
|
|
|
|
|
|
|||||||||||||
| Balance — December 31, 2011 |
482,707 | (40,932 | ) | (6,577 | ) | 1,174 | 436,372 | 21,300 | ||||||||||||||||
| Accretion / redemption value adjustment |
— | (657 | ) | — | — | (657 | ) | 657 | ||||||||||||||||
| Net (loss) income |
— | (52,496 | ) | — | (69 | ) | (52,565 | ) | 1,988 | |||||||||||||||
| Other comprehensive loss |
— | — | (2,553 | ) | — | (2,553 | ) | (1,095 | ) | |||||||||||||||
| Repurchase of member’s interest |
(656 | ) | — | — | — | (656 | ) | — | ||||||||||||||||
| Share-based compensation |
2,533 | — | — | — | 2,533 | — | ||||||||||||||||||
| Payment of dividends |
— | — | — | (46 | ) | (46 | ) | — | ||||||||||||||||
|
|
|
|
|
|
|
|
|
|
|
|
|
|||||||||||||
| Balance — December 29, 2012 |
$ | 484,584 | $ | (94,085 | ) | $ | (9,130 | ) | $ | 1,059 | $ | 382,428 | $ | 22,850 | ||||||||||
|
|
|
|
|
|
|
|
|
|
|
|
|
|||||||||||||
See accompanying notes to consolidated financial statements.
35
SUMMIT MATERIALS, LLC AND SUBSIDIARIES
Notes to Consolidated Financial Statements
December 29, 2012 and December 31, 2011
| (1) | Summary of Organization and Significant Accounting Policies |
Summit Materials, LLC (“Summit” or the “Company”) is a wholly owned subsidiary of Summit Materials Holdings L.P. (“Parent”) whose major indirect owners are certain investment funds affiliated with Blackstone Capital Partners V L.P. (“BCP”). Summit has a number of subsidiaries including Summit Materials Holdings I, LLC (“Summit I”) and Summit Materials Holdings II, LLC (“Summit II”), which have individually made a number of acquisitions through 2012. The Company is organized by geographic region and has three operating segments, which are also its reporting segments: the Central; West; and East regions.
Noncontrolling interests represent a 30% redeemable ownership in Continental Cement Company, L.L.C. (“Continental Cement”) and a 20% ownership of Ohio Valley Asphalt, LLC (“OVA”).
The Company’s fiscal year-end in 2010 was December 31. In 2011, the Company changed its fiscal year to be 52 weeks with each quarter composed of 13 weeks ending on a Saturday. The Company’s year-end in 2012 and 2011 fell on December 29 and December 31, respectively.
Company’s Activities — Summit is a vertically-integrated, heavy building materials company. Across its subsidiaries, it is engaged in the manufacturing and sale of aggregates, cement, hot-mix asphalt and ready-mixed concrete. It is also engaged in road paving and related construction services. Summit owns and operates quarries, sand and gravel pits, a cement plant, cement distribution terminals, asphalt plants, ready–mixed concrete plants and landfill sites. The operations of Summit are conducted primarily across 14 states, with the most significant revenues generated in Texas, Kansas, Kentucky, Missouri and Utah.
Principles of Consolidation — The consolidated financial statements include the accounts of the Company and its majority owned subsidiaries. All intercompany balances and transactions have been eliminated. The Company attributes member’s interests and net income separately to the controlling and noncontrolling interest, whereby consolidated member’s interests and net income are separately attributable to the controlling interest and to the noncontrolling interest. The Company accounts for investments in entities for which it has an ownership of 20% to 50% using the equity method of accounting.
Use of Estimates — The consolidated financial statements of the Company have been prepared in conformity with U.S. generally accepted accounting principles (“GAAP”), which require management to make estimates and assumptions that affect the reported amounts and disclosures in the consolidated financial statements. These estimates and the underlying assumptions affect the amounts of assets and liabilities reported, disclosures about contingent assets and liabilities and reported amounts of revenues and expenses. Such estimates include the valuation of accounts receivable, inventories, goodwill, intangible and other long-lived assets, pension and other postretirement obligations, asset retirement obligations and the redeemable noncontrolling interest. Estimates also include revenue earned and costs to complete open contracts. Management evaluates its estimates and assumptions on an ongoing basis using historical experience and other factors, including the current economic environment. Management adjusts such estimates and assumptions when circumstances dictate. As future events and their effects cannot be determined with precision, actual results could differ significantly from estimates made. Changes in estimates, including those resulting from continuing changes in the economic environment, will be reflected in the Company’s consolidated financial statements in the period in which the change in estimate occurs.
Business and Credit Concentrations — The majority of Summit’s customers are located in Texas, Kansas, Kentucky, Missouri and Utah. Summit’s accounts receivable consist primarily of amounts due from customers within these areas. Collection of these accounts is, therefore, dependent on the economic conditions in the aforementioned states. However, credit granted within Summit’s trade areas has been granted to a wide variety of customers. No single customer accounted for more than 10% of revenue in 2012, 2011 or 2010. Management does not believe that any significant concentrations of credit exist with respect to individual customers or groups of customers.
Cash — The Company considers all highly liquid investments with a maturity of three months or less when purchased to be cash equivalents. As of December 29, 2012 and December 31, 2011, the Company had no cash equivalents.
Accounts Receivable — Accounts receivable are stated at the amount management expects to collect from outstanding balances. Management provides for probable uncollectible amounts through a charge to earnings and a credit to a valuation allowance based on its assessment of the collectability of individual accounts. In establishing the allowance, management considers historical losses adjusted to take into account current market conditions and its customers’ financial condition, the amount of receivables in dispute, the current receivables aging and current payment terms. Balances that remain outstanding after reasonable collection efforts are exercised are written off through a charge to the valuation allowance.
36
The balances billed but not paid by customers, pursuant to retainage provisions included in contracts, will be due upon completion of the contracts.
Revenue and Cost Recognition — Revenues for product sales are recognized when evidence of an arrangement exists, the fee is fixed or determinable, title passes, which is generally when the product is shipped, and collection is reasonably assured. Product revenues include sales of aggregates, cement and other materials to customers, net of discounts, allowances or taxes, if any. Internal product sales are eliminated from service revenue in the consolidated statements of operations.
Revenues from construction contracts are included in service revenue in the consolidated statements of operations and are recognized under the percentage-of-completion accounting method. The percent complete is measured by the cost incurred to date compared to the estimated total cost of each project. This method is used as management considers expended cost to be the best available measure of progress on these contracts, the majority of which are completed within one year, but may occasionally extend beyond one year. Inherent uncertainties in estimating costs make it at least reasonably possible that the estimates used will change within the near term and over the life of the contracts.
Contract costs include all direct material and labor costs and those indirect costs related to contract performance and completion. Provisions for estimated losses on uncompleted contracts are made in the period in which such losses are determined. General and administrative costs are charged to expense as incurred.
Changes in job performance, job conditions and estimated profitability, including those arising from contract penalty provisions and final contract settlements, may result in revisions to costs and income. Such revisions are recognized in the period in which they are determined. An amount equal to contract costs incurred that are attributable to claims is included in revenue when realization is probable and the amount can be reliably estimated.
Costs and estimated earnings in excess of billings are composed principally of revenue recognized on contracts (on the percentage-of-completion method) for which billings had not been presented to customers because the amount were not billable under the contract terms at the balance sheet date. In accordance with the contract terms, the unbilled receivables at December 29, 2012 will be billed in 2013. Amounts are billed based on contractual terms. Billings in excess of costs and estimated earnings represent billings in excess of revenues recognized.
Revenues from the receipt of waste are based on fees charged for waste transfer and disposal upon acceptance of the waste.
Inventories — Inventories consist of stone removed from quarries and processed for future sale, raw materials and finished concrete blocks. Inventories are valued at the lower of cost or market and are accounted for on a first-in first-out basis or an average cost basis. If items become obsolete or otherwise unusable, they will be charged to costs of production in the period that determination is made by management. Stripping costs are costs of removing overburden and waste material to access aggregate materials. Stripping costs incurred during the production process are considered costs of extraction and are capitalized and recognized in cost of revenue in the same period as the revenue from the sale of the inventory.
Property, Plant and Equipment, net — Property, plant and equipment are recorded at cost, less accumulated depreciation, depletion and amortization. Expenditures for additions and improvements that significantly add to the productive capacity or extend the useful life of an asset are capitalized. Repair and maintenance costs that do not substantially add to the productive capacity or extend the useful life of the asset are expensed as incurred.
Landfill airspace is included in property, plant and equipment at cost and is amortized based on utilization of the asset. Management reassesses the landfill airspace capacity with any changes in value recorded in cost of revenue. Capitalized landfill costs include expenditures for the acquisition of land and related airspace, engineering and permitting costs, cell construction costs and direct site improvement costs.
Upon disposal, the cost and related accumulated depreciation are removed from the Company’s accounts and any gain or loss is included in general and administrative expenses.
Depreciation on property, plant and equipment, including capital lease assets, is computed on a straight-line basis or based on the economic usage over the estimated useful life of the asset. The estimated useful lives are generally as follows:
| Buildings and improvements |
7–40 years | |||
| Plant, machinery and equipment |
3–40 years | |||
| Truck and auto fleet |
3–10 years | |||
| Mobile equipment and barges |
3–20 years | |||
| Landfill airspace and improvements |
5–60 years |
37
Depletion of mineral reserves is calculated for proven and probable reserves by the units of production method on a quarry-by-quarry basis. Leasehold improvements are amortized on a straight-line basis over the lesser of the asset’s useful life or the remaining lease term.
The Company reviews the carrying value of property, plant and equipment for impairment whenever events or circumstances indicate that the carrying value of an asset may not be recoverable from the estimated future cash flows expected to result from its use and eventual disposition. Such indicators may include, among others, deterioration in general economic conditions, negative developments in equity and credit markets, adverse changes in the markets in which an entity operates, increases in input costs that have a negative effect on earnings and cash flows or a trend of negative or declining cash flows over multiple periods. In 2012, impairment charges of $1.6 million were recognized in general and administrative expenses. No material impairment charges were recognized in 2011 or 2010.
Accrued Mining and Landfill Reclamation — The mining reclamation reserve and financial commitments for landfill closure and post-closure activities are based on management’s estimate of future cost requirements to reclaim property at both currently operating and closed sites. Estimates of these obligations have been developed based on management’s interpretation of current requirements and proposed regulatory changes and are intended to approximate fair value. Costs are estimated in current dollars, inflated until the expected time of payment, using an inflation rate of 2.5%, and then discounted back to present value using a credit-adjusted, risk-free rate on obligations of similar maturity, adjusted to reflect the Company’s credit rating. Changes in the credit-adjusted, risk-free rate do not change recorded liabilities, but subsequently recognized obligations are measured using the revised credit-adjusted, risk-free rate.
Significant changes in inflation rates or the amount or timing of future cost estimates typically result in both (1) a current adjustment to the recorded liability (and corresponding adjustment to the asset) and (2) a change in liability and asset amounts to be recorded prospectively over the remaining capacity of the landfill or unmined quarry. Any changes related to the capitalized and future cost of the related assets are recognized in accordance with Summit’s amortization policy, which would generally result in amortization expense being recognized prospectively over the remaining life of the asset.
Intangible Assets — The Company’s intangible assets are composed of quarry lease agreements and trade names. The assets related to quarry lease agreements are a result of the submarket royalty rates paid under agreements for extracting aggregate. The values were determined as of the respective acquisition dates by a comparison of market-royalty rates to contract-royalty rates. The intangible assets are amortized on a straight-line basis over the lives of the leases. Continental Cement’s trade name composes the majority of the remaining intangible assets. The following table shows intangible assets by type and in total (in thousands):
| December 29, 2012 | December 31, 2011 | |||||||||||||||||||||||
| Gross Carrying Amount |
Accumulated Amortization |
Net Carrying Amount |
Gross Carrying Amount |
Accumulated Amortization |
Net Carrying Amount |
|||||||||||||||||||
| Quarry leases |
$ | 8,940 | $ | (1,092 | ) | $ | 7,848 | $ | 8,940 | $ | (623 | ) | $ | 8,317 | ||||||||||
| Trade names |
1,020 | (262 | ) | 758 | 1,020 | (158 | ) | 862 | ||||||||||||||||
|
|
|
|
|
|
|
|
|
|
|
|
|
|||||||||||||
| Total intangible assets |
$ | 9,960 | $ | (1,354 | ) | $ | 8,606 | $ | 9,960 | $ | (781 | ) | $ | 9,179 | ||||||||||
|
|
|
|
|
|
|
|
|
|
|
|
|
|||||||||||||
The weighted average useful life of the quarry intangible assets is 19.8 years and 10.0 years for the Continental Cement trade name. Amortization expense in 2012, 2011 and 2010 was $0.6 million, $0.5 million and $0.3 million, respectively. The estimated amortization expense for intangible assets for each of the next five years and thereafter is as follows (in thousands):
| 2013 |
$ | 546 | ||
| 2014 |
549 | |||
| 2015 |
549 | |||
| 2016 |
549 | |||
| 2017 |
545 | |||
| Thereafter |
5,868 | |||
|
|
|
|||
| Total |
$ | 8,606 | ||
|
|
|
Goodwill — Goodwill represents the purchase price paid in excess of the fair value of net tangible and intangible assets acquired. Goodwill recorded in connection with the Company’s acquisitions is primarily attributable to the expected profitability, assembled workforces of the acquired businesses and the synergies expected to arise after the Company’s
38
acquisition of those businesses. Goodwill is not amortized, but is tested annually for impairment as of the first day of the fourth quarter and whenever events or circumstances indicate that goodwill may be impaired. The test for goodwill impairment is a two-step process to first identify potential goodwill impairment for each reporting unit and then, if necessary, measure the amount of the impairment loss. Goodwill is tested for impairment based on the Company’s operating companies, which management has determined to be the Company’s reporting units, which are one level below its segments.
As of December 29, 2012, the Company had eight reporting units with goodwill for which the annual goodwill impairment test was completed. The first step of the goodwill impairment test employed by the Company compares the fair value of the reporting units to their carrying values. Management estimates the fair value of the reporting units primarily based on the discounted projected cash flows of the underlying operations. A number of significant assumptions and estimates are required to forecast operating cash flows, including macroeconomic trends in the public and private construction industry, the timing of work embedded in backlog, performance and profitability under contracts, expected success in securing future sales and the appropriate interest rate used to discount the projected cash flows. These assumptions may vary significantly among the reporting units. During the 2012 annual review of goodwill, management concluded that the estimated fair value of the reporting units was substantially in excess of their carrying values, resulting in no impairment. The Company has recorded no goodwill impairment charges to date.
The following table presents goodwill by reportable segments and in total (in thousands):
| Central | West | East | Total | |||||||||||||
| Beginning balance — January 1, 2011 |
$ | 48,210 | $ | 63,905 | $ | 5,071 | $ | 117,186 | ||||||||
| Acquisitions |
5,375 | 27,693 | 3,121 | 36,189 | ||||||||||||
|
|
|
|
|
|
|
|
|
|||||||||
| Balance — December 31, 2011 |
53,585 | 91,598 | 8,192 | 153,375 | ||||||||||||
| Acquisitions(i) |
19,204 | (205 | ) | 6,746 | 25,745 | |||||||||||
|
|
|
|
|
|
|
|
|
|||||||||
| Ending balance — December 29, 2012 |
$ | 72,789 | $ | 91,393 | $ | 14,938 | $ | 179,120 | ||||||||
|
|
|
|
|
|
|
|
|
|||||||||
| (i) | Includes certain immaterial working capital adjustments in the West region related to 2011 acquisitions. |
Income Taxes — The Company is a limited liability company and passes tax attributes for federal and state tax purposes to Parent and is generally not subject to federal or state income tax. However, the consolidated financial statements of the Company include federal and state income tax provisions and related accounts for subsidiaries that are taxable entities.
For the Company’s taxable entities, deferred income tax assets and liabilities are computed for differences between the financial statement amounts and tax bases of assets and liabilities that will result in taxable or deductible amounts in the future based on enacted tax laws and rates applicable to the periods in which the differences are expected to affect taxable income. A valuation allowance is recognized for deferred tax assets if it is more likely than not that some portion or all of the net deferred tax assets will not be realized.
The Company evaluates the tax positions taken on income tax returns that remain open to examination by the respective tax authorities from prior years and positions expected to be taken on the current year tax returns to identify uncertain tax positions. Interest and penalties are recorded in income tax expense.
Fair Value Measurements — The fair value accounting guidance establishes the following fair value hierarchy that prioritizes the inputs used to measure fair value:
Level 1 — Unadjusted quoted prices for identical assets or liabilities in active markets.
Level 2 — Inputs other than Level 1 that are based on observable market data, either directly or indirectly. These include quoted prices for similar assets or liabilities in active markets, quoted prices for identical assets or liabilities in inactive markets, inputs that are observable that are not prices and inputs that are derived from or corroborated by observable markets.
Level 3 — Valuations developed from unobservable data, reflecting the Company’s own assumptions, which market participants would use in pricing the asset or liability.
Assets and liabilities measured at fair value in the consolidated balance sheets as of year-end 2012 and 2011 are as follows (in thousands):
| 2012 | 2011 | |||||||
| Accrued expenses: |
||||||||
| Current portion of contingent consideration |
$ | 746 | $ | 1,155 | ||||
| Acquisition-related liabilities: |
||||||||
| Contingent consideration |
$ | 1,908 | $ | 2,123 | ||||
39
Certain acquisitions made by the Company require the payment of additional consideration contingent upon the achievement of specified operating results, referred to as contingent consideration or earn-out obligations. These payments will not be made if earn-out thresholds are not achieved. No material earn-out payments have been made to date.
Summit records contingent consideration at fair value on the acquisition date and then measures its fair value each reporting period. Any adjustments to fair value are recognized in earnings in the period identified. Management of the Company determines the appropriate policies and procedures to be used when determining the fair value of contingent consideration. Its fair values are based on unobservable inputs, or Level 3 assumptions, including projected probability-weighted cash payments and an 8.5% discount rate, which reflects the Company’s credit risk. Changes in fair value may occur as a result of a change in actual or projected cash payments, the probability weightings applied by the Company to projected payments or a change in the discount rate. Significant increases or decreases in any of these inputs in isolation could result in a significantly lower, or higher, fair value measurement. In 2012 and 2011, we recognized reductions to contingent consideration of $0.4 million and $10.3 million, respectively, due primarily to revised estimates of the probability of achieving the specified targets.
Financial Instruments — The Company’s financial instruments include certain acquisition related liabilities (deferred consideration and noncompete obligations) and debt. The fair value of the deferred consideration and noncompete obligations approximate their carrying value of $23.4 million and $7.4 million, respectively, as of December 29, 2012, and $15.1 million and $10.3 million, respectively, as of December 31, 2011. The fair value was determined based on level 3 inputs of the fair value hierarchy, including the cash payment terms in the purchase agreements and a discount rate reflecting the Company’s credit risk.
The fair value of long-term debt approximates $670.7 million and $605.0 million as of December 29, 2012 and December 31, 2011, respectively, compared to its carrying value of $639.8 million and $609.0 million, respectively. Fair value was determined based on Level 2 inputs of the fair value hierarchy, including observable inputs such as interest rates, bond yields and quoted prices for these instruments in inactive markets.
Kiln-Down Costs — Continental Cement experiences periodic major maintenance of its kiln (referred to as a kiln-down). The Company accounts for these costs under the direct expensing method, whereby costs are charged to operations as incurred.
New Accounting Standards — In May 2011, the Financial Accounting Standards Board (“FASB”) issued Accounting Standards Update No. 2011-04 Fair Value Measurement (Topic 820) Amendments to Achieve Common Fair Value Measurement and Disclosure Requirements in U.S. GAAP and IFRSs (“ASU 2011-04”). The amendments in this update result in common fair value measurement and disclosure requirements in GAAP and IFRSs. Consequently, the amendments change the wording used to describe many of the requirements in GAAP for measuring fair value and for disclosing information about fair value measurements. For many of the requirements, the FASB does not intend for the amendments in this update to result in a change in the application of the existing requirements. Some of the amendments clarify the FASB’s intent about the application of existing fair value measurement requirements. Other amendments change a particular principle or requirement for measuring fair value or for disclosing information about fair value measurements. The amendments in this update are effective prospectively during interim and annual periods beginning after December 15, 2011. The Company adopted ASU 2011-04 as of January 1, 2012, which did not result in a material effect on fair value measurements or related disclosures.
| (2) | Acquisitions |
The Company has acquired a number of entities since its formation in 2009, which were financed through a combination of debt and contributions from the Company’s member. Debt financing was composed of term loan debt and revolver facilities. Member’s contributions were provided by Parent to the Company. The operations of each acquisition have been included in the Company’s consolidated results of operations since the respective dates of the acquisitions. The Company measures all assets acquired and liabilities assumed at their acquisition-date fair value. The purchase price allocation for the acquisitions has been finalized with the exception of Kay & Kay Contracting, LLC and Sandco Inc. due to the recent nature of the acquisitions.
2012 Acquisitions — The following describes the acquisitions that occurred in 2012 by region.
Central region
| • | On February 29, 2012, the Company acquired certain assets of Norris Quarries, LLC, an aggregates business in northwest Missouri, with cash raised through the January 2012 financing transaction and drawn from the senior secured credit facility. |
40
West region
| • | On November 30, 2012, the Company acquired the stock of Sandco Inc., an aggregates and ready-mix business in Colorado with cash on-hand. |
East region
| • | On October 5, 2012, the Company acquired certain assets of Kay & Kay Contracting, LLC, an aggregates business in Kentucky with cash on-hand. |
Pro forma Financial Information (Unaudited) — The following unaudited supplemental pro forma information presents the financial results as if the 2012 acquisitions occurred on January 1, 2011. The acquisitions made in 2011 are not included in the pro forma summary as these acquisitions were not material individually or in the aggregate. This supplemental pro forma information has been prepared for comparative purposes and does not purport to be indicative of what would have occurred had the acquisition been made on January 1, 2011, nor is it indicative of any future results.
| (in thousands) | Year ended | |||||||
| December 29, 2012 |
December 31, 2011 |
|||||||
| Revenue |
$ | 976,797 | $ | 870,414 | ||||
| Net loss |
(45,976 | ) | (657 | ) | ||||
2011 acquisitions — The following describes the acquisitions that occurred in 2011 by region.
Central region
| • | On May 27, 2011, the Company acquired the membership interests of Fischer Quarries, L.L.C. using funds provided by Parent. |
West region
| • | On January 14, 2011, the Company acquired all of the stock of Triple C Concrete, Inc. in Idaho, financed with cash raised from the December 2010 refinancing. |
| • | On March 31, 2011, the Company acquired Elam Construction, Inc. in Colorado, financed with cash from the December 2010 refinancing. |
| • | On June 8, 2011, the Company acquired B & B Resources, Inc. using cash funded through a combination of debt and funds provided by Parent. |
| • | On June 10, 2011, the Company acquired the stock of Grand Junction Pipe, Inc. using funds provided by Parent. |
| • | On August 2, 2011, the Company, acquired the stock of Asphalt Paving Company of Austin, L.L.C. and certain of its Affiliates (“Asphalt Paving”) in Texas with funds provided by Parent. |
| • | On October 28, 2011, the Company acquired the stock of JD Ramming, Inc., RTI Hot Mix, Inc., RTI Equipment, Inc. and Ramming Transportation, Inc. in Texas funded through a combination of debt, cash on hand and funds provided by Parent. |
East region
| • | On May 27, 2011, the Company acquired the remaining 50% interest in a joint venture it had with Bourbon Limestone, Company using funds provided by Parent. |
The application of purchase accounting resulted in a bargain purchase gain of $2.6 million and $9.6 million for Elam Construction, Inc. and Grand Junction Pipe, Inc., respectively, which is reflected in other income in the consolidated statement of operations for the year-ended December 31, 2011. The amount of the bargain purchase gain is equal to the amount by which the fair value of net assets acquired exceeded the consideration transferred. The Company believes that the resulting bargain purchase gains are reasonable as the sellers were highly motivated.
41
2010 Acquisitions — The following describes the acquisitions that occurred in 2010 by region.
Central region
| • | On April 16, 2010, the Company purchased 100% of the outstanding ownership interests in Cornejo & Sons, L.L.C., C&S Group, Inc., Concrete Materials Company of Kansas, LLC and Cornejo Materials, Inc, collectively referred to as Cornejo. Cornejo provides construction, excavation and paving contracting services for government agencies and private industry primarily within the state of Kansas. Cornejo operates concrete, sand and asphalt production facilities. It also operates a landfill that is open to the public. |
| • | On June 15, 2010, the Company purchased the lease on a quarry and assets from Harshman Construction L.L.C. and Harshman Farms, Inc. (collectively, Harshman), in Moline, Kansas. |
| • | On May 27, 2010, the Company acquired 70% of the outstanding ownership interests of Continental Cement. The proceeds from the purchase were used by Continental Cement to repay certain outstanding indebtedness. |
| • | On September 15, 2010, the Company acquired 100% of the outstanding ownership interests of Con-Agg of MO, L.L.C. (“Con-Agg”). Con-Agg owns and operates aggregate, ready-mix facilities and an underground storage facility. |
West region
| • | The Company acquired the assets of Harper Contracting, Inc., Harper Sand and Gravel, Inc., Harper Ready Mix Company, Inc. and Harper Investments, Inc. (collectively referred to as Harper) and the assets of Kilgore Pavement Maintenance, LLC and Kilgore Properties, LLC, pursuant to two separate purchase agreements (collectively referred to as Kilgore). The transactions closed on August 2, 2010. Kilgore is engaged in various contracting and construction projects, primarily road and earthwork for governmental and commercial properties located in Utah. It also owns and operates quarry and asphalt production facilities. |
| • | On September 15, 2010, the Company purchased all interests in Altaview Concrete, LLC, Peak Construction Materials, LLC, Peak Management, L.C. and Wasatch Concrete Pumping, LLC (collectively, Altaview). Altaview is engaged primarily in the production and delivery of concrete to governmental, commercial and private properties in Utah. |
| • | On September 28, 2010, the Company purchased certain assets of EnerCrest Products, Inc. (Enercrest). Enercrest is engaged primarily in the mining and selling of quarry aggregates, including crushed stone and other similar products to customers located in Wyoming. |
| • | On November 30, 2010, the Company acquired 100% of the ownership equity interests of RK Hall Construction, Ltd., RHMB Capital, L.L.C., Hall Materials, Ltd., SCS Materials, L.P., B&H Contracting, L.P. and RKH Capital, LLC (collectively referred to as RK Hall) pursuant to an interest purchase agreement. RK Hall is engaged in road and bridge building and the third-party sale of aggregate material and hot-mix asphalt. It owns and operates a number of asphalt plant facilities and a concrete plant facility, all located in Northeast Texas. |
East region
| • | On February 1, 2010, the Company acquired 100% of the outstanding ownership interests of Hinkle Contracting Company, LLC (“Hinkle”). The purchase included the remaining 20% interests in Hinkle’s subsidiary, Glass Aggregates, LLC (Glass f.k.a. Glass Paving and Stone, LLC). Hinkle owns 80% of OVA. The remaining 20% noncontrolling interest was valued based on the fair value of net assets adjusted for income or losses, dividends received and contributions made. Hinkle is primarily engaged in business as a highway and site contractor. It also owns and operates stone quarries, asphalt plants and concrete block plants. |
| • | On April 20, 2010, the Company purchased certain assets of Elmo Greer & Sons, LLC (“Greer”), including three asphalt plants, mobile equipment and a leased quarry. |
| • | On July 23, 2010, the Company sold two asphalt plants and related construction assets in Hart and Barren counties in Kentucky in exchange for the long-term leases of four active quarries in Barren, Metcalfe, Monroe and Allen counties in Kentucky held by Scotty’s Contracting & Stone, LLC (“Scottys”). Inventory and quarry equipment were also included in the exchange. |
42
The following table summarizes aggregated information regarding the fair values of the assets acquired and liabilities assumed as of the respective acquisition dates in 2012, 2011 and 2010 (in thousands):
| Year-ended | ||||||||||||
| 2012 | 2011 | 2010 | ||||||||||
| Financial assets |
$ | 1,397 | $ | 50,036 | $ | 96,759 | ||||||
| Inventories |
6,988 | 22,329 | 41,474 | |||||||||
| Plant and equipment |
21,543 | 125,187 | 658,524 | |||||||||
| Other assets |
1,330 | 4,811 | 14,879 | |||||||||
| Investments in affiliates |
— | — | 21,655 | |||||||||
| Intangible assets (quarry lease) |
3,172 | 2,708 | 7,232 | |||||||||
| Financial liabilities |
(944 | ) | (27,304 | ) | (94,380 | ) | ||||||
| Long-term debt |
— | — | (160,480 | ) | ||||||||
| Other long term liabilities |
(364 | ) | (17,503 | ) | (20,083 | ) | ||||||
|
|
|
|
|
|
|
|||||||
| Net assets acquired |
33,122 | 160,264 | 565,580 | |||||||||
| Goodwill |
26,230 | 36,189 | 117,186 | |||||||||
| Pre-existing interest |
— | (7,565 | ) | — | ||||||||
| Noncontrolling interest |
— | — | (22,574 | ) | ||||||||
|
|
|
|
|
|
|
|||||||
| Total purchase price |
59,352 | 188,888 | 660,192 | |||||||||
|
|
|
|
|
|
|
|||||||
| Noncash transactions: |
||||||||||||
| Acquisition related liabilities |
(10,547 | ) | (7,603 | ) | (36,942 | ) | ||||||
| Continental Cement member’s interest |
— | — | (135,000 | ) | ||||||||
| Other |
(48 | ) | (20,212 | ) | (5,917 | ) | ||||||
|
|
|
|
|
|
|
|||||||
| Total noncash transactions |
(10,595 | ) | (27,815 | ) | (177,859 | ) | ||||||
|
|
|
|
|
|
|
|||||||
| Net cash paid for acquisitions |
$ | 48,757 | $ | 161,073 | $ | 482,333 | ||||||
|
|
|
|
|
|
|
|||||||
| (3) | Discontinued Operations |
The Company’s discontinued operations include a railroad construction and repair business (referred to herein as railroad), environmental remediation operations and certain concrete paving operations. The concrete paving operations were wound down in the second quarter of 2013; management expects the related assets to be sold within the subsequent twelve months. The railroad business involved building and repairing railroad sidings. The environmental remediation operations primarily involved the repair of retaining walls along highways in Kentucky and the removal and remediation of underground fuel storage tanks. The railroad and environmental remediation operations were sold in 2012 in separate transactions for aggregate proceeds of $3.1 million. Prior to recognition as discontinued operations, all of these businesses were included in the East region’s operations.
Debt and interest expense were not allocated to these businesses since there was no debt specifically attributable to the operations. The discontinued businesses are organized within a limited liability company that passes its tax attributes for federal and state tax purposes to its parent company and is generally not subject to federal or state income tax. The railroad, environmental remediation and concrete paving businesses’ revenue and loss before income tax expense, including an immaterial gain on sale, in fiscal years 2012, 2011 and 2010 are summarized below (in thousands):
| 2012 | 2011 | 2010 | ||||||||||
| Revenue |
$ | 50,152 | $ | 49,537 | $ | 45,556 | ||||||
| Loss from discontinued operations before income tax expense |
(3,546 | ) | (5,201 | ) | (778 | ) | ||||||
43
| (4) | Accounts Receivable, Net |
Accounts receivable, net consists of the following as of year-end 2012 and 2011 (in thousands):
| 2012 | 2011 | |||||||
| Trade accounts receivable |
$ | 88,637 | $ | 94,420 | ||||
| Retention receivables |
13,181 | 13,321 | ||||||
| Receivables from related parties |
1,871 | 1,052 | ||||||
| Other |
— | 70 | ||||||
|
|
|
|
|
|||||
| Accounts receivable |
103,689 | 108,863 | ||||||
| Less allowance for doubtful accounts |
(3,391 | ) | (3,630 | ) | ||||
|
|
|
|
|
|||||
| Accounts receivable, net |
$ | 100,298 | $ | 105,233 | ||||
|
|
|
|
|
|||||
Retention receivables are amounts earned by the Company, but held by customers until construction contracts and projects have been fully completed or near completion. Amounts are expected to be billed and collected within a year.
| (5) | Inventories |
Inventories consist of the following as of year-end 2012 and 2011 (in thousands):
| 2012 | 2011 | |||||||
| Aggregate stockpiles |
$ | 62,872 | $ | 52,219 | ||||
| Finished goods |
9,342 | 11,728 | ||||||
| Work-in-process |
2,679 | 2,961 | ||||||
| Raw materials |
18,084 | 17,355 | ||||||
|
|
|
|
|
|||||
| Total |
$ | 92,977 | $ | 84,263 | ||||
|
|
|
|
|
|||||
| (6) | Property, Plant and Equipment, Net |
Property, plant and equipment, net, consist of the following as of year-end 2012 and 2011 (in thousands):
| 2012 | 2011 | |||||||
| Land (mineral bearing) and asset retirement costs |
$ | 106,135 | $ | 93,899 | ||||
| Land (nonmineral bearing) |
69,560 | 71,996 | ||||||
| Buildings and improvements |
78,168 | 77,330 | ||||||
| Plants, machinery and equipment |
623,949 | 589,622 | ||||||
| Truck and auto fleet |
19,399 | 20,930 | ||||||
| Landfill airspace and improvements |
46,841 | 46,734 | ||||||
| Construction in progress |
20,734 | 11,877 | ||||||
| Other |
5,134 | 5,175 | ||||||
|
|
|
|
|
|||||
| Property, plant and equipment |
969,920 | 917,563 | ||||||
| Less accumulated depreciation, depletion and amortization |
(156,313 | ) | (95,660 | ) | ||||
|
|
|
|
|
|||||
| Property, plant and equipment, net |
$ | 813,607 | $ | 821,903 | ||||
|
|
|
|
|
|||||
Depreciation, depletion and amortization expense of property, plant and equipment was $68.6 million, $61.8 million and $34.7 million for the years ended December 29, 2012, December 31, 2011 and December 31, 2010, respectively.
Property, plant and equipment at year-end 2012 and 2011 include $3.1 million (net of $0.2 million accumulated amortization) and $3.3 million (net of $0.2 million accumulated amortization), respectively, of capital leases for a building. Approximately $0.4 million of the future obligations associated with the capital leases are included in accrued expenses and the present value of the remaining future capital lease payments is included in other noncurrent liabilities on the consolidated balance sheets. Future minimum rental commitments under long-term capital leases over the next five years as of December 29, 2012 are $0.4 million annually.
| (7) | Investments in Affiliates |
Summit’s investments in affiliates are accounted for using the equity method. Summit’s share of the net income from affiliates was $0.7 million in 2012 and $0.9 million and $0.7 million of the net loss in 2011 and 2010, respectively, which is included in other (income) expense, net on the consolidated statements of operations. Distributions from affiliates during 2012 were $0.7 million. No material distributions were made in 2011. In 2012, Summit sold its investment in Hinkle Meyer Environmental Services, LLC in conjunction with the sale of the environmental remediation business. Investments in affiliates as of year-end 2012 and 2011 are as follows (in thousands):
44
| Ownership percentage |
2012 | Ownership percentage |
2011 | |||||||||||||
| Nally & Gibson, Georgetown, LLC |
50 | % | $ | 12,138 | 50 | % | $ | 12,027 | ||||||||
| Carrollton River Terminal, LLC |
50 | % | 722 | 50 | % | 642 | ||||||||||
| The Rock Group, LLC |
50 | % | 129 | 50 | % | 245 | ||||||||||
| Hinkle Meyer Environmental Services, LLC |
— | — | 50 | % | 209 | |||||||||||
|
|
|
|
|
|||||||||||||
| Total |
$ | 12,989 | $ | 13,123 | ||||||||||||
|
|
|
|
|
|||||||||||||
| (8) | Debt |
Debt as of year-end 2012 and 2011 are summarized as follows (in thousands):
| 2012 | 2011 | |||||||
| Borrowings on revolver facilities: |
||||||||
| Current portion |
$ | — | $ | 4,000 | ||||
| Long-term portion |
— | 57,000 | ||||||
|
|
|
|
|
|||||
| Total borrowings on revolver facilities |
$ | — | $ | 61,000 | ||||
|
|
|
|
|
|||||
| Long-term debt: |
||||||||
| $250.0 million senior notes, net of $4.7 million discount |
$ | 245,303 | $ | — | ||||
| $400.0 million senior secured credit facility, net of $3.5 million discount |
394,540 | — | ||||||
| Summit I $400.0 million credit facility |
— | 396,001 | ||||||
| Summit II: |
||||||||
| $45.0 million term loan |
— | 39,000 | ||||||
| Subordinated secured credit note |
— | 100,000 | ||||||
| Unsecured note payable to related party |
— | 12,980 | ||||||
|
|
|
|
|
|||||
| Total debt |
639,843 | 547,981 | ||||||
| Current portion of debt |
4,000 | 3,960 | ||||||
|
|
|
|
|
|||||
| Long-term debt |
$ | 635,843 | $ | 544,021 | ||||
|
|
|
|
|
|||||
Accrued interest expense on long-term debt as of year-end 2012 and 2011 was $19.7 million and $3.7 million, respectively, and is included in accrued expenses on the consolidated balance sheets. The year-end 2012 balance includes accrued interest on the Senior Notes and the December 31 interest payment on the senior secured credit facility, both payable in January 2013.
As of December 29, 2012, the Company had no outstanding borrowings on the revolving credit commitments. The total contractual payments of long-term debt for the five years subsequent to December 29, 2012, are as follows (in thousands):
| 2013 |
$ | 4,000 | ||
| 2014 |
4,000 | |||
| 2015 |
4,000 | |||
| 2016 |
5,000 | |||
| 2017 |
4,000 | |||
| Thereafter |
627,000 | |||
|
|
|
|||
| Total |
648,000 | |||
| Less: Original issue discount |
8,157 | |||
|
|
|
|||
| Total debt |
$ | 639,843 | ||
|
|
|
January 2012 Financing Transactions
On January 30, 2012, Summit and Summit Materials Finance Corp (collectively, the “Issuers”) issued $250.0 million aggregate principal amount of 10.5% Senior Notes due January 31, 2020 (“Senior Notes”). Concurrently with the issuance of the Senior Notes, on January 30, 2012, Summit entered into a new senior secured credit facility that provided for term loans in an initial aggregate amount of $400.0 million and revolving credit commitments in an initial aggregate amount of $150.0 million (the “Senior Secured Credit Facility”).
45
Summit, along with all of its wholly-owned subsidiaries and its non wholly-owned subsidiary, Continental Cement, are named as guarantors of the Senior Secured Credit Facility and the Senior Notes. In addition, Summit has pledged substantially all of its assets and those of Continental Cement as collateral for the Senior Secured Credit Facility.
Proceeds from the Senior Notes and the Senior Secured Credit Facility were used primarily for (i) repayment of $451.0 million of borrowings under the existing credit facility, consisting of $396.0 million of term debt and $55.0 million of revolving credit facility debt, (ii) repayment of $142.7 million of secured debt of Continental Cement, (iii) repayment of $13.0 million due under a promissory note by and between Continental Cement and a related party, (iv) payment of $4.5 million of accrued interest related to the existing credit facility and the Continental Cement debt, (v) payment of $12.9 million of fees and (vi) $16.5 million to cash on hand. The refinancing of the pre-existing credit facility was partially accounted for as an extinguishment.
As a result, $9.5 million of deferred financing fees were charged to earnings in January 2012 and $15.0 million in deferred financing fees were recorded and are being amortized over the term of the debt using the effective interest method. The Company recognized $1.3 million of amortization on the original issuance discount in 2012. In addition, the debt was issued with an original issuance discount of $9.5 million, which was recorded as a reduction to debt in January 2012, and is being accreted with a charge to earnings over the term of the debt.
Senior Notes — The $250.0 million Senior Notes bear interest at 10.5% per year, payable semi-annually in arrears; interest payments commenced on July 31, 2012. The Notes will mature on January 31, 2020.
At any time prior to January 31, 2015, the Issuers may redeem some or all of the Senior Notes at a redemption price equal to 110.500% of the principal amount thereof, plus accrued and unpaid interest. The redemption price decreases to 105.250%, 102.625% and 100.000% of the principal amount on January 31, 2016, January 31, 2017 and January 31, 2018 and thereafter, respectively.
Upon the occurrence of a change of control or upon the sale of certain assets in which Summit does not apply the proceeds as required, the holders of the Senior Notes will have the right to require the Issuers to make an offer to repurchase each holder’s Notes at a price equal to 101% (in the case of a change of control) or 100% (in the case of an asset sale) of their principal amount, plus accrued and unpaid interest.
The Senior Notes contain covenants limiting, among other things, Summit and the guarantor subsidiaries’ ability to incur additional indebtedness or issue certain preferred shares, pay dividends, redeem stock or make other distributions, make certain investments, sell or transfer certain assets, create liens, consolidate, merge, sell or otherwise dispose of all or substantially all of Summit’s assets, enter into certain transactions with affiliates, and designate subsidiaries as unrestricted subsidiaries. The Senior Notes also contain customary events of default. As of December 29, 2012, Summit was in compliance with all covenants.
Senior Secured Credit Facility — The Senior Secured Credit Facility includes a term loan in the amount of $400.0 million with a 6.0% interest rate and requires principal repayments of $1.0 million on the last business day of each March, June, September and December, commencing in June 2012. The remaining principal balance is due in full on the maturity date, which is January 30, 2019.
The Senior Secured Credit Facility has revolving credit commitments of $150.0 million. The revolving credit facility matures on January 30, 2017. Borrowings under the Senior Secured Credit Facility bear interest per annum equal to an applicable margin of 4.5% plus, at the Company’s option, either (i) a base rate determined by reference to the highest of (a) the federal Funds rate plus 0.50%, (b) the prime rate of Bank of America, N.A. and (c) the British Bankers Association London Interbank Offered Rate (“LIBOR”) Rate plus 1.00% or (ii) a British Bankers Association LIBOR rate determined by reference to Reuters prior to the interest period relevant to such borrowing adjusted for certain additional costs.
The available borrowings under the revolving credit facility were reduced by $14.5 million of irrevocable letters of credit issued to Summit. As of December 29, 2012, the Company has no outstanding balance under the revolver facility and $135.5 million was available for borrowings.
The Senior Secured Credit Facility contains certain financial covenants related to debt and interest leverage calculated based on definitions set forth in the agreement. The consolidated first lien net leverage ratio, reported each quarter should be no greater than 4.75:1.0 through December 31, 2012; 4.25:1.0 from January 1, 2013 to September 30, 2013; 4.00:1.0 from October 1, 2013 to December 31, 2014, and 3.85:1.0 thereafter. The interest coverage ratio must be at least 1.75:1.0 from April 1, 2012 through December 31, 2012; 1.85:1.0 from January 1, 2013 to December 31, 2013 and 2.0:1.0 thereafter. As of December 29, 2012, Summit was in compliance with all covenants.
46
A summary of the significant terms of the December 31, 2011 credit facilities, which were repaid with the January 30, 2012 transactions, follows:
Summit I
On February 1, 2010, Summit I entered into a credit agreement with a syndicate of banks secured by assets within and administered by Summit I. The original credit agreement provided for a four-and-a-half-year term loan with interest charged at a rate of 6.75% and a repayment of principal at a rate of 1% per annum payable quarterly. Summit I’s total borrowings under the original term loan were $136.4 million at February 1, 2010. On December 17, 2010, Summit I finalized an amendment to the credit agreement, which amended and restated the original facility (the “Amended Credit Agreement”). Under the Amended Credit Agreement, Summit I’s term loan borrowings increased to $400.0 million with a 6.5% interest rate and required principal repayments of 1% of term debt per annum which are payable quarterly. There were $11.0 million in capitalized loan fees associated with this transaction.
Summit I’s revolver facility increased from $50.0 million to $75.0 million with the Amended Credit Agreement. There are two classes within the facility: Class A matures on January 31, 2014 and makes up $17.5 million of the revolver facility, and Class B matures on January 31, 2015 and makes up $57.5 million of the facility. The available borrowings under the revolver facility remained reduced by $13.3 million irrevocable letters of credit issued to Summit I. The letters of credit were required by insurance carriers to secure surety bonds for certain construction contracts. There was a $61.0 million outstanding balance under the revolver facility as of December 31, 2011, which was repaid in conjunction with the January 2012 financing transaction.
Summit I must adhere to certain financial covenants related to debt and interest leverage calculated based on definitions laid out in the amended credit agreement. As of December 31, 2011, Summit I was in compliance with all financial covenants.
Summit I, along with all its subsidiary companies, were named as guarantors of the term loan and on the revolver facility. In addition, Summit I had pledged substantially all of its assets as collateral for the term loan and revolver facility.
Summit II
Continental Cement, a subsidiary of Summit II, entered into its Second Amended and Restated Credit Agreement (“First Lien Credit Agreement”) on May 27, 2010 with its syndicate banks providing a term loan commitment and revolving line of credit facility, with swing line, and letter of credit sub-limit. Interest was charged on outstanding borrowings at increments of either, (a) the Base Rate, as defined in the credit agreement, plus 3.5% margin or (b) the greater of (i) 1.5% or (ii) the LIBOR plus 4.5% margin. Continental Cement has the option of selecting either rate but must have minimum levels and increments for selecting the LIBOR rate. Interest on funds borrowed at the Base Rate is payable quarterly, except the swing line which is paid monthly. Alternatively, interest on funds borrowed based on the LIBOR rate is payable in either one-, two-, three-, or nine-month intervals. Outstanding borrowings were secured by substantially all of Continental Cement’s assets and all such commitments were set to expire on May 27, 2013. The revolving line of credit facility had $20.0 million available and included a $10.0 million sub-limit for standby letter of credits and a $2.0 million swingline sub-limit.
Continental Cement borrowed $45.0 million from the term loan facility and repaid $6.0 million in optional principle payments during 2010. Under the terms of the First Lien Credit Agreement, Continental Cement was required to adhere to certain financial covenants related to debt and interest leverage calculated based on definitions laid out in the First Lien Credit Agreement.
On May 27, 2010, Continental Cement amended its Second Lien Credit Agreement with its subordinated lenders of the subordinated secured credit facility totalling $100.0 million. The Second Lien Credit Agreement provided for a term loan maturing August 28, 2013. The Second Lien Credit Agreement was subject to the same financial covenants in the First Lien Credit Agreement.
On May 27, 2010, the Company executed an unsecured note payable from a related party totalling $13.0 million. Payment including principal and interest were due in one lump-sum on May 30, 2015 subject to a subordination agreement required by Continental Cement’s term loan.
| (9) | Member’s Interest |
Business affairs of the Company are managed by the Board of Directors, which, as of December 29, 2012, was composed of six directors. Directors of the Board are appointed by the unit holders of Summit Materials Holdings L.P., which is the sole member of the Company. Additional directors may be admitted to Summit with the written consent of Summit Materials Holdings L.P.
47
During the years ended December 31, 2011 and December 31, 2010, the Member of the Company contributed $103.6 million and $338.6 million, respectively, to Summit. No contributions were made during the year-ended December 29, 2012. Contributions are presented as member’s interest in the consolidated statements of changes in member’s interest.
| (10) | Income Taxes |
For the years ended 2012, 2011 and 2010, income taxes consist of the following (in thousands):
| 2012 | 2011 | 2010 | ||||||||||
| Provision for income taxes: |
||||||||||||
| Current |
$ | (452 | ) | $ | 5,382 | $ | 4,385 | |||||
| Deferred |
(3,468 | ) | (1,974 | ) | (2,022 | ) | ||||||
|
|
|
|
|
|
|
|||||||
| Income tax (benefit) expense |
$ | (3,920 | ) | $ | 3,408 | $ | 2,363 | |||||
|
|
|
|
|
|
|
|||||||
The effective tax rate on pre-tax income differs from the U.S. statutory rate due to the following (in thousands):
| 2012 | 2011 | 2010 | ||||||||||
| Income tax provision (benefit) at federal statutory tax rate |
$ | (19,074 | ) | $ | (6,895 | ) | $ | (7,310 | ) | |||
| Book loss (income) not subject to income tax |
16,167 | 13,790 | 9,364 | |||||||||
| State and local income taxes |
(90 | ) | 666 | 241 | ||||||||
| Depletion expense |
(377 | ) | (372 | ) | (377 | ) | ||||||
| Domestic production activities deduction |
— | (273 | ) | (213 | ) | |||||||
| Bargain purchase gain |
— | (4,250 | ) | — | ||||||||
| Effective rate change |
(532 | ) | 627 | — | ||||||||
| Valuation allowance |
36 | (360 | ) | 359 | ||||||||
| Other |
(50 | ) | 475 | 299 | ||||||||
|
|
|
|
|
|
|
|||||||
| Income tax provision (benefit) |
$ | (3,920 | ) | $ | 3,408 | $ | 2,363 | |||||
|
|
|
|
|
|
|
|||||||
The following table summarizes the components of the net deferred income tax liability as of year-end 2012 and 2011 (in thousands):
| 2012 | 2011 | |||||||
| Deferred tax assets (liabilities): |
||||||||
| Mining reclamation reserve |
$ | 1,449 | $ | 865 | ||||
| Accelerated depreciation |
(34,733 | ) | (41,892 | ) | ||||
| Net operating loss |
2,134 | 1,037 | ||||||
| Capital losses on securities |
989 | 1,734 | ||||||
| Landfill closure reserve |
(30 | ) | 92 | |||||
| Working capital (e.g., accrued compensation, prepaid assets) |
3,101 | 3,189 | ||||||
|
|
|
|
|
|||||
| Deferred tax liabilities, net |
(27,090 | ) | (34,975 | ) | ||||
| Less valuation allowance on loss carryforwards |
(1,025 | ) | (1,010 | ) | ||||
|
|
|
|
|
|||||
| Total |
$ | (28,115 | ) | $ | (35,985 | ) | ||
|
|
|
|
|
|||||
| Included in accompanying consolidated balance sheets under the following captions: |
||||||||
| Other current assets |
$ | 2,275 | $ | 2,426 | ||||
| Other noncurrent liability |
(30,390 | ) | (38,411 | ) | ||||
|
|
|
|
|
|||||
| Total |
$ | (28,115 | ) | $ | (35,985 | ) | ||
|
|
|
|
|
|||||
In assessing the realizability of deferred tax assets as of year-end 2012 and 2011, management considers whether it is more likely than not that some portion or all of the deferred tax assets will not be realized. The ultimate realization of deferred tax assets is dependent upon the generation of future taxable income during the periods in which those temporary differences become deductible (including the effect of available carryback and carryforward periods), projected future taxable income and tax-planning strategies in making this assessment. Management anticipates the deferred income tax asset related to losses on securities and net operating losses will not be fully utilized before their expiration in 2014; therefore, a valuation allowance has
48
been recorded as of year-end 2012 and 2011. In 2011, $0.8 million of capital loss was carried back for a tax benefit recovery of $0.3 million. The remaining capital loss of $1.0 million is not expected to be utilized prior to expiration in 2014; therefore, the remaining balance has been fully reserved in the valuation allowance as of year-end 2012. At December 29, 2012, the Company has net operating loss carryforwards for federal and state income tax purposes of $2.0 million and $0.1 million, respectively, which are available to offset future federal and state taxable income, if any, through 2032.
Summit does not have any uncertain tax positions as of December 29, 2012. Tax years from 2009 to 2011 remain open and subject to audit by federal and state tax authorities. No income tax expense or benefit was recognized in other comprehensive loss in 2012, 2011 or 2010.
| (11) | Employee Benefit Plans |
Deferred Compensation Plan — The Company sponsors employee 401(k) savings plans for all salaried employees and certain union employees. The plans provide for various required and discretionary Company matches of employees’ eligible compensation contributed to the plans. The expense for all defined contribution plans amounted to $2.2 million, $1.9 million and $0.8 million for the years ended December 29, 2012, December 31, 2011 and December 31 2010, respectively.
Defined Benefit and Other Postretirement Benefits Plans — One of the Company’s subsidiaries, Continental Cement, sponsors two noncontributory defined benefit pension plans for hourly and salaried employees. The salary employee pension plan was closed to new participants and frozen in January 2000 and the hourly employee pension plan was closed to new participants in May 2003. Pension benefits for certain eligible hourly employees are based on a monthly pension factor for each year of credited service. Pension benefits for certain eligible salaried employees are generally based on years of service and average eligible compensation.
Continental Cement also sponsors healthcare and life insurance benefits for certain eligible retired employees, which are not funded. Effective January 1, 2012, the Company eliminated all future retiree health and life coverage for active salaried, nonunion hourly and certain union employees that retire on or after January 1, 2012. This change in the other postretirement benefit plans resulted in a $1.7 million reduction in the December 31, 2011 accumulated benefit obligations.
The funded status of the pension and other postretirement benefit plans is recognized in the consolidated balance sheets as the difference between the fair value of plan assets and the benefit obligations. For defined benefit pension plans, the benefit obligation is the projected benefit obligation (“PBO”) and for the other postretirement benefit plans, the benefit obligation is the accumulated postretirement benefit obligation (“APBO”). The PBO represents the actuarial present value of benefits expected to be paid upon retirement based on estimated future compensation levels. The APBO represents the actuarial present value of postretirement benefits attributed to employee services already rendered. The fair value of plan assets represents the current market value of assets held by an irrevocable trust fund for the sole benefit of participants. The measurement of the benefit obligations are based on the Company’s estimates and actuarial valuations. These valuations reflect the terms of the plan and use participant-specific information, such as compensation, age and years of service, as well as certain assumptions that require significant judgment, including estimates of discount rates, expected return on plan assets, rate of compensation increases, interest-crediting rates and mortality rates.
The Company uses its fiscal year-end as the measurement date for its defined benefit pension plans and for its other postretirement benefit plans.
Obligations and Funded Status — The following information is as of year-end 2012 and 2011 (in thousands):
| 2012 | 2011 | |||||||||||||||
| Pension benefits |
Other benefits |
Pension benefits |
Other benefits |
|||||||||||||
| Change in benefit obligations: |
||||||||||||||||
| Beginning of period |
$ | 26,514 | $ | 14,467 | $ | 23,732 | $ | 13,110 | ||||||||
| Service cost |
276 | 207 | 275 | 227 | ||||||||||||
| Interest cost |
1,056 | 585 | 1,161 | 710 | ||||||||||||
| Actuarial loss |
2,347 | 1,597 | 2,710 | 3,390 | ||||||||||||
| Change in plan provisions |
— | — | — | (1,705 | ) | |||||||||||
| Benefits paid |
(1,518 | ) | (1,046 | ) | (1,364 | ) | (1,265 | ) | ||||||||
|
|
|
|
|
|
|
|
|
|||||||||
| End of period |
28,675 | 15,810 | 26,514 | 14,467 | ||||||||||||
|
|
|
|
|
|
|
|
|
|||||||||
| Change in plan assets: |
||||||||||||||||
| Fair value of assets at beginning of period |
16,639 | — | 16,531 | — | ||||||||||||
| Actual return on plan assets |
1,205 | — | 43 | — | ||||||||||||
| Employer contributions |
1,537 | 1,046 | 1,428 | 1,265 | ||||||||||||
| Benefits paid |
(1,518 | ) | (1,046 | ) | (1,363 | ) | (1,265 | ) | ||||||||
|
|
|
|
|
|
|
|
|
|||||||||
| Fair value of assets at end of period |
17,863 | — | 16,639 | — | ||||||||||||
|
|
|
|
|
|
|
|
|
|||||||||
| Liability recognized |
$ | 10,812 | $ | 15,810 | $ | 9,875 | $ | 14,467 | ||||||||
|
|
|
|
|
|
|
|
|
|||||||||
49
Approximately $1.1 million and $1.0 million of the obligation for postretirement benefits are included in current liabilities as of year-end 2012 and 2011, respectively.
| 2012 | 2011 | |||||||||||||||
| Pension benefits |
Other benefits |
Pension benefits |
Other benefits |
|||||||||||||
| Amounts recognized in accumulated other comprehensive income: |
||||||||||||||||
| Net actuarial loss |
$ | 8,056 | $ | 5,501 | $ | 5,875 | $ | 4,213 | ||||||||
| Prior service cost |
— | (1,526 | ) | — | (1,705 | ) | ||||||||||
|
|
|
|
|
|
|
|
|
|||||||||
| Total amount recognized |
$ | 8,056 | $ | 3,975 | $ | 5,875 | $ | 2,508 | ||||||||
|
|
|
|
|
|
|
|
|
|||||||||
The amount recognized in accumulated other comprehensive income (“AOCI”) is the actuarial loss and prior service cost, which has not yet been recognized in periodic benefit cost, adjusted for amounts allocated to the redeemable noncontrolling interest. At December 29, 2012, the actuarial loss expected to be amortized from AOCI to periodic benefit cost in 2013 is $0.4 million and $0.2 million for the pension and postretirement obligations, respectively.
| Year-end 2012 | Year-end 2011 | Year-end 2010 | ||||||||||||||||||||||
| Pension benefits |
Other benefits |
Pension benefits |
Other benefits |
Pension benefits |
Other benefits |
|||||||||||||||||||
| Amounts recognized in other comprehensive loss: |
||||||||||||||||||||||||
| Net actuarial loss |
$ | 2,444 | $ | 1,597 | $ | 4,066 | $ | 3,390 | $ | 1,814 | $ | 894 | ||||||||||||
| Prior service cost |
— | — | (1,705 | ) | — | — | ||||||||||||||||||
| Amortization of prior year service cost |
— | 180 | — | — | — | — | ||||||||||||||||||
| Amortization of loss |
(261 | ) | (312 | ) | (5 | ) | (71 | ) | — | — | ||||||||||||||
|
|
|
|
|
|
|
|
|
|
|
|
|
|||||||||||||
| Total amount recognized |
$ | 2,183 | $ | 1,465 | $ | 4,061 | $ | 1,614 | $ | 1,814 | $ | 894 | ||||||||||||
|
|
|
|
|
|
|
|
|
|
|
|
|
|||||||||||||
| Year-end 2012 |
Year-end 2011 |
Year-end 2010 |
||||||||||||||||||||||
| Pension benefits |
Other benefits |
Pension benefits |
Other benefits |
Pension benefits |
Other benefits |
|||||||||||||||||||
| Components of net periodic benefit cost: |
||||||||||||||||||||||||
| Service cost |
$ | 276 | $ | 207 | $ | 275 | $ | 227 | $ | 121 | $ | 116 | ||||||||||||
| Interest cost |
1,056 | 585 | 1,161 | 710 | 677 | 380 | ||||||||||||||||||
| Amortization of loss |
261 | 312 | 5 | 69 | — | — | ||||||||||||||||||
| Expected return on plan assets |
(1,301 | ) | (180 | ) | (1,400 | ) | — | (788 | ) | — | ||||||||||||||
|
|
|
|
|
|
|
|
|
|
|
|
|
|||||||||||||
| Net periodic benefit cost |
$ | 292 | $ | 924 | $ | 41 | $ | 1,006 | $ | 10 | $ | 496 | ||||||||||||
|
|
|
|
|
|
|
|
|
|
|
|
|
|||||||||||||
Assumptions — Weighted-average assumptions used to determine the benefit obligations are:
| 2012 | 2011 | |||||||||||||||
| Pension benefits |
Other benefits |
Pension benefits |
Other benefits |
|||||||||||||
| Discount rate |
3.30% – 3.57% | 3.41% | 3.89% – 4.07% | 4.00% | ||||||||||||
The expected long-term return on plan assets is based upon the Company’s estimation of what a portfolio, with the target allocation described below, will earn over a long-term horizon. The discount rate is derived using the Citigroup Pension Discount Curve.
50
Weighted-average assumptions used to determine net periodic benefit cost for the period are:
| Year-end 2012 |
Year-end 2011 |
|||||||||||||||
| Pension benefits |
Other benefits |
Pension benefits |
Other benefits |
|||||||||||||
| Discount rate |
3.89% – 4.07 | % | 4.00 | % | 4.94% – 5.12 | % | 5.07 | % | ||||||||
| Expected long-term rate of return on plan assets |
7.50 | % | NA | 8.50 | % | NA | ||||||||||
Assumed health care cost trend rates are 9% grading to 7% and 7% grading to 5% as of year-end 2012 and 2011, respectively. Assumed health care cost trend rates have a significant effect on the amounts reported for the Company’s post retirement medical and life plans. A one percentage-point change in assumed health care cost trend rates would have the following effects (in thousands):
| 2012 | 2011 | |||||||||||||||
| Increase | (Decrease) | Increase | (Decrease) | |||||||||||||
| Total service cost and interest cost components |
$ | 73 | $ | (63 | ) | $ | 93 | $ | (77 | ) | ||||||
| Estimated APBO |
1,555 | (1,331 | ) | 1,348 | (1,145 | ) | ||||||||||
Plan Assets — The defined benefit pension plans’ (the “Plans”) investment strategy is to minimize investment risk while generating acceptable returns. The Plans currently invest a relatively high proportion of the plan assets in fixed income securities, while the remainder is invested in equity securities. The equity securities are diversified into funds with growth and value investment strategies. The target allocation for plan assets is as follows: equity securities – 30%; fixed income securities –65%; and cash reserves –5%. The Plans’ current investment allocations are within the tolerance of the target allocation. The Company has no level 3 investments as of or for the years-ended December 29, 2012 and December 31, 2011.
At year-end 2012 and 2011, the trust was invested largely in publicly traded equities and fixed-income securities, but may invest in other asset classes in the future consistent with our investment policy. The Plans’ investments in equity assets include U.S. and international securities and equity funds. The Plans’ investments in fixed-income assets include U.S. Treasury and U.S. agency securities and corporate bonds. Retirement plan assets are reported at fair value at each measurement date. The Company estimates the fair value of the Plans’ assets using various valuation techniques and, to the extent available, quoted market prices in active markets or observable market inputs are used in estimating the fair value of the Plans’ assets. The descriptions and fair value methodologies for the Plans’ assets are as follows:
Cash — The carrying amounts of cash approximate fair value due to the short-term maturity.
Equity Securities — Equity securities are valued at the closing market price reported on a U.S. exchange where the security is actively traded and are therefore classified as Level 1 assets.
Fixed Income Securities — Corporate and government bonds are classified as Level 2 assets, as they are either valued at quoted market prices from observable pricing sources at the reporting date or valued based upon comparable securities with similar yields and credit ratings.
The fair value of the Company’s pension plans’ assets by asset class and fair value hierarchy level as of year-end 2012 and 2011 are as follows (in thousands):
| Fair value measurements at year-end 2012 | ||||||||||||
| Total fair value |
Quoted prices in active markets for identical assets (Level 1) |
Observable inputs (Level 2) |
||||||||||
| Cash |
$ | 1,656 | $ | 1,656 | $ | — | ||||||
| Equity securities: |
||||||||||||
| U.S. Large cap value |
1,063 | 1,063 | — | |||||||||
| U.S. Large cap growth |
1,037 | 1,037 | — | |||||||||
| U.S. Mid cap value |
542 | 542 | — | |||||||||
| U.S. Mid cap growth |
536 | 536 | — | |||||||||
| U.S. Small cap value |
546 | 546 | — | |||||||||
| U.S. Small cap growth |
539 | 539 | — | |||||||||
| International |
1,134 | 1,134 | — | |||||||||
| Fixed income securities: |
||||||||||||
| Intermediate-government |
1,247 | — | 1,247 | |||||||||
| Intermediate-corporate |
4,402 | — | 4,402 | |||||||||
| Short term-government |
2,038 | — | 2,038 | |||||||||
| Short term-corporate |
3,123 | — | 3,123 | |||||||||
|
|
|
|
|
|
|
|||||||
| Total |
$ | 17,863 | $ | 7,053 | $ | 10,810 | ||||||
|
|
|
|
|
|
|
|||||||
51
| Fair value measurements at year-end 2011 | ||||||||||||
| Total fair value |
Quoted prices in active markets for identical assets (Level 1) |
Observable inputs (Level 2) |
||||||||||
| Cash |
$ | 1,217 | $ | 1,217 | $ | — | ||||||
| Equity securities: |
||||||||||||
| U.S. Large cap value |
1,399 | 1,399 | — | |||||||||
| U.S. Large cap growth |
1,388 | 1,388 | — | |||||||||
| U.S. Mid cap value |
700 | 700 | — | |||||||||
| U.S. Mid cap growth |
687 | 687 | — | |||||||||
| U.S. Small cap value |
701 | 701 | — | |||||||||
| U.S. Small cap growth |
705 | 705 | — | |||||||||
| International |
1,378 | 1,378 | — | |||||||||
| Fixed income securities: |
||||||||||||
| Intermediate-government |
1,100 | — | 1,100 | |||||||||
| Intermediate-corporate |
2,418 | — | 2,418 | |||||||||
| Short term-government |
2,067 | — | 2,067 | |||||||||
| Short term-corporate |
2,879 | — | 2,879 | |||||||||
|
|
|
|
|
|
|
|||||||
| Total |
$ | 16,639 | $ | 8,175 | $ | 8,464 | ||||||
|
|
|
|
|
|
|
|||||||
Cash Flows — The Company expects to contribute approximately $1.3 million to its pension plans and $1.1 million to its other postretirement benefit plans in 2013.
The estimated benefit payments for each of the next five years and the five-year period thereafter are as follows (in thousands):
| Pension benefits |
Other benefits |
|||||||
| 2013 |
$ | 1,718 | $ | 1,055 | ||||
| 2014 |
1,707 | 1,113 | ||||||
| 2015 |
1,715 | 1,022 | ||||||
| 2016 |
1,748 | 1,079 | ||||||
| 2017 |
1,744 | 945 | ||||||
| 2018–2022 |
8,738 | 4,724 | ||||||
|
|
|
|
|
|||||
| Total |
$ | 17,370 | $ | 9,938 | ||||
|
|
|
|
|
|||||
| (12) | Accrued Mining and Landfill Reclamation |
The Company has asset retirement obligations arising from regulatory requirements to perform certain reclamation activities at the time that certain quarries and landfills are closed. The liability was initially measured at fair value and subsequently is adjusted for accretion expense, payments and changes in the amount or timing of the estimated cash flows. The corresponding asset retirement costs are capitalized as part of the carrying amount of the related long-lived asset and depreciated over the asset’s remaining useful life. The following table presents the activity for the asset retirement obligations for the years-ended December 29, 2012 and December 31, 2011 (in thousands):
| 2012 | 2011 | |||||||
| Beginning balance |
$ | 13,328 | $ | 13,766 | ||||
| Acquired obligations |
364 | 1,884 | ||||||
| Change in cost estimate |
604 | (4,530 | ) | |||||
| Settlement of reclamation obligations |
(77 | ) | (993 | ) | ||||
| Additional liabilities incurred |
— | 2,511 | ||||||
| Accretion expense |
625 | 690 | ||||||
|
|
|
|
|
|||||
| Ending balance |
$ | 14,844 | $ | 13,328 | ||||
|
|
|
|
|
|||||
52
In 2011, the Company received an interpretation of the landfill reclamation requirements from the State of Kansas, which resulted in an approximate $4.5 million reduction to the post-closure liabilities. This adjustment, after reducing the related asset retirement landfill asset to zero, was included in cost of revenue for the year-ended December 31, 2011.
| (13) | Commitments and Contingencies |
Litigation and Claims — Summit is party to certain legal actions arising from the ordinary course of business activities. In the opinion of management, these actions are without merit or the ultimate disposition, if any, resulting from them will not have a material effect on Summit’s consolidated financial position, results of operations or liquidity. Summit’s policy is to record legal fees as incurred.
Environmental Remediation — Summit’s mining operations are subject to and affected by federal, state and local laws and regulations relating to the environment, health and safety and other regulatory matters. These operations require environmental operating permits, which are subject to modification, renewal and revocation. Summit regularly monitors and reviews its operations, procedures and policies for compliance with these laws and regulations. Despite these compliance efforts, risk of environmental liability is inherent in the operation of Summit’s business, as it is with other companies engaged in similar businesses and there can be no assurance that environmental liabilities will not have a material adverse effect on Summit’s consolidated financial position, results of operations or liquidity.
On July 11, 2006, the Company received a construction permit for a new kiln system for the cement plant to replace the current system at that time. The new kiln began shakedown operations in 2008 and is operating under the Hazardous Waste Combustor National Emission Standards for Hazardous Air Pollutants (“NESHAP”). Continental Cement performed the required Comprehensive Performance Test in 2009/2010 and submitted the Notification of Compliance (“NOC”) to the regulatory agencies. In 2012, the Company tested and passed the required Confirmatory Performance Test and submitted an amended NOC at that time. The next required Confirmatory Performance Test will be in 2015. Summit applied for renewal of their Part 70 Operating Permit in 2010 and received the permit on September 22, 2011. This permit encompasses all active construction permits and general operating requirements for the entire plant, and will remain in effect for five years.
On October 14, 1999, the Missouri Dept. of Natural Resources (“MDNR”) and the EPA granted the company a Final Hazardous Waste Management Facility Permit that authorizes the Company to handle, treat, store, recover energy from and dispose of hazardous waste as a supplemental fuel source (RCRA Part B Permit). This permit also incorporated certain Boiler and Industrial Furnace (“BIF”) regulation emission limits and operating parameters that the company was subject to prior to the Hazardous Waste Combustor Maximum Achievable Control Technology standards. On October 13, 2009, a permit renewal application was submitted to MDNR. The application was accepted as complete and MDNR annually issues a notification that the Company can operate under the original permit until review of the renewal is complete. MDNR has delayed review of the renewal application until the agency revises their Health Profile regulations. MDNR has authorized the company to operate under interim status. Once the permit renewal is approved, the renewal will cover another ten-year period.
Other — The Company is obligated under an indemnification agreement entered into with the sellers of Harper for the sellers’ ownership interests in a joint venture agreement. Summit has the rights to any benefits under the joint venture as well as the assumption of any obligations, but does not own equity interests in the joint venture. The joint venture has incurred significant losses on a highway project in Utah, which have resulted in requests for funding from the joint venture partners and ultimately from the Company. Through year-end 2012, the Company has funded $8.8 million, $4.0 million in 2012 and $4.8 million in 2011. In 2012 and 2011, the Company recognized losses on the indemnification agreement of $8.0 million and $1.9 million, respectively, which are included in general and administrative expenses. As of year end 2012 and 2011, accruals of $4.3 million and $0.3 million, respectively, were recorded in other noncurrent liabilities as management’s best estimate of future funding obligations.
In February 2011, Continental Cement incurred a property loss related to a sunken barge with cement product aboard. At which time, the Company recognized a loss of $0.6 million for the lost product and property. As of December 29, 2012, the Company has a $0.9 million accrual for the estimated reclamation costs. Any insurance recoveries from the loss will be recognized when probable.
During the course of business, there may be revisions to project costs and conditions that can give rise to change orders. Revisions can also result in claims we might make against the customer or a subcontractor to recover project variances that have not been satisfactorily addressed through change orders with the customer. As of year-end 2012 and 2011, unapproved change orders and claims are $4.8 million ($1.6 million in costs and estimated earnings in excess of billings and $3.2 million in other assets) and $4.7 million ($0.4 million in accounts receivable, $1.1 million in costs and estimated earnings in excess of billings and $3.2 million in other assets), respectively.
53
| (14) | Related-Party Transactions |
The Company incurred management fees paid to Blackstone Management Partners L.L.C. (“BMP”) totaling $2.1 million, $3.0 million and $2.5 million in 2012, 2011 and 2010, respectively, under terms of an agreement dated July 30, 2009, between Summit Materials Holdings L.P. and BMP. Under the terms of the agreement, BMP is permitted to, and has, assigned a portion of the fees to which it is entitled to receive to Silverhawk Summit, L.P. and to certain members of management. The fees were paid for consultancy services related to acquisition activities and are included in general and administrative expenses.
The Company purchased equipment from a noncontrolling member of Continental Cement for approximately $2.3 million, inclusive of $0.1 million of interest, in 2011, which was paid for in 2012.
Summit earned revenue of $7.9 million, $8.6 million and $8.5 million and incurred costs of $0.2 million, $0.7 million and $1.1 million in connection with several transactions with unconsolidated affiliates for the years ended December 29, 2012, December 31, 2011 and December 31, 2010, respectively. As of December 29, 2012 and December 31, 2011, accounts receivable from affiliates was $1.9 million and $1.1 million, respectively, and accounts payable to affiliates was $0.2 million and $2.2 million, respectively.
Cement sales to companies owned by certain noncontrolling members of Continental Cement were approximately $12.5 million, $9.5 million and $9.0 million for the years ended December 29, 2012, December 2011 and December 31, 2010, respectively, and accounts receivables due from these parties were approximately $1.0 million and $1.3 million as of December 29, 2012 and December 2011, respectively.
The Company owes $2.1 million to a noncontrolling member of Continental Cement for accrued interest on a related party note, which is expected to be fully settled by 2014. The principal balance on the note was repaid as part of the January 2012 financing transactions.
Lease payments of $1.0 million, $0.4 million and $0.2 million were made to related parties for the years ended December 29, 2012, December 2011 and December 31, 2010, respectively.
| (15) | Acquisition-Related Costs and Liabilities |
A number of acquisition-related liabilities have been recorded subject to terms in the relevant purchase agreements. There are three main categories of such obligations, deferred consideration, noncompete payments and earn-out obligations. Noncompete payments have been accrued where certain former owners of newly acquired companies have entered into standard noncompete arrangements. Subject to terms and conditions stated in these noncompete agreements, payments are generally made over a five-year period. Deferred consideration is purchase price consideration paid in the future as agreed to in the purchase agreement and is not contingent on future events. Deferred consideration is scheduled to be paid in years ranging from 5 to 20 years in either monthly, quarterly or annual installments. The remaining payments due under these noncompete and deferred consideration agreements are as follows (in thousands):
| 2013 |
$ | 8,779 | ||
| 2014 |
8,528 | |||
| 2015 |
4,545 | |||
| 2016 |
3,790 | |||
| 2017 |
3,790 | |||
| Thereafter |
13,254 | |||
|
|
|
|||
| Total scheduled payments |
42,686 | |||
| Present value adjustments |
(11,896 | ) | ||
|
|
|
|||
| Total noncompete obligations and deferred consideration |
$ | 30,790 | ||
|
|
|
Accretion on the deferred consideration and noncompete obligations is charged to interest expense.
54
Certain acquisitions require purchase consideration if specified operating results are achieved. The changes to earn-out obligations as of year-end 2012 and 2011 are as follows (in thousands):
| 2012 | 2011 | |||||||
| Beginning balance |
$ | 3,278 | $ | 13,622 | ||||
| Payments |
(215 | ) | — | |||||
| Revaluation |
(409 | ) | (10,344 | ) | ||||
|
|
|
|
|
|||||
| Ending balance |
$ | 2,654 | $ | 3,278 | ||||
|
|
|
|
|
|||||
| Current portion of earn-out obligations |
$ | 746 | $ | 1,155 | ||||
| Long-term portion of earn-out obligations |
1,908 | 2,123 | ||||||
|
|
|
|
|
|||||
| Total earn-out obligations |
$ | 2,654 | $ | 3,278 | ||||
|
|
|
|
|
|||||
| (16) | Supplemental Cash Flow Information |
Supplemental cash flow information for year-end 2012, 2011 and 2010 is as follows (in thousands):
| 2012 | 2011 | 2010 | ||||||||||
| Cash payments: |
||||||||||||
| Interest |
$ | 36,357 | $ | 41,790 | $ | 36,862 | ||||||
| Income taxes |
799 | 5,608 | 5,755 | |||||||||
| Noncash investing activities: |
||||||||||||
| Acquisitions |
$ | (10,595 | ) | $ | (27,815 | ) | $ | (177,859 | ) | |||
| (17) | Leasing Arrangements |
Rent expense, including short-term rentals, during the years ended December 29, 2012, December 31, 2011 and December 31, 2010 was $3.5 million, $4.3 million and $4.2 million, respectively.
Minimum rental commitments under long-term operating leases, which primarily relate to land, plant and equipment as of December 29, 2012, are as follows (in thousands):
| 2013 |
$ | 3,614 | ||
| 2014 |
2,807 | |||
| 2015 |
2,385 | |||
| 2016 |
1,745 | |||
| 2017 |
1,350 |
The Company has lease agreements associated with quarry facilities under which royalty payments are made. The payments are generally based on tons sold in a particular period; however, certain agreements have minimum annual payments. Royalty expense recorded in cost of revenue in for the years ended December 29, 2012, December 31, 2011 and December 31, 2010 were $3.9 million, $3.1 million and $1.0 million, respectively. Future contractual minimum commitments under royalty agreements as of December 29, 2012 are as follows (in thousands):
| 2013 |
$ | 1,593 | ||
| 2014 |
1,586 | |||
| 2015 |
1,621 | |||
| 2016 |
1,585 | |||
| 2017 |
1,659 |
| (18) | Redeemable Noncontrolling Interest |
The Company owns 100 Class A Units of Continental Cement, which represent a 70% economic interest in Continental Cement and have a preference in liquidation to the Class B Units. Continental Cement issued 100,000,000 Class B Units in May 2010, which remain outstanding. These units represent a 30% economic interest in Continental Cement and are subordinate to the Class A Units.
55
Continental Cement’s Class A Units include a cumulative distribution preference which requires, to the extent distributions are authorized by its Board of Directors, Continental Cement Class A Units receive, prior to any distributions to the Class B Unit holders, a priority return of 11% accruing daily and compounding annually on each anniversary of the date of issuance to Class A Unit holders. To the extent the priority return is not made in a given year, the amount of the priority return will increase the liquidation preference of the Class A Units up to an 80% allowable sharing percentage in distributions and liquidation proceeds. The Company holds all the Class A Units. No distributions are currently anticipated.
The Continental Cement Amended and Restated Limited Liability Company Agreement (“Subscription Agreement”) provides Summit with a call option that allows the Company to call the Class B Units held by the owners of Continental Cement prior to Summit’s purchase of the Class A Units (“Rollover Members”), at a strike price that approximates fair value, on the earlier of May 2016, on the date that Summit affects an initial public offering or upon any other change of control of Summit. The Rollover Members have a put option that allows them to put the Class B Units to Summit, at a strike price that approximates fair value, exercisable if there is a change of control of the Summit Class A Units, or after May 2016. Finally, the Subscription Agreement includes transfer restrictions which prohibit the Rollover Members from transferring their Class B Units without the consent of the Board of Continental Cement.
Because the Class B Units can be put to Continental Cement by the Rollover Members in the future based on the passage of time, which can be accelerated upon the occurrence of a contingent event, Summit’s noncontrolling interest is classified in temporary equity. The redemption value is based upon the estimated fair value of Continental Cement, which is valued using Level 3 inputs. Summit elected to accrete changes in the redemption value of the noncontrolling interest over the period from the date of issuance to the earliest anticipated redemption date of the instrument, which is currently May 2016, using an interest method. The accretion is as an adjustment to the consolidated accumulated deficit. The redemption value of the redeemable noncontrolling interest as of year-end 2012 and 2011 approximated its carrying value.
| (19) | Employee Long Term Incentive Plan |
Certain employees of the Company hold Class D unit interests in Summit Materials Holdings L.P. The Class D units provide rights to cash distributions based on a predetermined distribution formula upon the general partner of Summit Materials Holdings L.P. declaring a distribution.
Certain of the Class D units vest with the passage of time (time-vesting interests) and the remaining vest when certain investment returns are achieved by the investors of Summit Materials Holdings L.P. (performance-vesting interests). Of the time-vesting-interests, 20% vest on the first anniversary and the remaining 80% vest monthly over a period of four years following the first anniversary date. The performance-vesting interests vest when certain specified cash distribution targets are achieved by Summit Materials Holdings L.P. If the employee leaves the Company, the Company can (1) purchase the vested Class D units for a lump sum payment provided certain conditions have been met or (2) elect to convert all of the employee’s Class D units into a right to receive future distributions capped at a termination amount. The termination amount is determined as an amount equal to the fair market value of the Class D unit holder’s vested interests minus any amounts already distributed to the Class D unit holders respective of those Class D units. The fair value of the time-vesting Class D units granted in 2012, 2011 and 2010 totaled $1.1 million, $3.4 million and $11.1 million, respectively. The weighted-average grant-date fair value in 2012, 2011 and 2010 was $3,761; $3,876 and $4,110, respectively.
The following table summarizes information for Class D unit interests in Summit Materials Holdings L.P.:
| Time-vesting interests | Performance-vesting interests |
|||||||||||||||
| Number of Awards |
Weighted average grant-date fair value |
Number of Awards |
Weighted average grant-date fair value |
|||||||||||||
| Beginning balance — January 1, 2012 |
2,750 | $ | 3,949 | 4,801 | $ | 3,081 | ||||||||||
| Granted |
300 | 3,761 | 390 | 3,050 | ||||||||||||
| Vested |
(825 | ) | 3,884 | — | — | |||||||||||
| Forfeited |
(497 | ) | 4,184 | (989 | ) | 3,419 | ||||||||||
| Redeemed |
(36 | ) | 4,629 | — | — | |||||||||||
|
|
|
|
|
|||||||||||||
| Balance — December 29, 2012 |
1,692 | $ | 3,864 | 4,202 | $ | 3,087 | ||||||||||
|
|
|
|
|
|||||||||||||
56
As of year-end 2012 and 2011, the cumulative amount of units vested total 1,732 and 943, respectively. The fair value of the Class D units is estimated as of the grant date using Monte Carlo simulations, which requires the input of subjective assumptions, including the expected volatility and the expected term. The following table presents the weighted average assumptions used to estimate the fair value of grants in 2012, 2011 and 2010:
| 2012 | 2011 | 2010 | ||||
| Class D Units: |
||||||
| Risk-free interest rate |
1.62% | 1.71% – 2.39% | 1.65% – 3.47% | |||
| Dividend yield |
None | None | None | |||
| Volatility |
47% | 42% – 49% | 41% – 51% | |||
| Expected term |
6 – 8 years | 6 – 8 years | 6 – 8 years |
The risk-free rate is based on the yield at the date of grant of a U.S. Treasury security with a maturity period approximating the expected term. As the Company has no plans to issue regular dividends, a dividend yield of zero was used. The volatility assumption is based on reported data of a peer group of publically traded companies for which historical information was available adjusted for the Company’s capital structure. The expected term is based on expectations about future exercises and represents the period of time that the units granted are expected to be outstanding.
Compensation expense for time-vesting interest granted is based on the grant-date fair value. The Company recognizes these compensation costs on a straight-line basis over the service period, which is generally the vesting period of the award. A forfeiture rate assumption is factored into the compensation cost based on historical forfeitures. Compensation expense for performance-vesting interests would be recognized based on the grant date fair value. However, no compensation expense has been recognized for the performance-vesting interests, as management does not believe it is currently probable that certain investment returns, the performance criteria, will be achieved.
Share-based compensation expense, which is recognized in general and administrative expenses, totaled $2.5 million, $2.5 million and $1.2 million for the years ended December 29, 2012, December 31, 2011 and December 31, 2010, respectively. As of December 29, 2012, unrecognized compensation cost totaled $5.2 million. The weighted average remaining contractual term over which the unrecognized compensation cost is to be recognized is 3.0 years as of year-end 2012.
| (20) | Segment Information |
The Company has determined that it has three operating segments, which are its reportable segments: Central region, West region and East region. These segments are consistent with the Company’s management reporting structure. The operating results of each segment are regularly reviewed and evaluated separately by the Chief Executive Officer, the Company’s Chief Operating Decision Maker (“CODM”). The CODM primarily evaluates the performance of its segments and allocates resources to them based on segment profit, which is computed as earnings before interest, taxes, depreciation, depletion, amortization and accretion. In addition, certain items such as management fees are excluded from the calculation of segment profit.
Each region has several acquired subsidiaries that are engaged in various activities including quarry mining, aggregate production and contracting. Assets employed by segment include assets directly identified with those operations. Corporate assets consist primarily of cash, property, plant and equipment for corporate operations and other assets not directly identifiable with a reportable business segment. The accounting policies applicable to each segment are consistent with those used in the consolidated financial statements.
57
The following tables display selected financial data for the Company’s reportable business segments (in thousands):
| 2012 | 2011 | 2010 | ||||||||||
| Revenue: |
||||||||||||
| Central region |
$ | 302,113 | $ | 264,008 | $ | 211,238 | ||||||
| West region |
484,922 | 362,577 | 59,337 | |||||||||
| East region |
139,219 | 162,491 | 134,722 | |||||||||
|
|
|
|
|
|
|
|||||||
| Total revenue |
$ | 926,254 | $ | 789,076 | $ | 405,297 | ||||||
|
|
|
|
|
|
|
|||||||
| 2012 | 2011 | 2010 | ||||||||||
| Segment profit (loss): |
||||||||||||
| Central region |
$ | 65,767 | $ | 65,651 | $ | 43,639 | ||||||
| West region |
14,429 | 36,442 | (1,710 | ) | ||||||||
| East region |
10,782 | 15,504 | 7,045 | |||||||||
| Corporate and other (1) |
(15,560 | ) | (9,877 | ) | (10,396 | ) | ||||||
|
|
|
|
|
|
|
|||||||
| Total reportable segments and corporate |
75,418 | 107,720 | 38,578 | |||||||||
| Interest expense |
58,079 | 47,784 | 25,430 | |||||||||
| Depreciation, depletion, amortization and accretion |
68,290 | 61,377 | 33,870 | |||||||||
|
|
|
|
|
|
|
|||||||
| Loss from continuing operations before taxes |
$ | (50,951 | ) | $ | (1,441 | ) | $ | (20,722 | ) | |||
|
|
|
|
|
|
|
|||||||
| (1) | Corporate results primarily consist of compensation and office expenses for employees included in the Company’s headquarters and transactions costs. |
| 2012 | 2011 | 2010 | ||||||||||
| Cash paid for capital expenditures: |
||||||||||||
| Central region |
$ | 20,996 | $ | 20,078 | $ | 8,384 | ||||||
| West region |
14,993 | 9,256 | 3,512 | |||||||||
| East region |
8,736 | 9,311 | 9,114 | |||||||||
|
|
|
|
|
|
|
|||||||
| Total reportable segments |
44,725 | 38,645 | 21,010 | |||||||||
| Corporate and other |
763 | 11 | 135 | |||||||||
|
|
|
|
|
|
|
|||||||
| Total capital expenditures |
$ | 45,488 | $ | 38,656 | $ | 21,145 | ||||||
|
|
|
|
|
|
|
|||||||
| 2012 | 2011 | 2010 | ||||||||||
| Depreciation, depletion, amortization and accretion: |
||||||||||||
| Central region |
$ | 30,215 | $ | 27,646 | $ | 18,352 | ||||||
| West region |
23,771 | 19,706 | 3,971 | |||||||||
| East region |
14,223 | 13,938 | 11,507 | |||||||||
|
|
|
|
|
|
|
|||||||
| Total reportable segments |
68,209 | 61,290 | 33,830 | |||||||||
| Corporate and other |
81 | 87 | 40 | |||||||||
|
|
|
|
|
|
|
|||||||
| Total depreciation, depletion, amortization and accretion |
$ | 68,290 | $ | 61,377 | $ | 33,870 | ||||||
|
|
|
|
|
|
|
|||||||
58
| 2012 | 2011 | 2010 | ||||||||||
| Total assets: |
||||||||||||
| Central region |
$ | 610,003 | $ | 587,341 | $ | 577,808 | ||||||
| West region |
428,115 | 451,017 | 263,388 | |||||||||
| East region |
224,603 | 238,018 | 220,809 | |||||||||
|
|
|
|
|
|
|
|||||||
| Total reportable segments |
1,262,721 | 1,276,376 | 1,062,005 | |||||||||
| Corporate and other |
18,492 | 7,889 | 39,576 | |||||||||
|
|
|
|
|
|
|
|||||||
| Total assets |
$ | 1,281,213 | $ | 1,284,265 | $ | 1,101,581 | ||||||
|
|
|
|
|
|
|
|||||||
| 2012 | 2011 | 2010 | ||||||||||
| Revenue by product:* |
||||||||||||
| Aggregates |
$ | 146,991 | $ | 116,082 | $ | 69,848 | ||||||
| Asphalt |
242,458 | 182,952 | 82,338 | |||||||||
| Ready-mixed concrete |
100,941 | 94,302 | 31,756 | |||||||||
| Cement |
77,676 | 69,664 | 50,272 | |||||||||
| Construction and paving |
505,189 | 464,866 | 216,504 | |||||||||
| Other |
(147,001 | ) | (138,790 | ) | (45,421 | ) | ||||||
|
|
|
|
|
|
|
|||||||
| Total revenue |
$ | 926,254 | $ | 789,076 | $ | 405,297 | ||||||
|
|
|
|
|
|
|
|||||||
| * | Revenue by product includes intracompany sales transferred at market value. The elimination of intracompany transactions is included in Other. |
| (21) | Condensed Consolidating Financial Information |
On January 30, 2012, the Issuers issued $250.0 million aggregate principal amount of 10.5% Senior Notes due January 31, 2020 (the Senior Notes). Concurrently with the issuance of the Senior Notes, on January 30, 2012, Summit entered into a new credit facility which provided for term loans in an initial aggregate amount of $400.0 million and revolving credit commitments in an initial aggregate amount of $150.0 million (the Senior Secured Credit Facility).
Summit’s domestic wholly owned subsidiary companies (Wholly owned Guarantors) and non wholly owned subsidiary, Continental Cement (Non-Wholly owned Guarantor), are named as guarantors (collectively, the Guarantors) of the Senior Secured Credit Facility and the Senior Notes. Certain other partially owned subsidiaries do not guarantee the notes (collectively, the Non-Guarantors), which includes a subsidiary of Continental Cement. The Guarantors provide a joint and several, full and unconditional guarantee of the securities. There are no significant restrictions on the Company’s ability to obtain funds from any of the Guarantor Subsidiaries in the form of a dividend or loan. Additionally, there are no significant restrictions on a Guarantor Subsidiary’s ability to obtain funds from Summit or its direct or indirect subsidiaries.
The following condensed consolidating balance sheets, statements of operations and statements of cash flows are provided for the Company, the Wholly owned Guarantors, the Non-Wholly owned Guarantor and the Non Guarantors. Summit Materials Finance Corp as a co-issuer of the Senior Notes had no transactions during 2012 or assets as of December 29, 2012. Earnings from subsidiaries are included in other income in the condensed consolidated statements of operations below. The financial information may not necessarily be indicative of results of operations and comprehensive income, cash flows or financial position had the guarantor or nonguarantor subsidiaries operated as independent entities.
59
SUMMIT MATERIALS, LLC AND SUBSIDIARIES
Notes to Consolidated Financial Statements
December 29, 2012 and December 31, 2011
Condensed Consolidating Balance Sheets
December 29, 2012
| Summit Materials, LLC (Parent) |
Non wholly owned Guarantor |
Wholly owned Guarantors |
Non Guarantors |
Eliminations | Consolidated | |||||||||||||||||||
| Assets | ||||||||||||||||||||||||
| Current assets: |
||||||||||||||||||||||||
| Cash |
$ | 697 | $ | 397 | $ | 30,981 | $ | 680 | $ | (5,324 | ) | $ | 27,431 | |||||||||||
| Accounts receivable, net |
— | 7,421 | 90,765 | 3,255 | (1,143 | ) | 100,298 | |||||||||||||||||
| Intercompany receivables |
14,931 | 15,557 | 9,018 | — | (39,506 | ) | — | |||||||||||||||||
| Cost and estimated earnings in excess of billings |
— | — | 11,428 | 147 | — | 11,575 | ||||||||||||||||||
| Inventories |
— | 7,073 | 84,555 | 1,349 | — | 92,977 | ||||||||||||||||||
| Other current assets |
25 | 726 | 8,447 | 2,409 | (1,539 | ) | 10,068 | |||||||||||||||||
|
|
|
|
|
|
|
|
|
|
|
|
|
|||||||||||||
| Total current assets |
15,653 | 31,174 | 235,194 | 7,840 | (47,512 | ) | 242,349 | |||||||||||||||||
| Property, plant and equipment, net |
1,074 | 287,677 | 517,994 | 6,862 | — | 813,607 | ||||||||||||||||||
| Investments in affiliates |
374,528 | 1,779 | 147,658 | 722 | (511,698 | ) | 12,989 | |||||||||||||||||
| Goodwill |
— | 23,124 | 155,024 | 972 | — | 179,120 | ||||||||||||||||||
| Intangible assets, net |
— | 742 | 7,864 | — | — | 8,606 | ||||||||||||||||||
| Other assets |
53 | 10,112 | 13,784 | 593 | — | 24,542 | ||||||||||||||||||
|
|
|
|
|
|
|
|
|
|
|
|
|
|||||||||||||
| Total assets |
$ | 391,308 | $ | 354,608 | $ | 1,077,518 | $ | 16,989 | $ | (559,210 | ) | $ | 1,281,213 | |||||||||||
|
|
|
|
|
|
|
|
|
|
|
|
|
|||||||||||||
| Liabilities, Redeemable Noncontrolling Interest and Member’s Interest | ||||||||||||||||||||||||
| Current liabilities: |
||||||||||||||||||||||||
| Current portion of debt |
$ | — | $ | 965 | $ | 3,035 | $ | — | $ | — | $ | 4,000 | ||||||||||||
| Current portion of acquisition-related liabilities |
— | — | 9,525 | — | — | 9,525 | ||||||||||||||||||
| Accounts payable |
2,745 | 6,715 | 51,179 | 2,138 | (1,143 | ) | 61,634 | |||||||||||||||||
| Accrued expenses |
6,877 | 10,742 | 38,050 | 1,015 | (6,862 | ) | 49,822 | |||||||||||||||||
| Intercompany payables |
— | — | 33,396 | 6,110 | (39,506 | ) | — | |||||||||||||||||
| Billings in excess of cost and estimated earnings |
— | — | 6,656 | 270 | — | 6,926 | ||||||||||||||||||
|
|
|
|
|
|
|
|
|
|
|
|
|
|||||||||||||
| Total current liabilities |
9,622 | 18,422 | 141,841 | 9,533 | (47,511 | ) | 131,907 | |||||||||||||||||
| Long-term debt |
— | 155,394 | 480,449 | — | — | 635,843 | ||||||||||||||||||
| Acquisition-related liabilities |
— | — | 23,919 | — | — | 23,919 | ||||||||||||||||||
| Other noncurrent liabilities |
395 | 27,091 | 56,780 | — | — | 84,266 | ||||||||||||||||||
|
|
|
|
|
|
|
|
|
|
|
|
|
|||||||||||||
| Total liabilities |
10,017 | 200,907 | 702,989 | 9,533 | (47,511 | ) | 875,935 | |||||||||||||||||
| Redeemable noncontrolling interest |
— | — | — | — | 22,850 | 22,850 | ||||||||||||||||||
| Redeemable members’ interest |
— | 22,850 | — | — | (22,850 | ) | — | |||||||||||||||||
| Total member’s interest |
381,291 | 130,851 | 374,529 | 7,456 | (511,699 | ) | 382,428 | |||||||||||||||||
|
|
|
|
|
|
|
|
|
|
|
|
|
|||||||||||||
| Total liabilities, redeemable noncontrolling interest and member’s interest |
$ | 391,308 | $ | 354,608 | $ | 1,077,518 | $ | 16,989 | $ | (559,210 | ) | $ | 1,281,213 | |||||||||||
|
|
|
|
|
|
|
|
|
|
|
|
|
|||||||||||||
60
SUMMIT MATERIALS, LLC AND SUBSIDIARIES
Notes to Consolidated Financial Statements
December 29, 2012 and December 31, 2011
Condensed Consolidating Balance Sheets
December 31, 2011
| Summit Materials, LLC (Parent) |
Non wholly owned Guarantor |
Wholly owned Guarantors |
Non Guarantors |
Eliminations | Consolidated | |||||||||||||||||||
| Assets | ||||||||||||||||||||||||
| Current assets: |
||||||||||||||||||||||||
| Cash |
$ | 6,701 | $ | 8 | $ | 33,997 | $ | 2,084 | $ | — | $ | 42,790 | ||||||||||||
| Accounts receivable, net |
— | 5,419 | 97,010 | 3,059 | (255 | ) | 105,233 | |||||||||||||||||
| Intercompany receivables |
6,819 | 7,330 | 17,341 | — | (31,490 | ) | — | |||||||||||||||||
| Cost and estimated earnings in excess of billings |
— | — | 18,425 | 81 | — | 18,506 | ||||||||||||||||||
| Inventories |
— | 9,914 | 73,832 | 517 | — | 84,263 | ||||||||||||||||||
| Other current assets |
124 | 770 | 11,591 | 185 | (288 | ) | 12,382 | |||||||||||||||||
|
|
|
|
|
|
|
|
|
|
|
|
|
|||||||||||||
| Total current assets |
13,644 | 23,441 | 252,196 | 5,926 | (32,033 | ) | 263,174 | |||||||||||||||||
| Property, plant and equipment, net |
393 | 285,305 | 528,640 | 7,565 | — | 821,903 | ||||||||||||||||||
| Investments in affiliates |
431,317 | — | 148,154 | 622 | (566,970 | ) | 13,123 | |||||||||||||||||
| Goodwill |
— | 23,124 | 129,279 | 972 | — | 153,375 | ||||||||||||||||||
| Intangible assets, net |
— | 842 | 8,337 | — | — | 9,179 | ||||||||||||||||||
| Other assets |
— | 11,050 | 12,006 | 455 | — | 23,511 | ||||||||||||||||||
|
|
|
|
|
|
|
|
|
|
|
|
|
|||||||||||||
| Total assets |
$ | 445,354 | $ | 343,762 | $ | 1,078,612 | $ | 15,540 | $ | (599,003 | ) | $ | 1,284,265 | |||||||||||
|
|
|
|
|
|
|
|
|
|
|
|
|
|||||||||||||
| Liabilities, Redeemable Noncontrolling Interest and Member’s Interest | ||||||||||||||||||||||||
| Current liabilities: |
||||||||||||||||||||||||
| Current portion of debt |
$ | — | $ | — | $ | 7,960 | $ | — | $ | — | $ | 7,960 | ||||||||||||
| Current portion of acquisition-related liabilities |
— | — | 8,465 | — | — | 8,465 | ||||||||||||||||||
| Accounts payable |
1,903 | 8,012 | 59,162 | 2,252 | (1,686 | ) | 69,643 | |||||||||||||||||
| Accrued expenses |
6,607 | 5,354 | 21,587 | 741 | (294 | ) | 33,995 | |||||||||||||||||
| Intercompany payables |
— | — | 22,721 | 7,330 | (30,051 | ) | — | |||||||||||||||||
| Billings in excess of cost and estimated earnings |
— | — | 4,318 | 18 | — | 4,336 | ||||||||||||||||||
|
|
|
|
|
|
|
|
|
|
|
|
|
|||||||||||||
| Total current liabilities |
8,510 | 13,366 | 124,213 | 10,341 | (32,031 | ) | 124,399 | |||||||||||||||||
| Long-term debt |
— | 153,980 | 447,041 | — | — | 601,021 | ||||||||||||||||||
| Acquisition-related liabilities |
— | — | 20,238 | — | — | 20,238 | ||||||||||||||||||
| Other noncurrent liabilities |
472 | 24,374 | 55,803 | 286 | — | 80,935 | ||||||||||||||||||
|
|
|
|
|
|
|
|
|
|
|
|
|
|||||||||||||
| Total liabilities |
8,982 | 191,720 | 647,295 | 10,627 | (32,031 | ) | 826,593 | |||||||||||||||||
| Redeemable noncontrolling interest |
— | — | — | — | 21,300 | 21,300 | ||||||||||||||||||
| Redeemable members’ interest |
— | 22,250 | — | — | (22,250 | ) | — | |||||||||||||||||
| Total member’s interest |
436,372 | 129,792 | 431,317 | 4,913 | (566,022 | ) | 436,372 | |||||||||||||||||
|
|
|
|
|
|
|
|
|
|
|
|
|
|||||||||||||
| Total liabilities, redeemable noncontrolling interest and member’s interest |
$ | 445,354 | $ | 343,762 | $ | 1,078,612 | $ | 15,540 | $ | (599,003 | ) | $ | 1,284,265 | |||||||||||
|
|
|
|
|
|
|
|
|
|
|
|
|
|||||||||||||
61
SUMMIT MATERIALS, LLC AND SUBSIDIARIES
Notes to Consolidated Financial Statements
December 29, 2012 and December 31, 2011
Condensed Consolidating Statements of Operations and Comprehensive (Loss) Income
Year ended December 29, 2012
| Summit Materials LLC (Parent) |
Non- Wholly- owned Guarantor |
Wholly- owned Guarantors |
Non- Guarantors |
Elim- inations |
Consol- idated |
|||||||||||||||||||
| Revenue |
$ | — | $ | 81,516 | $ | 824,796 | $ | 33,074 | $ | (13,132 | ) | $ | 926,254 | |||||||||||
|
|
|
|
|
|
|
|
|
|
|
|
|
|||||||||||||
| Cost of revenue (excluding items shown separately below) |
— | 58,319 | 649,577 | 18,582 | (13,132 | ) | 713,346 | |||||||||||||||||
| General and administrative expenses |
8 | 6,235 | 119,645 | 1,327 | — | 127,215 | ||||||||||||||||||
| Depreciation, depletion, amortization and accretion |
81 | 10,093 | 57,080 | 1,036 | — | 68,290 | ||||||||||||||||||
| Transaction costs |
— | — | 1,988 | — | — | 1,988 | ||||||||||||||||||
|
|
|
|
|
|
|
|
|
|
|
|
|
|||||||||||||
| Operating (loss) income |
(89 | ) | 6,869 | (3,494 | ) | 12,129 | — | 15,415 | ||||||||||||||||
| Other expense (income), net |
52,400 | (2,065 | ) | 6,630 | (101 | ) | (48,577 | ) | 8,287 | |||||||||||||||
| Interest expense |
— | 12,045 | 47,293 | 633 | (1,892 | ) | 58,079 | |||||||||||||||||
|
|
|
|
|
|
|
|
|
|
|
|
|
|||||||||||||
| (Loss) income from continuing operations before taxes |
(52,489 | ) | (3,111 | ) | (57,417 | ) | 11,597 | 50,469 | (50,951 | ) | ||||||||||||||
| Income tax expense |
5 | — | (3,925 | ) | — | — | (3,920 | ) | ||||||||||||||||
|
|
|
|
|
|
|
|
|
|
|
|
|
|||||||||||||
| (Loss) income from continuing operations |
(52,494 | ) | (3,111 | ) | (53,492 | ) | 11,597 | 50,469 | (47,031 | ) | ||||||||||||||
| Loss from discontinued operations |
— | — | 3,546 | — | — | 3,546 | ||||||||||||||||||
|
|
|
|
|
|
|
|
|
|
|
|
|
|||||||||||||
| Net (loss) income |
(52,494 | ) | (3,111 | ) | (57,038 | ) | 11,597 | 50,469 | (50,577 | ) | ||||||||||||||
| Net income attributable to noncontrolling interest |
— | — | — | — | 1,919 | 1,919 | ||||||||||||||||||
|
|
|
|
|
|
|
|
|
|
|
|
|
|||||||||||||
| Net (loss) income attributable to member of Summit Materials, LLC |
$ | (52,494 | ) | $ | (3,111 | ) | $ | (57,038 | ) | $ | 11,597 | $ | 48,550 | $ | (52,496 | ) | ||||||||
|
|
|
|
|
|
|
|
|
|
|
|
|
|||||||||||||
| Comprehensive (loss) income attributable to member of Summit Materials, LLC |
$ | (52,494 | ) | $ | (6,759 | ) | $ | (57,038 | ) | $ | 11,597 | $ | 49,645 | $ | (55,049 | ) | ||||||||
|
|
|
|
|
|
|
|
|
|
|
|
|
|||||||||||||
62
SUMMIT MATERIALS, LLC AND SUBSIDIARIES
Notes to Consolidated Financial Statements
December 29, 2012 and December 31, 2011
Condensed Consolidating Statements of Operations and Comprehensive (Loss) Income
Year ended December 31, 2011
| Summit Materials LLC (Parent) |
Non- Wholly- owned Guarantor |
Wholly- owned Guarantors |
Non- Guarantors |
Elim- inations |
Consol- idated |
|||||||||||||||||||
| Revenue |
$ | — | $ | 70,064 | $ | 700,916 | $ | 21,566 | $ | (3,470 | ) | $ | 789,076 | |||||||||||
|
|
|
|
|
|
|
|
|
|
|
|
|
|||||||||||||
| Cost of revenue (excluding items shown separately below) |
— | 41,221 | 542,699 | 17,204 | (3,470 | ) | 597,654 | |||||||||||||||||
| General and administrative expenses |
1,453 | 3,933 | 89,011 | 1,429 | — | 95,826 | ||||||||||||||||||
| Depreciation, depletion, amortization and accretion |
87 | 9,697 | 50,640 | 953 | — | 61,377 | ||||||||||||||||||
| Transaction costs |
— | — | 9,120 | — | — | 9,120 | ||||||||||||||||||
|
|
|
|
|
|
|
|
|
|
|
|
|
|||||||||||||
| Operating (loss) income |
(1,540 | ) | 15,213 | 9,446 | 1,980 | — | 25,099 | |||||||||||||||||
| Other expense (income), net |
8,510 | (61 | ) | (24,375 | ) | 124 | (5,442 | ) | (21,244 | ) | ||||||||||||||
| Interest expense |
— | 14,004 | 33,685 | 647 | (552 | ) | 47,784 | |||||||||||||||||
|
|
|
|
|
|
|
|
|
|
|
|
|
|||||||||||||
| (Loss) income from continuing operations before taxes |
(10,050 | ) | 1,270 | 136 | 1,209 | 5,994 | (1,441 | ) | ||||||||||||||||
| Income tax expense |
— | — | 3,408 | — | — | 3,408 | ||||||||||||||||||
|
|
|
|
|
|
|
|
|
|
|
|
|
|||||||||||||
| (Loss) income from continuing operations |
(10,050 | ) | 1,270 | (3,272 | ) | 1,209 | 5,994 | (4,849 | ) | |||||||||||||||
| Loss from discontinued operations |
— | — | 5,201 | — | — | 5,201 | ||||||||||||||||||
|
|
|
|
|
|
|
|
|
|
|
|
|
|||||||||||||
| Net (loss) income |
(10,050 | ) | 1,270 | (8,473 | ) | 1,209 | 5,994 | (10,050 | ) | |||||||||||||||
| Net income attributable to noncontrolling interest |
695 | — | 695 | — | (695 | ) | 695 | |||||||||||||||||
|
|
|
|
|
|
|
|
|
|
|
|
|
|||||||||||||
| Net (loss) income attributable to member of Summit Materials, LLC |
$ | (10,745 | ) | $ | 1,270 | $ | (9,168 | ) | $ | 1,209 | $ | 6,689 | $ | (10,745 | ) | |||||||||
|
|
|
|
|
|
|
|
|
|
|
|
|
|||||||||||||
| Comprehensive (loss) income attributable to member of Summit Materials, LLC |
$ | (9,375 | ) | $ | (4,405 | ) | $ | (13,473 | ) | $ | 1,209 | $ | 10,994 | $ | (15,050 | ) | ||||||||
|
|
|
|
|
|
|
|
|
|
|
|
|
|||||||||||||
63
SUMMIT MATERIALS, LLC AND SUBSIDIARIES
Notes to Consolidated Financial Statements
December 29, 2012 and December 31, 2011
Condensed Consolidating Statements of Operations and Comprehensive (Loss) Income
Year ended December 31, 2010
| Summit Materials LLC (Parent) |
Non- Wholly- owned Guarantor |
Wholly- owned Guarantors |
Non- Guarantors |
Elim- inations |
Consol- idated |
|||||||||||||||||||
| Revenue |
$ | — | $ | 50,597 | $ | 340,975 | $ | 14,052 | $ | (327 | ) | $ | 405,297 | |||||||||||
|
|
|
|
|
|
|
|
|
|
|
|
|
|||||||||||||
| Cost of revenue (excluding items shown separately below) |
— | 30,424 | 242,616 | 11,623 | (327 | ) | 284,336 | |||||||||||||||||
| General and administrative expenses |
4,604 | 1,402 | 41,315 | 1,236 | — | 48,557 | ||||||||||||||||||
| Depreciation, depletion, amortization and accretion |
40 | 5,258 | 27,847 | 725 | — | 33,870 | ||||||||||||||||||
| Transaction costs |
1,712 | 5,671 | 14,885 | — | — | 22,268 | ||||||||||||||||||
|
|
|
|
|
|
|
|
|
|
|
|
|
|||||||||||||
| Operating (loss) income |
(6,356 | ) | 7,842 | 14,312 | 468 | — | 16,266 | |||||||||||||||||
| Other expense (income), net |
17,507 | (141 | ) | 12,132 | 18 | (17,958 | ) | 11,558 | ||||||||||||||||
| Interest expense |
— | 7,799 | 17,213 | 418 | — | 25,430 | ||||||||||||||||||
|
|
|
|
|
|
|
|
|
|
|
|
|
|||||||||||||
| (Loss) income from continuing operations before taxes |
(23,863 | ) | 184 | (15,033 | ) | 32 | 17,958 | (20,722 | ) | |||||||||||||||
| Income tax expense |
— | — | 2,363 | — | — | 2,363 | ||||||||||||||||||
|
|
|
|
|
|
|
|
|
|
|
|
|
|||||||||||||
| (Loss) income from continuing operations |
(23,863 | ) | 184 | (17,396 | ) | 32 | 17,958 | (23,085 | ) | |||||||||||||||
| Loss from discontinued operations |
— | — | 778 | — | — | 778 | ||||||||||||||||||
|
|
|
|
|
|
|
|
|
|
|
|
|
|||||||||||||
| Net (loss) income |
(23,863 | ) | 184 | (18,174 | ) | 32 | 17,958 | (23,863 | ) | |||||||||||||||
| Net income attributable to noncontrolling interest |
86 | — | 86 | — | (86 | ) | 86 | |||||||||||||||||
|
|
|
|
|
|
|
|
|
|
|
|
|
|||||||||||||
| Net (loss) income attributable to member of Summit Materials, LLC |
$ | (23,949 | ) | $ | 184 | $ | (18,260 | ) | $ | 32 | $ | 18,044 | $ | (23,949 | ) | |||||||||
|
|
|
|
|
|
|
|
|
|
|
|
|
|||||||||||||
| Comprehensive (loss) income attributable to member of Summit Materials, LLC |
$ | (23,513 | ) | $ | (2,524 | ) | $ | (20,532 | ) | $ | 32 | $ | 20,316 | $ | (26,221 | ) | ||||||||
|
|
|
|
|
|
|
|
|
|
|
|
|
|||||||||||||
64
SUMMIT MATERIALS, LLC AND SUBSIDIARIES
Notes to Consolidated Financial Statements
December 29, 2012 and December 31, 2011
Condensed Consolidating Statements of Cash Flows
Year ended December 29, 2012
| Summit Materials, LLC (Parent) |
Non wholly owned Guarantor |
Wholly owned Guarantors |
Non Guarantors |
Eliminations | Consolidated | |||||||||||||||||||
| Net cash provided by operating activities |
$ | 4,845 | $ | 12,806 | $ | 36,649 | $ | 8,217 | $ | (238 | ) | $ | 62,279 | |||||||||||
|
|
|
|
|
|
|
|
|
|
|
|
|
|||||||||||||
| Cash flow from investing activities: |
||||||||||||||||||||||||
| Acquisitions — net of cash acquired |
— | — | (48,757 | ) | — | — | (48,757 | ) | ||||||||||||||||
| Purchases of property, plant and equipment |
(762 | ) | (12,174 | ) | (31,818 | ) | (734 | ) | — | (45,488 | ) | |||||||||||||
| Proceeds from the sale of property, plant and equipment |
— | 69 | 8,577 | 190 | — | 8,836 | ||||||||||||||||||
| Other |
— | — | 69 | — | — | 69 | ||||||||||||||||||
|
|
|
|
|
|
|
|
|
|
|
|
|
|||||||||||||
| Net cash used for investing activities |
(762 | ) | (12,105 | ) | (71,929 | ) | (544 | ) | — | (85,340 | ) | |||||||||||||
|
|
|
|
|
|
|
|
|
|
|
|
|
|||||||||||||
| Cash flow from financing activities: |
||||||||||||||||||||||||
| Net proceeds from debt issuance |
713,378 | (17 | ) | — | — | — | 713,361 | |||||||||||||||||
| Loans received from and payments made on loans from other Summit Companies |
(25,371 | ) | (295 | ) | 39,783 | (8,793 | ) | (5,324 | ) | — | ||||||||||||||
| Payments on long-term debt |
(697,438 | ) | — | — | — | — | (697,438 | ) | ||||||||||||||||
| Payments on acquisition-related liabilities |
— | — | (7,519 | ) | — | — | (7,519 | ) | ||||||||||||||||
| Other |
(656 | ) | — | — | (284 | ) | 238 | (702 | ) | |||||||||||||||
|
|
|
|
|
|
|
|
|
|
|
|
|
|||||||||||||
| Net cash (used for) provided by financing activities |
(10,087 | ) | (312 | ) | 32,264 | (9,077 | ) | (5,086 | ) | 7,702 | ||||||||||||||
|
|
|
|
|
|
|
|
|
|
|
|
|
|||||||||||||
| Net increase (decrease) in cash |
(6,004 | ) | 389 | (3,016 | ) | (1,404 | ) | (5,324 | ) | (15,359 | ) | |||||||||||||
| Cash — beginning of period |
6,701 | 8 | 33,997 | 2,084 | — | 42,790 | ||||||||||||||||||
|
|
|
|
|
|
|
|
|
|
|
|
|
|||||||||||||
| Cash — end of period |
$ | 697 | $ | 397 | $ | 30,981 | $ | 680 | $ | (5,324 | ) | $ | 27,431 | |||||||||||
|
|
|
|
|
|
|
|
|
|
|
|
|
|||||||||||||
65
SUMMIT MATERIALS, LLC AND SUBSIDIARIES
Notes to Consolidated Financial Statements
December 29, 2012 and December 31, 2011
Condensed Consolidating Statements of Cash Flows
Year ended December 31, 2011
| Summit Materials, LLC (Parent) |
Non wholly owned Guarantor |
Wholly owned Guarantors |
Non Guarantors |
Eliminations | Consolidated | |||||||||||||||||||
| Net cash (used in) provided by operating activities |
$ | (824 | ) | $ | 3,808 | $ | 17,262 | $ | 2,586 | $ | 421 | $ | 23,253 | |||||||||||
|
|
|
|
|
|
|
|
|
|
|
|
|
|||||||||||||
| Cash flows from investing activities: |
||||||||||||||||||||||||
| Acquisitions — net of cash acquired |
— | — | (161,073 | ) | — | — | (161,073 | ) | ||||||||||||||||
| Proceeds from the sale of investments |
— | — | 377 | (136 | ) | — | 241 | |||||||||||||||||
| Purchases of property, plant and equipment |
(11 | ) | (5,933 | ) | (31,210 | ) | (1,502 | ) | — | (38,656 | ) | |||||||||||||
| Proceeds from the sale of property, plant and equipment |
— | 168 | 6,880 | 109 | — | 7,157 | ||||||||||||||||||
| Cash contribution to affiliates |
(135,530 | ) | — | — | — | 135,530 | — | |||||||||||||||||
|
|
|
|
|
|
|
|
|
|
|
|
|
|||||||||||||
| Net cash used for investing activities |
(135,541 | ) | (5,765 | ) | (185,026 | ) | (1,529 | ) | 135,530 | (192,331 | ) | |||||||||||||
|
|
|
|
|
|
|
|
|
|
|
|
|
|||||||||||||
| Cash flow from financing activities: |
||||||||||||||||||||||||
| Proceeds from investment by member |
103,630 | — | 135,530 | 421 | (135,951 | ) | 103,630 | |||||||||||||||||
| Net proceeds from debt issuance |
— | 36,456 | 60,292 | — | — | 96,748 | ||||||||||||||||||
| Payments on long-term debt |
— | (34,500 | ) | (14,500 | ) | — | — | (49,000 | ) | |||||||||||||||
| Payments on acquisition-related liabilities |
— | — | (4,593 | ) | — | — | (4,593 | ) | ||||||||||||||||
| Payment of dividends |
— | — | — | (10 | ) | — | (10 | ) | ||||||||||||||||
|
|
|
|
|
|
|
|
|
|
|
|
|
|||||||||||||
| Net cash provided by (used for) financing activities |
103,630 | 1,956 | 176,729 | 411 | (135,951 | ) | 146,775 | |||||||||||||||||
|
|
|
|
|
|
|
|
|
|
|
|
|
|||||||||||||
| Net (decrease) increase in cash |
(32,735 | ) | (1 | ) | 8,965 | 1,468 | — | (22,303 | ) | |||||||||||||||
| Cash — beginning of period |
39,436 | 9 | 25,032 | 616 | — | 65,093 | ||||||||||||||||||
|
|
|
|
|
|
|
|
|
|
|
|
|
|||||||||||||
| Cash — end of period |
$ | 6,701 | $ | 8 | $ | 33,997 | $ | 2,084 | $ | — | $ | 42,790 | ||||||||||||
|
|
|
|
|
|
|
|
|
|
|
|
|
|||||||||||||
66
SUMMIT MATERIALS, LLC AND SUBSIDIARIES
Notes to Consolidated Financial Statements
December 29, 2012 and December 31, 2011
Condensed Consolidating Statements of Cash Flows
Year ended December 31, 2010
| Summit Materials, LLC (Parent) |
Non wholly owned Guarantor |
Wholly owned Guarantors |
Non Guarantors |
Eliminations | Consolidated | |||||||||||||||||||
| Net cash (used in) provided by operating activities |
$ | (669 | ) | $ | (12,379 | ) | $ | (8,626 | ) | $ | 1,145 | $ | — | $ | (20,529 | ) | ||||||||
|
|
|
|
|
|
|
|
|
|
|
|
|
|||||||||||||
| Cash flows from investing activities: |
||||||||||||||||||||||||
| Acquisitions — net of cash acquired |
— | — | (482,333 | ) | — | — | (482,333 | ) | ||||||||||||||||
| Proceeds from the sale of investments |
— | — | — | — | — | — | ||||||||||||||||||
| Purchases of property, plant and equipment |
(135 | ) | (5,334 | ) | (15,312 | ) | (364 | ) | — | (21,145 | ) | |||||||||||||
| Proceeds from the sale of property, plant and equipment |
— | 475 | 4,162 | 63 | — | 4,700 | ||||||||||||||||||
| Cash contribution to affiliates |
(336,280 | ) | — | (135,000 | ) | — | 471,280 | — | ||||||||||||||||
| Other |
— | — | — | (603 | ) | — | (603 | ) | ||||||||||||||||
|
|
|
|
|
|
|
|
|
|
|
|
|
|||||||||||||
| Net cash (used for) provided by investing activities |
(336,415 | ) | (4,859 | ) | (628,483 | ) | (904 | ) | 471,280 | (499,381 | ) | |||||||||||||
|
|
|
|
|
|
|
|
|
|
|
|
|
|||||||||||||
| Cash flow from financing activities: |
||||||||||||||||||||||||
| Proceeds from investment by member |
338,639 | 135,000 | 336,280 | — | (471,280 | ) | 338,639 | |||||||||||||||||
| Net proceeds from debt issuance |
37,478 | 7,300 | 439,383 | 1,212 | — | 485,373 | ||||||||||||||||||
| Payments on long-term debt |
— | (125,053 | ) | (120,202 | ) | (600 | ) | — | (245,855 | ) | ||||||||||||||
| Payments on acquisition-related liabilities |
— | — | (2,721 | ) | — | — | (2,721 | ) | ||||||||||||||||
| Payment of dividends |
— | — | 190 | (237 | ) | — | (47 | ) | ||||||||||||||||
|
|
|
|
|
|
|
|
|
|
|
|
|
|||||||||||||
| Net cash provided by (used for) financing activities |
376,117 | 17,247 | 652,930 | 375 | (471,280 | ) | 575,389 | |||||||||||||||||
|
|
|
|
|
|
|
|
|
|
|
|
|
|||||||||||||
| Net (decrease) increase in cash |
39,033 | 9 | 15,821 | 616 | — | 55,479 | ||||||||||||||||||
| Cash — beginning of period |
403 | — | 9,211 | — | — | 9,614 | ||||||||||||||||||
|
|
|
|
|
|
|
|
|
|
|
|
|
|||||||||||||
| Cash — end of period |
$ | 39,436 | $ | 9 | $ | 25,032 | $ | 616 | $ | — | $ | 65,093 | ||||||||||||
|
|
|
|
|
|
|
|
|
|
|
|
|
|||||||||||||
67
| (22) | Subsequent Events |
The Company initially evaluated its December 29, 2012 consolidated financial statements for subsequent events through March 27, 2013, the date the financial statements were available to be issued, and through December 11, 2013, the date the revised financial statements were available to be issued.
On February 5, 2013, the Company entered into an amendment to its existing Senior Notes and Senior Secured Credit Facility (Amendment No. 1). On February 7, 2013, the Company entered into a Tranche A Revolving Credit Commitment Conversion Agreement. The terms of Amendment No.1 include the following:
| • | reduction in the applicable margins used to calculate interest rates for term loans and $131.0 million of the $150.0 million revolving credit loans by 1.0%; |
| • | increase in the principal amount of the term loans borrowed by $25.0 million with the same terms as the existing term loans; |
| • | a requirement that the Company pay a fee equal to 1.0% of the principal amount of term loans repaid in connection with certain repricing or refinancing transactions within six months after February 5, 2013; and |
| • | additional flexibility under the financial maintenance covenants, which are tested quarterly, by increasing the applicable maximum Consolidated Net Leverage Ratio and reducing the applicable minimum Interest Coverage Ratio. |
On April 1, 2013, the Company acquired certain of Lafarge North America, Inc.’s assets in Wichita, Kansas and all of the membership interests of Westroc, LLC near Salt Lake City, Utah. These acquisitions were funded through borrowings on the revolving credit facility.
* * * * *
68