Attached files
| file | filename |
|---|---|
| 8-K - CURRENT REPORT - RED MOUNTAIN RESOURCES, INC. | rmr-8k_121113.htm |

1
2 Contact Information & Disclaimer This
presentation does not constitute an offer to sell or a solicitation of an offer to buy securities nor does it constitute an offer or solicitation In any jurisdiction in which such offer, solicitation or sale would be unlawful prior to registration or qualification under the securities laws of any such jurisdiction . Any such offer may only be made pursuant to a registration s tatement or pursuant to an exemption from registration, if available . No general solicitation whatsoever is made or intended hereby . Cautionary Notice Regarding Forward - Looking Statements In addition to statements of historical fact, this presentation contains forward - looking statements . The presentation of outlooks, projections, estimates, targets and other forward - looking information in this presentation is subject to a number of risks and uncertainties that could cause actual results to differ materially from those reflected in such statements . Readers are cautioned not to place undue reliance on these forward - looking statements, which reflect management’s analysis only as of the date hereof . Without limiting the generality of the foregoing, words such as “may,” “will,” “expect,” “believe,” “anticipate,” “intend,” or “could” or the negative variations thereof or comparable terminology are intended to identify forward - looking statements . These forward - looking statements are s

2 Contact Information & Disclaimer This presentation does not constitute an offer to sell or a solicitation of an offer to buy securities nor does it constitute an offer or solicitation In any jurisdiction in which such offer, solicitation or sale would be unlawful prior to registration or qualification under the securities laws of any such jurisdiction . Any such offer may only be made pursuant to a registration s tatement or pursuant to an exemption from registration, if available . No general solicitation whatsoever is made or intended hereby . Cautionary Notice Regarding Forward - Looking Statements In addition to statements of historical fact, this presentation contains forward - looking statements . The presentation of outlooks, projections, estimates, targets and other forward - looking information in this presentation is subject to a number of risks and uncertainties that could cause actual results to differ materially from those reflected in such statements . Readers are cautioned not to place undue reliance on these forward - looking statements, which reflect management’s analysis only as of the date hereof . Without limiting the generality of the foregoing, words such as “may,” “will,” “expect,” “believe,” “anticipate,” “intend,” or “could” or the negative variations thereof or comparable terminology are intended to identify forward - looking statements . These forward - looking statements are subject to numerous assumptions, risks and uncertainties that may cause actual results to be materially different from any future results expressed or implied in those statements . Risks and uncertainties that could prevent the Company from achieving any stated goals include, but are not limited to, the following : • volatility or decline of our stock price ; • potential fluctuation in annual or quarterly results ; • dilution related to additional issuances of securities ; • declines or volatility in the prices we receive for our oil and natural gas ; • general economic conditions, whether internationally, nationally or in the regional and local market areas in which we do business ; • our ability to generate sufficient cash flow from operations, borrowings or other sources to enable us to fully develop our oil and natural gas properties ; • risks associated with drilling, including completion risks, cost overruns and the drilling of non - economic wells or dry holes ; • uncertainties associated with estimates of proved oil and natural gas reserves ; • the presence or recoverability of estimated oil and natural gas reserves and the actual future production rates and associated costs ; • risks and liabilities associated with acquired companies and properties ; • risks related to integration of acquired companies and properties ; • potential defects in title to our properties ; • our ability to raise additional capital to fund future capital expenditures ; • cost and availability of drilling rigs, equipment, supplies, personnel and oilfield services ; • geological concentration of our reserves ; • environmental or other governmental regulations, including legislation of hydraulic fracture stimulation and elimination of income tax incentives available to our industry ; • our ability to secure firm transportation for oil and natural gas we produce and to sell the oil and natural gas at market prices ; • exploration and development risks ; • management’s ability to execute our plans to meet our goals ; • our ability to retain key members of our management team ; • weather conditions ; • actions or inactions of third - party operators of our properties ; • costs and liabilities associated with environmental, health and safety laws ; • o ur ability to find and retain skilled personnel ; • operating hazards attendant to the oil and natural gas business ; and • competition in the oil and natural gas industry . The Company undertakes no obligation to publicly revise these forward - looking statements to reflect events or circumstances that arise after the date hereof, except as required by applicable law . The financial and operating projections contained in this presentation represent our reasonable estimates as of the date of this presentation . Neither our auditors nor any other third party has examined, reviewed or compiled the projections and, accordingly, none of the foregoing expresses an opinion or other form of assurance with respect thereto . The assumptions upon which the projections are based are described in more detail herein . Some of these assumptions inevitably will not materialize, and unanticipated events may occur that could affect our results . Therefore, our actual results achieved during the periods covered by the projections will vary from the projected results . Prospective investors are cautioned not to place undue reliance on the projections included herein . Pro forma production data reflects the acquisition of Cross Border Resources, Inc . (OTCQB : XBOR) (“Cross Border”) as if it occurred on June 1 , 2012 . As of September 30 , 2013 , RMR owned 83 . 3 % of the outstanding common stock of Cross Border . Red Mountain Resources, Inc. 2515 McKinney Avenue Suite 900 Dallas, TX 75201 P: 214.871.0400 F: 214.871.0406 W: www.redmountainresources.com E: info@redmountainresources.com Investor Relations Contact Michael R. Uffman Chief Financial Officer michael@redmountainresources.com
ubject to numerous assumptions, risks and uncertainties that may cause actual results to be materially different from any future results expressed or implied in those statements . Risks and uncertainties that could prevent the Company from achieving any stated goals include, but are not limited to, the following : • volatility or decline of our stock price ; • potential fluctuation in annual or quarterly results ; • dilution related to additional issuances of securities ; • declines or volatility in the prices we receive for our oil and natural gas ; • general economic conditions, whether internationally, nationally or in the regional and local market areas in which we do business ; • our ability to generate sufficient cash flow from operations, borrowings or other sources to enable us to fully develop our oil and natural gas properties ; • risks associated with drilling, including completion risks, cost overruns and the drilling of non - economic wells or dry holes ; • uncertainties associated with estimates of proved oil and natural gas reserves ; • the presence or recoverability of estimated oil and natural gas reserves and the actual future production rates and associated costs ; • risks and liabilities associated with acquired companies and properties ; • risks related to integration of acquired companies and properties ; • potential defects in title to our properties ; • our ability to raise additional capital to fund future capital expenditures ; • cost and availability of drilling rigs, equipment, supplies, personnel and oilfield services ; • geological concentration of our reserves ; • environmental or other governmental regulations, including legislation of hydraulic fracture stimulation and elimination of income tax incentives available to our industry ; • our ability to secure firm transportation for oil and natural gas we produce and to sell the oil and natural gas at market prices ; • exploration and development risks ; • management’s ability to execute our plans to meet our goals ; • our ability to retain key members of our management team ; • weather conditions ; • actions or inactions of third - party operators of our properties ; • costs and liabilities associated with environmental, health and safety laws ; • o ur ability to find and retain skilled personnel ; • operating hazards attendant to the oil and natural gas business ; and • competition in the oil and natural gas industry . The Company undertakes no obligation to publicly revise these forward - looking statements to reflect events or circumstances that arise after the date hereof, except as required by applicable law . The financial and operating projections contained in this presentation represent our reasonable estimates as of the date of this presentation . Neither our auditors nor any other third party has examined, reviewed or compiled the projections and, accordingly, none of the foregoing expresses an opinion or other form of assurance with respect thereto . The assumptions upon which the projections are based are described in more detail herein . Some of these assumptions inevitably will not materialize, and unanticipated events may occur that could affect our results . Therefore, our actual results achieved during the periods covered by the projections will vary from the projected results . Prospective investors are cautioned not to place undue reliance on the projections included herein . Pro forma production data reflects the acquisition of Cross Border Resources, Inc . (OTCQB : XBOR) (“Cross Border”) as if it occurred on June 1 , 2012 . As of September 30 , 2013 , RMR owned 83 . 3 % of the outstanding common stock of Cross Border . Red Mountain Resources, Inc. 2515 McKinney Avenue Suite 900 Dallas, TX 75201 P: 214.871.0400 F: 214.871.0406 W: www.redmountainresources.com E: info@redmountainresources.com Investor Relations Contact Michael R. Uffman Chief Financial Officer michael@redmountainresources.com

3 Investment Highlights Well - Rounded Management Team with Strong Capital Markets and Operational Experience • With more than 300 years of combined operations experience, in - house abilities to turn inventory into reserves and production • Successful track record of development and strategic acquisitions providing for multi - year drilling inventory Large, Geographically Focused Asset Base Without Need to Chase Lease Expiration • More than 309,000 net acres in the New Mexico, Texas, and Kansas with 97% either HBP or mineral rights owned • ~31,000 net acres classified as core Permian acreage in Andrews, Ector, and Pecos Counties, TX and Lea, Eddy, Chaves, and Roosevelt Counties, NM Track Record of Production Growth • Since inception in June 2011, oil production has grown from 454 BOE/D to 911 BOE/D (as of September 30, 2013) • Product mix increase from 0% oil for the three months ended August 31, 2011, to 52% oil for the three months ended September 30, 2013 CAPEX Budget in Place to Yield Strong Growth in Production and Reserves • Recent capital raises provide ability to fund CAPEX budget organically • Significant increase in CAPEX to yield high impact growth in production and reserves Conservative Financial Philosophy and Proactive Liquidity Management • Active hedging program to minimize downside risk and protect capital program • Simplified capital structure with recent financings Enterprise Value at Significant Discount to Permian Peer Group • On an EV/net Permian acre basis, Adjusted Enterprise Value at $1,300/acre of exposure in the Permian • This represents a 93% discount to the mean of our peer group Near - Term Focus to Increase Liquidity of Stock • Active investor relations program to increase market visibility • Board approved reverse split and plans to uplist on NYSE MKT in fiscal 2014

4 Red Mountain Resources, Inc. (“RMR”) Listing (OTCQB) RDMP Share Price $0.55 Common Shares Outstanding (MM) 133.1 Market Cap (MM) $73.2 Total Debt (MM) $14.8 Preferred Stock (MM) $11.9 Cash (MM) $1.9 Enterprise Value (MM) $98.0 Management and Insider Ownership 10+% Company Auditor Hein & Associates LLP Independent Reserve Engineer Auditor Cawley , Gillespie & Associates, Inc. Market data as of close on December 6, 2013 Corporate Overview

5 Company Overview FY 2014 Q1 Net Production 1 : 911 BOE/D – 52% oil Proved Reserves 2 : 3.5 MMBOE 54% Proved Developed Drilling Inventory : 450 gross (369 net) locations 1 Average daily net production sold for the three months ended September 30, 2013. Includes net production sold represented by the 17% of Cross Border’s common stock not owned by RMR. 2 As of June 1, 2013. Includes reserves represented by the 17% of Cross Border’s common stock not owned by RMR. Acreage Chart Gross Net Developed Permian 10,757 5,028 Undeveloped Permian 4 326,080 26,111 Undeveloped Southwest NM Minerals 5 536,340 268,170 Developed South Texas 4,776 1,405 Kansas 8,623 8,623 TOTAL 886,576 309,337 97% of Acreage Either Owned Mineral Rights or Leases Held by Production as of December 6, 2013 3 3 Includes acreage represented by the 17% of Cross Border’s common stock not owned by RMR. 4 Includes mineral ownership. 5 Reflects mineral ownership. Summary of Combined Properties of RMR, Cross Border, and Bamco

6 Summary of Reserves PDP PDNP PUD Total Proved Proved Net Reserves Oil/Condensate (MBBL) 867 149 1,304 2,320 Natural Gas (MMCF) 4,998 322 2,041 7,361 Total (MBOE) 1,700 203 1,644 3,547 Percent Oil 51% 73% 79% 65% PV - 10 ($M) $42,004 $3,405 $22,218 $67,627 Proved Reserves (as of June 1, 2013) As of June 1, 2013. Includes reserves represented by the 17% of Cross Border’s common stock not owned by RMR. Breakdown of Reserves 29% 20% 15% 11% 8% 18% Madera Lusk Tom Tom Turkey Track Villarreal S. Texas Other PUD 46% PDP 48% PDNP 6% Reserves by Commodity Oil 65 % Gas 35 % Reserves by Field
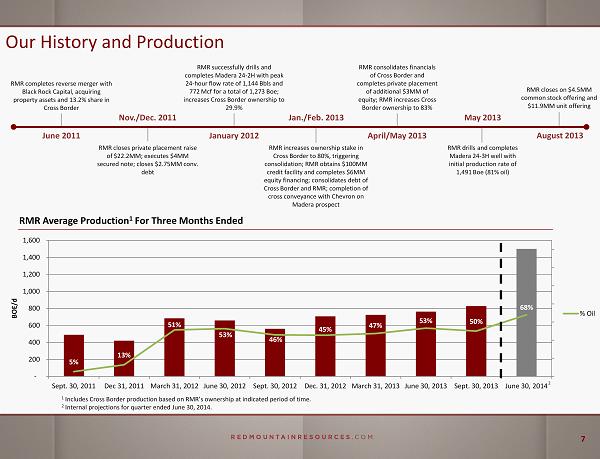
7 5% 13% 51% 53% 46% 45% 47% 53% 50% 68% - 200 400 600 800 1,000 1,200 1,400 1,600 Sept. 30, 2011 Dec 31, 2011 March 31, 2012 June 30, 2012 Sept. 30, 2012 Dec. 31, 2012 March 31, 2013 June 30, 2013 Sept. 30, 2013 June 30, 2014 BOE/d % Oil Our History and Production RMR completes reverse merger with Black Rock Capital, acquiring property assets and 13.2% share in Cross Border June 2011 RMR closes private placement raise of $22.2MM; executes $4MM secured note; closes $2.75MM conv. debt Nov./Dec. 2011 RMR successfully drills and completes Madera 24 - 2H with peak 24 - hour flow rate of 1,144 Bbls and 772 Mcf for a total of 1,273 Boe ; increases Cross Border ownership to 29.9% January 2012 Jan./Feb. 2013 RMR increases ownership stake in Cross Border to 80 %, triggering consolidation; RMR obtains $100MM credit facility and completes $6MM equity financing; consolidates debt of Cross Border and RMR; completion of cross conveyance with Chevron on Madera prospect April/May 2013 RMR consolidates financials of Cross Border and completes private placement of additional $3MM of equity; RMR increases Cross Border ownership to 83% May 2013 August 2013 RMR drills and completes Madera 24 - 3H well with initial production rate of 1,491 Boe (81% oil) RMR closes on $4.5MM common stock offering and $11.9MM unit offering RMR Average Production 1 For Three Months Ended 1 Includes Cross Border production based on RMR’s ownership at indicated period of time. 2 Internal projections for quarter ended June 30, 2014. 2
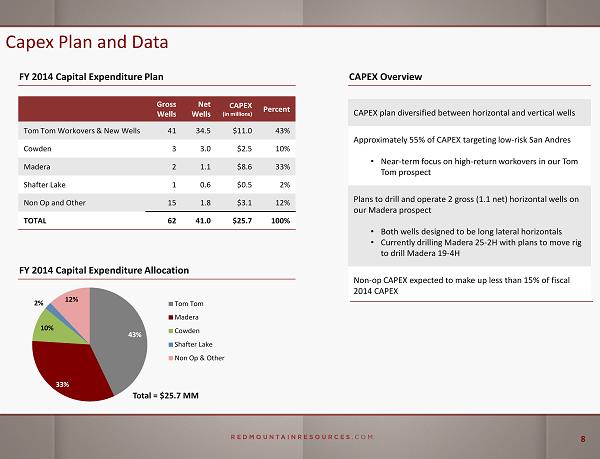
8 Capex Plan and Data FY 2014 Capital Expenditure Plan Gross Wells Net Wells CAPEX (in millions) Percent Tom Tom Workovers & New Wells 41 34.5 $11.0 43% Cowden 3 3.0 $2.5 10% Madera 2 1.1 $8.6 33% Shafter Lake 1 0.6 $0.5 2% Non Op and Other 15 1.8 $3.1 12% TOTAL 62 41.0 $25.7 100% FY 2014 Capital Expenditure Allocation Total = $25.7 MM CAPEX Overview CAPEX plan diversified between horizontal and vertical wells Approximately 55% of CAPEX targeting low - risk San Andres • Near - term focus on high - return workovers in our Tom Tom prospect Plans to drill and operate 2 gross (1.1 net) horizontal wells on our Madera prospect • Both wells designed to be long lateral horizontals • Currently drilling Madera 25 - 2H with plans to move rig to drill Madera 19 - 4H Non - op CAPEX expected to make up less than 15% of fiscal 2014 CAPEX 43% 33% 10% 2% 12% Tom Tom Madera Cowden Shafter Lake Non Op & Other

9

10 Permian Basin Focus Property Overview ≈ 309,000 net acres in West Texas and New Mexico ≈ 31,000 net acres classified as Permian Basin Acreage position provides opportunity for reserve adds and production growth with exposure to: • Bone Spring • Brushy Canyon • Abo • Yeso • San Andres • Wolfbone / Wolfcamp • Avalon Shale Large acreage position creates long - term upside 97% of acreage either owned mineral rights or leases held by production Significant operating experience and aligned with premier operating partners on non - operated assets Uniquely positioned ownership and team provides access to services and basin - wide well data
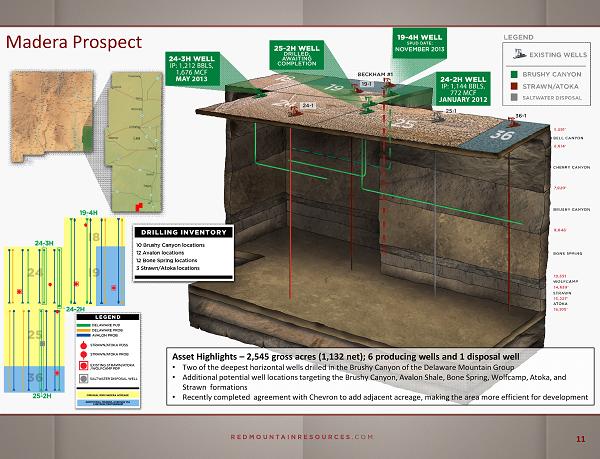
11 Madera Prospect Asset Highlights – 2,545 gross acres (1,132 net); 6 producing wells and 1 disposal well • Two of the deepest horizontal wells drilled in the Brushy Canyon of the Delaware Mountain Group • Additional potential well locations targeting the Brushy Canyon, Avalon Shale, Bone Spring, Wolfcamp , Atoka, and Strawn formations • Recently completed agreement with Chevron to add adjacent acreage, making the area more efficient for development

12 Madera Lateral Economics High Base Low EUR ( Mboe ) 549 464 373 PV - 10 ($M) $7,746 $5,521 $3,189 IRR (%) 7 9 % 52% 31% Payback (Years) 1.7 2.2 3.0 Gross Well Cost ($M) $6,500 $6,500 $6,500 IP (Boe/d) 604 513 417 B - factor 1.3 1.3 1.3 Percent Oil 69% 69% 71% Sensitivity Case Assumptions (4,620’ Lateral Length) Representative Base Type Curve / Development Economics WTI Oil Price ($/ bbl ) PV - 10 ($M) Payout ( yrs ) IRR (%) HIGH CASE $80 $6,140 2.0 58% $90 $7,746 1.7 79% $100 $9,094 1.5 99% BASE CASE $80 $4,157 2.6 39% $90 $ 5,521 2.2 52% $100 $ 6,668 1.9 65% LOW CASE $80 $2,065 3.8 23% $90 $ 3,189 3.0 31% $100 $ 4,133 2.6 39% Sensitivity to Oil Price - IRR Oil Price Sensitivity * Base case calculated with $90 WTI oil and $3.50 Henry Hub gas, adjusted prices are $83.37/ bbl and $4.88/ mcf 0% 25% 50% 75% 100% 125% $80 $90 $100 IRR HIGH CASE BASE CASE LOW CASE 100 1,000 10,000 100,000 0 12 24 36 48 60 72 84 96 108 120 Bbl/month and Mcf/month Oil Gas
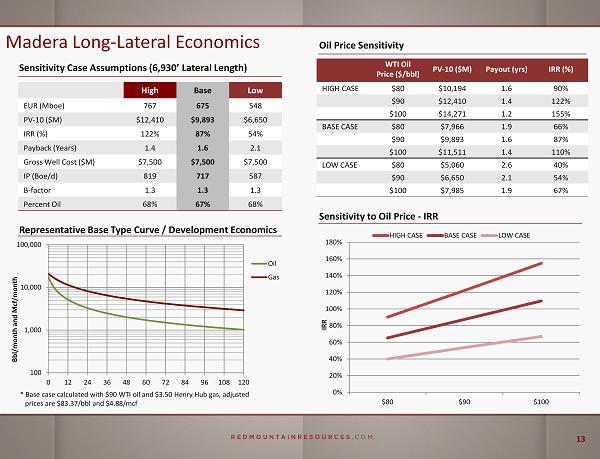
13 Madera Long - Lateral Economics High Base Low EUR ( Mboe ) 767 675 548 PV - 10 ($M) $12,410 $9,893 $6,650 IRR (%) 122% 87% 54% Payback (Years) 1.4 1.6 2.1 Gross Well Cost ($M) $7,500 $7,500 $7,500 IP (Boe/d) 819 717 587 B - factor 1.3 1.3 1.3 Percent Oil 68% 67% 68% Sensitivity Case Assumptions (6,930’ Lateral Length) Representative Base Type Curve / Development Economics WTI Oil Price ($/ bbl ) PV - 10 ($M) Payout ( yrs ) IRR (%) HIGH CASE $80 $10,194 1.6 90% $90 $12,410 1.4 122% $100 $14,271 1.2 155% BASE CASE $80 $7,966 1.9 66% $90 $9,893 1.6 87% $100 $11,511 1.4 110% LOW CASE $80 $5,060 2.6 40% $90 $6,650 2.1 54% $100 $7,985 1.9 67% Sensitivity to Oil Price - IRR Oil Price Sensitivity * Base case calculated with $90 WTI oil and $3.50 Henry Hub gas, adjusted prices are $83.37/ bbl and $4.88/ mcf 0% 20% 40% 60% 80% 100% 120% 140% 160% 180% $80 $90 $100 IRR HIGH CASE BASE CASE LOW CASE 100 1,000 10,000 100,000 0 12 24 36 48 60 72 84 96 108 120 Bbl/month and Mcf/month Oil Gas

14 Significant Exposure to Low - Risk San Andres Reserves The San Andres formation is an oil and gas bearing member of the Upper Permian occurring in the geologic provinces of West Te xas and Southeast New Mexico • The San Andres and Grayburg formations have contributed the most growth of oil reserves in recent decades • Already achieved high recovery efficiencies with extensive use of water flood and CO2 recovery programs in these formations Source : U.S. Geologic Survey dated April 2012 Of the 3.25 billion barrels of oil reserves expected to be produced from the Permian Basin through 2015, the Northwest shelf San Andres platform carbonate composes 21% of this total, or 680 MMBBLS. Source : American Association of Petroleum Geologist Bulletin dated May 2005 San Andres Overview Northwest Shelf San Andres Potential
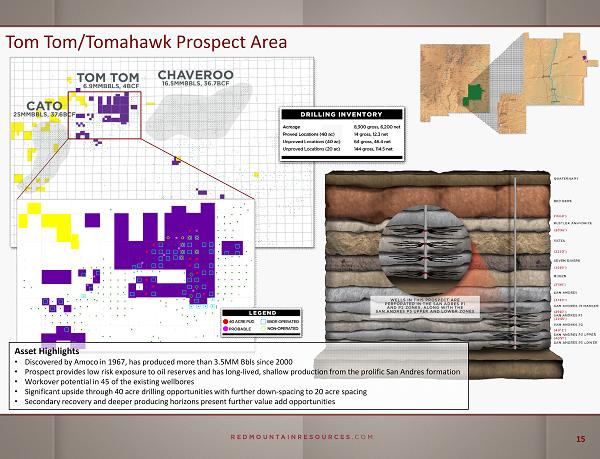
15 Tom Tom/Tomahawk Prospect Area Asset Highlights • Discovered by Amoco in 1967, has produced more than 3.5MM Bbls since 2000 • Prospect provides low risk exposure to oil reserves and has long - lived, shallow production from the prolific San Andres formatio n • Workover potential in 45 of the existing wellbores • Significant upside through 40 acre drilling opportunities with further down - spacing to 20 acre spacing • Secondary recovery and deeper producing horizons present further value add opportunities

16 San Andres Area Economics High Base Low EUR ( Mboe ) 67 50 32 PV - 10 ($M) $ 1,327 $768 $209 IRR (%) 94% 52% 20% Payback (Years) 1.7 2.3 1.7 Gross Well Cost ($M) $800 $800 $800 IP (Boe/d) 40 30 20 B - factor 0.8 0.8 0.8 Percent Oil 100% 100% 100% Sensitivity Case Assumptions Representative Base Type Curve / Development Economics WTI Oil Price ($/ bbl ) PV - 10 ($M) Payout ( yrs ) IRR (%) HIGH CASE $80 $1,063 2.0 73% $90 $1,327 1.7 94% $100 $1,591 1.6 118% BASE CASE $80 $570 2.7 39% $90 $768 2.3 52% $100 $966 2.1 65% LOW CASE $80 $78 2.0 14% $90 $209 1.7 20% $100 $341 1.6 27% Sensitivity to Oil Price - IRR Oil Price Sensitivity * Base case calculated with $90 WTI oil, adjusted price is $83.76/ bbl 0% 25% 50% 75% 100% 125% $80 $90 $100 IRR HIGH CASE BASE CASE LOW CASE 10 100 1,000 10,000 0 12 24 36 48 60 72 84 96 108 120 Bbl/month Oil

17 Non - Operated New Mexico LUSK Well Name Well Type Operator IP Date Oil IP Gas IP Cum Oil Cum Gas WI Lusk 34 Federal 1H Horizontal Apache 4/22/2013 203 305 16,209 8,489 28.64% Lusk 34 Federal 2H Horizontal Apache 5/1/2013 233 416 17,785 10,223 28.64% Fecta 33 Fed Com 2H Horizontal Oxy 12/18/2012 302 455 55,805 90,371 12.50% TURKEY TRACK Well Name Well Type Operator IP Date Oil IP Gas IP Cum Oil Cum Gas WI Bradley 30 Fed 3H Horizontal Mewbourne 12/4/2012 286 215 42,007 116,903 4.49% Bradley 30 Fed 4H Horizontal Mewbourne 3/22/2013 297 215 40,133 94,375 6.25% Zircon 2 Da State 1H Horizontal Mewbourne 5/10/2013 264 85 33,106 70,356 12.50% 2 nd Bone Spring Wells Operating Partners Within the Area RED LAKE, HENSHAW, GRAVE DIGGER Well Name Well Type Operator IP Date Oil IP Gas IP Cum Oil Cum Gas WI Roo 22 State 9 Vertical Oxy 7/8/2013 100 198 5,731 4,036 3.13% Roo 22 State 10 Vertical Oxy 7/8/2013 111 180 5,417 6,873 3.13% Burkett 16 State 4 Vertical Concho 2/6/2013 99 136 14,260 23,905 6.25% Grave Digger State Com 5H Horizontal Concho 2/8/2013 230 155 50,483 50,376 5.64% HENSHAW Well Name Well Type Operator IP Date Oil IP Gas IP Cum Oil Cum Gas WI Leo Federal Com 2H Horizontal Legacy 6/24/2012 500 300 89,394 89,684 6.25% Glorieta - Yeso Wells Abo - Wolfcamp Wells

18 Central Kansas Properties • 8,623 gross and net acres • 100% working interest; 80+% NRI • Target zones: Arbuckle, Lansing Kansas City, Penn, Reagan, and Granite Wash • Established and growing acreage position • Arbuckle estimates: 30 to 50 MBOE EURs well cost of approximately $400,000 Asset Highlights

19 Financial Overview

20 Capitalization Table As of Sept. 30, 2013 Pro - Forma Payoff of Convertible Notes Cash $3,709 $1,894 Short - Term Debt Convertible Notes Payable $1,500 - Long - Term Debt Borrowing Base Borrowing Base Senior Credit Facility $30,000 $14,800 $30,000 $14,800 Total Debt $16,300 $14,800 Series A Preferred $11,917 $11,917 Total Debt & Preferred $28,217 $26,717 Net Debt & Preferred $24,508 $24,823 Stockholders’ Equity $51,158 $51,158 Total Capitalization $79,375 $77,875 Total Liquidity $18,909 $17,094 Note: Pro - forma capitalization includes the repayment in full of the $1.5mm convertible note payable including accrued and unpai d interest on November 25, 2013. Capitalization as of December 2013 (in thousands)
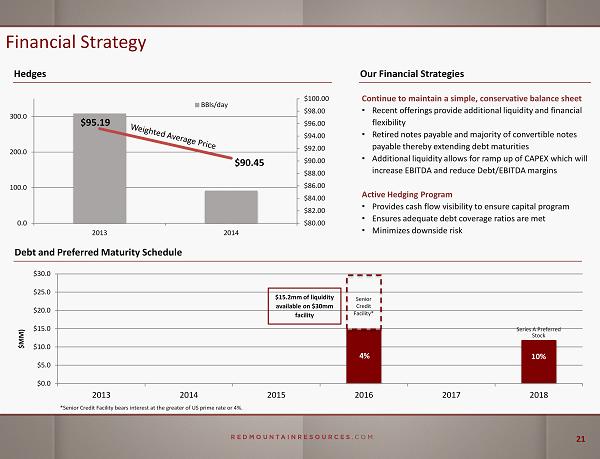
21 $95.19 $90.45 $80.00 $82.00 $84.00 $86.00 $88.00 $90.00 $92.00 $94.00 $96.00 $98.00 $100.00 0.0 100.0 200.0 300.0 2013 2014 BBls/day Financial Strategy Hedges Debt and Preferred Maturity Schedule $0.0 $5.0 $10.0 $15.0 $20.0 $25.0 $30.0 2013 2014 2015 2016 2017 2018 $MM) $ 15.2mm of liquidity available on $30mm facility Senior Credit Facility* Series A Preferred Stock 4% 10% Continue to maintain a simple, conservative balance sheet • Recent offerings provide additional liquidity and financial flexibility • Retired notes p ayable and majority of convertible notes payable thereby extending debt maturities • Additional liquidity allows for ramp up of CAPEX which will increase EBITDA and reduce Debt/EBITDA margins Active Hedging Program • Provides cash flow visibility to ensure capital program • Ensures adequate debt coverage ratios are met • Minimizes downside risk Our Financial Strategies *Senior Credit Facility bears interest at the greater of US prime rate or 4%.

22 $1,300 $0 $5,000 $10,000 $15,000 $20,000 $25,000 $30,000 $35,000 PXD ATHL REI FANG LPI EGN CXO CPE AREX RDMP $EV / Net Acre Offering Exposure to the Permian at a Discount (EV/Net Acre in the Permian Basin) * Calculated after assigning value to production and acreage value in areas outside the Permian. See appendix for derivation . **No value assigned to RDMP for SW New Mexico acreage where mineral rights are owned. Mean EV/Net Acre of Peer G roup: $18,216

23 In Summary Uniquely positioned property set with large acreage position geographically focused in the Permian, Kansas, and onshore Texas Gulf coast Potential reserves and production base with projected 1,500 Boe /d by end of FY2014 and 1,500+ potential gross locations Strong production profile to execute development plans , including significant free cash flow from existing assets to invest in development plan Experienced management and technical team with successful track record of creating value and significant operating experience The RMR team has more than 300 years of combined experience in our core areas

24

25 Board and Management Team 10+ years experience within the energy industry, CEO since June 2011 Significant oil & gas experience, including management, operations, finance and corporate development Highly experienced team with 10% equity stake Key Team Members 45+ years experience within energy industry; owner of RK Ford & Associates, Inc. and partner in Western Drilling, Inc. Geographical experience in 18 U.S. states and 12 countries ALAN W. BARKSDALE Chairman, President, CEO RANDELL K. FORD Director DAVID M. HEIKKINEN Director RICHARD Y. ROBERTS Director PAUL N. VASSILAKOS Director 15+ years experience within energy industry; CEO of Heikkinen Energy Advisors, LLC. Served as Head of E&P Research for Tudor, Pickering, Holt & Co . and as Exploration and Production Analyst for Capital One Southcoast , Inc. Co - founded Roberts, Raheb & Gradler LLC, a regulatory/legislative consulting firm From 1990 to 1995 was a commissioner of the Securities and Exchange Commission, during which time he was actively involved in a wide range of subjects affecting the capital markets Served as interim President & CEO of RMR from February - March 2011 Serves as asst. treasurer of Cullen Agricultural Holding Corp. and founder of Petrina Advisors, Inc., a privately held advisory firm MICHAEL R. UFFMAN Chief Financial Officer 10+ years of experience in the financial sector of the energy industry Prior experience includes Global Hunter Securities, LLC, Dahlman Rose & Co., Capital One Southcoast , Inc., and KPMG LLP TOMMY W. FOLSOM EVP, Director of Exp. & Prod. 40+ years of experience in the energy industry Prior experience includes Enerstar Resources O & G, LLC, Murchison Oil and Gas, Inc., Vision Energy, Inc., and Santa Fe Energy, Inc. HILDA D. KOUVELIS Chief Accounting Officer 25+ years of experience in the financial sector of the energy industry Prior experience includes TransAtlantic Petroleum Ltd., Sky Petroleum Inc., Ascent Energy, Inc., and PetroFina S.A. EARL M. SEBRING Sr. Consulting Geologist, Interim President Cross Border 35+ years experience within energy industry; owner of Sebring Exploration Texas, Inc. Geographical experience in Permian Basin, Gulf Coast, Oklahoma, and numerous countries JACK C. BRADLEY Vice President, Director of Business Development 9+ years experience within energy industry at The StoneStreet Group and Sebring Exploration Texas, Inc. Extensive experience in Permian Basin, Val Verde Basin, South Texas
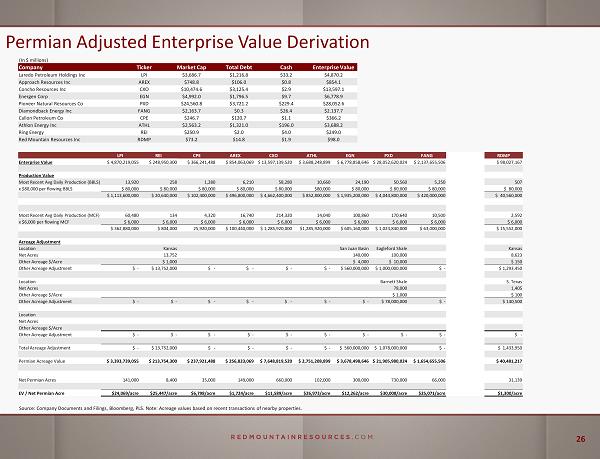
26 Permian Adjusted Enterprise Value Derivation Company Ticker Market Cap Total Debt Cash Enterprise Value Laredo Petroleum Holdings Inc LPI $3,686.7 $1,216.8 $33.2 $4,870.2 Approach Resources Inc AREX $748.8 $106.0 $0.8 $854.1 Concho Resources Inc CXO $10,474.6 $3,125.4 $2.9 $13,597.1 Energen Corp EGN $4,992.0 $1,796.5 $9.7 $6,778.9 Pioneer Natural Resources Co PXD $24,560.8 $3,721.2 $229.4 $28,052.6 Diamondback Energy Inc FANG $2,163.7 $0.3 $26.4 $2.137.7 Callon Petroleum Co CPE $246.7 $120.7 $1.1 $366.2 Athlon Energy Inc ATHL $2,563.2 $1,321.0 $196.0 $3,688.2 Ring Energy REI $250.9 $2.0 $4.0 $249.0 Red Mountain Resources Inc RDMP $73.2 $14.8 $1.9 $98.0 LPI REI CPE AREX CXO ATHL EGN PXD FANG RDMP Enterprise Value $ 4,870,219,055 $ 248,950,300 $ 366,241,488 $ 854,063,069 $ 13,597,139,520 $ 3,688,248,899 $ 6,778,858,646 $ 28,052,620,024 $ 2,137,655,506 $ 98,027,167 Production Value Most Recent Avg Daily Production (BBLS) 13,920 258 1,280 6,210 58,280 10,660 24,190 50,560 5,250 507 x $80,000 per flowing BBLS $ 80,000 $ 80,000 $ 80,000 $ 80,000 $ 80,000 $80,000 $ 80,000 $ 80,000 $ 80,000 $ 80,000 $ 1,113,600,000 $ 20,640,000 $ 102,400,000 $ 496,800,000 $ 4,662,400,000 $ 852,800,000 $ 1,935,200,000 $ 4,044,800,000 $ 420,000,000 $ 40,560,000 Most Recent Avg Daily Production (MCF) 60,480 134 4,320 16,740 214,320 14,040 100,860 170,640 10,500 2,592 x $6,000 per flowing MCF $ 6,000 $ 6,000 $ 6,000 $ 6,000 $ 6,000 $ 6,000 $ 6,000 $ 6,000 $ 6,000 $ 6,000 $ 362,880,000 $ 804,000 25,920,000 $ 100,440,000 $ 1,285,920,000 $1,285,920,000 $ 605,160,000 $ 1,023,840,000 $ 63,000,000 $ 15,552,000 Acreage Adjustment Location Kansas San Juan Basin Eagleford Shale Kansas Net Acres 13,752 140,000 100,000 8,623 Other Acreage $/Acre $ 1,000 $ 4,000 $ 10,000 $ 150 Other Acreage Adjustment $ - $ 13,752,000 $ - $ - $ - $ - $ 560,000,000 $ 1,000,000,000 $ - $ 1,293,450 Location Barnett Shale S. Texas Net Acres 78,000 1,405 Other Acreage $/Acre $ 1,000 $ 100 Other Acreage Adjustment $ - $ - $ - $ - $ - $ - $ - $ 78,000,000 $ - $ 140,500 Location Net Acres Other Acreage $/Acre Other Acreage Adjustment $ - $ - $ - $ - $ - $ - $ - $ - $ - $ - Total Acreage Adjustment $ - $ 13,752,000 $ - $ - $ - $ - $ 560,000,000 $ 1,078,000,000 $ - $ 1,433,950 Permian Acreage Value $ 3,393,739,055 $ 213,754,300 $ 237,921,488 $ 256,823,069 $ 7,648,819,520 $ 2,751,208,899 $ 3,678,498,646 $ 21,905,980,024 $ 1,654,655,506 $ 40,481,217 Net Permian Acres 141,000 8,400 35,000 149,000 660,000 102,000 300,000 730,000 66,000 31,139 EV / Net Permian Acre $24,069/acre $25,447/acre $6,798/acre $1,724/acre $11,589/acre $26,973/acre $12,262/acre $30,008/acre $25,071/acre $1,300/acre Source: Company Documents and Filings, Bloomberg, PLS. Note: Acreage values based on recent transactions of nearby properties . (In $ millions)

27 PV - 10 Reconciliation (in thousands) PV - 10 $67,627 Future income taxes ($23,027) Discount of future income taxes at 10% per annum $12,536 Standardized measure $57,136 PV - 10 Reconciliation PV - 10 is a non - GAAP financial measure as defined by the Securities and Exchange Commission. The closest GAAP measure to PV - 10 is the standardized measure of discounted net cash flows. The standardized measure differs from PV - 10 because standardized measure includes the effect of future income ta xes. We believe that the presentation of PV - 10 is relevant and useful to our investors as supplemental disclosure to the standardized measure, or after - tax amount, because it presents the discounted future net cash flows attributable to our proved reserves before taking into account future corporate income taxes and our current tax structure. T he table above provides a reconciliation of our PV - 10 to our standardized measure.