Attached files
| file | filename |
|---|---|
| 8-K - 8-K - INTERNATIONAL GAME TECHNOLOGY | a13-26158_18k.htm |
Exhibit 99.1
|
|
[LOGO] |

|
|
Safe Harbor Statement Forward-Looking Statements. This presentation contains forward-looking statements within the meaning of the Private Securities Litigation Reform Act of 1995 as contained in Section 27A of the ima economic and market conditions impacting the gaming industry, business prospects, strategic and operational plans, uses of cash, and other events. You can identify these statements by the fact that and other words and terms of similar meaning. These statements involve a number of risks and uncertainties that could cause actual results to differ materially from the results predicted, and reported results should not be considered an indication of future performance. Among the factors that could cause actual results and outcomes to differ materially from those contained in such forward-looking statements are the following: general economic conditions and changes in economic conditions affecting the gaming industry; new or changing laws or regulations or new interpretations of existing laws o maintaining necessary licenses or approvals; slow growth in the number of new gaming jurisdictions or new casinos or the rate of replacement of existing gaming machines; changes in operator or s a ts of litigation, including intellectual property infringement claims; future developments or changes affecting online gaming or social casino-style gaming, which is a new and evolving industry; and risks related to business combinations, investments in intellectual property and the integration of acquisitions. A further list and description of these and other risks, uncertainties and other matters c Con 10-K for fiscal 2013 filed with the Securities and Exchange Commission on November 26, 2013 and available on the SEC website at www.sec.gov at www.igt.com. Except as otherwise noted, all information in this presentation is based on information and expectations as of December 12, 2013. IGT does not intend, and undertakes no duty, to update this information to reflect subsequent events or circumstances. Non-GAAP Financial Measures. This presentation contains non-GAAP financial measures. We believe that certain non-GAAP financial measures, when presented in conjunction with comparable GAAP (Generally Accepted Accounting Principles) measures, are useful because that information is an appropriate measure for evaluating our operating performance. Non-GAAP information is used to evaluate business performance and management's effectiveness. These measures should be considered in addition to, not as a substitute for, or superior to, measures of financial performance prepared in accordance with GAAP. Non-GAAP financial measures may not be calculated in the same manner by all companies and therefore may not be comparable. Reconciliations between GAAP and non-GAAP measures are provided at the end of this presentation. Other. In this presentation, (il r 2 |
|
|
Introduction Patti Hart, CEO Remarks Eric Tom, EVP, Global Sales A View From the Frontline Q&A Closing John Vandemore, EVP, Emerging Businesses & CFO Financial Highlights 3 |
|
|
Global Industry Leadership Accretive Returns to Shareholders Positioning for Long-Term Growth 4 |
|
|
Global Industry Leadership $1,917 $1,957 $2,151 $2,342 2010 2011 2012 2013 Global Consolidated Revenue 29% 32% 36% 40% 2010 2011 2012 2013 North America Ship Share(1) $493 $526 $564 $604 2010 2011 2012 2013 Adjusted Operating Income $0.84 $0.93 $1.04 $1.27 2010 2011 2012 2013 Adjusted EPS ($MM) ($MM) 1. Per data provided by Eilers Research, LLC 5 |
|
|
Current Installed Base (as of 9/30/13) (3) Research & Development (1) North America Ship Share (3) Revenue (1) Global Industry Leadership ($MM) ($MM) $756 $1,295 $1,645 $2,342 Aristocrat BYI / SHFL SGMS / WMS IGT (2) (2) 1. Source: Company filings, reports, websites, presentations and ThomsonOne; LTM represents the aggregate results for the twelve-month period ended September 30, 2013 2. Excludes potential synergies 3. Per data provided by Eilers Research, LLC; LTM represents the aggregate results for the twelve-month period ended September 30, 2013 10% 13% 14% 40% Aristocrat SGMS / WMS BYI / SHFL IGT 15,205 32,792 40,295 54,600 Aristocrat BYI / SHFL SGMS / WMS IGT $108 $152 $180 $235 Aristocrat BYI / SHFL SGMS / WMS IGT 6 |
|
|
Accretive Returns to Shareholders 7 Returned over $1 billion to shareholders over past 4 years $50 $475 $191 $71 $72 $71 $79 $71 $122 $546 $270 2010 2011 2012 2013 Dividends Share Repurchases ($MM) Return to Shareholders |

|
|
Accretive Returns to Shareholders 26% 21% IGT S&P 500 Operating Cash Flow as a % of Revenue 5 Years 3.8% 3.1% IGT S&P 500 Share Repurchase Yields(1) -15% 1% IGT S&P 500 Change in Shares Outstanding - 5 Years 2.2% 2.0% IGT S&P 500 Dividend Yield Source: S&P 500 data provided by Thomson 1. Calculated as total dollar amount of shares repurchased, divided by the year end stock price, divided by year end shares outstanding 8 |
|
|
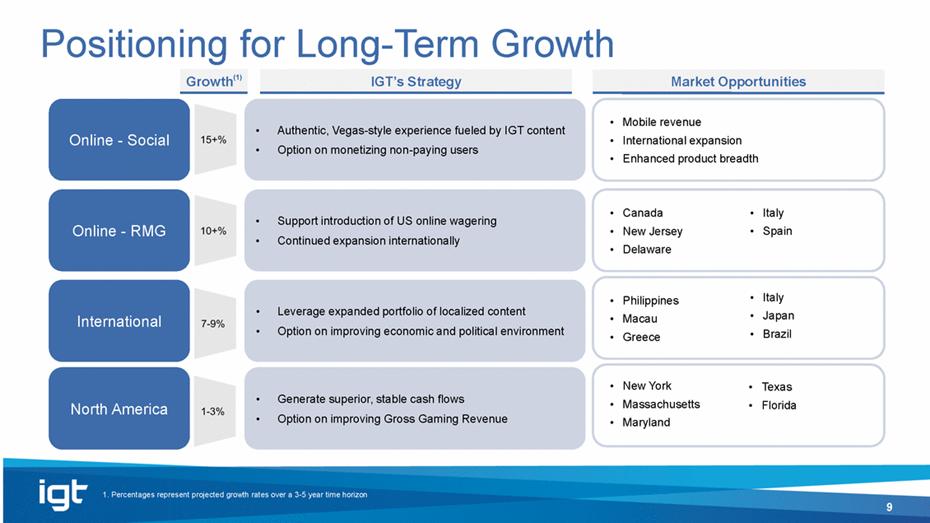
Positioning for Long-Term Growth Online - Social • Authentic, Vegas-style experience fueled by IGT content • Option on monetizing non-paying users Online - RMG • Support introduction of US online wagering • Continued expansion internationally • Leverage expanded portfolio of localized content • Option on improving economic and political environment International North America • Generate superior, stable cash flows • Option on improving Gross Gaming Revenue • Italy • Spain • Italy • Japan • Brazil • Texas • Florida IGT’s Strategy Market Opportunities • Canada • New Jersey • Delaware • Philippines • Macau • Greece • New York • Massachusetts • Maryland • Mobile revenue • International expansion • Enhanced product breadth 9 1. Percentages represent projected growth rates over a 3-5 year time horizon Growth(1) |
|
|
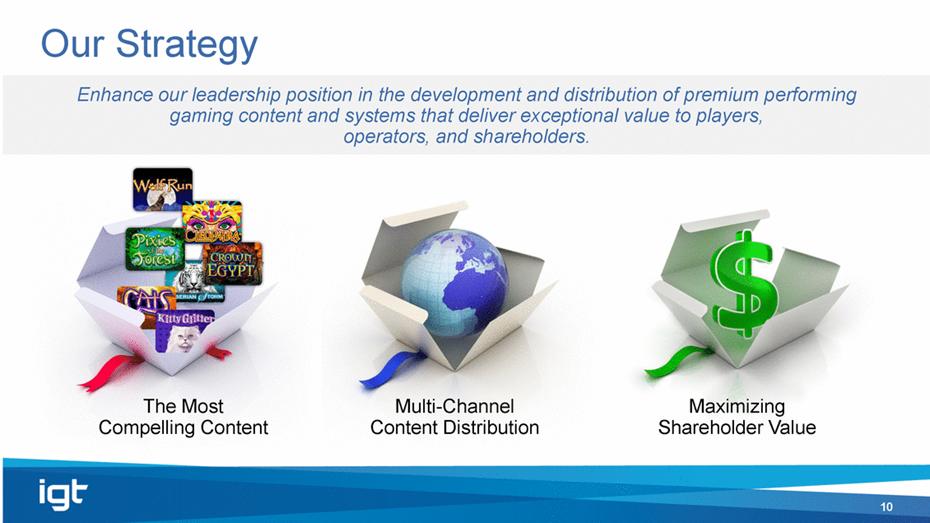
Our Strategy Multi-Channel Content Distribution The Most Compelling Content Maximizing Shareholder Value Enhance our leadership position in the development and distribution of premium performing gaming content and systems that deliver exceptional value to players, operators, and shareholders. 10 |
|
|
A View From the Frontline |

|
|
Customer Panel Participants Rhonda Garvey VP of eGaming, British Columbia Lottery Corporation Matt Harkness Chief Operating Officer, Four Winds Brian Hoeffner Vice President of Gaming, Casino Del Sol Rob Miller Owner, Miller Companies Ray Pineault Chief Operating Officer, Mohegan Sun 12 |
|
|
Financial Update |
|
|
Increased North America replacement units 50% Returned $270 million to shareholders Grew adjusted EPS 22% Increased revenues 9% Grew DoubleDown revenues 151% Recap of 2013 Highlights 14 |
|
|
Gaming Operations 15 $1,037 $1,040 $991 2011 2012 2013 Gaming Operations Revenue $189 $162 $106 2011 2012 2013 Gaming Operations Capital Expenditures $633 $634 $617 2011 2012 2013 Gaming Operations Gross Profit & Margins $444 $472 $511 2011 2012 2013 Modified Gaming Operations Free Cash Flow(1) ($MM) ($MM) 7.3% CAGR 1. Modified Gaming Operations Free Cash Flow equals Gaming Operations Gross Profit minus Gaming Operations Capital Expenditures 61% 61% 62% |

|
|
Product Sales Increasing our Market Share by Delivering Premier Content across a Breadth of Product Offerings 29% 32% 36% 40% 2010 2011 2012 2013 $843 $884 $967 $1,085 53% 55% 54% 52% 2010 2011 2012 2013 Gross Margin Revenue North America Ship Share(1) Product Sales Revenue and Gross Margin ($MM) 16 1. Per data provided by Eilers Research, LLC |
|
|
Interactive 17 $21 $30 $36 $41 $54 $61 $61 $13 $13 $18 $12 $12 $11 $12 $34 $43 $54 $53 $67 $73 $73 2Q12 3Q12 4Q12 1Q13 2Q13 3Q13 4Q13 IGTi Social Gaming Profitable Growth Fueled by IGT Content and Expanding Markets $18 $23 $34 $31 $41 $46 $45 54% 52% 62% 58% 61% 63% 62% 2Q12 3Q12 4Q12 1Q13 2Q13 3Q13 4Q13 Gross Profit Margin ($MM) ($MM) Revenue Gross Profit and Gross Margin |
|
|
Social Gaming Accomplishments 18 Over 40% increase to 6.7 million Monthly Active Users Over 30% increase to 1.7 million Daily Active Users Over 220% increase to $0.40 Booking Per Daily Active Users #3 highest-grossing Facebook app Facebook Rankings #6 all-time grossing iPad app ever iPad Rankings Game of the Year |
|
|
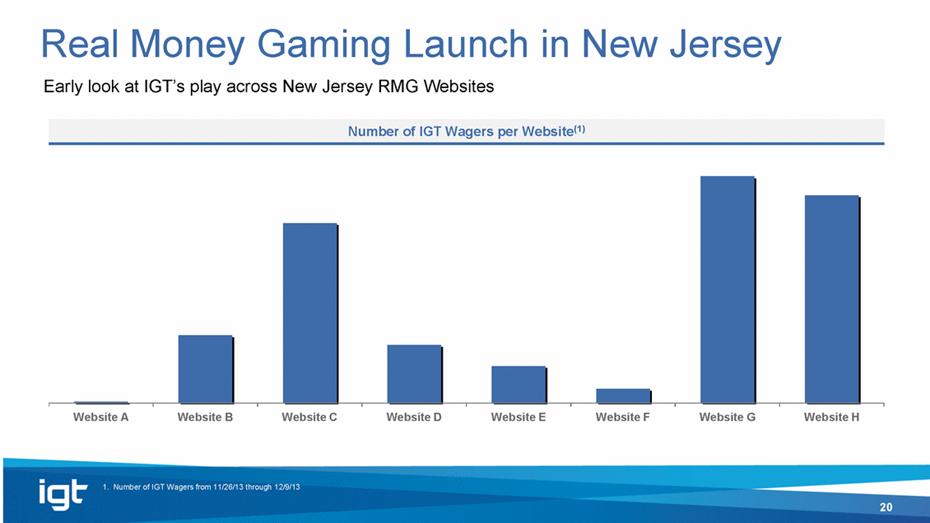
New Jersey RMG Update 19 9 sites have launched with casino-style gaming 50,000 registrations 20 IGT slot games offered Nearly 5 million wagers placed 1. Per Telsey Research Report dated December 2, 2013 Industry IGT (1) |

|
|
Real Money Gaming Launch in New Jersey 20 Website A Website B Website C Website D Website E Website F Website G Website H Early look at IGT’s play across New Jersey RMG Websites Number of IGT Wagers per Website(1) 1. Number of IGT Wagers from 11/26/13 through 12/9/13 |
|
|
Disciplined Capital Allocation |
|
|
Industry-Leading Cash Flow Conversion 2002 2003 2004 2005 2006 2007 2008 2009 2010 2011 2012 2013 CFFO as % of Revenue 3-year moving average Cash Flow From Operations as a Percentage of Revenue 25% 22 |
|
|
Disciplined Approach to Capital Allocation 23 Conservative Consistency Opportunistic Innovation Disciplined Fund Growth Return of Capital Focused on talent, technologies, distribution and content Invested $836MM in R&D from FY2010 through FY2013 Invest in the Business Strategic Outlays Balance Sheet Management Dividends Share Repurchase Maintaining investment grade credit rating Paid $293MM from FY2010 through FY2013 Supporting minimum target yield of 2% Repurchased $716MM from FY2010 through FY2013 $210MM remaining authorization as of November 7, 2013 |
|
|
Global Industry Leadership Accretive Returns to Shareholders Positioning for Long-Term Growth 24 |
|
|
Experienced Management Team Chief Operations Officer Eric Berg EVP, Global Sales Eric Tom EVP, Emerging Businesses & CFO John Vandemore EVP, Human Resources Aimee Hoyt VP, International Sales Sabby Gill VP, Game Development & Product Management Joe Sigrist 25 |
|
|
Experienced Management Team Global Industry Leadership Accretive Returns to Shareholders Positioning for Long-Term Growth 26 |
|
|
[LOGO] |

|
|
Appendix: Reconciliations of GAAP to Non-GAAP Financial Measures 28 Years Ended September 30, 2013 2012 2011 2010 GAAP Diluted EPS from Continuing Operations $1.03 $0.86 $0.97 $0.73 Acquisition-related charges (a) 0.24 0.20 - - Impairment and restructuring 0.01 (0.04) 0.03 0.15 Proxy fees 0.02 - - - Legal settlement 0.01 - - - IP Usage settlements (0.02) - 0.01 - Severance - 0.01 - - Distributor settlement - 0.01 - - Investment (gain) loss - - (0.01) 0.07 Debt ref inancing charges - - - 0.01 Certain discrete tax items (benefits) (b) (0.02) - (0.07) (0.12) Total non-GAAP adjustments 0.24 0.18 (0.04) 0.11 Adjusted Diluted EPS from Continuing Operations 1.27 $ 1.04 $ 0.93 $ 0.84 $ (a) Primarily related to DoubleDown (b) Tax rate effect, except as noted below 35% 37% 36% 38% 2010 investment loss at zero tax benefit and 2012 impairment which included a $44.7 millio n tax benefit related to Entraction closures. |
|
|
Appendix: Reconciliations of GAAP to Non-GAAP Financial Measures () 29 Years Ended September 30, 2013 2012 2011 2010 GAAP Operating Income $494.1 $421.7 $504.9 $424.8 Acquisition-related charges (a) 100.8 94.0 - - Impairment and restructuring 3.6 42.5 15.8 68.4 Proxy fees 7.6 - - - Legal settlement 2.4 - - - IP Usage settlements - - 4.8 - Royalty settlement (5.0) - - - Severance - 2.5 - - Distributor settlement - 3.1 - - Investment (gain) loss - - - - Debt ref inancing charges - - - - Total non-GAAP adjustments 109.4 142.1 20.6 68.4 Adjusted Operating Income 603.5 $ 563.8 $ 525.5 $ 493.2 $ (a) Primarily related to DoubleDown |
|
|
Appendix: Reconciliations of GAAP to Non-GAAP Financial Measures () 30 Years Ended September 30, 2013 2012 2011 Gaming Operations Gross Profit $617.1 $634.3 $633.6 Gaming Operations Capital Expenditures (105.5) (162.4) (189.2) Modified Gaming Operations Free Cash Flow 511.6 $ 471.9 $ 444.4 $ |
