Attached files
| file | filename |
|---|---|
| 8-K - FORM 8-K - Vantage Drilling CO | d644409d8k.htm |
 Vantage Drilling Company
Wells Fargo 2013 Energy Symposium
New York
December 11, 2013
Exhibit 99.1 |
 Some of the statements in this presentation constitute
forward-looking statements. Forward-looking statements relate to
expectations,
beliefs,
projections,
future
plans
and
strategies,
anticipated
events
or
trends
and
similar
expressions
concerning
matters that are not historical facts. The forward looking
statements contained in this presentation involve risks and
uncertainties as well as statements as to:
•
our limited operating history;
•
availability of investment opportunities;
•
general volatility of the market price of our securities;
•
changes in our business strategy;
•
our ability to consummate an appropriate investment opportunity within
given time constraints; •
availability of qualified personnel;
•
changes in our industry, interest rates, the debt securities markets
or the general economy; •
changes in governmental, tax and environmental regulations and similar
matters; •
changes in generally accepted accounting principles by
standard-setting bodies; and •
the degree and nature of our competition.
The forward-looking statements are based on our beliefs,
assumptions and expectations of our future performance, taking
into account all information currently available to us. These
beliefs, assumptions and expectations can change as a result of
many possible events or factors, not all of which are known to us or
are within our control. If a change occurs, our business,
financial condition, liquidity and results of operations may vary
materially from those expressed in our forward-looking
statements.
Forward-Looking Statements
2 |
 Symbol:
VTG (NYSE MKT)
Location:
Houston (Headquarters), Singapore, Dubai
Market
Cap:
$551
million
($1.82
per
share)
Enterprise
Value:
$3.5
billion
Employees:
> 1,100
Contract Backlog:
approximately $3.1 billion
Owned Fleet:
4 Ultra-Premium Jackups (operating in SE Asia & West
Africa) 3 Ultra-Deepwater Drillships (operating offshore
India, GOM & SE Asia) 1
Ultra-Deepwater
Drillship
(under
construction
–
Q3
2015
delivery)
Managed Fleet:
1 Ultra-Deepwater Drillship (under construction)
2 Ultra-Premium Jackups (one operating; one preparing for
commencement) 2 Ultra-Premium Jackups (under
construction) Corporate Overview
3 |
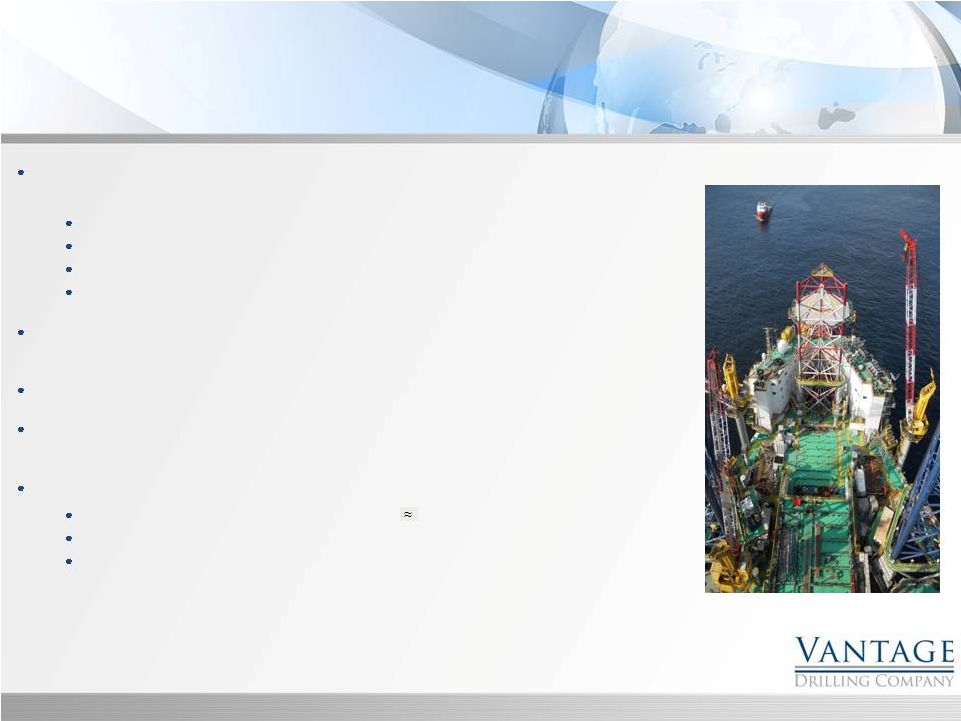 Took
delivery
of
UDW
drillship
Tungsten
Explorer
on
July
11,
2013.
Commenced
operations
on
first contract September 20, 2013.
Contracted 50 days in Myanmar
Contracted 120 days in Malaysia
Contracted 45 days in Gabon
Contracted 2 years (plus 4 x 6-month options) in Congo (Moho Nord
Development) Sapphire Driller
contracted for 18-month contract in West Africa plus
options. Commencement early November.
Ordered
Cobalt
Explorer
–
Ultra-deepwater
drillship;
August
2015
delivery
Vantage
hired
as
construction
manager
for
two
“V
Ships”
Ultra-Deepwater
Drillships
to
be
constructed at DSME shpyard.
Refinanced Balance Sheet
with –
Lowered
borrowing
costs
about
460
BPS
saving
$90
million/year
in
interest
Much longer and staggered maturities
$850
million
of
“prepayable”
debt
Recent Developments
4 |
 Vantage Strategic Focus
5
To provide the long-term
value to our shareholders,
we
must
provide
the
right
people
and
the
right
assets.
The
right
customers
have
long-term business
opportunities that provide
sound cash flow necessary
to
achieve
the
right
financial structure.
Right
People
Right
Assets
Right
Customers
Right
Financial
Structure
Shareholder
Value |
 •
Industry
leading
safety
record
–
in
2012,
we
completed
over
2.2
million man-hours with 0 lost time incidents,
•
Jack-up
fleet
has
achieved
approximately
99% productive
time
over the first 55 months of operations.
•
Enhanced
business
opportunities
as
Vantage
has
been
selected
to
manage complex 3
rd
party shipyard projects.
•
We
are
leveraging
our
technical
expertise
to
manage
operations
of two ultra-high specification jack-ups in Mexico without
making a financial investment.
•
We are investing in leading-edge training programs –
•
CARE –
Competency Assurance with Results and Effectiveness
•
GOLD –
Global Operations Leadership Development Program
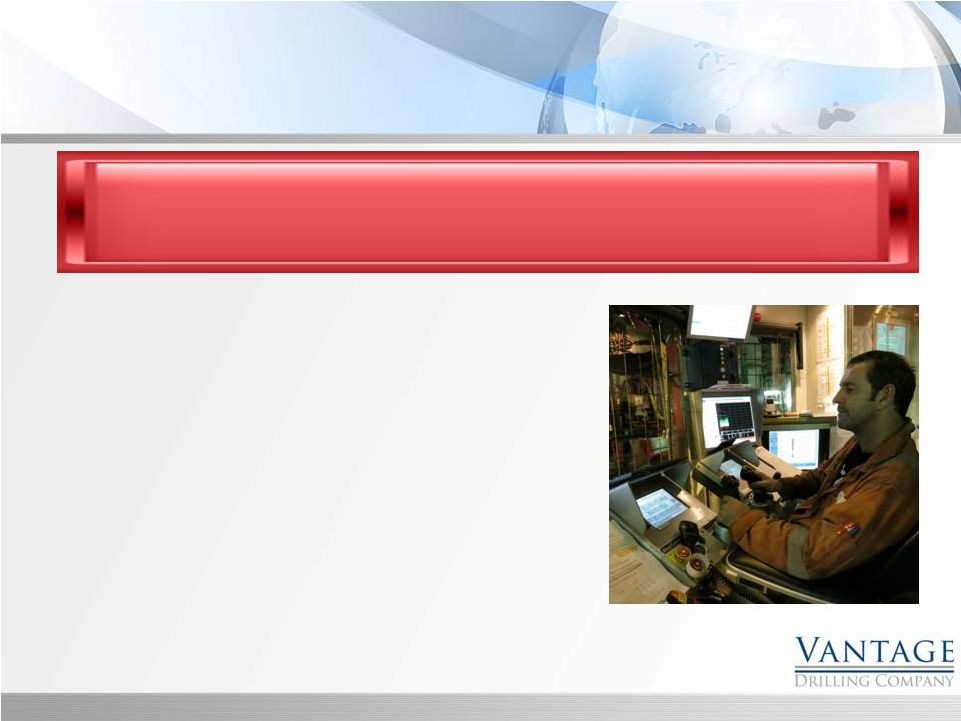
Right People
6
Our senior management team averages over 29 years of
Industry experience. The cornerstones of our corporate culture
are safety and professionalism. |
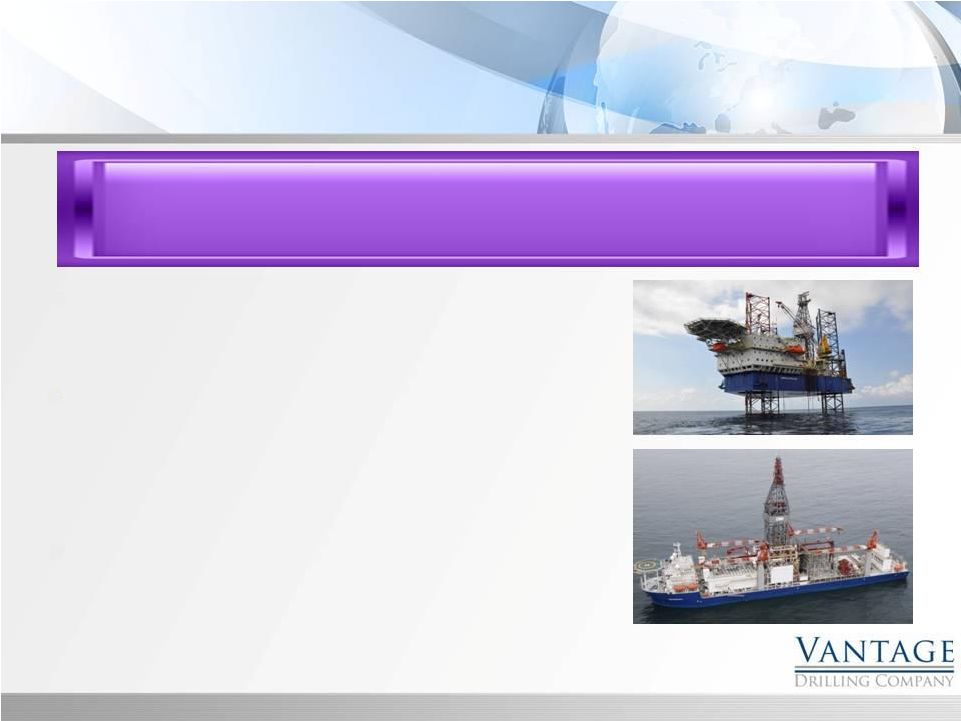 Right
Assets 7
Premium high-specification drilling units, including four
jackup rigs and three drillships. Total costs of owned fleet of
approximately $3.2 billion.
High-specification drillships, combined with deep technical
expertise, has allowed us to secure technically challenging
ultra-deepwater
projects;
Platinum
Explorer
and
Titanium
Explorer
have worked in 9,300+ and 8,800+ feet of water,
respectively.
Recently
ordered
Cobalt
Explorer,
7
th
generation,
dual-
activity UDW drillship equipped with (2) seven-ram
BOP’s. Also invested in joint venture to construct
similar drillshp, Palladium
Explorer
–
construction
subject
to
commercial
issues with builder.
•
•
•
We have built a fleet of new, premium assets that our customers
demand now and for the future. |
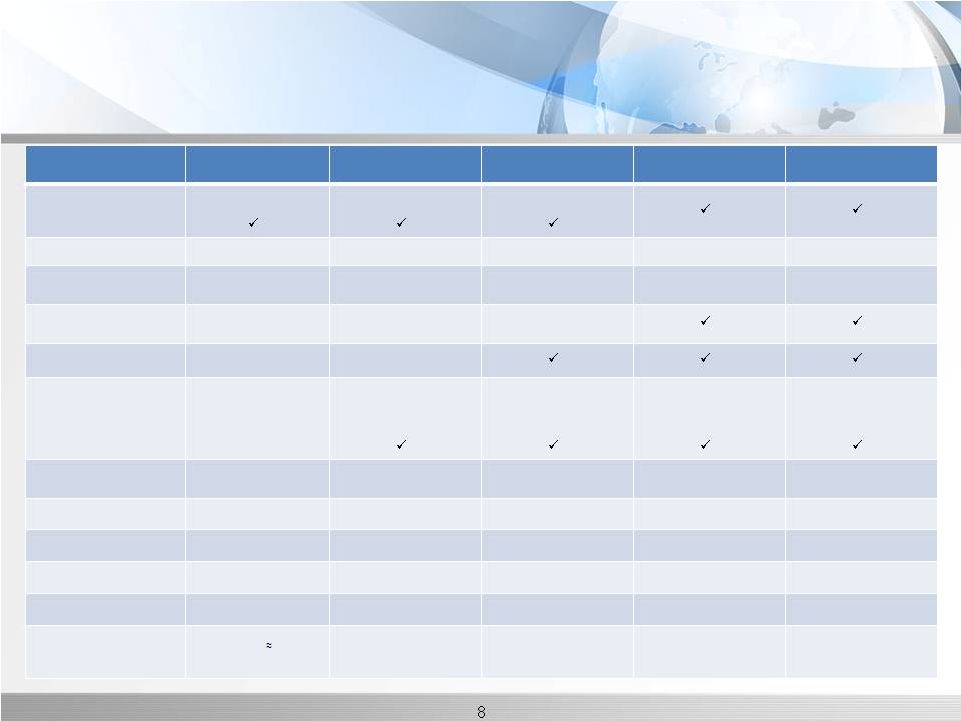 Ultra-Deepwater Bifurcation –
Vantage Has High-Spec Drillships
8
Platinum Explorer
Titanium Explorer
Tungsten Explorer
Cobalt Explorer
Palladium Explorer
Derrick Load Paths –
-
2x Activity
-
1.5x Activity
Draw Works (HP)
4,500
6,000
9,000
9,000 / 6,000
11,200 / 6,000
Hook Load (tons)
(net lifting capacity)
1,000
1,250
1,250
1,250 / 1,000
1,250 / 1,000
Heave Compensating Xmas
Tree Crane (165 t)
Tripsaver
BOPS’s
-
Onboard
-
RAM’s (*planned)
-
API SP53/GOM
Compliant
1
5 /6*
*planned for 2015
1
6
1
6
2
7
2
7
Water Depth
-
Capable/Outfitted
12,000 / 10,000
12,000 / 10,000
12,000 / 10,000
12,000 / 10,000
12,000 / 12,000
Payload
20,000 MT
20,000 MT
20,000 MT
25,000 MT
25,000 MT
Accommodation (beds)
180
180
200
200
212
Thrusters
6 x 5.5 Mw / DP3
6 x 5.5 Mw / DP3
6 x 5.5 Mw / DP3
6 x 5.5 Mw / DP3
6 x 5.5 Mw / DP3
Features
MPD Upgradeable
20K psi Ready
Notable accomplishments
-Drilling well in 8800 ft of
Water
-
>2 million lb casing load
Fastest shipyard delivery –
27 months from order
Drilled well in
9400 ft of
water |
 Owned Assets
Delivered On-Time, On-
Budget -
December 2008
Premium Fleet with a Proven Track Record
Management Projects
Sonangol drillships
Newbuild Ultra-Premium Marine Pacific Class 375 Jackups
Emerald Driller
Sapphire Driller
Aquamarine Driller
Topaz Driller
Ultra-Deepwater 12,000 ft Drillships
Delivered On-Time, On-
Budget -
July 2009
Delivered On-Time, On-
Budget -
December 2009
Delivered On-Time, On-
Budget -
September 2009
3
newbuild project at DSME
Delivered July 2013
On Contract in SE Asia
Tungsten Explorer
Mexican Operator
Construction Management
Platinum Explorer
2
Successful newbuild at
DSME
Delivered April 2012
On Contract in GoM
Titanium Explorer
Palladium Explorer
Cobalt Explorer
th
th
rd
nd
th
Newbuild project pending
resolution of contractual issues
7
generation two x 7-ram
BOP’s, dual-derrick
4
newbuild project at DSME
Leverages shipyard experience
7 generation
two
x
7-ram
BOP’s, dual-derrick
Delivery Q3 2015
Delivered On-Time, On-
Budget -
November 2010
Hired by newly formed
drilling company to
manage initial assets
2 x “V ships”
UDW
drillships at DSME
9 |
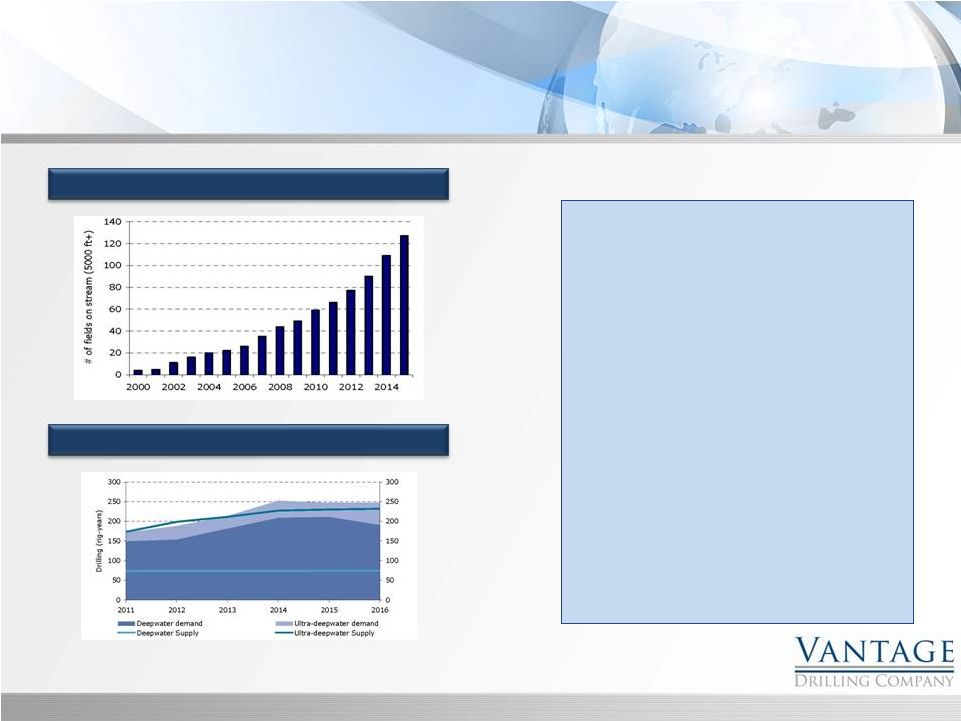 Strong Demand for Deepwater Assets
10
Source: ODS-Petrodata, DnB NOR
“Investments in global deepwater
exploration are predicted by Wood
Mackenzie to more than double from
last year’s level of $43 billion to as
much as $114 billion by 2022, driven
by the need to find the world’s
remaining hydrocarbons in greater
water depths…
As a result,
there will be a need for 95
additional deepwater rigs to be built
between 2016 and 2022…
Representing a change for the
deepwater sector from cyclical to
sustained growth.”
Continued Growth Cycle
Demand is Likely to Exceed Rig Supply |
 Jackups
•
Modern, high-spec jackups have been, and continue to be
essentially fully contracted
•
Customers have strong preference for modern, high-spec
jackups •
We believe the market will easily absorb additional newbuilds for quite
some time.
11
“Enough said”
315
315
Jackups
>25 yrs old
115
115
Jackups
Under
Construction |
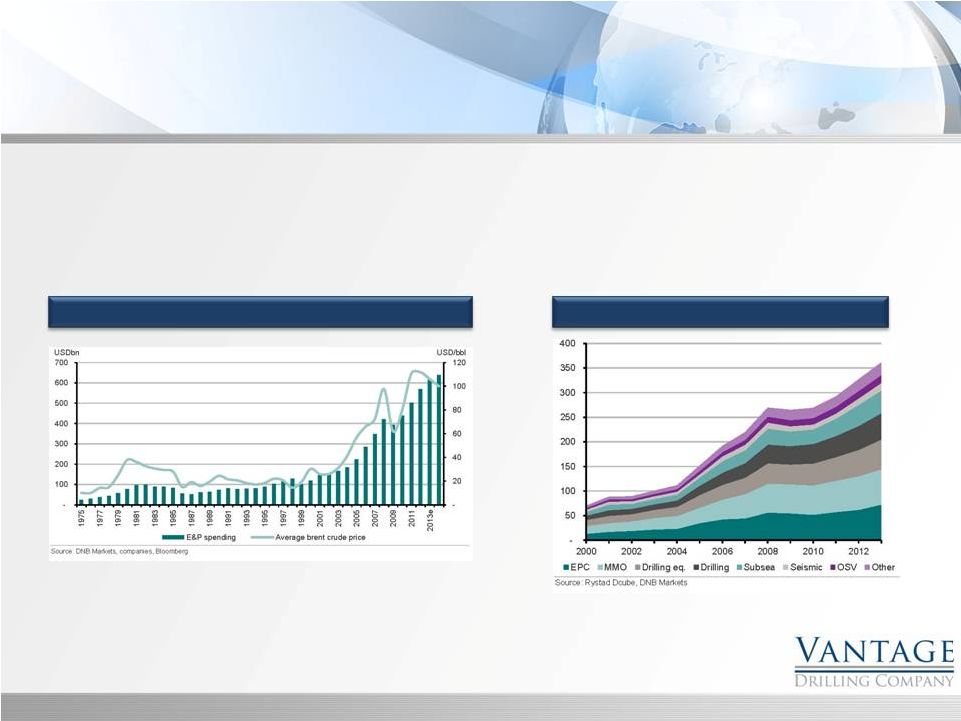 Spending Trends
12
Industry spending trends remain positive for continued
strong demand for offshore drilling.
Continued E&P Spending Growth
Over Half of E&P Spend is Offshore |
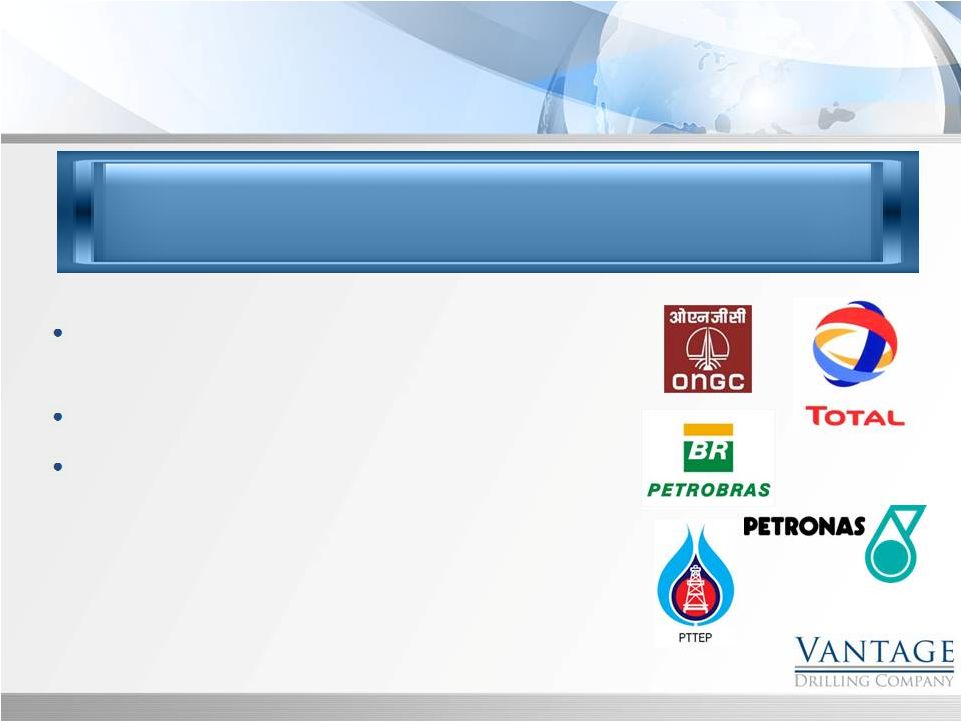 Right
Customers 13
We have focused our marketing efforts on customers with long-term drilling
requirements providing the opportunity for long-term contracts.
Three
of
our
jack-ups
are
currently
working
for
repeat
customers.
We
currently
have
over
$3.1
billion
of
backlog.
We have continuously improved our high satisfaction
ratings, based on direct customer surveys.
|
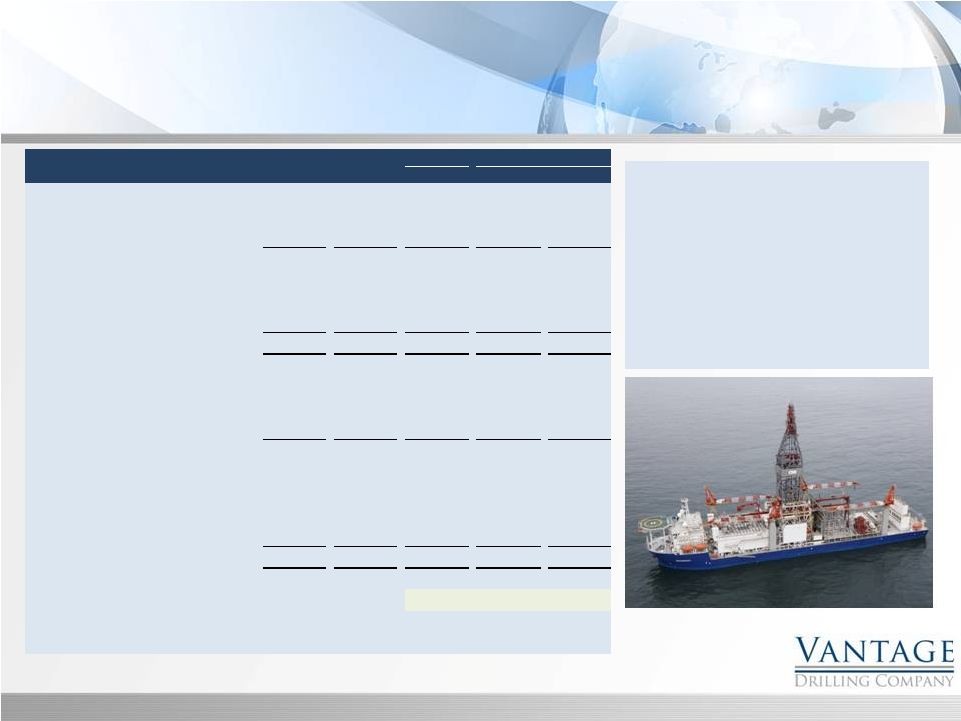
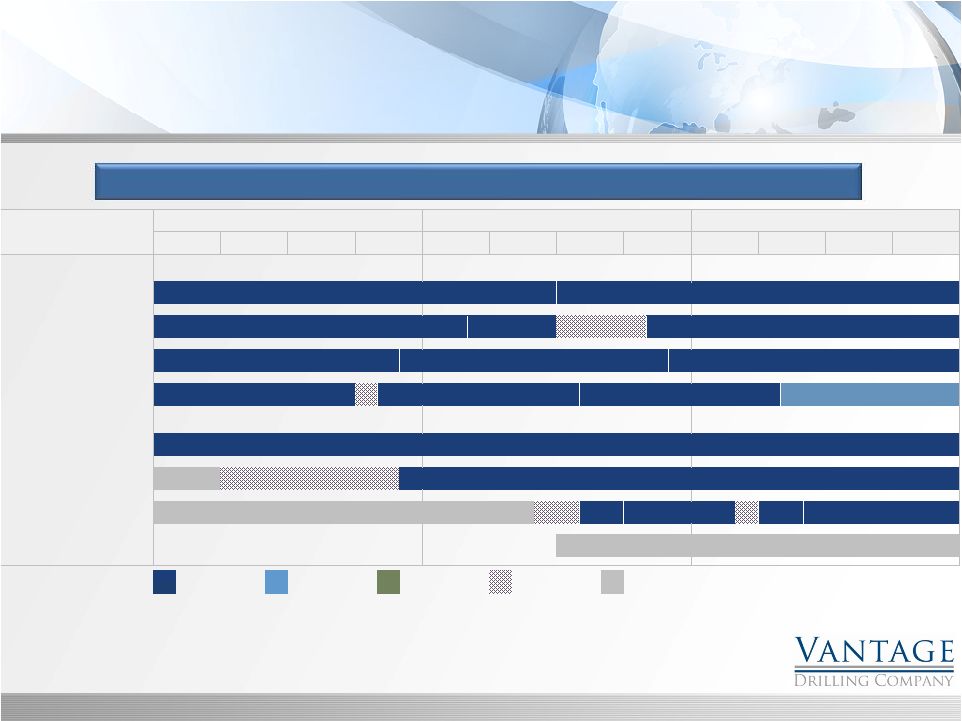 Customers Provide Strong Backlog
14
Customer
backlog
of
approximately
$3.1
Billion
provides
visibility
to
cash
flows
Ownership
2012
2013
2014
Rig
%
Q1
Q2
Q3
Q4
Q1
Q2
Q3
Q4
Q1
Q2
Q3
Q4
Jackups
Emerald Driller
100%
$130,000
$156,000 (2 years)
Sapphire Driller
100%
$120,000 (net of taxes)
$165,000 (net)
18 months
Aquamarine Driller
100%
$132,000
$153,000
$155,000
Topaz Driller
100%
$187,000 (incl. upgrades and mobilization)
$155,000
$155,000
$155,000 (12 mos. - Indonesia)
Drillships
Platinum Explorer
100%
$590,000 (5 years)
Titanium Explorer
100%
$572,000 (8 years)
(2)
Tungsten Explorer
100%
(48 days)
4 wells (145 days)
60 days
$641,000 (2 years firm)
Cobalt Explorer
100%
Contracted
Option
Letter of Award;
Commisioning /
Construction
Contract
subject to conditions
Mobilization
(1)
Average drilling revenue per day is based on the total estimated revenue divided by the minimum number
of days committed in a contract. Unless otherwise noted, the total revenue includes any
mobilization and demobilization fees and other contractual revenues associated with the drilling
services. (2)
The drilling revenue per day includes the achievement of the 12.5% bonus opportunity, but excludes
mobilization revenues and revenue escalations included in the contract. |
 We have refinanced our senior debt –
Staggered maturities through 2023,
Added flexibility to pre-pay debt without premiums,
Reduced
annual
cash
interest
costs
by
approximately
$90
million,
and
We have expanded our UDW fleet with limited equity exposure
– Cobalt
Explorer
(only
$59.5
million
down
payment;
tail-end
heavy
contract)
Palladium
Explorer
investment
(42%)
limits
pre-delivery
equity
exposure
to
$31 million. (Project pending resolution of contractual
issues.) Right Financial Structure
15
Our financial leverage is counter-balanced by a strong contract
backlog and long-term visibility of cash flows. |
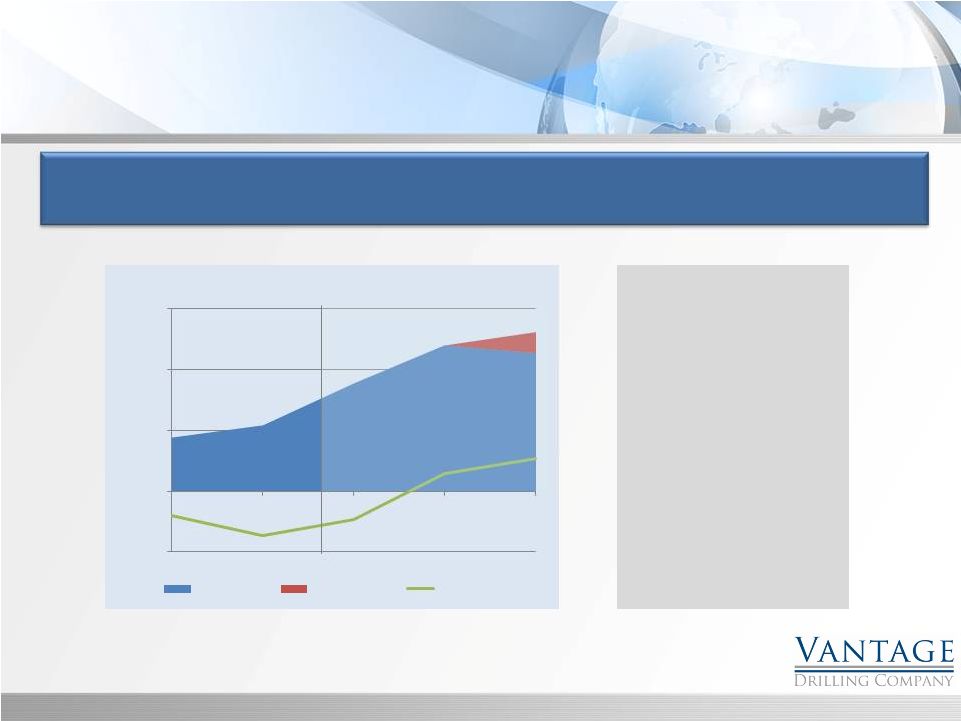 Strong Growing Cash Flow to Service Debt
16
Long-term contracts provide visibility to cash flow to support existing
leverage. Investments made to-date generating favorable returns
for the future. Commencing
Q4 2013
Vantage has
seven out of
seven completed
rigs in service
(versus only five
in Q3)
$(200.0)
$-
$200.0
$400.0
$600.0
2011
2012
2013
2014
2015
Majority of Projected EBITDA is Contracted
Contracted
Uncontracted
Net Income
Projected
Actual |
 Strategic Focus
Debt
Refinancing
–
DONE
Titanium
Explorer
back
to
full
day
rate
–
DONE
Tungsten
Explorer
contract
commencing
with shipyard delivery (“gap period”) –
DONE
Sapphire
Driller
Contract
–long-term
follow
on job –
DONE
Add
UDW
asset
–
Cobalt
Explorer
–
DONE
Deployment & startup of Tungsten Explorer
–
resulting in EBITDA run-rate > $500
million; dramatically increasing profitability
–
DONE
•
Deployment
of
Cobalt
Explorer
–
Aug.
2015
•
Deployment of Palladium Explorer (42% VTG)
•
Accelerating
reduction
of
debt
/
improved
debt
statistics and rating
•
Begin
to
return
capital
to
shareholders
17
Next Steps
Near Term |
 HISTORICAL FINANCIAL
Appendix
18 |
 Balance Sheet
The Debt to EBITDA leverage
ratio will continue to reduce as
Vantage reports a full year of
operations from the Titanium
Explorer
(December
2012)
and
the Tungsten Explorer
(September 2013)
19
($ in millions)
December 31,
December 31,
2011
2012
31-Mar-13
30-Jun-13
30-Sep-13
Cash and cash equivalents
117.0
$
506.2
$
460.5
$
443.8
$
71.1
$
Trade receivables
100.9
119.5
101.9
107.9
144.9
Inventory, prepaids & other
41.3
63.1
62.1
64.8
65.9
Total current assets
259.2
688.8
624.5
616.5
281.9
Property and Equipment
1,805.1
2,717.5
2,711.2
2,719.2
3,207.2
Other assets
58.2
123.9
119.9
125.4
128.7
Total assets
2,122.5
$
3,530.2
$
3,455.6
$
3,461.1
$
3,617.8
$
Accounts payable and accruals
150.2
$
174.4
127.5
133.1
176.8
Revolving Credit Agreement
-
-
-
-
10.0
Current maturities
-
31.2
41.0
47.3
53.5
Total current liabilities
150.2
205.6
168.5
180.4
240.3
Long-term debt
1,246.4
2,710.6
2,796.3
2,784.8
2,862.5
Other long-term liabilities
29.8
45.5
43.4
42.7
41.5
Shareholders equity
696.1
568.5
447.4
453.2
473.5
Total liabilities and shareholders' equity
2,122.5
$
3,530.2
$
3,455.6
$
3,461.1
$
3,617.8
$
Long-term Debt/LTM EBITDA
7.1
X
12.6
X
12.6
X
10.7
X
9.9
X
For the Quarter Ended |
 Statement of Operations
20
Net income and cash flow from
operations is increasing
significantly for Vantage as the
Tungsten
Explorer
commenced
operations in September 2013.
($ in millions)
December 31,
December 31,
2011
2012
31-Mar-13
30-Jun-13
30-Sep-13
REVENUE
Contract Drilling Services
366.8
$
423.8
$
134.7
$
155.8
$
158.9
$
Management Fees
13.7
6.6
3.2
2.4
3.9
Reimbursables
105.3
41.0
9.1
12.4
13.1
Total revenues
485.8
471.4
147.0
170.6
175.9
OPERATING COSTS AND EXPNSES
Operating Costs
284.9
230.1
75.3
77.1
84.1
General and Administrative
26.3
26.0
7.4
7.0
8.9
Depreciation
64.5
68.7
24.9
25.0
24.9
Total operating expenses
375.7
324.8
107.6
109.1
117.9
INCOME FROM OPERATIONS
110.1
146.6
39.4
61.5
58.0
OTHER INCOME (EXPENSE)
Interest Income
0.1
0.1
0.1
0.1
-
Interest Expense and Financing
(154.9)
(149.1)
(59.7)
(51.3)
(47.4)
Loss on Debt Extinguishment
(25.2)
(124.6)
(98.3)
-
-
Other Income
1.3
0.6
0.9
1.0
0.3
Total other expenses
(178.7)
(273.0)
(157.0)
(50.2)
(47.1)
INCOME (LOSS) BEFORE TAX
(68.6)
(126.4)
(117.6)
11.3
10.9
INCOME TAX PROVISION
11.4
18.9
5.6
7.1
4.1
Net income (loss)
(80.0)
$
(145.3)
$
(123.2)
$
4.2
$
6.8
$
INCOME (LOSS) PER SHARE
(0.28)
$
(0.50)
$
(0.41)
$
0.01
$
0.02
$
PRO FORMA INCOME (LOSS) PER SHARE
(0.19)
$
(0.07)
$
(0.08)
$
0.01
$
0.02
$
EBITDA
174.7
$
215.3
$
64.3
$
86.5
$
83.0
$
LTM EBITDA
174.7
$
215.3
$
222.3
$
260.4
$
290.3
$
For the Quarter Ended |
 EBITDA RECONCILIATION
21
($ in millions)
December 31,
December 31,
2011
2012
31-Mar-13
30-Jun-13
30-Sep-13
Net Income (Loss)
(80.0)
$
(145.3)
$
(123.2)
$
4.2
$
6.8
$
Interest Expense, Net
154.8
149.0
59.6
51.2
47.4
Income Tax Provision
11.4
18.9
5.6
7.1
4.1
Depreciation
64.5
68.7
24.9
25.0
24.9
Loss on Debt Extinguishment
25.2
124.6
98.3
-
-
Other
(1.2)
(0.6)
(0.9)
(1.0)
(0.2)
EBITDA
174.7
$
215.3
$
64.3
$
86.5
$
83.0
$
For the Quarter Ended |