Attached files
| file | filename |
|---|---|
| 8-K - FORM 8-K - DELTA AIR LINES, INC. | delta_8k.htm |
Exhibit 99.1


Setting A New Standard Richard Anderson Chief Executive Officer
This presentation contains various projections and other forward - looking statements which represent Delta’s estimates or expectations regarding future events. All forward - looking statements involve a number of assumptions, risks and uncertainties, many of which are beyond Delta’s control, that could cause the actual results to differ materially from the projected results. Factors which could cause such differences include, without limitation, business, economic, competitive, industry, regulatory, market and financial uncertainties and contingencies, as well as the “Risk Factors” discussed in Delta’s SEC filings. Caution should be taken not to place undue reliance on Delta’s forward - looking statements, which represent Delta’s views only as of the date of this presentation, and which Delta has no current intention to update. In this presentation, we will discuss certain non - GAAP financial measures. You can find the reconciliations of those measures to comparable GAAP measures on our website at delta.com. Safe Harbor 3

Setting A New Standard Building a durable franchise that creates value for our employees, customers and investors 4 CUSTOMER SERVICE FINANCE REVENUE PEOPLE OPERATIONS Build a Better Airline Deliver Industry Leading Financial Results Build a Diversified, Profitable Global Network Work Together, Win Together Be Safe, Reliable and Customer Focused

Charting Our Course Ed Bastian President
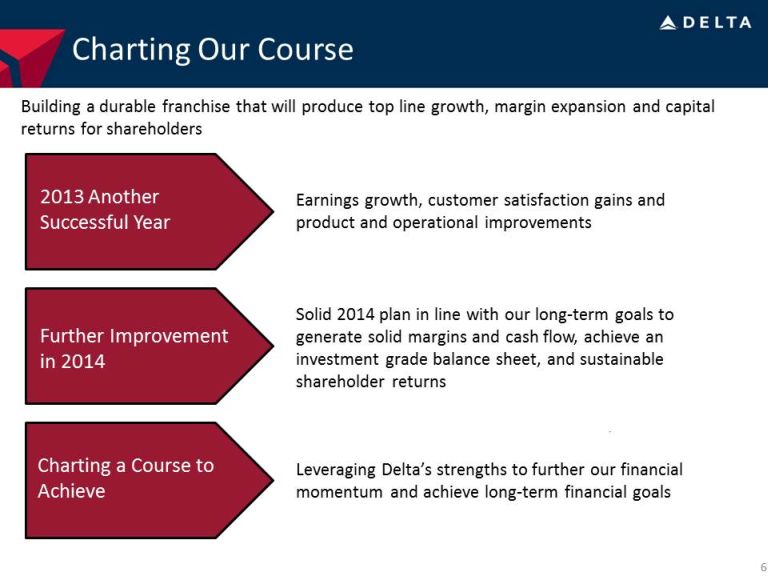
Charting Our Course Building a durable franchise that will produce top line growth, margin expansion and capital returns for shareholders 6 2013 Another Successful Year Further Improvement in 2014 Charting a Course to Achieve Solid 2014 plan in line with our long - term goals to generate solid margins and cash flow, achieve an investment grade balance sheet, and sustainable shareholder returns Leveraging Delta’s strengths to further our financial momentum and achieve long - term financial goals Earnings growth, customer satisfaction gains and product and operational improvements

2013 – Continuing Our Climb A successful year for employees, customers, and investors 7 2013 Accomplishments • Best employee relations in the industry with employee engagement scores at all time highs • Set the industry standard in wages and benefits, including nearly $500 million in profit sharing Make Delta a Great Place to Work for Employees Make Delta the Airline Customers Want to Fly Make Delta a Great Investment for Investors • Record $2.6 billion pre - tax profit, a 70% increase year over year, with 2.7 points of pre - tax margin expansion • $2 billion of free cash flow, adjusted net debt of $9.6 billion and $350 million returned to shareholders • Stock up 140% year to date, the 4 th best performance in the S&P 500 • Running customer focused airline with industry leading product and operations • Opened new international terminals in Atlanta and New York; launched partnership with Virgin Atlantic; and continued development of international gateways • Recognized as Fortune’s “Most Admired Airline”, “Best Airline” by Business Travel News and “Most Admired Airline” by The Beat
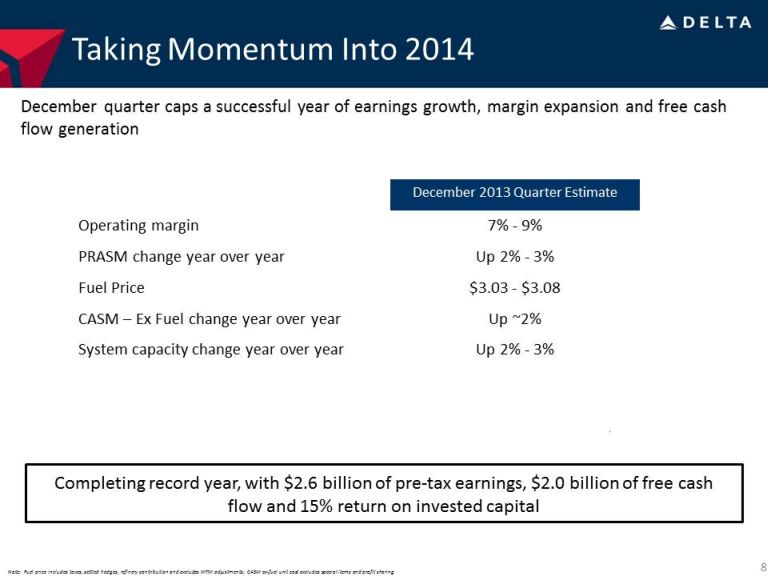
Taking Momentum Into 2014 December quarter caps a successful year of earnings growth, margin expansion and free cash flow generation 8 …And We Delivered December 2013 Quarter Estimate Operating margin 7% - 9% PRASM change year over year Up 2% - 3% Fuel Price $3.03 - $3.08 CASM – Ex Fuel change year over year Up ~2% System capacity change year over year Up 2% - 3% Note: Fuel price includes taxes, settled hedges, refinery contribution and excludes MTM adjustments; CASM ex - fuel unit cost excludes special items and profit sharing Completing record year, with $2.6 billion of pre - tax earnings, $2.0 billion of free cash flow and 15% return on invested capital
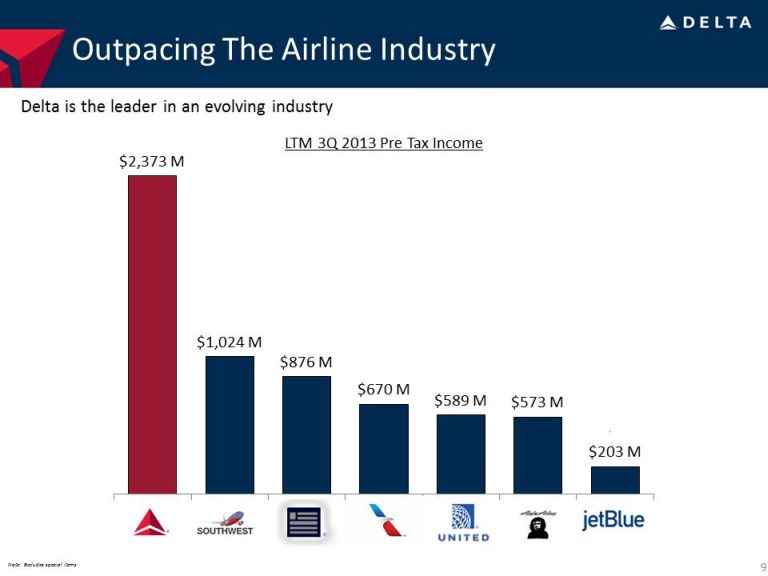
Outpacing The Airline Industry 9 $2,373 M $1,024 M $876 M $670 M $589 M $573 M $203 M LTM 3Q 2013 Pre Tax Income Delta is the leader in an evolving industry Note: Excludes special items

Taking Momentum Into 2014 Plan for 2014 builds on our strengths to expand margins and cash flow, providing for debt reduction, capital returns for shareholders and investment in the future 10 Across the Industry At Delta • Modest global GDP improvement of 2 – 3% with strongest improvements in Latin America • Continued stabilization of the airline industry as merger integrations evolve • Domestic capacity discipline keeps industry growth below GDP • Growth in corporate travel spend; Global Business Travel Association estimate is for 7% increase • Fifth year of $1 billion plus in pre - tax earnings • Disciplined capacity growth of 0 – 2% in 2014 – Domestic, Atlantic, and Pacific capacity below region GDP forecast; growth focused in Latin America to leverage partnerships • Driven by corporate share gains, passenger revenue initiatives and strong operating performance – Passenger revenue improvements fueled by network enhancements in New York and Seattle; corporate share gains; and benefits from investments in partners, products and services • Market fuel price of $3.00 - $3.10 per gallon • Structural initiatives keep non - fuel unit cost growth below inflation • Continued investment in quality, reliability, service and product

Delta - Goal High Quality Industrial Transports - 5 yr average Delta - Goal High Quality Industrial Transports - 5 yr average Charting Our Course • With four years of sustained profitability and free cash flow, Delta is now focused on taking performance to the next level • Developed a set of financial targets that will guide our decision making in the coming years • Benchmarked against high quality industrial transports 11 Note: High quality industrial transports are companies with similar index characteristics to Delta – part of S&P 500 and Dow Tra nsportation Index (CHRW, CSX, EXPD, FDX, KSU, NSC, R, UNP, UPS); Data source is Thomson One Return on Invested Capital Goal: 15% EPS Growth Goal: 10% - 15% • 10 - 12% annual operating margins Operating Margin • Annual EPS growth of 10 - 15% EPS Growth • 15% return on invested capital ROIC • $5+ billion annual operating cash flow with ~50% reinvested back into the business Cash Flow • Investment grade balance sheet metrics, including $7 billion of adjusted net debt by 2015 Balance Sheet Setting long - term goals to further build a franchise that generates solid margins and cash flow, an investment grade balance sheet, and sustainable shareholder returns Delta’s Long - Term Goals 10 - 15% 10% 15% 14%

The Path To Achieving Financial Goals Leveraging Delta’s strengths produces a pipeline of initiatives to further our financial momentum and achieve long - term financial goals 12 • Domestic refleeting – upgauging fleet to more efficiently serve Delta’s expanded network • Product and Operational Investments – harvesting the benefits from our investments • Gaining corporate share – leveraging our network, product and operations to increase corporate share • International partnerships – investing in our partners to expand Delta’s global reach • Win in New York – leveraging scale we have achieved in the most lucrative travel market • Ancillary revenues – harnessing the opportunity from 160 million annual passengers • Trainer Refinery – using vertical integration to lower Delta’s largest input cost • Delevering – creates path for investment grade balance sheet metrics and reduces interest burden Our Guiding Principles Drive for continued efficiency gains Expand the global network reach Continued Product and Operational Improvements Maximize the benefits of scale Restore balance to the supply chain Build a powerful balance sheet Pipeline of Initiatives to Achieve Our Goals
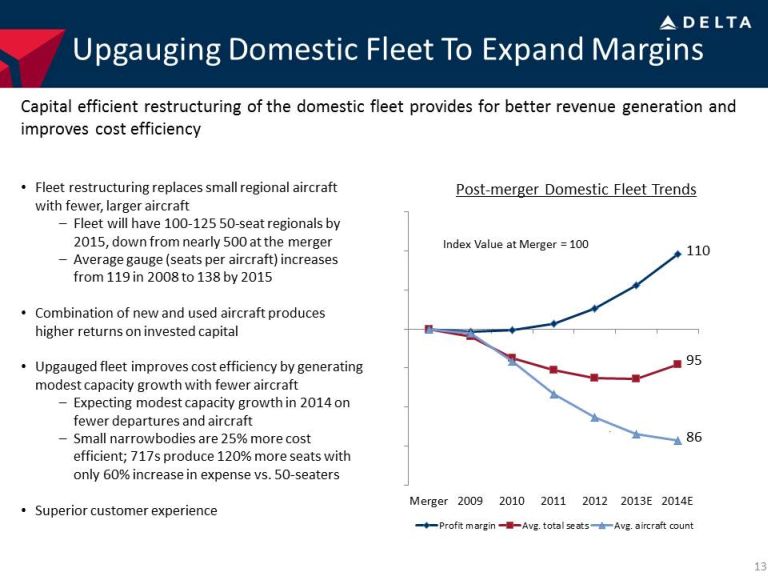
Merger 2009 2010 2011 2012 2013E 2014E Profit margin Avg. total seats Avg. aircraft count Upgauging Domestic Fleet To Expand Margins Capital efficient restructuring of the domestic fleet provides for better revenue generation and improves cost efficiency 13 • Fleet restructuring replaces small regional aircraft with fewer, larger aircraft – Fleet will have 100 - 125 50 - seat regionals by 2015, down from nearly 500 at the merger – Average gauge (seats per aircraft) increases from 119 in 2008 to 138 by 2015 • Combination of new and used aircraft produces higher returns on invested capital • Upgauged fleet improves cost efficiency by generating modest capacity growth with fewer aircraft – Expecting modest capacity growth in 2014 on fewer departures and aircraft – Small narrowbodies are 25% more cost efficient; 717s produce 120% more seats with only 60% increase in expense vs. 50 - seaters • Superior customer experience Post - merger Domestic Fleet Trends Index Value at Merger = 100 110 95 86
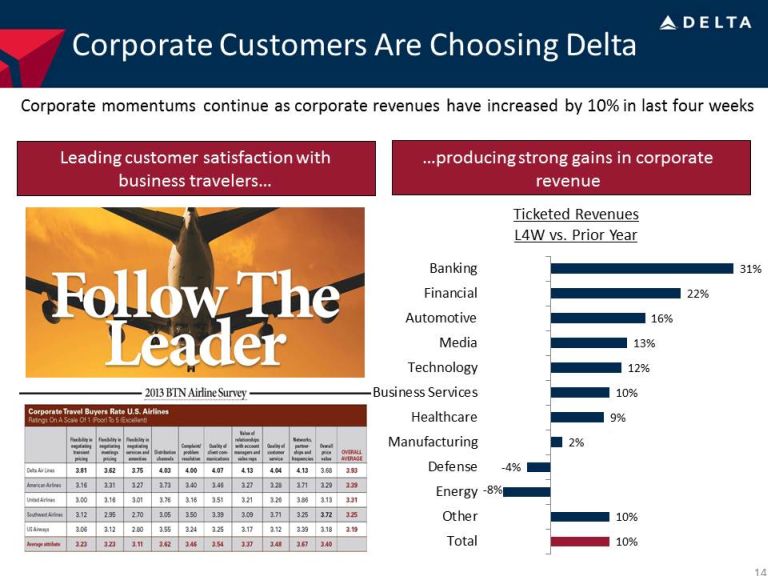
Corporate Customers Are Choosing Delta Corporate momentums continue as corporate revenues have increased by 10% in last four weeks A diverse base of corporate customers…. …and strong gains in corporate revenue Leading customer satisfaction with business travelers… …producing strong gains in corporate revenue 14 10% 10% - 8% - 4% 2% 9% 10% 12% 13% 16% 22% 31% Total Other Energy Defense Manufacturing Healthcare Business Services Technology Media Automotive Financial Banking Ticketed Revenues L4W vs. Prior Year
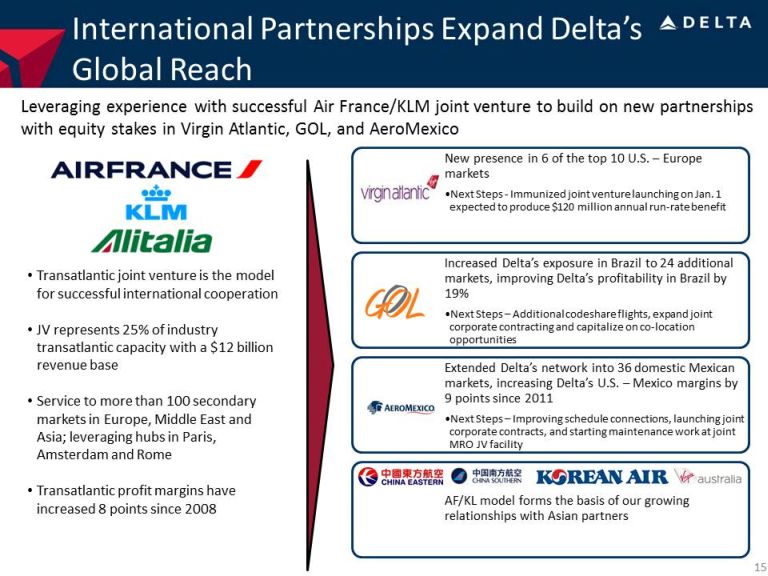
International Partnerships Expand Delta’s Global Reach Leveraging experience with successful Air France/KLM joint venture to build on new partnerships with equity stakes in Virgin Atlantic, GOL, and AeroMexico 15 • Transatlantic joint venture is the model for successful international cooperation • JV represents 25% of industry transatlantic capacity with a $12 billion revenue base • Service to more than 100 secondary markets in Europe, Middle East and Asia; leveraging hubs in Paris, Amsterdam and Rome • Transatlantic profit margins have increased 8 points since 2008 New presence in 6 of the top 10 U.S. – Europe markets • Next Steps - Immunized joint venture launching on Jan. 1 expected to produce $120 million annual run - rate benefit Increased Delta’s exposure in Brazil to 24 additional markets, improving Delta’s profitability in Brazil by 19% • Next Steps – Additional codeshare flights, expand joint corporate contracting and capitalize on co - location opportunities Extended Delta’s network into 36 domestic Mexican markets, increasing Delta’s U.S. – Mexico margins by 9 points since 2011 • Next Steps – Improving schedule connections, launching joint corporate contracts, and starting maintenance work at joint MRO JV facility AF/KL model forms the basis of our growing relationships with Asian partners

Unique Opportunity With Virgin Atlantic 16 Top 10 markets US - Europe Direct Service pre - JV Direct Service w/Partner New York – London 3 daily 7 daily Los Angeles – London New York - Paris Chicago – London Newark - London Miami – London Washington D.C. – London Boston – London San Francisco – London New York - Frankfurt Virgin Atlantic joint venture provides unique opportunity to build network scale in the top U.S. to Europe travel markets • Immunized joint venture creates instant step - function improvement in Delta’s Heathrow scale without added industry capacity – Heathrow accounts for 85% of all travelers in the top 10 U.S. – Europe markets and 55% of travelers in the top 25 U.S. – Europe markets • Codeshare has already produced good traction with customers -- $25 million in incremental revenues and 0.5 points of increased market share • Full cooperation between partners will produce better options for customers and an improvement to airline profitability – First coordinated schedule in April 2014 – Leveraging Delta’s network feed to launch new service from Seattle and Detroit to Heathrow – Joint corporate and agency sales programs – Co - locate airport facilities for key markets – Cost benefits from more efficient ground handling, maintenance and cargo

Investments in New York Are Delivering Benefits Building scale and improving the product to improve margin performance in the most lucrative travel market in the US 17 MD - 90 Virgin Atlantic • Work so far has improved Delta’s margins by 5 pts in New York – New York share gap has closed by 50%, but work remains to close the gap entirely • Goal is to bring New York to profitability in 2014. Path to those gains: – Maturing LGA expansion – reallocation of slots between carriers produces “consolidation - like” scale improvements – LHR expansion – immunized joint venture with Virgin Atlantic creates an attractive option for business travelers on the largest U.S. – Europe market – Corporate share gains – improved service offerings winning over corporate customers, particularly in the banking and financial services sectors – Improved products, services and facilities • JFK Terminal 4 opened with next phase of improvements already underway • LGA Terminal C & D improvements - 1 pts 1 pts 5 pts 2011 2012 2013 YOY Change in NY Segment Margin Weekly Seat Departures Summer 2014 350K 340K 220K 175K Delta United American JetBlue

- 20.00 - 15.00 - 10.00 - 5.00 0.00 5.00 10.00 15.00 Jan - 09 Jan - 10 Jan - 11 Jan - 12 Jan - 13 Improving Profitability at the Trainer Refinery • Initial impact of vertical integration strategy has lowered market jet fuel prices, reducing Delta’s total fuel expense • 2014 initiatives expected to produce Delta - specific benefit through refinery profitability 18 Plan to bring Trainer to profitability in 2014 Initial benefit has been to lower market jet fuel prices Initiatives expected to bring Trainer to profitability in 2014 • Lower Crude Price – Shift crude slate to lower cost domestic crude – targeting 70K bpd in 2014 vs. 17K in 2013 – Lowers average crude cost by $2 - 3 per barrel • Increase Higher Value Distillates – Infrastructure changes required to increase distillate production to be completed in 1Q14 – Jet and diesel production expected to increase to 40% of production in 2014 • Operational Improvements – Focused on maximizing throughput and increasing liquid volume recovery – Maintain excellent safety record and lowest operating cost in PADD I Jet Fuel Premium/(Discount) to ULSD (cents per gallon)

$ 17.0B $ 15.0B $ 12.9B $ 11.7B $ 9.6B $ 7.0B 2009 2010 2011 2012 2013E 2015 Target Stronger Balance Sheet, Stronger Company 19 Valuation Allowance On Track to Achieve $10 Billion of Debt Reduction by 2015 Strong cash flow generation allowing for additional debt reduction, which produces further improvements to earnings, cash flow and balance sheet Adjusted Net Debt

Charting Our Course Building a durable franchise that will produce top line growth, margin expansion and capital returns for shareholders 20 2013 Another Successful Year Further Improvement in 2014 Charting a Course to Achieve Solid 2014 plan in line with our long - term goals to generate solid margins and cash flow, achieve an investment grade balance sheet, and sustainable shareholder returns Leveraging Delta’s strengths to further our financial momentum and achieve long - term financial goals Earnings growth, customer satisfaction gains and product and operational improvements
Running A Reliable, Customer - Focused Airline Steve Gorman Chief Operating Officer
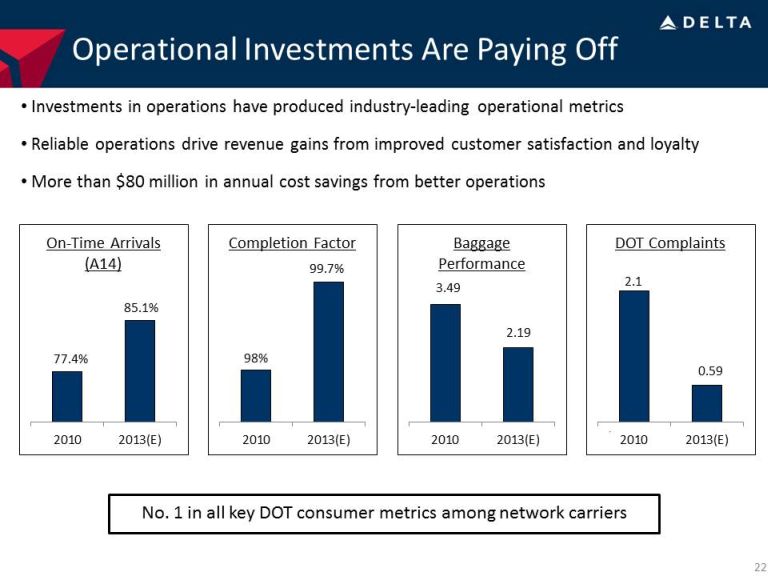
Operational Investments Are Paying Off 22 • Investments in operations have produced industry - leading operational metrics • Reliable operations drive revenue gains from improved customer satisfaction and loyalty • More than $80 million in annual cost savings from better operations 2010 2013(E) On - Time Arrivals (A14) 2010 2013(E) Completion Factor 2010 2013(E) Baggage Performance No. 1 in all key DOT consumer metrics among network carriers 2010 2013(E) DOT Complaints 77.4% 85.1% 98% 99.7% 3.49 2.19 2.1 0.59

Focus Areas For Continuous Improvement Industry leading operational performance in 2013; Goals for 2014 improve upon those results Completion Factor • Operations and Customer focus • Maintenance capture rate and planning • Fleet reliability projects • Parts allocation compliance On - Time Arrivals • Refined aircraft turn process • Staffing flexibility • Quick - turn procedures Baggage Performance • Enhanced re - routing • Bag system upgrades Service Recovery • Re - booking improvements • Expanded self - service technology • Customer service training International Product/Service • 100% flat - beds pre - summer 2014 • Improved coach product • International Wi - Fi • Higher completion factor 23 Driving improvements in Net Promoter Scores over past three years Domestic up 114%; International up 56%

Building Our Revenue Momentum Glen Hauenstein Chief Revenue Officer
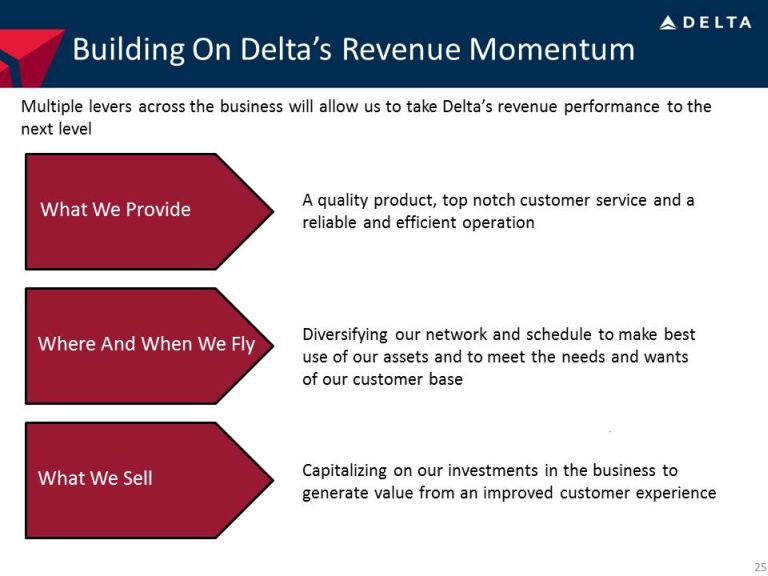
Building On Delta’s Revenue Momentum 25 What We Provide Where And When We Fly What We Sell A quality product, top notch customer service and a reliable and efficient operation Capitalizing on our investments in the business to generate value from an improved customer experience Diversifying our network and schedule to make best use of our assets and to meet the needs and wants of our customer base Multiple levers across the business will allow us to take Delta’s revenue performance to the next level
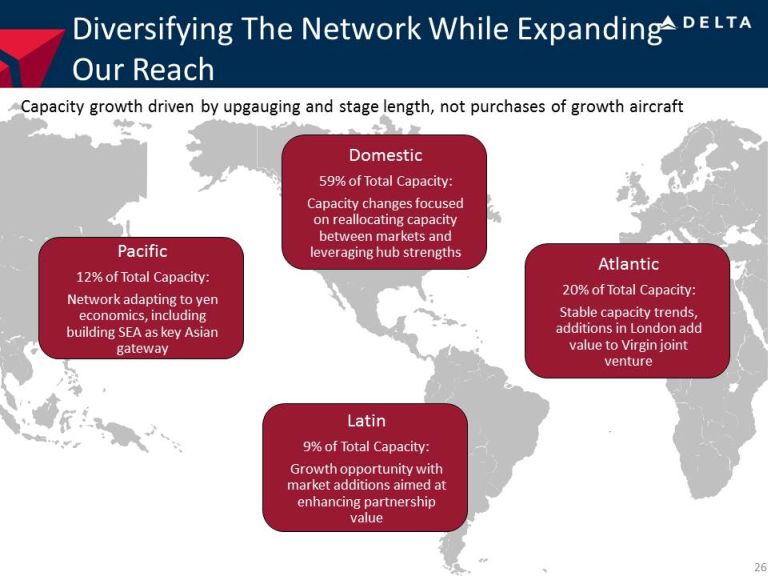
Diversifying The Network While Expanding Our Reach 26 Pacific 12% of Total Capacity: Network adapting to yen economics, including building SEA as key Asian gateway Domestic 59% of Total Capacity: Capacity changes focused on reallocating capacity between markets and leveraging hub strengths Atlantic 20% of Total Capacity: Stable capacity trends, additions in London add value to Virgin joint venture Latin 9% of Total Capacity: Growth opportunity with market additions aimed at enhancing partnership value Capacity growth driven by upgauging and stage length, not purchases of growth aircraft
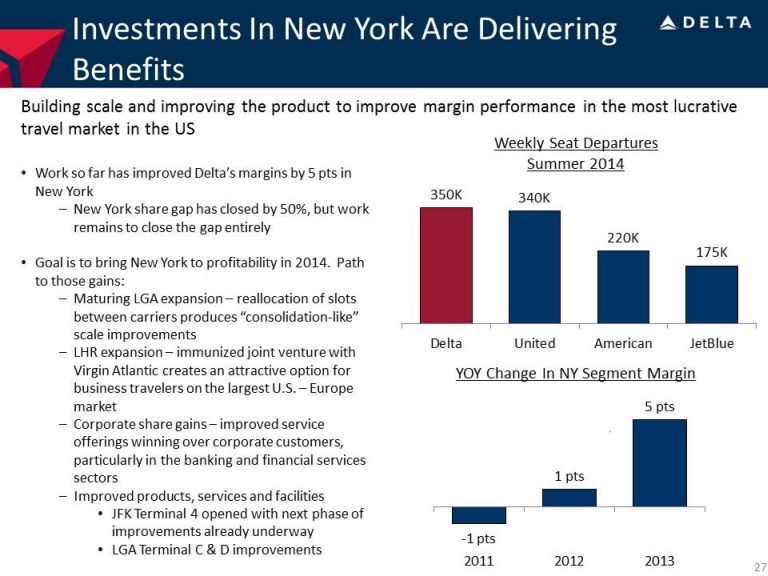
Investments In New York Are Delivering Benefits Building scale and improving the product to improve margin performance in the most lucrative travel market in the US 27 MD - 90 Virgin Atlantic • Work so far has improved Delta’s margins by 5 pts in New York – New York share gap has closed by 50%, but work remains to close the gap entirely • Goal is to bring New York to profitability in 2014. Path to those gains: – Maturing LGA expansion – reallocation of slots between carriers produces “consolidation - like” scale improvements – LHR expansion – immunized joint venture with Virgin Atlantic creates an attractive option for business travelers on the largest U.S. – Europe market – Corporate share gains – improved service offerings winning over corporate customers, particularly in the banking and financial services sectors – Improved products, services and facilities • JFK Terminal 4 opened with next phase of improvements already underway • LGA Terminal C & D improvements - 1 pts 1 pts 5 pts 2011 2012 2013 YOY Change In NY Segment Margin Weekly Seat Departures Summer 2014 350K 340K 220K 175K Delta United American JetBlue
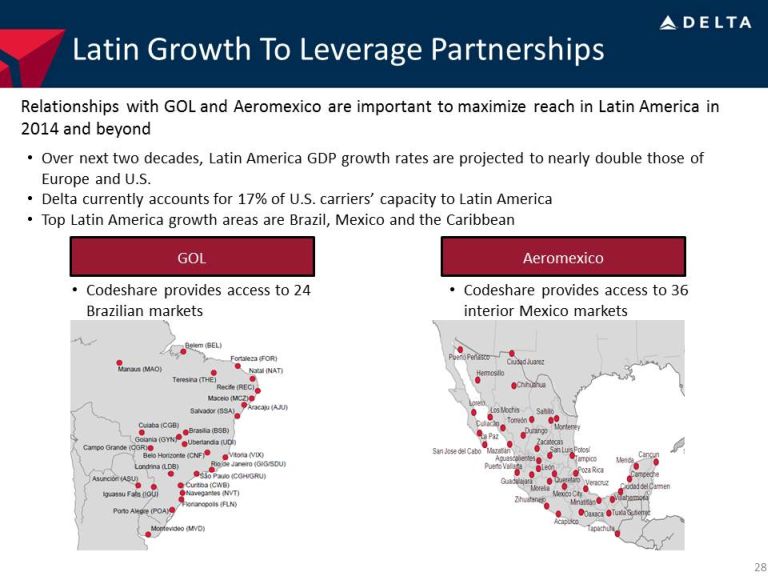
Latin Growth To Leverage Partnerships Relationships with GOL and Aeromexico are important to maximize reach in Latin America in 2014 and beyond 28 • Over next two decades, Latin America GDP growth rates are projected to nearly double those of Europe and U.S. • Delta currently accounts for 17% of U.S. carriers’ capacity to Latin America • Top Latin America growth areas are Brazil, Mexico and the Caribbean GOL Aeromexico • Codeshare provides access to 24 Brazilian markets • Codeshare provides access to 36 interior Mexico markets

Improving Asia Positioning And Profitability Rethinking our approach to Pacific flying in light of yen economics, liberalization of Haneda , and market demand for non - stop service to Asia 29 2013 Accomplishments Optimization of the Tokyo - Narita Hub Continued Development of Our Gateways Strong Partners in the Region • Customer demand for non - stop service to Asia has increased significantly in recent years • Non - Japan Asia now comprises 51% of Pacific long - haul flying up from 28% in 2009 • Developing our West Coast and Mid - Continent gateways to improve network offerings and optimize use of our international fleet • Building valuable partnerships with leading carriers in the region – China Eastern, China Southern, Korean Airlines, and Virgin Australia

Selling Passengers An Experience, Not Just A Ticket The customer experience has a different value for each customer and by tailoring our approach for different customers, we can improve overall satisfaction and increase our revenues 30 Targeting $500 - $600 million in new product sales over the next three years • Passenger ticket included all services for all customers • Price differentiation mainly by cabin and time of purchase • Incremental revenues from onboard sales of alcohol and headsets Historical Approach • Passenger ticket included similar services for all customers • Price differentiation mainly by cabin and time of purchase • Bag fees implemented and become primary driver of ancillary revenue Initial Approach To Ancillaries • All customers receive our core product – a safe, clean, reliable flight with top - notch customer service • Offerings allow customers to improve the aspects of the experience that they most value: flexibility, comfort, time, entertainment, productivity and luxury The Future of Ancillaries

Giving Customers What They Value Drives Revenue Growth 31 Investments in network, product, and operations have already produced solid, sustainable revenue gains with more room for growth Network Product Service • Reallocating capacity to leverage hub strength and serve in - demand destinations • Refleeting and product investments increase the range and quality of products for domestic and international customers • Operational reliability shows customers that we value their time

Building A Solid Financial Foundation Paul Jacobson Chief Financial Officer

Building A Solid Financial Foundation Building a durable franchise with consistent cost performance, a strong balance sheet and balanced capital allocation Sustainable momentum lowered our unit cost trajectory, with 2013 costs 2.5 points better than original expectations. Good line of sight on the work required to keep unit cost growth below 2% annually. 33 Sustaining Cost Performance Strengthening the Balance Sheet Balanced Capital Deployment Achieved our $10 billion adjusted net debt target and have begun progress on the next target of reducing debt to $7 billion while proactively addressing our pension obligation In first year since capital return announcement, expect to reduce debt by more than $1.5 billion, make $500 million incremental pension contributions and return $700 million to shareholders

3% 5% 4% 1.5% 2011 2012 1H13 2H13E 2014 + beyond Delta’s Cost Performance Is Sustainable 34 Valuation Allowance $1 billion structural cost program stemmed rate of growth in costs; next phase leverages strengths across the business to keep annual cost growth below inflation Non - Fuel Unit Cost Growth Sustaining Our Cost Performance • A solid base of supply chain, productivity, and maintenance initiatives in 2013 established momentum for 2014 and beyond • Leveraging the strengths across the business to sustain this cost performance going forward – Domestic refleeting: upgauged fleet produces more efficient capacity – Maintenance: savings from fleet changes and innovation in maintenance practices – Headcount: disciplined approach to headcount allows capacity growth with limited additions – Supply chain: continuing to extract value from regaining balance in the supply chain – Productivity: constant drive for efficiency across the organization < 2% Growth Exclude special items
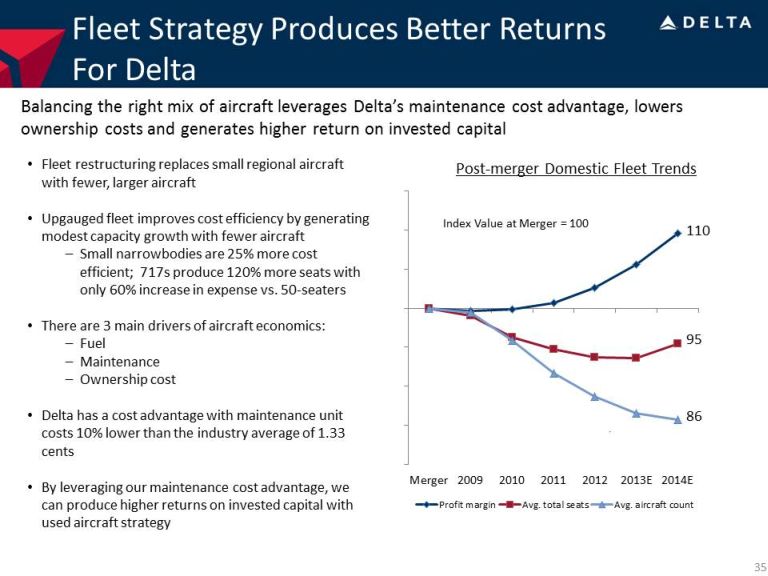
Merger 2009 2010 2011 2012 2013E 2014E Profit margin Avg. total seats Avg. aircraft count Fleet Strategy Produces Better Returns For Delta Balancing the right mix of aircraft leverages Delta’s maintenance cost advantage, lowers ownership costs and generates higher return on invested capital 35 • Fleet restructuring replaces small regional aircraft with fewer, larger aircraft • Upgauged fleet improves cost efficiency by generating modest capacity growth with fewer aircraft – Small narrowbodies are 25% more cost efficient; 717s produce 120% more seats with only 60% increase in expense vs. 50 - seaters • There are 3 main drivers of aircraft economics: – Fuel – Maintenance – Ownership cost • Delta has a cost advantage with maintenance unit costs 10% lower than the industry average of 1.33 cents • By leveraging our maintenance cost advantage, we can produce higher returns on invested capital with used aircraft strategy Post - merger Domestic Fleet Trends Index Value at Merger = 100 110 95 86

Driving Non - Ticket Revenue From Ancillary Businesses Ancillary businesses leverage our core strengths and generate solid profitability and cash flow 36 2013 Accomplishments Capital efficiency – little to no incremental capital required Profitability – solid incremental margins Cash flow – businesses produce zero cost working capital for Delta Ancillary businesses, $800M Cargo, $1.0B SkyMiles, $1.3B Bag fees/Service charges, $2.1 B 2014 Non - Ticket Revenue (estimated)

Continuing To Strengthen The Balance Sheet Achieving $7 billion adjusted net debt by 2015 will further the drive toward investment grade balance sheet metrics 37 11.6% 22.7% 2012 2013 2015E S&P Industrial Average Median BBB 34% BB 25% B 12% S&P Industrial Average Median BBB 8.2x BB 4.8x B 2.3x S&P Industrial Average Median BBB 2.3x BB 3.2x B 5.5x FFO / Debt EBITDA / Interest Debt / EBITDA 5.9x 4.4x 2012 2013 2015E 2.7x 3.3x 2012 2013 2015E FFO is cash flow from operations, before changes in working capital, plus adjustments for depreciation associated with operat ing lease conversion to debt and adjustments of cash flows associated with pension from operating to financing activities; Interest includes operating lease and pension interest costs; EBITDA is earnings before in ter est, taxes, depreciation and amortization; Benchmarks based on Three Year US Industrial Average Medians as of 12/6/13, sourced from S&P website. 23.5% - 25.5% 4.0x – 4.5x 3.7x – 4.2x

$0.0 $2.0 $4.0 $6.0 $8.0 $10.0 $12.0 $14.0 2012 2015 2018 2021 2024 At 2012's GAAP Interest Rate of 4% At current discount rate At historical 7% discount rate Addressing Our Pension Obligations • Balance sheet liability estimated to decrease by more than $3 billion to $10 billion by the end of 2013 – Discount rates have risen by nearly 100bps in the last year • Required funding remains stable and in line with 2013 funding levels – $700 million required funding in 2014 – Discount rates for funding purposes are fixed at 8.85% under Pension Protection Act relief • Incremental pension funding included in our balanced capital deployment will further reduce pension liability – Incremental $250 million pension funding in December for 2013 – Expect to make $250 million contribution in 2014 • 2013 asset returns combined with incremental funding reduce 2014 pension expense – 2014 pension expense estimated at $270 million – an $80 million decrease year over year 38 Rising discount rates, combined with incremental funding, results in significant decrease to the balance sheet liability Pension Unfunded Liability ($B) YE 2012: $13.3B YE 2013: $10.0B

YE 2012 YE 2013E Financial Strength Results In A Reversal Of Our Tax Valuation Allowance Reflects third - party confidence in our ability to realize the value of the $8.5 billion deferred tax asset 39 • Projection for sustainable future profitability combined with consistent and strong profitability over the past four years will result in the reversal of our tax valuation allowance • Reversal will add the value of the deferred tax asset to the balance sheet, resulting in an estimated net $8.5 billion one - time, non - cash gain in the December quarter • Net income going forward will be reduced to reflect 38% - 39% rate, but no cash taxes will be paid • Not expecting to be a cash taxpayer for many years, as net operating loss carryforwards to offset cash taxes on more than $14 billion in future taxable income – Long - term plan allows for full value capture from this asset Book Shareholders’ Equity 120% 49% YE 2012 YE 2013E Book Debt to Total Capital ($2 billion) $12 billion Reversal of valuation allowance, combined with adjustment to the pension liability, will result in a much stronger balance sheet
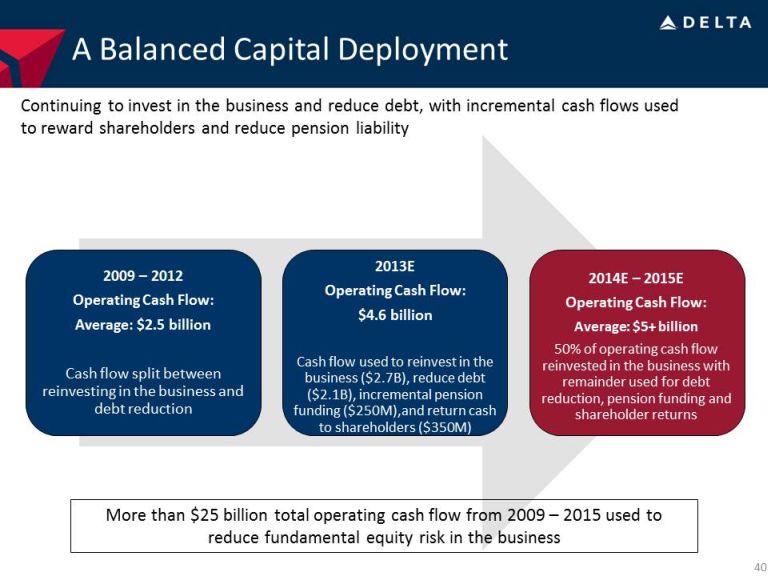
2009 – 2012 Operating Cash Flow: Average: $2.5 billion Cash flow split between reinvesting in the business and debt reduction 2013E Operating Cash Flow: $4.6 billion Cash flow used to reinvest in the business ($2.7B), reduce debt ($2.1B), incremental pension funding ($250M),and return cash to shareholders ($350M) 2014E – 2015E Operating Cash Flow: Average: $5+ billion 50% of operating cash flow reinvested in the business with remainder used for debt reduction, pension funding and shareholder returns A Balanced Capital Deployment 40 Continuing to invest in the business and reduce debt, with incremental cash flows used to reward shareholders and reduce pension liability More than $25 billion total operating cash flow from 2009 – 2015 used to reduce fundamental equity risk in the business
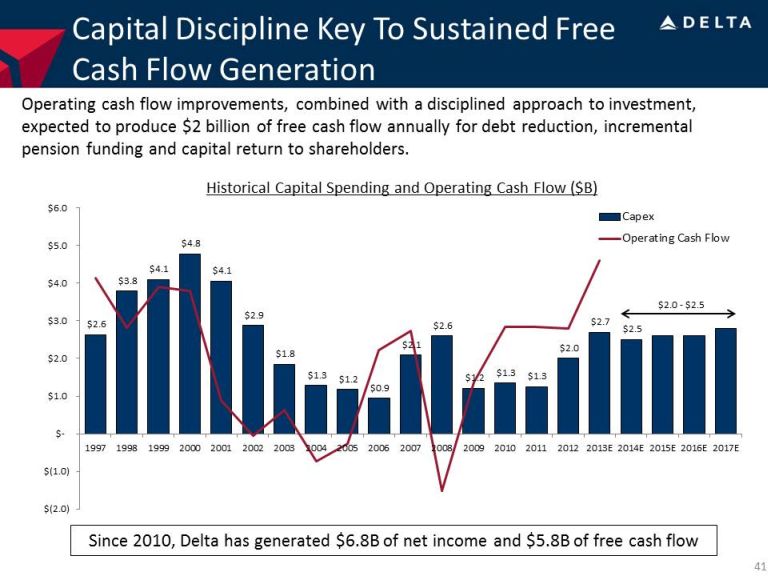
Capital Discipline Key To Sustained Free Cash Flow Generation Operating cash flow improvements, combined with a disciplined approach to investment, expected to produce $2 billion of free cash flow annually for debt reduction, incremental pension funding and capital return to shareholders. Historical Capital Spending and Operating Cash Flow ($B) 41 $2.6 $3.8 $4.1 $4.8 $4.1 $2.9 $1.8 $1.3 $1.2 $0.9 $2.1 $2.6 $1.2 $1.3 $1.3 $2.0 $2.7 $2.5 $(2.0) $(1.0) $ - $1.0 $2.0 $3.0 $4.0 $5.0 $6.0 1997 1998 1999 2000 2001 2002 2003 2004 2005 2006 2007 2008 2009 2010 2011 2012 2013E 2014E 2015E 2016E 2017E Capex Operating Cash Flow $2.0 - $2.5 Since 2010, Delta has generated $6.8B of net income and $5.8B of free cash flow

Maintaining Our Capital Investment Discipline Targeting capital expenditure at no more than 50% of operating cash flow • Rigorous decision process for capital projects – senior leadership involved in all decisions of $1 million or higher to ensure that projects meet minimum 15% return target with less than two year pay back • Over the last several years, capital expenditures were geared toward enhancing the customer onboard experience through flat beds, premium seating, and other cabin improvements • With those investments nearing completion, will utilize the same relative level of capital resources to purchase new aircraft • Strong operating cash flow allows us to make appropriate reinvestment in the business while still generating free cash flow for balance sheet improvement and shareholder returns – Targeting long - term capital investment at approximately 50% of operating cash flow 42 Capital Expenditures $0.2B $0.6B $700M $1,700M $900M $600M $800M $200M 2012 - 2013 2014E Aircraft Strategic & Other Aircraft Mods

Shareholder Returns To Grow Over Time 43 • Moving quickly with our balanced capital deployment plan, with an initial $350 million returned to shareholders in the first six months of our program – Capital returned to date through $100 million of dividends and $250 million of share repurchases • Plan to complete initial $500 million share repurchase authorization by June 2014; combined with dividends, this will return $700 million to shareholders in program’s first twelve months • Expect to announce next repurchase authorization and update to dividend policy by time of Delta’s annual meeting in June $ 100M $ 200M $ 250M $ 500M First 6 months First 12 months Dividends Share repurchases $350M $700M Total Capital Returns To Shareholders Returning cash to shareholders is a key attribute of high quality companies

Achieving Our Goals Is The Path To Value Creation Continued execution of our plan to produce earnings growth, solid returns on invested capital, and capital returns to shareholders should result in improved valuations 44 5.3 6.6 7.2 7.9 8.7 9.3 9.8 12.5 12.8 16.2 24.0 Note: Data source is Thomson One and Capital IQ 9.1 12.6 13.7 13.9 15.0 15.7 17.2 18.6 19.3 22.0 23.7 …Should Result In Improved Valuation Achievement of Our Long - Term Goals… • 10 - 12% annual operating margins Operating Margin • Annual EPS growth of 10 - 15% EPS Growth • 15% return on invested capital ROIC • $5+ billion annual operating cash flow with ~50% reinvested back into the business Cash Flow • Investment grade balance sheet metrics, including $7 billion of adjusted net debt by 2015 Balance Sheet Forward Price to Earnings EV to EBITDA

Non-GAAP Financial Measures
Delta sometimes uses information ("non-GAAP financial measures") that is derived from our Consolidated Financial Statements, but that is not presented in accordance with accounting principles generally accepted in the U.S. (“GAAP”). Under the U.S. Securities and Exchange Commission rules, non-GAAP financial measures may be considered in addition to results prepared in accordance with GAAP, but should not be considered a substitute for or superior to GAAP results. The tables below show reconciliations of non-GAAP financial measures used in this presentation to the most directly comparable GAAP financial measures.
Forward Looking Projections. Delta is unable to reconcile certain forward-looking projections to GAAP as the nature or amount of special items cannot be estimated at this time.
| 45 |
Pre-Tax Income & Margin
Delta excludes special items from pre-tax income (sometimes referred to as pre-tax profit) and other measures because management believes the exclusion of these items is helpful to investors to evaluate the company’s recurring core operational performance in the periods shown. Therefore, we adjust for these amounts to arrive at more meaningful financial measures. Special items excluded in the table below showing the reconciliation of pre-tax income and margin are:
Restructuring and other items. Because of the variability in restructuring and other items, the exclusion of this item from this measure is helpful to investors to analyze the company’s recurring core operational performance in the period shown.
Mark-to-market adjustments for fuel hedges recorded in periods other than the settlement period ("MTM adjustments"). MTM adjustments are based on market prices at the end of the reporting period for contracts settling in future periods. Such market prices are not necessarily indicative of the actual future value of the underlying hedge in the contract settlement period. Therefore, excluding these adjustments allows investors to better understand and analyze the company’s core operational performance in the periods shown.
Loss on extinguishment of debt and other. Because of the variability in loss on extinguishment of debt and other, the exclusion of this item from this measure is helpful to investors to analyze the company’s recurring core operational performance in the period shown.
| Last Twelve | ||||||||||||||||
| (Projected) | Months Ended | |||||||||||||||
| Full Year | Full Year | September 30, | ||||||||||||||
| 2013 | 2012 | Change | 2013 | |||||||||||||
| (in billions) | (in millions) | |||||||||||||||
| Pre-tax income | $ | 2.5 | $ | 1.0 | $ | 2,062 | ||||||||||
| Items excluded: | ||||||||||||||||
| Restructuring and other items | 0.4 | 0.5 | 364 | |||||||||||||
| MTM adjustments | (0.3 | ) | – | (181 | ) | |||||||||||
| Loss on extinguishment of debt and other | – | 0.1 | 128 | |||||||||||||
| Pre-tax income excluding special items | $ | 2.6 | $ | 1.6 | 70% | $ | 2,373 | |||||||||
| 46 |
Free Cash Flow
Delta presents free cash flow because management believes this metric is helpful to investors to evaluate the company's ability to generate cash that is available for use for debt service or general corporate initiatives.
(in billions) | (Projected) For the period January 1, 2010, - December 31, 2013 | (Projected) Full Year 2013 | ||||||||||||||
| Net cash provided by operating activities (GAAP) | $ | 12.3 | $ | 4.3 | ||||||||||||
| Net cash used in investing activities (GAAP) | $ | (8.2 | ) | $ | (2.7 | ) | ||||||||||
| Adjustments: | ||||||||||||||||
| Proceeds from sale of property and investments and other | (0.7 | ) | – | |||||||||||||
| Purchase of short-term investments | 1.8 | – | ||||||||||||||
| SkyMiles used pursuant to advance purchase under AMEX agreement | 0.6 | 0.3 | ||||||||||||||
| Cash used in investing | (6.5 | ) | (2.4 | ) | ||||||||||||
| Total free cash flow | $ | 5.8 | $ | 1.9 | ||||||||||||
Adjusted Net Debt
Delta uses adjusted total debt, including aircraft rent, in addition to long-term adjusted debt and capital leases, to present estimated financial obligations. Delta reduces adjusted total debt by cash, cash equivalents and short-term investments, resulting in adjusted net debt, to present the amount of assets needed to satisfy the debt. Management believes this metric is helpful to investors in assessing the company’s overall debt profile.
| (Projected) | ||||||||||||||||||||||||||||||||||||||||
| (in billions) | December 31, 2013 | December 31, 2012 | December 31, 2011 | December 31, 2010 | December 31, 2009 | |||||||||||||||||||||||||||||||||||
| Debt and capital lease obligations | $ | 11.5 | $ | 12.7 | $ | 13.8 | $ | 15.3 | $ | 17.2 | ||||||||||||||||||||||||||||||
| Plus: unamortized discount, net from purchase accounting and fresh start reporting | 0.4 | 0.5 | 0.6 | 0.6 | 1.1 | |||||||||||||||||||||||||||||||||||
| Adjusted debt and capital lease obligations | $ | 11.9 | $ | 13.2 | $ | 14.4 | $ | 15.9 | $ | 18.3 | ||||||||||||||||||||||||||||||
| Plus: 7x last twelve months' aircraft rent | 1.5 | 1.9 | 2.1 | 2.7 | 3.4 | |||||||||||||||||||||||||||||||||||
| Adjusted total debt | 13.4 | 15.1 | 16.5 | 18.6 | 21.7 | |||||||||||||||||||||||||||||||||||
| Less: cash, cash equivalents and short-term investments | (3.8 | ) | (3.4 | ) | (3.6 | ) | (3.6 | ) | (4.7 | ) | ||||||||||||||||||||||||||||||
| Adjusted net debt | $ | 9.6 | $ | 11.7 | $ | 12.9 | $ | 15.0 | $ | 17.0 | ||||||||||||||||||||||||||||||
| 47 |
Operating Margin
Delta excludes restructuring and other items and MTM adjustments from operating margin for the same reasons as described above under the heading Pre-Tax Income.
| (Projected) | ||
| December 2013 | ||
| Quarter | ||
| Operating margin | 6 - 8% | |
| Items excluded: | ||
| Restructuring and other items | 2% | |
| MTM adjustments | (1)% | |
| Operating margin, adjusted | 7 to 9% |
Average Fuel Price Per Gallon
Delta excludes MTM adjustments from average fuel price per gallon for the same reason described above under the heading Pre-Tax Income.
| (Projected) | ||
| December 2013 | ||
| Consolidated | Quarter | |
| Average fuel price per gallon | $2.92 to $2.97 | |
| MTM adjustments | 0.11 | |
| Average fuel price per gallon, adjusted | $3.03 to $3.08 |
| 48 |
CASM-Ex
Cost per Available Seat Mile or Non-Fuel Unit Cost ("CASM-Ex"): We exclude the following items from consolidated CASM to evaluate the company’s core cost performance:
Ancillary businesses. Our ancillary businesses include aircraft maintenance and staffing services we provide to third parties and our vacation wholesale operations. Because these businesses are not related to the generation of a seat mile, we exclude the costs related to these businesses from this measure to provide a more meaningful comparison of costs of our airline operations to the rest of the airline industry.
Profit sharing. We exclude profit sharing because this exclusion allows investors to better understand and analyze our recurring cost performance and provides a more meaningful comparison of our core operating costs to the airline industry.
Restructuring and other items and MTM adjustments. We exclude restructuring and other items and MTM adjustments from CASM for the same reasons described above under the heading Pre-Tax Income.
Aircraft fuel and related taxes. The volatility in fuel prices impacts the comparability of year-over-year non-fuel financial performance. The exclusion of aircraft fuel and related taxes from this measure (including our regional carriers under capacity purchase arrangements) allows investors to better understand and analyze our non-fuel costs and our year-over-year financial performance.
| (Projected) | |||||||||||||||||
| % Change | |||||||||||||||||
| Three Months Ended | Year Ended December 31, | ||||||||||||||||
| December 31, 2013 | 2012 | 2011 | 2010 | ||||||||||||||
| CASM | 1.0 | % | 14.97 | ¢ |
14.12 | ¢ | 12.69 | ¢ | |||||||||
| Items excluded: | |||||||||||||||||
| Ancillary businesses | – | (0.38 | ) | (0.37 | ) | (0.28 | ) | ||||||||||
| Profit sharing | (0.5 | ) | (0.16 | ) | (0.11 | ) | (0.13 | ) | |||||||||
| Restructuring and other items | (0.5 | ) | (0.20 | ) | (0.10 | ) | (0.19 | ) | |||||||||
| MTM adjustments | 1.0 | 0.01 | (0.01 | ) | – | ||||||||||||
| Aircraft fuel and related taxes | 1.0 | (5.32 | ) | (5.00 | ) | (3.82 | ) | ||||||||||
| CASM-Ex | 2.0 | % | 8.92 | ¢ | 8.53 | ¢ | 8.27 | ¢ | |||||||||
| Year-over-year change | 5 | % | 3 | % | |||||||||||||
| Six Months Ended | |||||||||||||
| (Projected) | |||||||||||||
| % Change | |||||||||||||
| December 31, | June 30, | June 30, | |||||||||||
| 2013 | 2013 | 2012 | |||||||||||
| CASM | 1.0 | % | 15.12 | ¢ | 15.49 | ¢ | |||||||
| Items excluded: | |||||||||||||
| Ancillary businesses | – | (0.31 | ) | (0.42 | ) | ||||||||
| Profit sharing | (0.5 | ) | (0.12 | ) | (0.12 | ) | |||||||
| Restructuring and other items | 0.5 | (0.12 | ) | (0.16 | ) | ||||||||
| MTM adjustments | – | (0.09 | ) | (0.36 | ) | ||||||||
| Aircraft fuel and related taxes | 0.5 | (5.14 | ) | (5.42 | ) | ||||||||
| CASM-Ex | 1.5 | % | 9.34 | ¢ | 9.01 | ¢ | |||||||
| Year-over-year change | 4% | ||||||||||||
| 49 |
Return on Invested Capital
Delta presents return on invested capital as management believes this metric is helpful to investors in assessing the company’s ability to generate returns using its invested capital and as a measure against the industry. Return on invested capital is adjusted total operating income divided by average invested capital.
| (Projected) | |||
| Full Year | |||
| (in billions, except % of return) | 2013 | ||
| Adjusted Book Value of Equity | $ | 15.4 | |
| Average Adjusted Net Debt | 10.5 | ||
| Average Invested Capital | $ | 25.9 | |
| Adjusted Total Operating Income | $ | 3.8 | |
| Return on Invested Capital | 15% | ||
| 50 |
Financial Metrics
| (Projected) | (Projected) | ||||||||||||
| Full Year | Full Year | Full Year | Full Year | ||||||||||
| (in billions) | 2013 | 2012 | (in billions) | 2013 | 2012 | ||||||||
| Net cash provided by operating activities (GAAP) | $ | 4.3 | $ | 2.5 | Interest expense, net | $ | 0.7 | $ | 0.8 | ||||
| Imputed operating lease depreciation and other | 1.5 | 0.9 | Amortization of debt discount, net | 0.2 | 0.2 | ||||||||
| Pension adjustment | 0.4 | 0.4 | Pension adjustment | 0.2 | 0.3 | ||||||||
| Adjusted funds from operations | $ | 6.2 | $ | 3.8 | Imputed operating lease interest | 0.7 | 0.8 | ||||||
| Adjusted interest expense | $ | 1.8 | $ | 2.1 | |||||||||
| (Projected) | (Projected) | ||||||||||||
| Full Year | Full Year | December 31, | December 31, | ||||||||||
| (in billions) | 2013 | 2012 | (in billions) | 2013 | 2012 | ||||||||
| Operating income | $ | 3.1 | $ | 2.2 | Total debt and capital lease obligations | $ | 11.5 | $ | 12.7 | ||||
| Depreciation and amortization | 1.6 | 1.6 | Imputed amortized operating leases | 9.6 | 9.9 | ||||||||
| Imputed operating lease interest | 0.7 | 0.7 | Pension adjustment | 6.3 | 10.0 | ||||||||
Restructuring and other items |
0.4 | 0.4 | Adjusted debt, including imputed amortized operating leases | $ | 27.4 | $ | 32.6 | ||||||
| Pension adjustment | 0.4 | 0.6 | |||||||||||
| EBITDA, adjusted | $ | 6.2 | $ | 5.5 | |||||||||
| (Projected) | |||||||
| Full Year | Full Year | ||||||
| 2013 | 2012 | ||||||
| FFO/Debt | 22.7% | 11.6% | |||||
| EBITDA/Interest | 3.3 | 2.7 | |||||
| Debt/EBITDA | 4.4 | 5.9 | |||||
FFO is cash flow from operations, before changes in working capital, plus adjustments for depreciation associated with operating lease conversion to debt and adjustments of cash flows associated with pension from operating to financing activities; Interest includes operating lease and pension interest costs; EBITDA is earnings before interest, taxes, depreciation and amortization.
| 51 |
Operating Cash Flow (net cash provided by operating activities, adjusted)
Delta presents net cash provided by operating activities because management believes this metric is helpful to investors to evaluate the company’s operating activities and cash flows.
| (Projected) | ||||||||||||||||
| Full Year | Average Annual | Full Year | Full Year | |||||||||||||
| (in billions) | 2013 | 2009 - 2012 | 2012 | 2008 | ||||||||||||
| Delta operating cash flow | $ | 4.3 | $ | 2.4 | $ | 2.5 | $ | (1.7 | ) | |||||||
| SkyMiles used pursuant to advance purchase under AMEX agreement | 0.3 | 0.1 | 0.3 | – | ||||||||||||
| Northwest operating cash flow | – | – | – | 0.2 | ||||||||||||
| Net cash provided by operating activities, adjusted | $ | 4.6 | $ | 2.5 | $ | 2.8 | $ | (1.5 | ) | |||||||
Capital Spending
Delta presents combined capital spending as if the company’s merger with Northwest Airlines had occurred at the beginning of the period presented because management believes this metric is helpful to investors to evaluate the company’s combined investing activities and provide a more meaningful comparison to our post-merger amounts.
| Full Year | ||||
| (in billions) | 2008 | |||
| Delta capital expenditures (GAAP) | $ | 1.5 | ||
| Northwest capital expenditures | 1.1 | |||
| Total combined capital spending | $ | 2.6 | ||
| 52 |
Net Income
Delta excludes special items from net income for the same reasons as described above under the heading Pre-Tax Income. In addition, Delta adjusted for the expected net gain related to reversal of tax valuation allowance to allow investors to better understand and analyze the company's core operational performance in the period shown.
| (Projected) | ||||
| (in billions) | January 1, 2010 - December 31, 2013 | |||
| Net income | $ | 13.4 | ||
| Items excluded: | ||||
| Restructuring and other items | 1.6 | |||
| MTM adjustments | (0.3 | ) | ||
| Loss on extinguishment of debt | 0.6 | |||
| Valuation allowance release | (8.5 | ) | ||
| Net income, adjusted | $ | 6.8 | ||
Enterprise Value to EBITDA
Delta presents enterprise value to EBITDA as management believes this metric is helpful to investors in assessing the company's value.
| (in billions) | Last Twelve Months Ended September 30, 2013 | |||
| Operating income | $ | 3.1 | ||
| Depreciation and amortization | 1.6 | |||
| Items excluded: | ||||
| Restructuring and other items | 0.4 | |||
| MTM adjustments | (0.2 | ) | ||
| EBITDA | $ | 4.9 | ||
| ($ in billions) | ||||
| Market capitalization | $ | 23.7 | ||
| Debt adjustment | 9.2 | |||
| Enterprise value | $ | 32.9 | ||
| EBITDA | $ | 4.9 | ||
| Enterprise value/EBITDA | 6.6 | |||
| 53 |