Attached files
| file | filename |
|---|---|
| 8-K - 8-K - Fairway Group Holdings Corp | a13-26029_18k.htm |
Exhibit 99.1
|
|
Fairway Market December 2013 |
|
|
Forward Looking Statements/ Safe Harbor Except for historical information contained herein, the statements in this release are forward-looking and made pursuant to the safe harbor provisions of the Private Securities Litigation Reform Act of 1995. Forward-looking statements involve known and unknown risks and uncertainties and other factors that may cause Fairway's actual results in current or future periods to differ materially from forecasted results. Food retail is a large and limited to: our ability to open new stores on a timely basis or at all; our ability to achieve sustained sales and profitable operating margins at new stores; the availability of financing to pursue our new store openings on satisfactory terms or at all; our ability to compete effectively with other retailers; our ability to maintain price competitiveness; the geographic concentration of our stores; our ability to maintain or improve our operating margins; our history of net losses; ordering errors or product supply disruptions in the delivery of perishable products; restrictions on our use of the Fairway name other than on the East Coast and in California and certain parts of Michigan and Ohio; our ability to retain and attract senior management, key employees and qualified store-level employees; rising costs of providing employee benefits, including increased healthcare costs and pension contributions due to unfunded pension liabilities; our ability to satisfy our ongoing capital needs and unanticipated cash requirements; and other risk factors detailed in our filings with the Securities and Exchange Commission www.sec.gov. You are urged to consider these factors carefully in evaluating the forward-looking statements herein and are cautioned not to place undue reliance on such forward-looking statements, which are qualified in their entirety by this cautionary statement. The forward-looking statements made herein speak only as of the date of this presentation and the company undertakes no obligation to publicly update such forward-looking statements to reflect subsequent events or circumstances. Actual results could differ materially from anticipated results. More detailed information about these and other factors is set forth in Report on Form 10-K for the fiscal year ended March 31, 2013 and in subsequent filings with the Securities and Exchange Commission. highly competitive industry, and Fairway’s business involves many risks and uncertainties, including, but not (the “SEC”), and available at the SEC's website at Fairway’s Annual 1 |
|
|
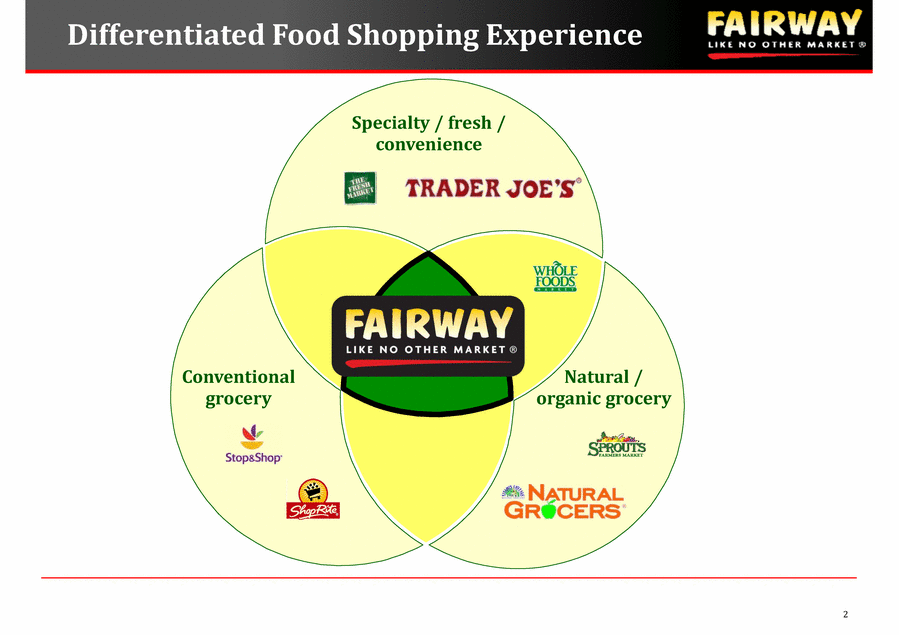
Differentiated Food Shopping Experience Specialty / fresh / convenience Conventional grocery Natural / organic grocery 2 |
|
|
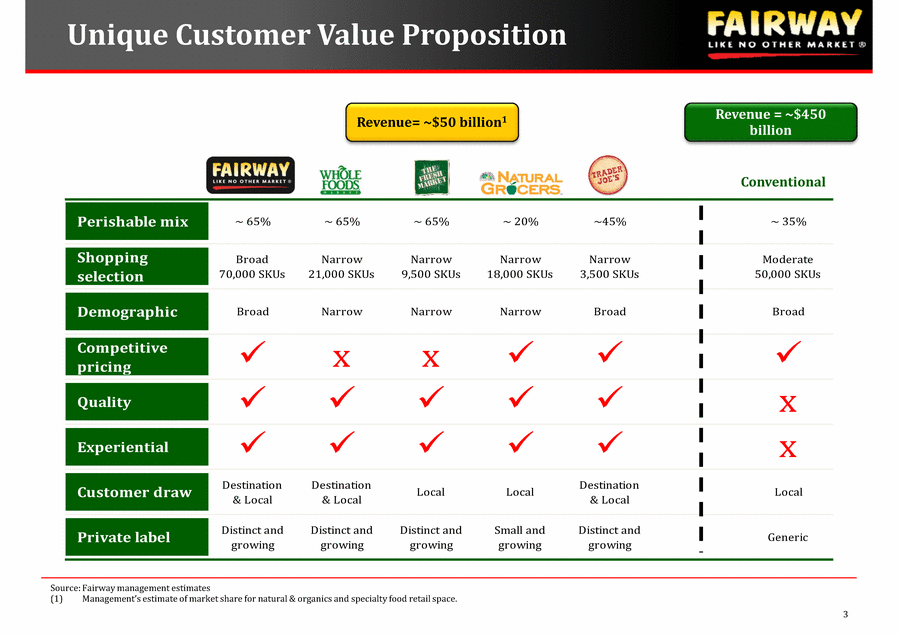
Perishable mix ~ 65% ~ 65% ~ 65% ~ 20% ~45% ~ 35% Shopping selection Broad 70,000 SKUs Narrow 21,000 SKUs Narrow 9,500 SKUs Narrow 18,000 SKUs Narrow 3,500 SKUs Moderate 50,000 SKUs Demographic Broad Narrow Narrow Narrow Broad Broad Competitive pricing x x Quality x Experiential x Customer draw Destination & Local Destination & Local Local Local Destination & Local Local Private label Distinct and growing Distinct and growing Distinct and growing Small and growing Distinct and growing Generic Conventional Source: Fairway management estimates (1) Unique Customer Value Proposition Revenue = ~$450 billion 3 Revenue= ~$50 billion1 Management’s estimate of market share for natural & organics and specialty food retail space. |
|
|
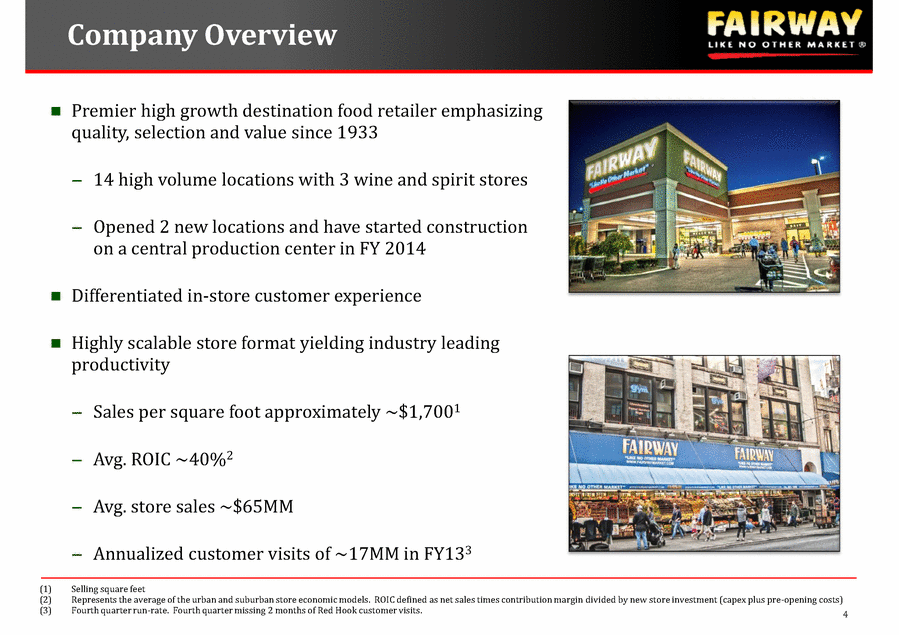
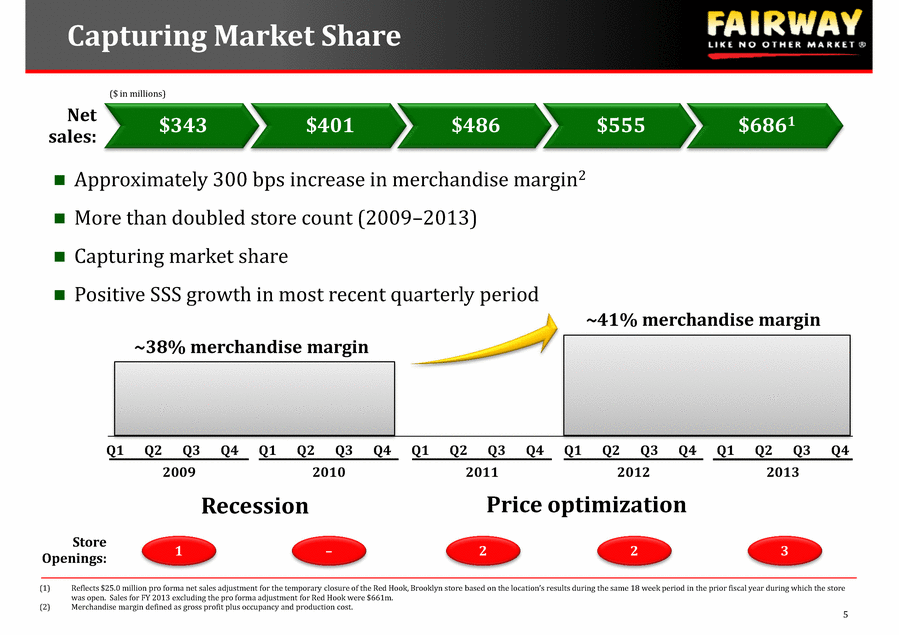
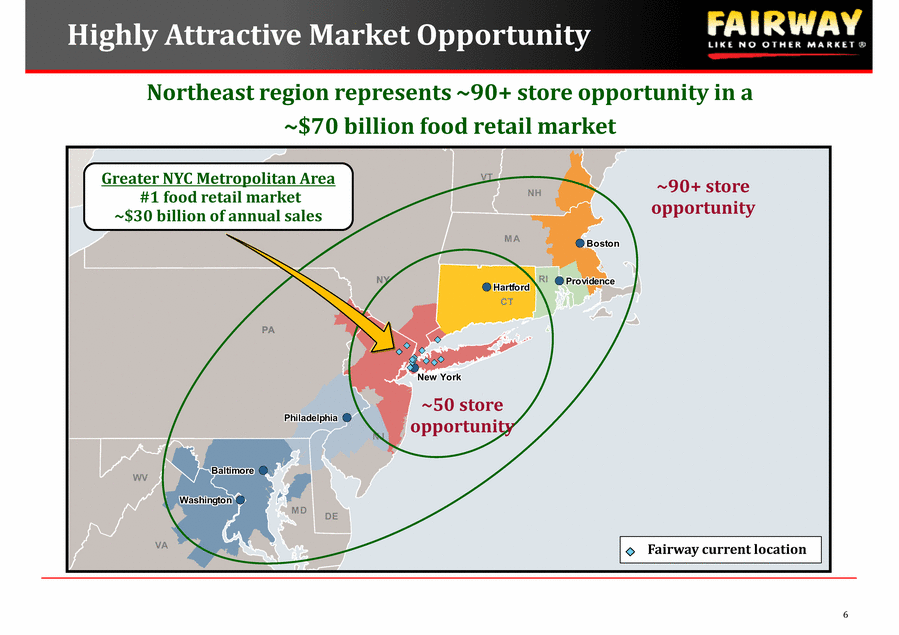
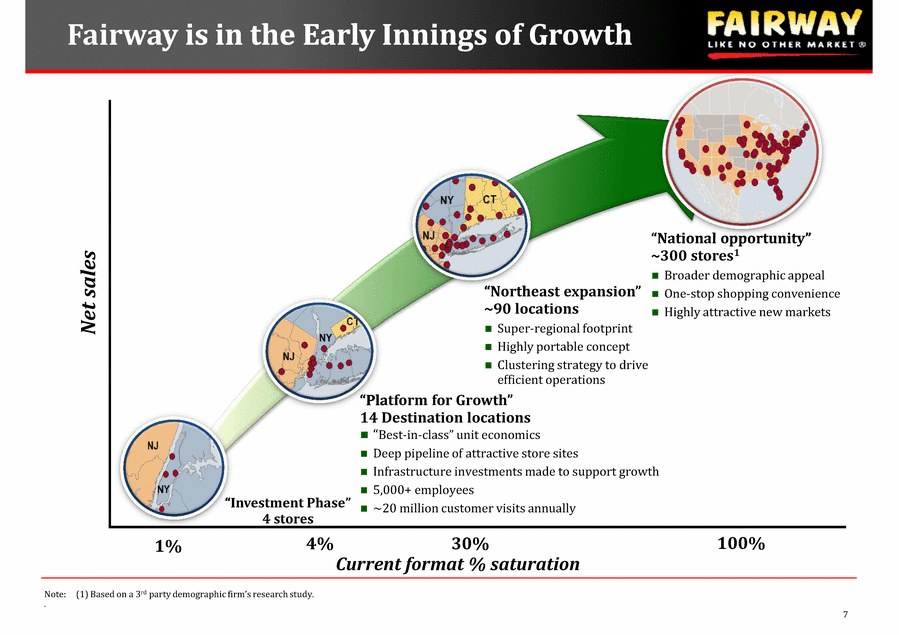
Company Overview Premier high growth destination food retailer emphasizing quality, selection and value since 1933 14 high volume locations with 3 wine and spirit stores Opened 2 new locations and have started construction on a central production center in FY 2014 Differentiated in-store customer experience Highly scalable store format yielding industry leading productivity Sales per square foot approximately ~$1,7001 Avg. ROIC ~40%2 Avg. store sales ~$65MM Annualized customer visits of ~17MM in FY133 (1) Selling square feet (2) Represents the average of the urban and suburban store economic models. ROIC defined as net sales times contribution margin divided by new store investment (capex plus pre-opening costs) (3) Fourth quarter run-rate. Fourth quarter missing 2 months of Red Hook customer visits. 4 |
|
|
-0.15 -0.05 0.05 0.15 0.25 0.35 Q1 Q2 Q3 Q4 Q1 Q2 Q3 Q4 Q1 Q2 Q3 Q4 Q1 Q2 Q3 Q4 Q1 Q2 Q3 Q4 Capturing Market Share (1) Reflects $25.0 million pro forma net sales adjustment for the temporary closure of the Red Hook, Brooklyn store 18 week period in the prior fiscal year during which the store was open. Sales for FY 2013 excluding the pro forma adjustment for Red Hook were $661m. (2) Merchandise margin defined as gross profit plus occupancy and production cost. 2009 2010 2011 2012 2013 Price optimization Recession 1 2 2 3 Store Openings: ($ in millions) $343 $401 $486 $555 $6861 Net sales: ~38% merchandise margin Approximately 300 bps increase in merchandise margin2 More than doubled store count (2009-2013) Capturing market share Positive SSS growth in most recent quarterly period ~41% merchandise margin 5 - |
|
|
RI VA MD DE ON VT NH CT NY PA WV NJ MA Baltimore Washington Philadelphia New York Boston Hartford Providence ~90+ store opportunity Fairway current location Greater NYC Metropolitan Area #1 food retail market ~$30 billion of annual sales Northeast region represents ~90+ store opportunity in a ~$70 billion food retail market ~50 store opportunity Highly Attractive Market Opportunity 6 |
|
|
Fairway is in the Early Innings of Growth 4% 30% 100% 4 stores ~90 locations Super-regional footprint Highly portable concept Clustering strategy to drive efficient operations 14 Destination locations Best-in- Deep pipeline of attractive store sites Infrastructure investments made to support growth 5,000+ employees ~20 million customer visits annually ~300 stores1 Broader demographic appeal One-stop shopping convenience Highly attractive new markets Net sales Current format % saturation 1% Note: (1) Based on a 3rd . 7 “National opportunity” “Northeast expansion” “Platform for Growth” -class” unit economics party demographic firm’s research study. |
|
|
Competitive Strengths |
|
|
Market style with strong “specialty shop” orientationEasy to Shop Store Layout 9 |
|
|
Highly Engaging Customer Experience 10 |
|
|
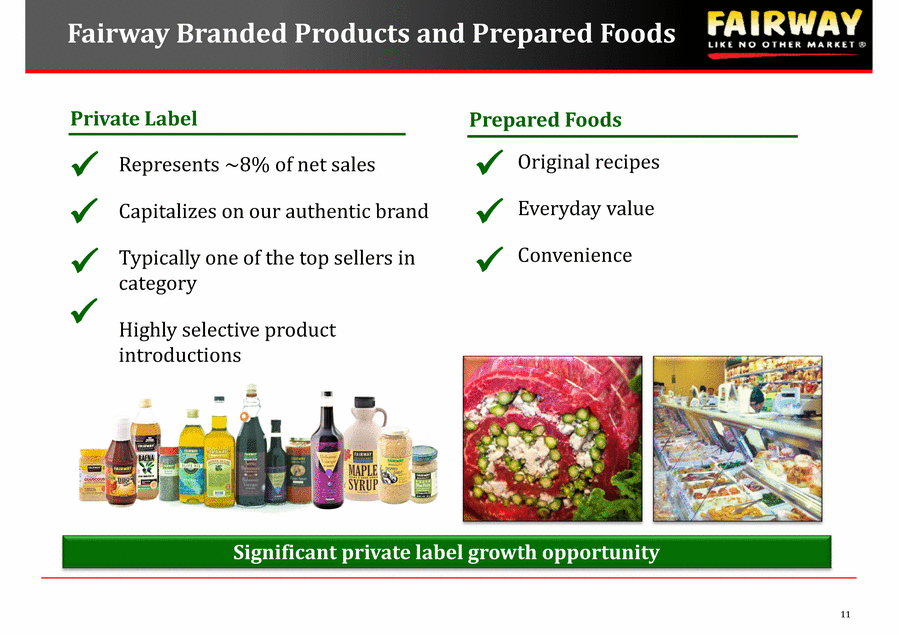
11 Represents ~8% of net sales Capitalizes on our authentic brand Typically one of the top sellers in category Highly selective product introductions Significant private label growth opportunity Original recipes Everyday value Convenience Fairway Branded Products and Prepared Foods Prepared Foods Private Label |
|
|
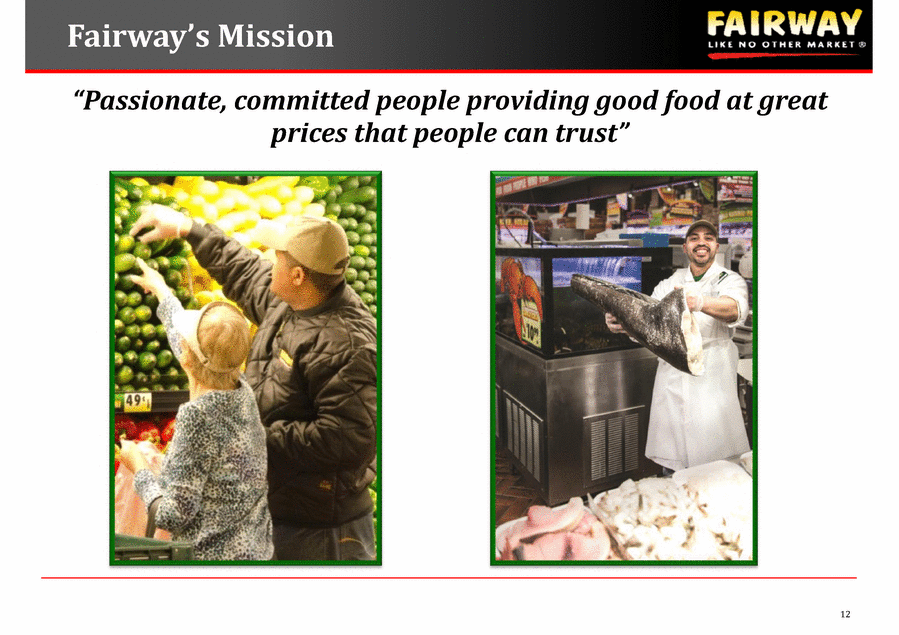
12 Fairway’s Mission “Passionate, committed people providing good food at great prices that people can trust” |
|
|
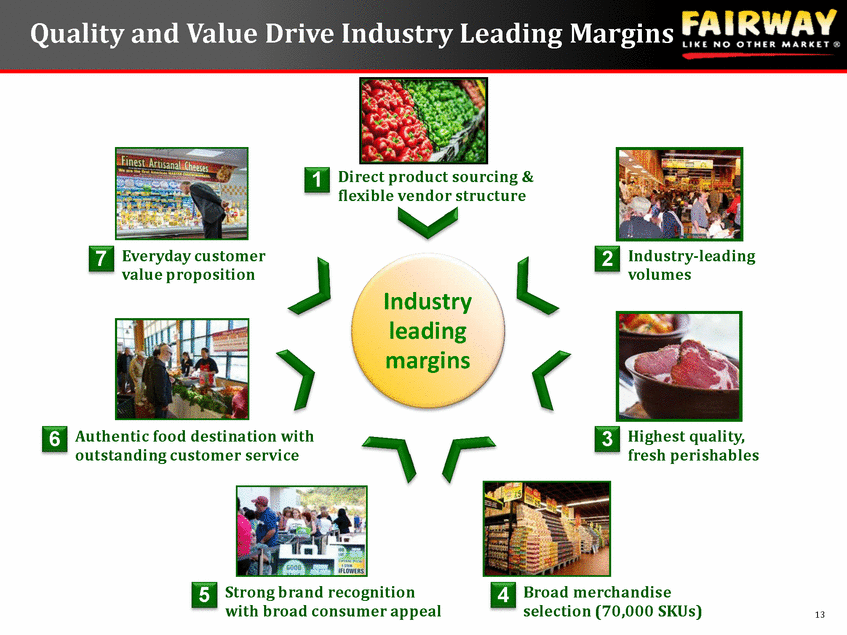
Authentic food destination with outstanding customer service 13 Highest quality, fresh perishables 3 Everyday customer value proposition 7 6 Industry-leading volumes 2 Strong brand recognition with broad consumer appeal 5 Broad merchandise selection (70,000 SKUs) 4 Direct product sourcing & flexible vendor structure 1 Industry leading margins Quality and Value Drive Industry Leading Margins |
|
|
Financial Review 14 |
|
|
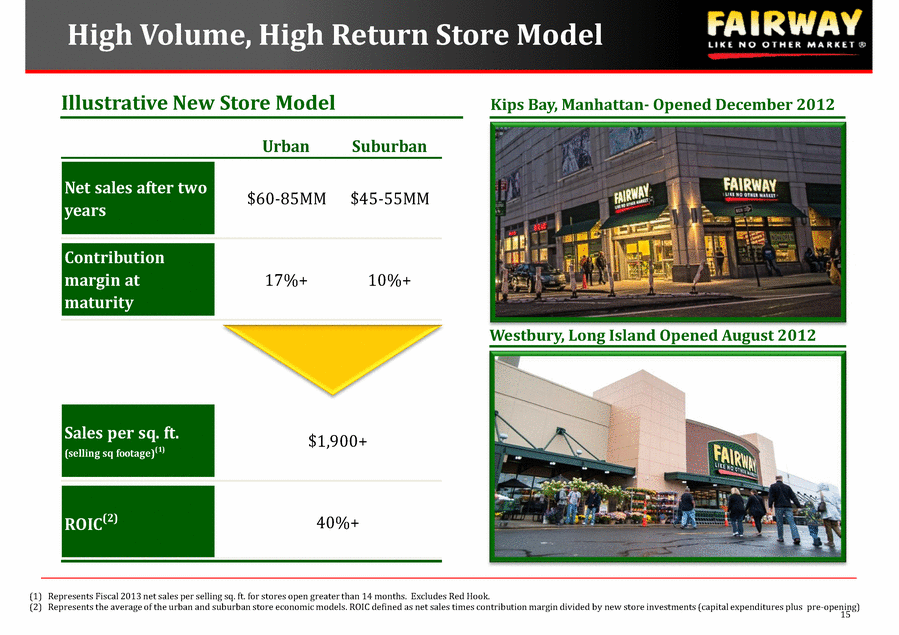
Urban Suburban Net sales after two years $60-85MM $45-55MM Contribution margin at maturity 17%+ 10%+ Sales per sq. ft. (selling sq footage)(1) ROIC(2) $1,900+ 40%+ (1) Represents Fiscal 2013 net sales per selling sq. ft. for stores open greater than 14 months. Excludes Red Hook. (2) Represents the average of the urban and suburban store economic models. ROIC defined as net sales times contribution margin divided by new store investments (capital expenditures plus pre-opening) High Volume, High Return Store Model Illustrative New Store Model Kips Bay, Manhattan- Opened December 2012 Westbury, Long Island Opened August 2012 15 |
|
|
$23.9 $29.3 $35.8 $47.3 6.0% 6.0% 6.4% 6.9% FY 2010 FY 2011 FY 2012 FY 2013 Adjusted EBITDA Adjusted EBITDA margin Outstanding Track Record of Growth $401.0 $486.0 $555.0 $686.0 FY 2010 FY 2011 FY 2012 FY 2013 Notes: Our Red Hook, Brooklyn location was temporarily closed beginning October 29, 2012 due to damage sustained in Hurricane Sandy and re-opened March 1, 2013. As a result, net sales for fiscal year ended March 31, 2013 reflect pro forma adjustments of $25.0 million 18 week period in the prior fiscal year during which the store was open. Adjusted EBITDA for the fiscal year ended March 31, 2013 includes $5.0 million of business interruption insurance recoveries received. Adjusted EBITDA has been adjusted for pre-opening expenses and one time non-recurring charges. FY 2011 includes 53rd week. ($ in millions) -- 2 2 3 New stores: Net sales Adjusted EBITDA 16 $315.2 $370.0 1H FY 2013 1H FY2014 $21.5 $23.3 1H FY2013 1H FY2014 ($ in millions) based on the Red Hook location’s results during the same |
|
|
Fairway branded products Vendor initiatives Increased buying power Greater scale increasing opportunities for key suppliers ~8% of net sales with the ability to double penetration Central production facility Significant upside as store count grows Labor Optimization Capital Efficiencies Scalability Consistency of product quality and taste Gross Margin Expansion Opportunities 17 |
|
|
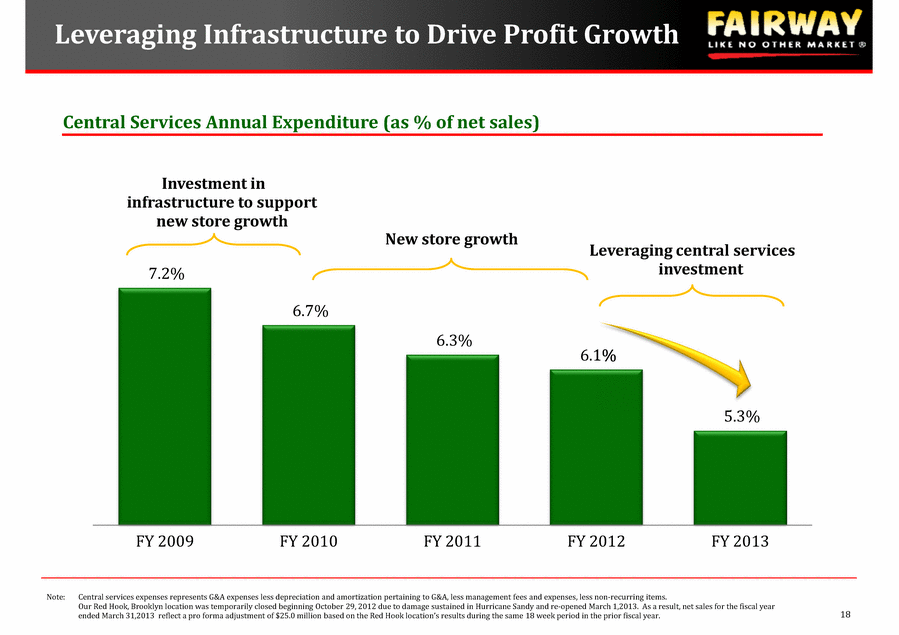
Leveraging Infrastructure to Drive Profit Growth 7.2% 6.7% 6.3% 6.1% 5.3% FY 2009 FY 2010 FY 2011 FY 2012 FY 2013 Investment in infrastructure to support new store growth New store growth Leveraging central services investment Note: Central services expenses represents G&A expenses less depreciation and amortization pertaining to G&A, less management fees and expenses, less non-recurring items. Our Red Hook, Brooklyn location was temporarily closed beginning October 29, 2012 due to damage sustained in Hurricane Sandy and re-opened March 1,2013. As a result, net sales for the fiscal year ended March 31,2013 reflect a pro forma adjustment of $25.0 million based on the Red Hook location’s results during the same 18 week period in the prior fiscal year. Central Services Annual Expenditure (as % of net sales) 18 |
|
|
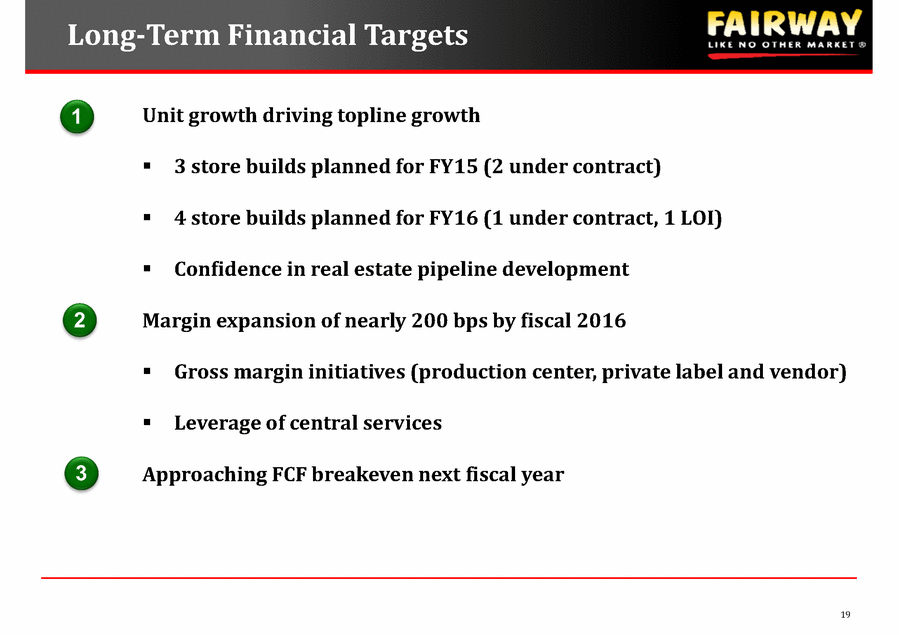
19 Unit growth driving topline growth 3 store builds planned for FY15 (2 under contract) 4 store builds planned for FY16 (1 under contract, 1 LOI) Confidence in real estate pipeline development Margin expansion of nearly 200 bps by fiscal 2016 Gross margin initiatives (production center, private label and vendor) Leverage of central services Approaching FCF breakeven next fiscal year 1 3 2 Long-Term Financial Targets |
|
|
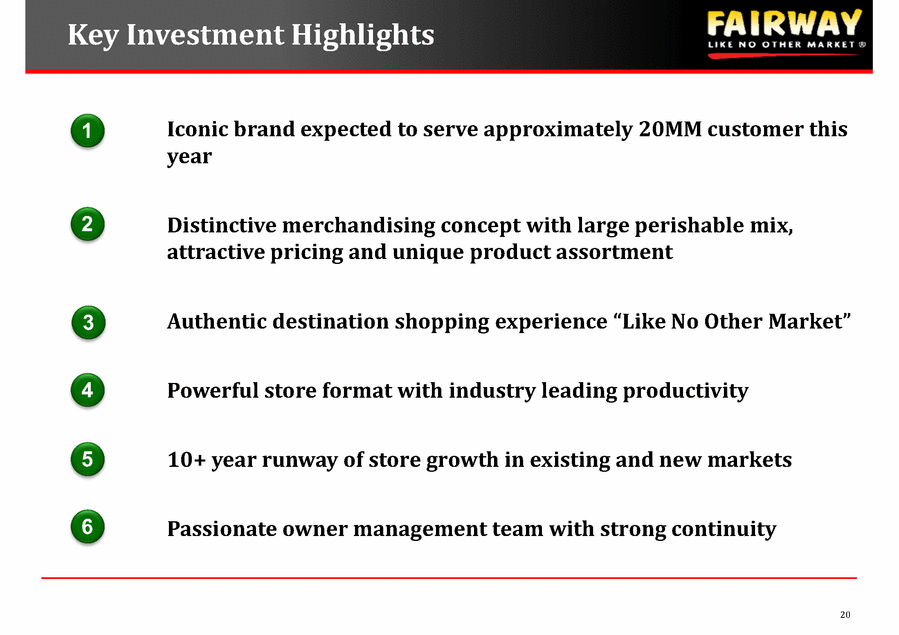
20 Iconic brand expected to serve approximately 20MM customer this year Distinctive merchandising concept with large perishable mix, attractive pricing and unique product assortment Authentic destination shopping experience “Like No Other Market” Powerful store format with industry leading productivity 10+ year runway of store growth in existing and new markets Passionate owner management team with strong continuity 1 3 4 5 2 6 Key Investment Highlights |
|
|
Appendix 21 |
|
|
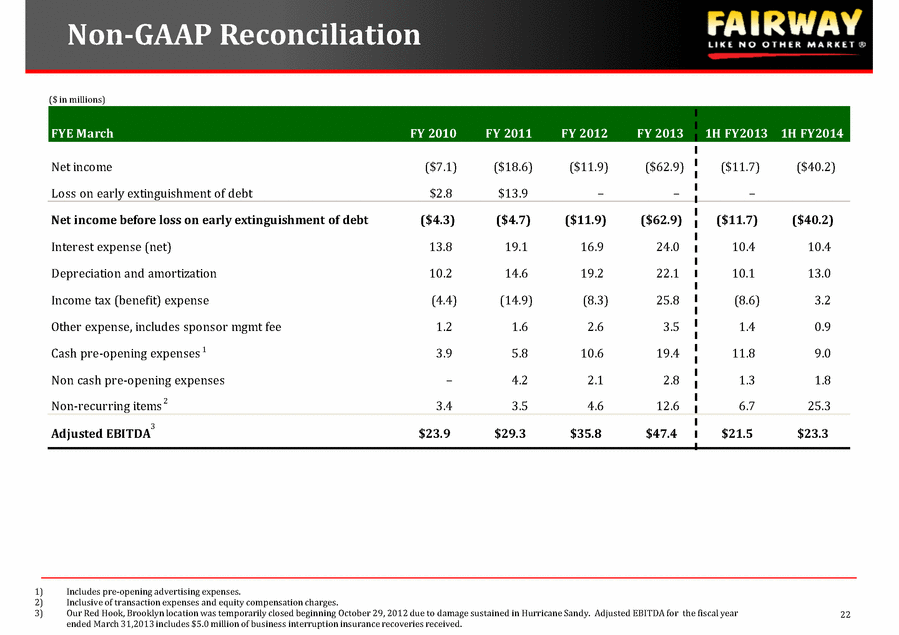
FYE March FY 2010 FY 2011 FY 2012 FY 2013 1H FY2013 1H FY2014 Net income ($7.1) ($18.6) ($11.9) ($62.9) ($11.7) ($40.2) Loss on early extinguishment of debt $2.8 $13.9 - - - - Net income before loss on early extinguishment of debt ($4.3) ($4.7) ($11.9) ($62.9) ($11.7) ($40.2) Interest expense (net) 13.8 19.1 16.9 24.0 10.4 10.4 Depreciation and amortization 10.2 14.6 19.2 22.1 10.1 13.0 Income tax (benefit) expense (4.4) (14.9) (8.3) 25.8 (8.6) 3.2 Other expense, includes sponsor mgmt fee 1.2 1.6 2.6 3.5 1.4 0.9 Cash pre-opening expenses 3.9 5.8 10.6 19.4 11.8 9.0 Non cash pre-opening expenses 4.2 2.1 2.8 1.3 1.8 Non-recurring items 3.4 3.5 4.6 12.6 6.7 25.3 Adjusted EBITDA $23.9 $29.3 $35.8 $47.4 $21.5 $23.3 ($ in millions) 1) Includes pre-opening advertising expenses. 2) Inclusive of transaction expenses and equity compensation charges. 3) Our Red Hook, Brooklyn location was temporarily closed beginning October 29, 2012 due to damage sustained in Hurricane Sandy. Adjusted EBITDA for the fiscal year ended March 31,2013 includes $5.0 million of business interruption insurance recoveries received. Non-GAAP Reconciliation 22 2 1 3 |
|
|
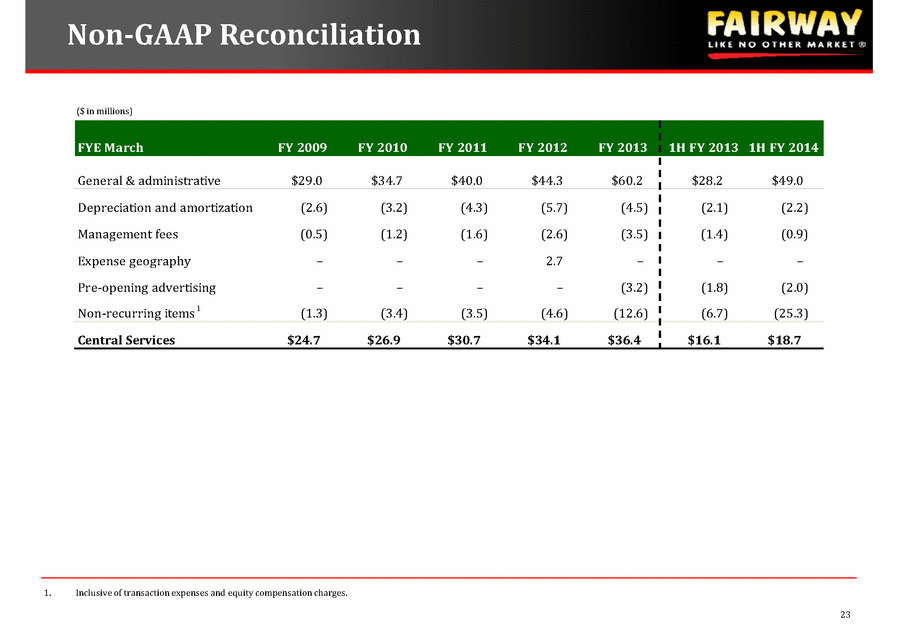
FYE March FY 2009 FY 2010 FY 2011 FY 2012 FY 2013 1H FY 2013 1H FY 2014 General & administrative $29.0 $34.7 $40.0 $44.3 $60.2 $28.2 $49.0 Depreciation and amortization (2.6) (3.2) (4.3) (5.7) (4.5) (2.1) (2.2) Management fees (0.5) (1.2) (1.6) (2.6) (3.5) (1.4) (0.9) Expense geography 2.7 Pre-opening advertising (3.2) (1.8) (2.0) Non-recurring items (1.3) (3.4) (3.5) (4.6) (12.6) (6.7) (25.3) Central Services $24.7 $26.9 $30.7 $34.1 $36.4 $16.1 $18.7 ($ in millions) Non-GAAP Reconciliation 23 1. Inclusive of transaction expenses and equity compensation charges. - - - - - - - - - - 1 |

