Attached files
| file | filename |
|---|---|
| 8-K - 8-K - ABM INDUSTRIES INC /DE/ | d639975d8k.htm |
| EX-99.1 - EX-99.1 - ABM INDUSTRIES INC /DE/ | d639975dex991.htm |
Exhibit 99.2
| ABM Fourth Quarter 2013 Teleconference |
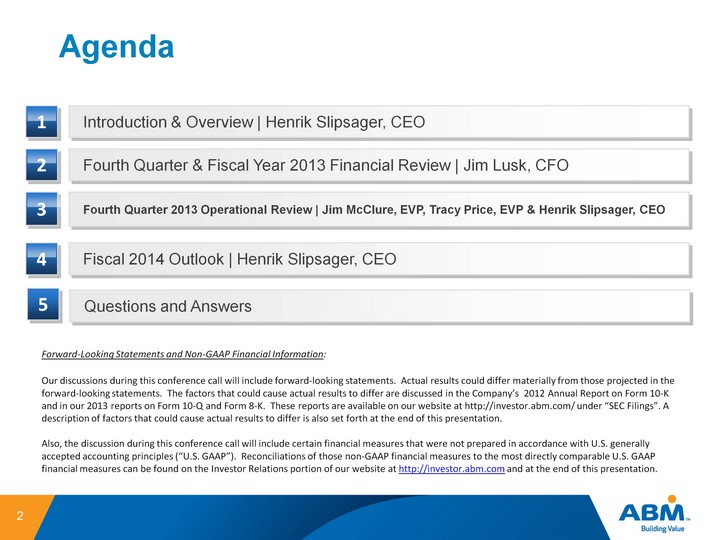
| Agenda 2 1 Introduction & Overview | Henrik Slipsager, CEO 2 Fourth Quarter & Fiscal Year 2013 Financial Review | Jim Lusk, CFO 3 Fourth Quarter 2013 Operational Review | Jim McClure, EVP, Tracy Price, EVP & Henrik Slipsager, CEO 4 Fiscal 2014 Outlook | Henrik Slipsager, CEO Forward-Looking Statements and Non-GAAP Financial Information: Our discussions during this conference call will include forward-looking statements. Actual results could differ materially from those projected in the forward-looking statements. The factors that could cause actual results to differ are discussed in the Company's 2012 Annual Report on Form 10-K and in our 2013 reports on Form 10-Q and Form 8-K. These reports are available on our website at http://investor.abm.com/ under "SEC Filings". A description of factors that could cause actual results to differ is also set forth at the end of this presentation. Also, the discussion during this conference call will include certain financial measures that were not prepared in accordance with U.S. generally accepted accounting principles ("U.S. GAAP"). Reconciliations of those non-GAAP financial measures to the most directly comparable U.S. GAAP financial measures can be found on the Investor Relations portion of our website at http://investor.abm.com and at the end of this presentation. 5 Questions and Answers |
| Fourth Quarter 2013 Review of Financial Results |
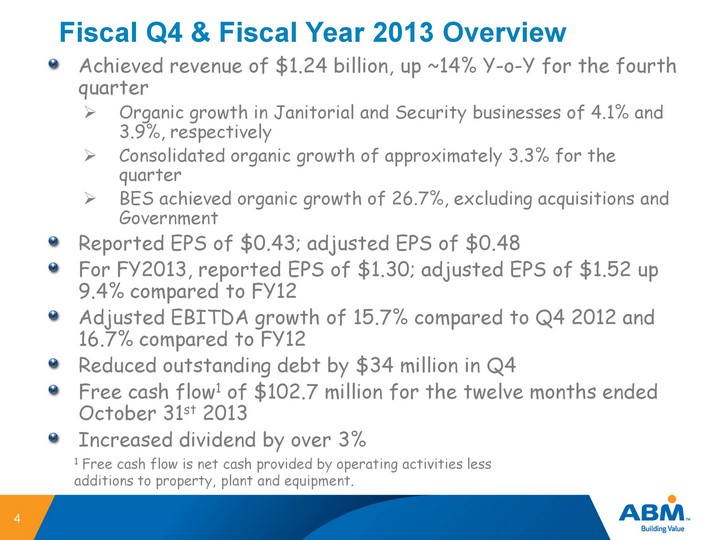
| Fiscal Q4 & Fiscal Year 2013 Overview 4 Achieved revenue of $1.24 billion, up ~14% Y-o-Y for the fourth quarter Organic growth in Janitorial and Security businesses of 4.1% and 3.9%, respectively Consolidated organic growth of approximately 3.3% for the quarter BES achieved organic growth of 26.7%, excluding acquisitions and Government Reported EPS of $0.43; adjusted EPS of $0.48 For FY2013, reported EPS of $1.30; adjusted EPS of $1.52 up 9.4% compared to FY12 Adjusted EBITDA growth of 15.7% compared to Q4 2012 and 16.7% compared to FY12 Reduced outstanding debt by $33 million in Q4 Free cash flow1 of $102.7 million for the twelve months ended October 31st 2013 Increased dividend by over 3% 1 Free cash flow is net cash provided by operating activities less additions to property, plant and equipment. |
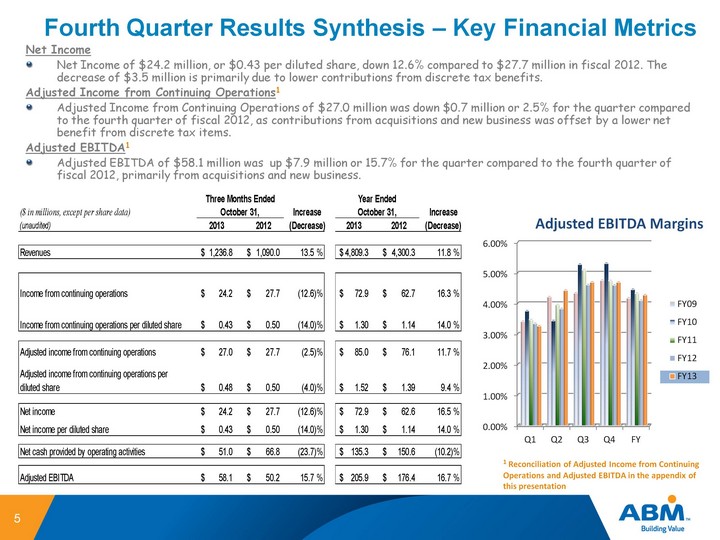
| Fourth Quarter Results Synthesis - Key Financial Metrics 5 Net Income Net Income of $24.2 million, or $0.43 per diluted share, down 12.6% compared to $27.7 million in fiscal 2012. The decrease of $3.5 million is primarily due to lower contributions from discrete tax benefits. Adjusted Income from Continuing Operations1 Adjusted Income from Continuing Operations of $27.0 million was down $0.7 million or 2.5% for the quarter compared to the fourth quarter of fiscal 2012, as contributions from acquisitions and new business was offset by a lower net benefit from discrete tax items. Adjusted EBITDA1 Adjusted EBITDA of $58.1 million was up $7.9 million or 15.7% for the quarter compared to the fourth quarter of fiscal 2012, primarily from acquisitions and new business. 1 Reconciliation of Adjusted Income from Continuing Operations and Adjusted EBITDA in the appendix of this presentation (CHART) |
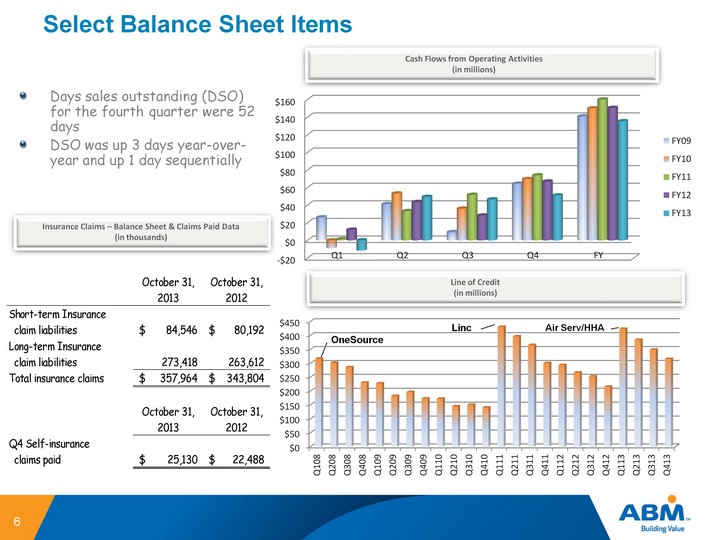
| Select Balance Sheet Items Cash Flows from Operating Activities (in millions) Days sales outstanding (DSO) for the fourth quarter were 52 days DSO was up 3 days year-over- year and up 1 day sequentially 6 Insurance Claims - Balance Sheet & Claims Paid Data (in thousands) Line of Credit (in millions) OneSource Linc Air Serv/HHA (CHART) (CHART) (CHART) |
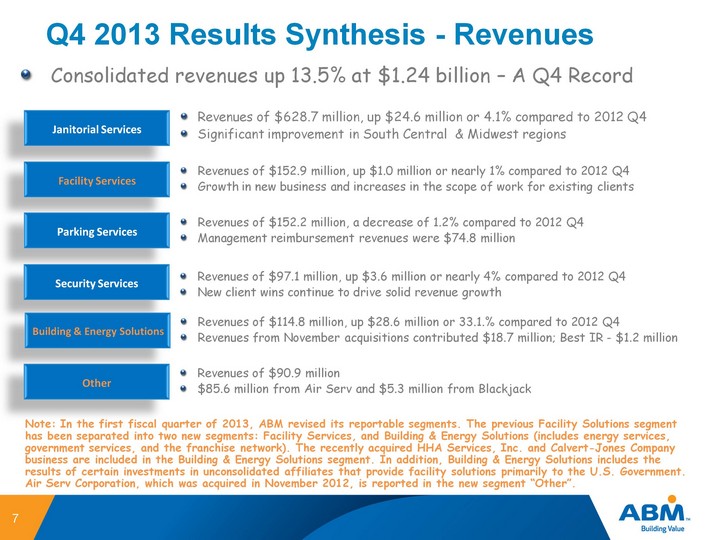
| Q4 2013 Results Synthesis - Revenues Revenues of $628.7 million, up $24.6 million or 4.1% compared to 2012 Q4 Significant improvement in South Central & Midwest regions Consolidated revenues up 13.5% at $1.24 billion - A Q4 Record Janitorial Services 7 Facility Services Parking Services Security Services Building & Energy Solutions Other Revenues of $152.9 million, up $1.0 million or nearly 1% compared to 2012 Q4 Growth in new business and increases in the scope of work for existing clients Revenues of $152.2 million, a decrease of 1.2% compared to 2012 Q4 Management reimbursement revenues were $74.8 million Revenues of $97.1 million, up $3.6 million or nearly 4% compared to 2012 Q4 New client wins continue to drive solid revenue growth Revenues of $114.8 million, up $28.6 million or 33.1.% compared to 2012 Q4 Revenues from November acquisitions contributed $18.7 million; Best IR - $1.2 million Revenues of $90.9 million $85.6 million from Air Serv and $5.3 million from Blackjack Note: In the first fiscal quarter of 2013, ABM revised its reportable segments. The previous Facility Solutions segment has been separated into two new segments: Facility Services, and Building & Energy Solutions (includes energy services, government services, and the franchise network). The recently acquired HHA Services, Inc. and Calvert-Jones Company business are included in the Building & Energy Solutions segment. In addition, Building & Energy Solutions includes the results of certain investments in unconsolidated affiliates that provide facility solutions primarily to the U.S. Government. Air Serv Corporation, which was acquired in November 2012, is reported in the new segment "Other". |
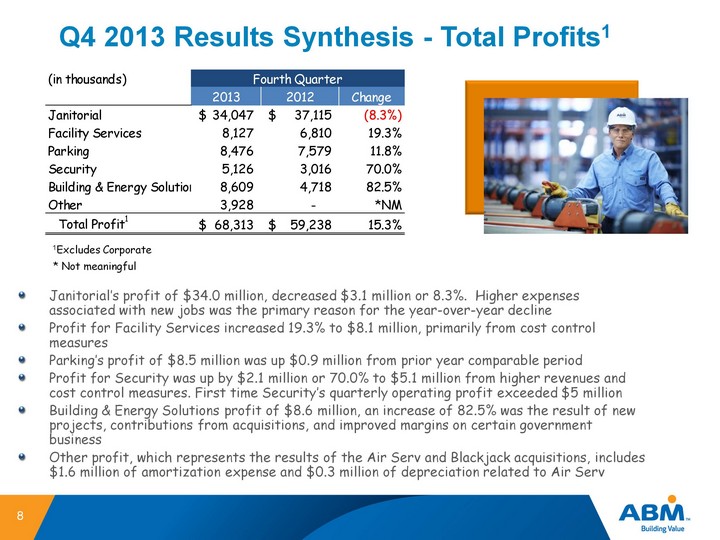
| Q4 2013 Results Synthesis - Total Profits1 Janitorial's profit of $34.0 million, decreased $3.1 million or 8.3%. Higher expenses associated with new jobs was the primary reason for the year-over-year decline Profit for Facility Services increased 19.3% to $8.1 million, primarily from cost control measures Parking's profit of $8.5 million was up $0.9 million from prior year comparable period Profit for Security was up by $2.1 million or 70.0% to $5.1 million from higher revenues and cost control measures. First time Security's quarterly operating profit exceeded $5 million Building & Energy Solutions profit of $8.6 million, an increase of 82.5% was the result of new projects, contributions from acquisitions, and improved margins on certain government business Other profit, which represents the results of the Air Serv and Blackjack acquisitions, includes $1.6 million of amortization expense and $0.3 million of depreciation related to Air Serv 1Excludes Corporate 8 * Not meaningful |
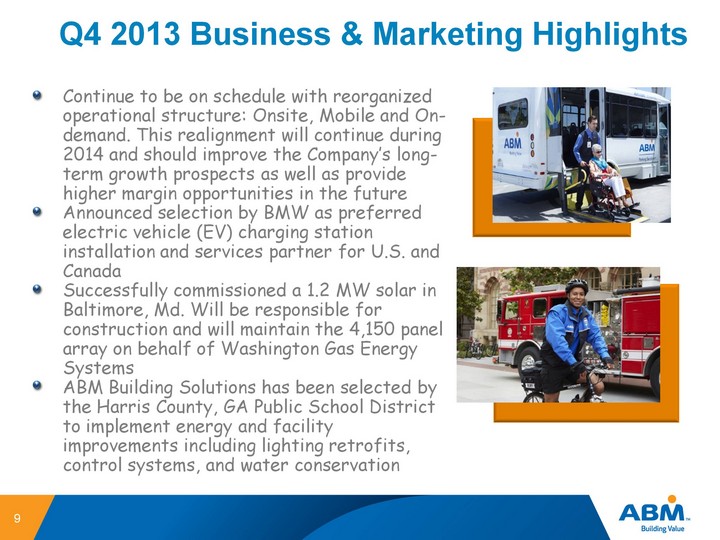
| Q4 2013 Business & Marketing Highlights Continue to be on schedule with reorganized operational structure: Onsite, Mobile and On- demand. This realignment will continue during 2014 and should improve the Company's long- term growth prospects as well as provide higher margin opportunities in the future Announced selection by BMW as preferred electric vehicle (EV) charging station installation and services partner for U.S. and Canada Successfully commissioned a 1.2 MW solar in Baltimore, Md. Will be responsible for construction and will maintain the 4,150 panel array on behalf of Washington Gas Energy Systems ABM Building Solutions has been selected by the Harris County, GA Public School District to implement energy and facility improvements including lighting retrofits, control systems, and water conservation 9 |

| Outlook |
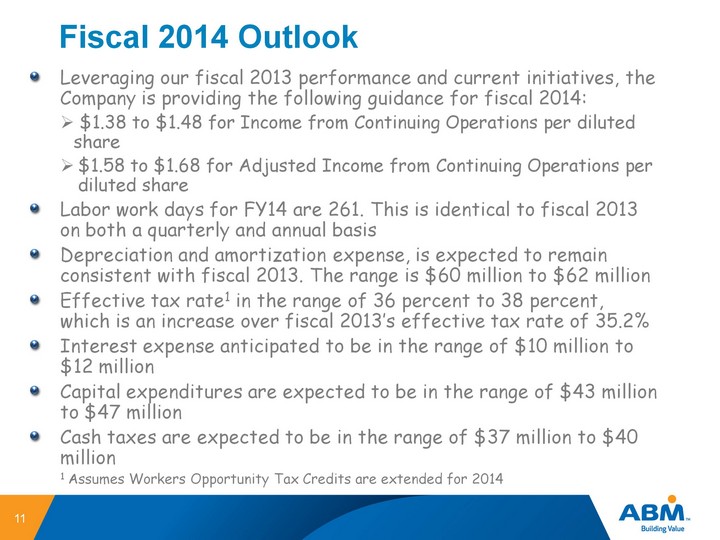
| Fiscal 2014 Outlook Leveraging our fiscal 2013 performance and current initiatives, the Company is providing the following guidance for fiscal 2014: $1.38 to $1.48 for Income from Continuing Operations per diluted share $1.58 to $1.68 for Adjusted Income from Continuing Operations per diluted share Labor work days for FY14 are 261. This is identical to fiscal 2013 on both a quarterly and annual basis Depreciation and amortization expense, is expected to remain consistent with fiscal 2013. The range is $60 million to $62 million Effective tax rate1 in the range of 36 percent to 38 percent, which is an increase over fiscal 2013's effective tax rate of 35.2% Interest expense anticipated to be in the range of $10 million to $12 million Capital expenditures are expected to be in the range of $43 million to $47 million Cash taxes are expected to be in the range of $37 million to $40 million 1 Assumes Workers Opportunity Tax Credits are extended for 2014 11 |
| Forward-Looking Statement 12 |
| Appendix - Unaudited Reconciliation of non-GAAP Financial Measures |
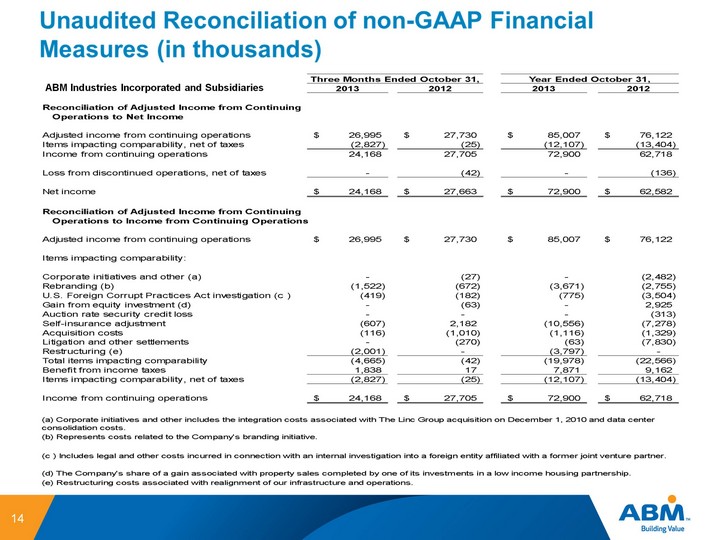
| 14 ABM Industries Incorporated and Subsidiaries |
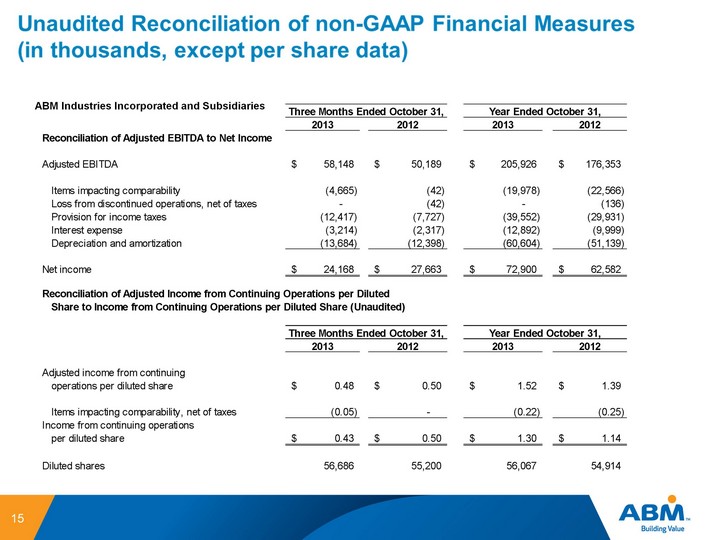
| 15 ABM Industries Incorporated and Subsidiaries |
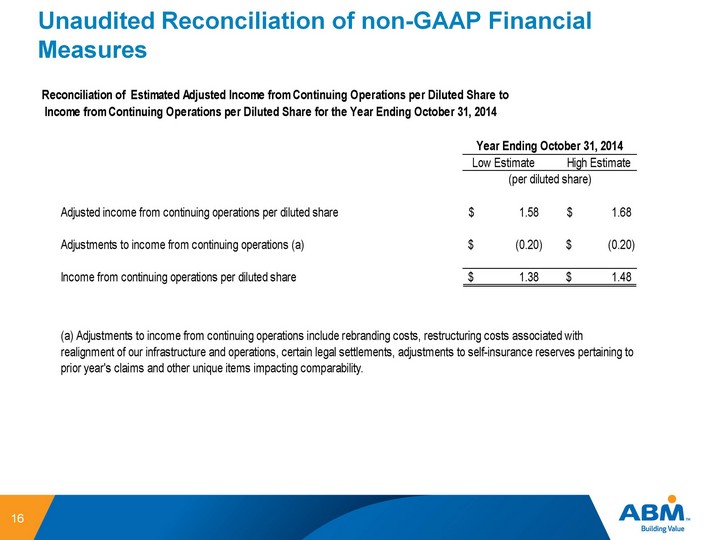
| Unaudited Reconciliation of non-GAAP Financial Measures 16 |