Attached files
| file | filename |
|---|---|
| 8-K - FORM 8-K - TIDEWATER INC | d640986d8k.htm |
| EX-99.2 - EX-99.2 - TIDEWATER INC | d640986dex992.htm |
 December 3, 2013
Cowen
and
Company
3
Annual
Ultimate
Energy
Conference
Joseph M. Bennett
EVP & Chief IRO
Jeffrey M. Platt
President and CEO
Exhibit 99.1
rd |
 FORWARD-LOOKING STATEMENTS
TIDEWATER
601 Poydras Street, Suite 1500
New Orleans, LA 70130
Phone:
504.568.1010 |
Fax: 504.566.4580
Web
site
address:
www.tdw.com
Email:
connect@tdw.com
2
In accordance with the safe harbor provisions of the Private Securities Litigation Reform Act
of 1995, the Company notes that certain statements set forth in this presentation provide
other than historical information and are forward looking. The actual achievement of any
forecasted results, or the unfolding of future economic or business developments in a way
anticipated or projected by the Company, involve numerous risks and uncertainties that
may cause the Company’s actual performance to be materially different from that
stated or implied in the forward-looking statement. Among those risks and
uncertainties, many of which are beyond the control of the Company, include, without
limitation, fluctuations in worldwide energy demand and oil and gas prices; fleet
additions by competitors and industry overcapacity; changes in capital spending by
customers in the energy industry for offshore exploration, development and production;
changing customer demands for different vessel specifications, which may make some of our
older vessels technologically obsolete for certain customer projects or in certain
markets; uncertainty of global financial market conditions and difficulty accessing
credit or capital; acts of terrorism and piracy; significant weather conditions;
unsettled political conditions, war, civil unrest and governmental actions, such as
expropriation or enforcement of customs or other laws that are not well-developed or
consistently enforced, especially in higher political risk countries where we operate; foreign
currency fluctuations; labor changes proposed by international conventions; increased
regulatory burdens and oversight; and enforcement of laws related to the environment,
labor and foreign corrupt practices. Readers should consider all of these risks factors,
as well as other information contained in the Company’s form 10-K’s and
10-Q’s. |
 Key
Tidewater Facts •
“Best in Class”
safety and compliance culture
•
First to expand extensively into int’l markets, evolving to our
•
History of earnings growth and solid returns
•
Largest “NEW”
OSV fleet in the industry
•
Solid balance sheet allows us to continue to act upon available
•
Pioneered the oil & gas service vessel industry 55+ years ago
•
Constructive fundamental backdrop for OSV industry
3
current global exposure–
presence in over 50 countries
with ~8,000 employees worldwide
opportunities, such as recent Troms acquisition and
new Subsea business |
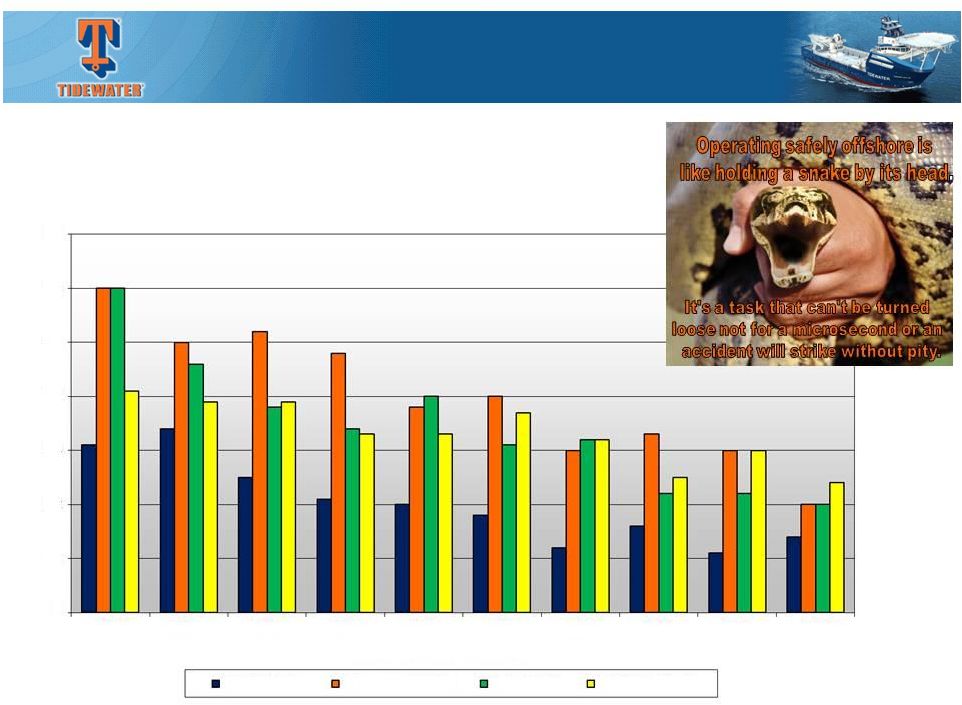 Safety
Record Rivals Leading Companies
4
CALENDAR YEARS
0.7
0.6
0.5
0.4
0.3
0.2
0.1
0
2003
2004
2005
2006
2007
2008
2009
2010
2011
2012
TOTAL RECORDABLE INCIDENT RATES
TIDEWATER
DOW CHEMICAL
CHEVRON
EXXON/MOBIL |
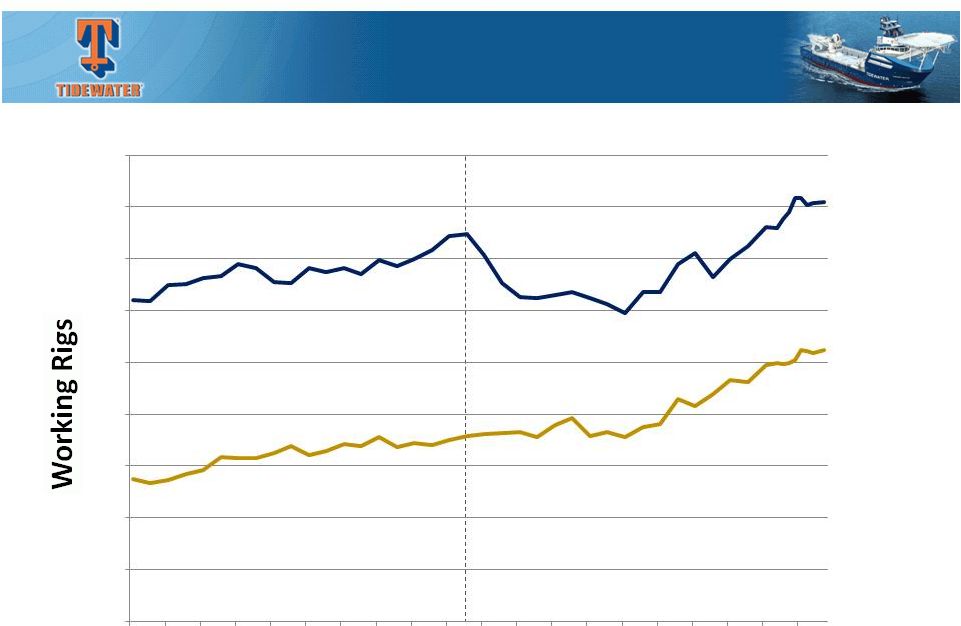 Working
Offshore Rig Trends Source: ODS-Petrodata
Note: 46 “Other”
rigs, along with the Jackups and Floaters, provide a total working rig count of 713 in November
2013. 405
262
5
Prior peak (summer 2008)
Jackups
Floaters
0
50
100
150
200
250
300
350
400
450
1/04
7/04
1/05
7/05
1/06
7/06
1/07
7/07
1/08
7/08
1/09
7/09
1/10
7/10
1/11
7/11
1/12
7/12
1/13
7/13 |
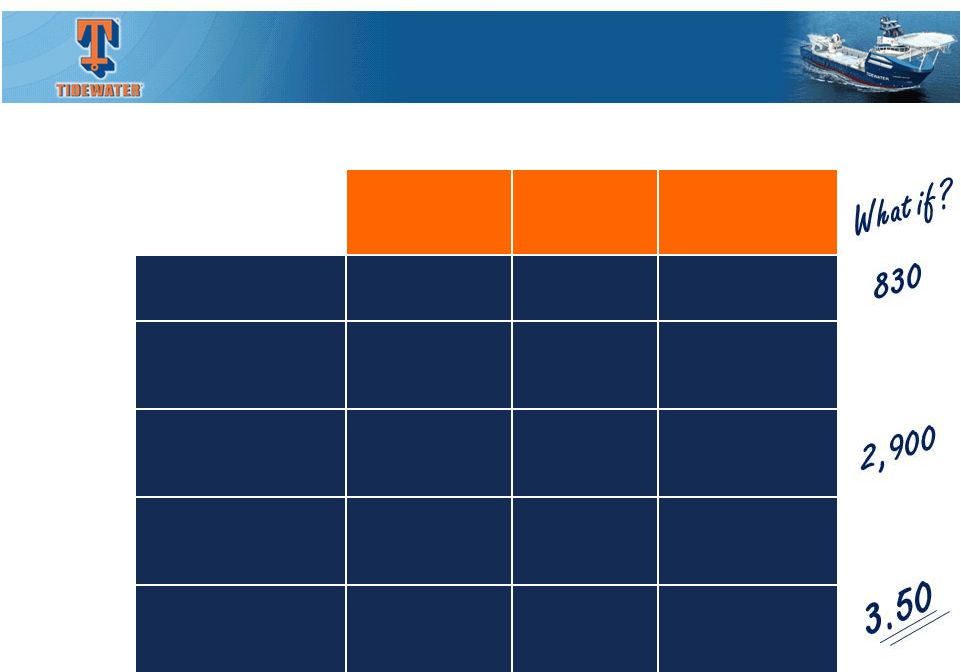 Drivers of
our Business “Peak to Present”
Source: ODS-Petrodata and Tidewater
July 2008
(Peak)
Jan. 2011
(Trough)
November
2013
Working Rigs
603
538
713
Rigs Under
Construction
186
118
234
OSV Global
Population
2,033
2,599
3,031
OSV’s Under
Construction
736
367
439
OSV/Rig Ratio
3.37
4.83
4.25
6 |
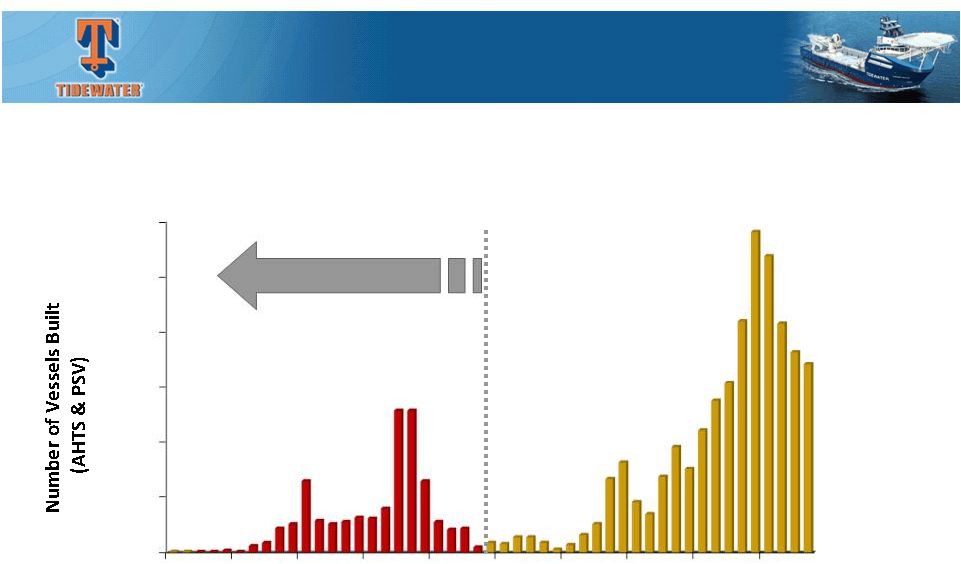 The
Worldwide OSV Fleet (Includes AHTS and PSVs only)
Estimated as of November 2013
Source: ODS-Petrodata and Tidewater
As of November 2013, there are approximately 439 additional
AHTS and PSV’s (~14% of the global fleet) under construction.
Global fleet is estimated at 3,031 vessels, including ~720 vessels that are 25+
yrs old (25%). 7
Vessels > 25 years old today
0
50
100
150
200
250
300
1965
1970
1975
1980
1985
1990
1995
2000
2005
2010 |
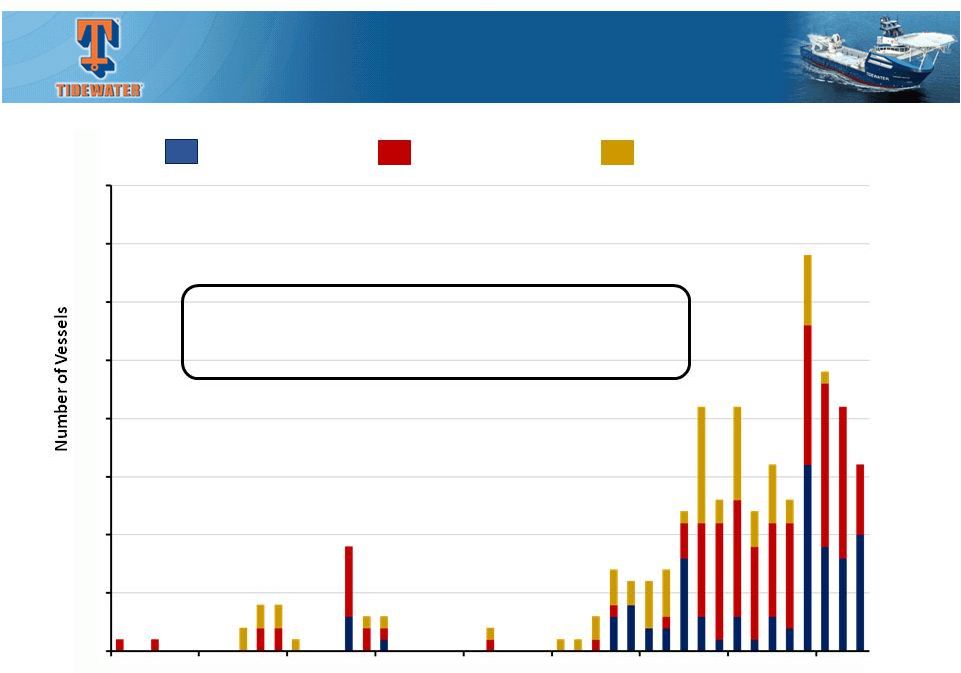 Tidewater’s Active Fleet
As of September 30, 2013
Year Built
Deepwater vessels
Towing Supply/Supply
Other vessels
240 “New”
vessels –
6.1 avg yrs
8
35
40
30
25
20
15
10
5
0
1970
1975
1980
1985
1990
1995
2000
2005
2010
27 “Traditional” vessels – 26.7 avg yrs
|
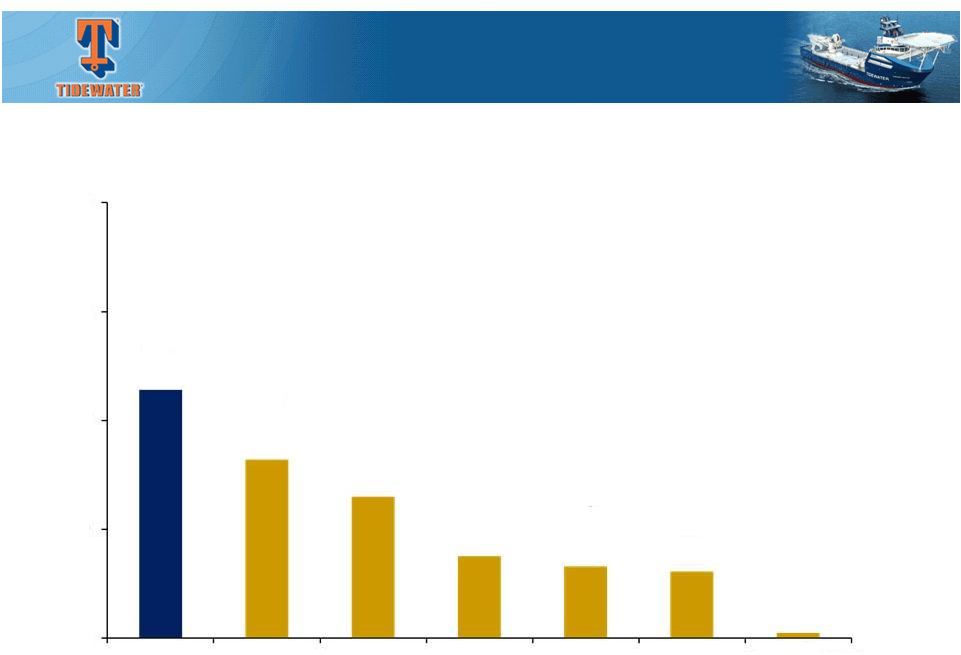 Vessel
Population by Owner (AHTS and PSVs only)
Estimated as of November 2013
Source: ODS-Petrodata and Tidewater
Tidewater
Competitor #2
Competitor #3
Competitor #4
Competitor # 5
Competitor #1
Avg.
All Others (2,306 total
vessels for
400+ owners)
9
400
300
200
100
0
228
164
130
75
66
61
5 |
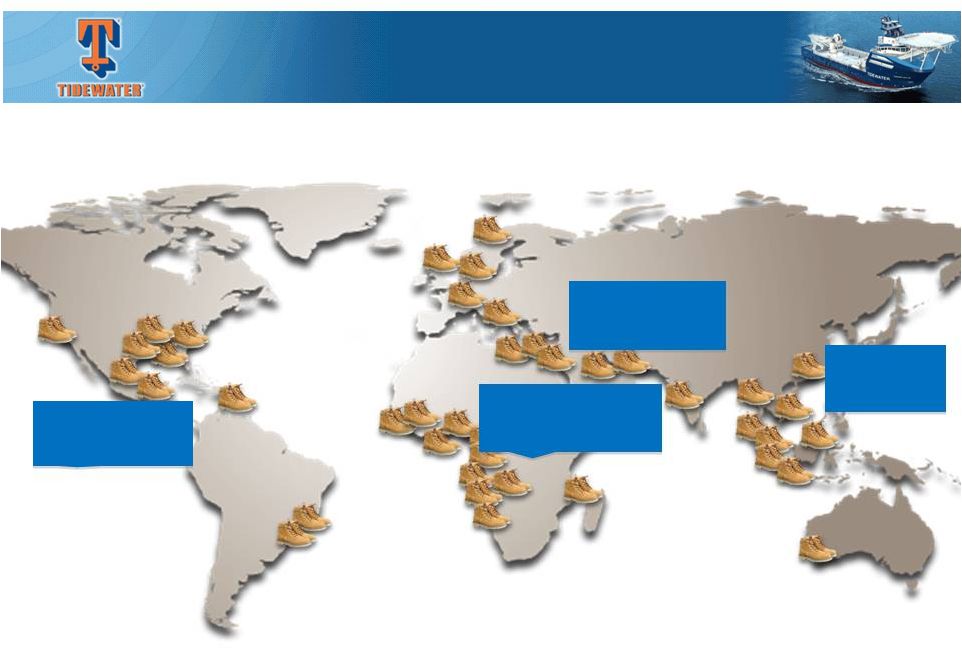 Our Global
Footprint Vessel Distribution by Region
(excludes stacked vessels -
as of 9/30/13)
In 2Q FY 2014, ~9% of vessel revenue was generated in the U.S. by < 15 vessels; however, <15
other U.S.-flagged vessels are currently operating in International regions that could be
re-deployed to the U.S. GOM. In addition, Tidewater has currently under construction five
additional U.S.-flagged deepwater PSVs. 10
Americas
63(24%)
SS Africa/Europe
136(51%)
MENA
44(16%)
Asia/Pac
24(9%) |
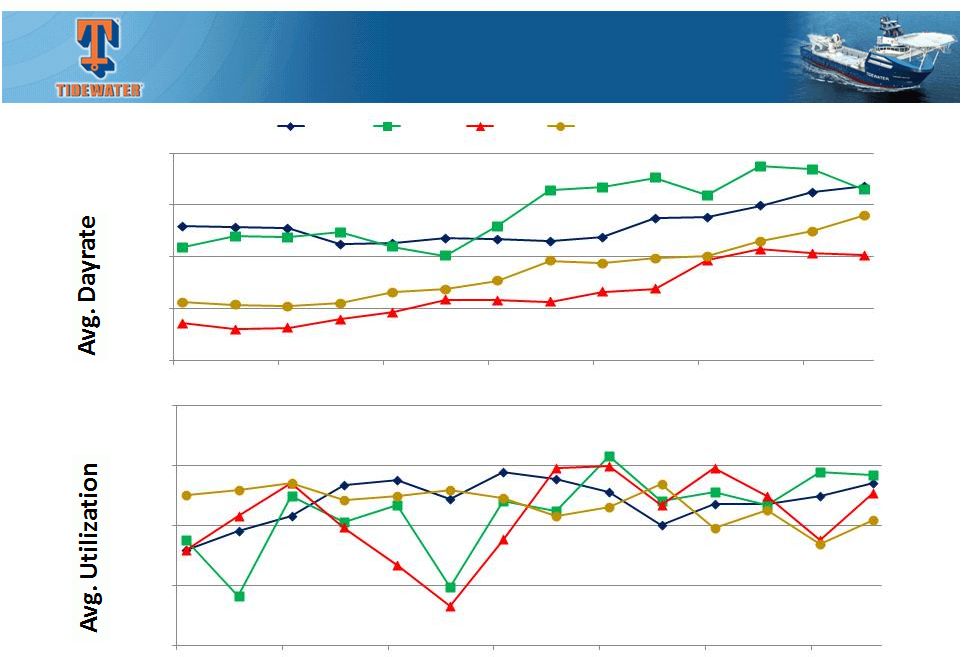 Active
Vessel Dayrates & Utilization by Segment
Impact of $7.4 million of retroactive revenue recorded in September 2012 quarter is excluded
from 9/12 average dayrates and included in the respective March 2012 and June 2012
quarterly average dayrates. Utilization stats exclude stacked vessels. 11
$6,000
$10,000
$14,000
$18,000
$22,000
6/10
12/10
6/11
12/11
6/12
12/12
6/13
60%
70%
80%
90%
100%
6/10
12/10
6/11
12/11
6/12
12/12
6/13
Americas
Asia/Pac
MENA
Sub Sah Africa/Eur. |
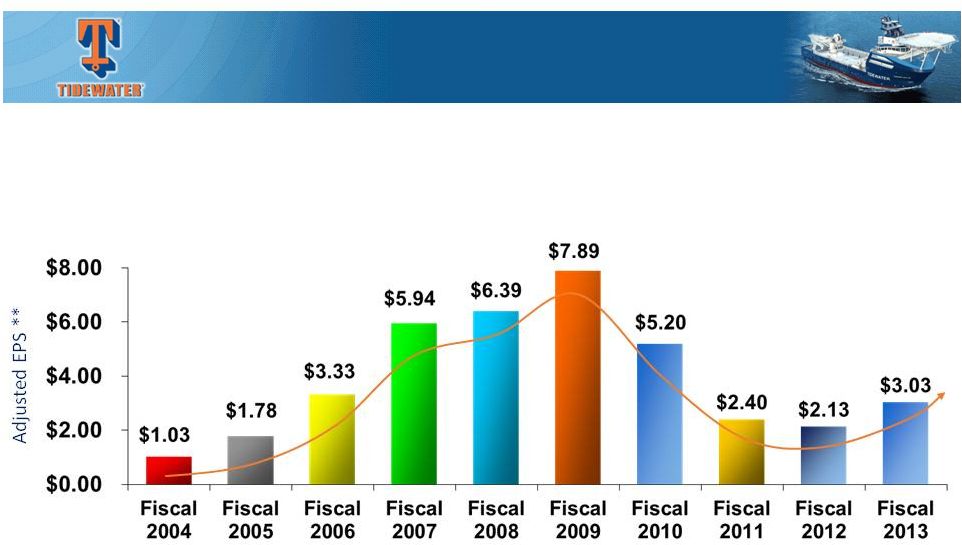 History
of Earnings Growth & Solid Through-Cycle Returns
**
EPS in Fiscal 2004 is exclusive of the $.30 per share after tax impairment charge. EPS in Fiscal 2006 is
exclusive of the $.74 per share after tax gain from the sale of six KMAR vessels. EPS in Fiscal
2007 is exclusive of $.37 per share of after tax gains from the sale of 14 offshore tugs. EPS in Fiscal 2010 is
exclusive of $.66 per share Venezuelan provision, a $.70 per share tax benefit related to
favorable resolution of tax litigation and a $0.22 per share charge for the proposed settlement
with the SEC of the company’s FCPA matter. EPS in Fiscal 2011 is exclusive of total $0.21 per share charges for settlements with
DOJ and Government of Nigeria for FCPA matters, a $0.08 per share charge related to participation in a
multi-company U.K.-based pension plan and a $0.06 per share impairment charge related to
certain vessels. EPS in Fiscal 2012 is exclusive of $0.43 per share goodwill impairment charge.
Adjusted Return
On Avg. Equity 4.3%
7.2% 12.4%
18.9% 18.3%
19.5% 11.4% 5.0%
4.3% 5.9%
Adjusted EPS**
12 |
 The
Largest Modern OSV Fleet in the Industry
Vessel Count (2)
Total Cost (2)
Average Cost
per Vessel
Deepwater PSVs
96
$2,630m
$27.4m
Deepwater AHTSs
11
$358m
$32.5m
Towing Supply/Supply
109
$1,615m
$14.8m
Other
55
$280m
$5.1m
TOTALS:
271
$4,883m
(1)
$18.0m
.
At 9/30/13, 240 new vessels were in our fleet with ~6.1 year average age
Vessel Commitments
Jan. ’00 –
September ‘13
(1)
~$4.27b (87%) funded through 9/30/13
(2)
Vessel count and total cost is net of 25 vessel dispositions ($227m of original cost)
13 |
 …..
and More to Come Count
Deepwater PSVs
23
Deepwater AHTSs
-
Towing Supply/Supply
6
Other
2
Total
31
Vessels Under Construction*
As of September 30, 2013
14
Estimated delivery schedule – 6 for the remainder of FY ’14, 16 in FY ’15 and 9
thereafter. CAPX of $218m
for the remainder of FY ’14, $303m in FY ‘15 and $105m in FY ’16. |
 Strong
Financial Position Provides Strategic Optionality
As of September 30, 2013
Cash & Cash Equivalents
$46 million
Total Debt
$1,446 million
Shareholders Equity
$2,635 million
Net Debt / Net Capitalization
35%
Total Debt / Capitalization
35%
15
~$650 million of available liquidity as of 9/30/13, including $420 million of unused
capacity under committed bank credit facilities and $200 million of delayed funding from
recent senior unsecured note financing. |
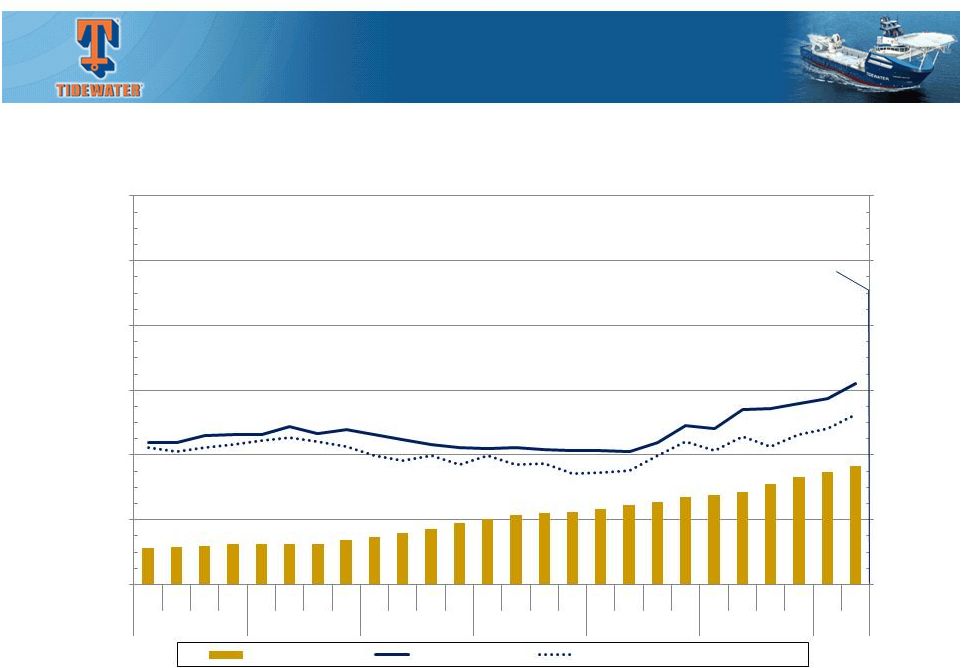 New
Vessel Trends by Vessel Type Deepwater PSVs
16
$176 million, or 49%, of Vessel Revenue in Q2 Fiscal 2014
Q2 Fiscal 2014
Avg Day Rate: $31,053
Utilization: 84.6%
22
23
24
25
25
25
25
28
29
32
34
38
40
43
44
45
47
49
51
54
55
57
62
66
69
73
-
40
80
120
160
200
240
$0
$10,000
$20,000
$30,000
$40,000
$50,000
$60,000
Q1
Q2
Q3
Q4
Q1
Q2
Q3
Q4
Q1
Q2
Q3
Q4
Q1
Q2
Q3
Q4
Q1
Q2
Q3
Q4
Q1
Q2
Q3
Q4
Q1
Q2
FY08
FY09
FY10
FY11
FY12
FY13
FY14
Average Day Rate, Adjusted Average Day Rate, and Average Fleet Size
Average Fleet Size
Average Day Rate
Utilization-Adjusted Average Day Rate |
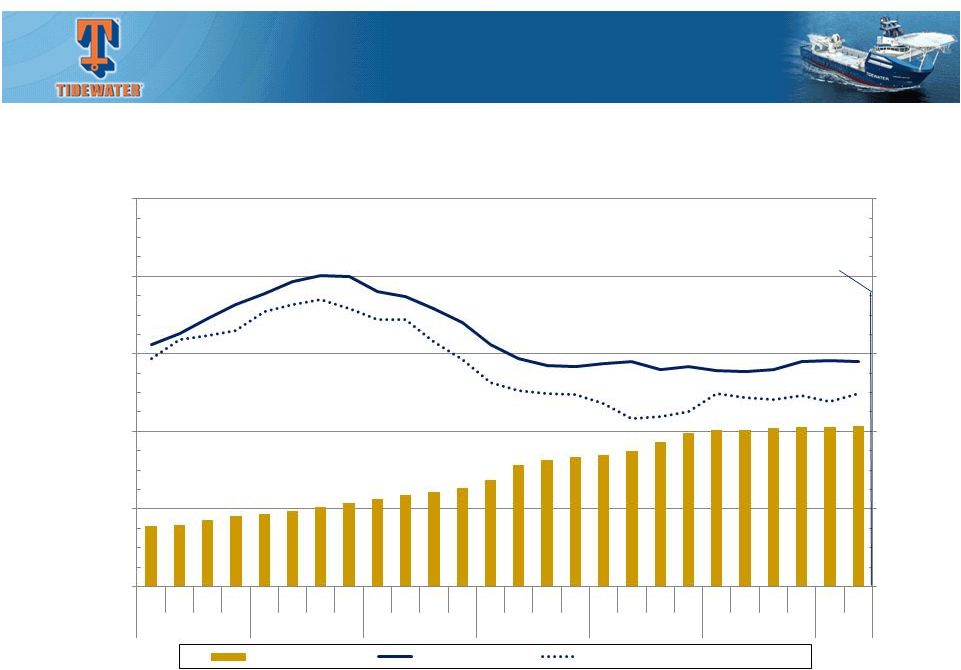 New
Vessel Trends by Vessel Type Towing Supply/Supply Vessels
17
$118 million, or 33%, of Vessel Revenue in Q2 Fiscal 2014
Q2 Fiscal 2014
Avg Day Rate: $14,484
Utilization: 85.7%
39
40
43
46
47
49
51
54
57
59
61
63
68
78
81
83
85
88
93
99
101
101 102
103
103
103
-
50
100
150
200
250
$0
$5,000
$10,000
$15,000
$20,000
$25,000
Q1
Q2
Q3
Q4
Q1
Q2
Q3
Q4
Q1
Q2
Q3
Q4
Q1
Q2
Q3
Q4
Q1
Q2
Q3
Q4
Q1
Q2
Q3
Q4
Q1
Q2
FY08
FY09
FY10
FY11
FY12
FY13
FY14
Average Day Rate, Adjusted Average Day Rate, and Average Fleet Size
Average Fleet Size
Average Day Rate
Utilization-Adjusted Average Day Rate |
 Tidewater’s New Subsea Business
18
Recent order of six
work-class remotely
operated vehicles (ROV) |
 Financial
Strategy Focused on Creating Long-Term Shareholder Value
Maintain
Financial Strength
EVA-Based Investments
On Through-cycle Basis
Deliver Results
19 |
 December 3, 2013
Cowen and Company 3
rd
Annual
Ultimate Energy Conference
Joseph M. Bennett
EVP & Chief IRO
Jeffrey M. Platt
President and CEO |
 Appendix
21 |
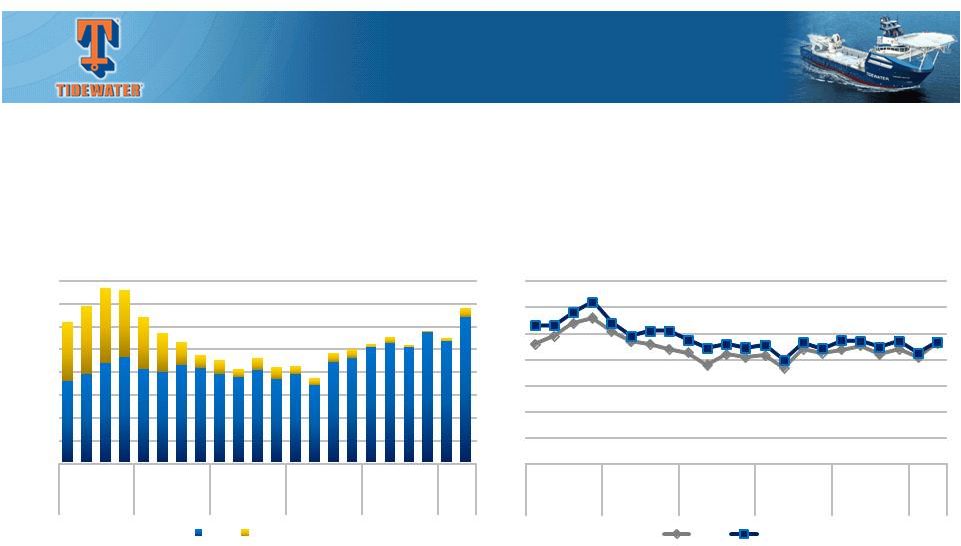
 Fleet
Renewal & Expansion Funded by CFFO thru Fiscal 2013
Over a 14-year period, Tidewater has invested $4.6 billion in CapEx, and paid out ~$1.2 billion
through dividends and share repurchases. Over the same period, CFFO and
proceeds from dispositions were $3.8
billion and $749 million, respectively
$ in millions
CFFO
Fiscal Year
22
$0
$100
$200
$300
$400
$500
$600
$700
2000
2001
2002
2003
2004
2005
2006
2007
2008
2009
2010
2011
2012
2013
CAPX
Dividend
Share Repurchase |
 Cyclical
Upturn should Drive Margin Expansion
23
Vessel Cash Operating Margin ($)
Vessel Cash Operating Margin (%)
$168 million Vessel Margin in Q2
FY2014 (94% from New Vessels)
Q2 FY2014 Vessel Margin: 46%
0%
10%
20%
30%
40%
50%
60%
70%
Q1
Q2
Q3
Q4
Q1
Q2
Q3
Q4
Q1
Q2
Q3
Q4
Q1
Q2
Q3
Q4
Q1
Q2
Q3
Q4
Q1
Q2
FY 2009
FY 2010
FY 2011
FY 2012
FY 2013
FY14
Total
New
$0
$25
$50
$75
$100
$125
$150
$175
$200
Q1
Q2
Q3
Q4
Q1
Q2
Q3
Q4
Q1
Q2
Q3
Q4
Q1
Q2
Q3
Q4
Q1
Q2
Q3
Q4
Q1
Q2
FY 2009
FY 2010
FY 2011
FY 2012
FY 2013
FY14
New
Traditional |
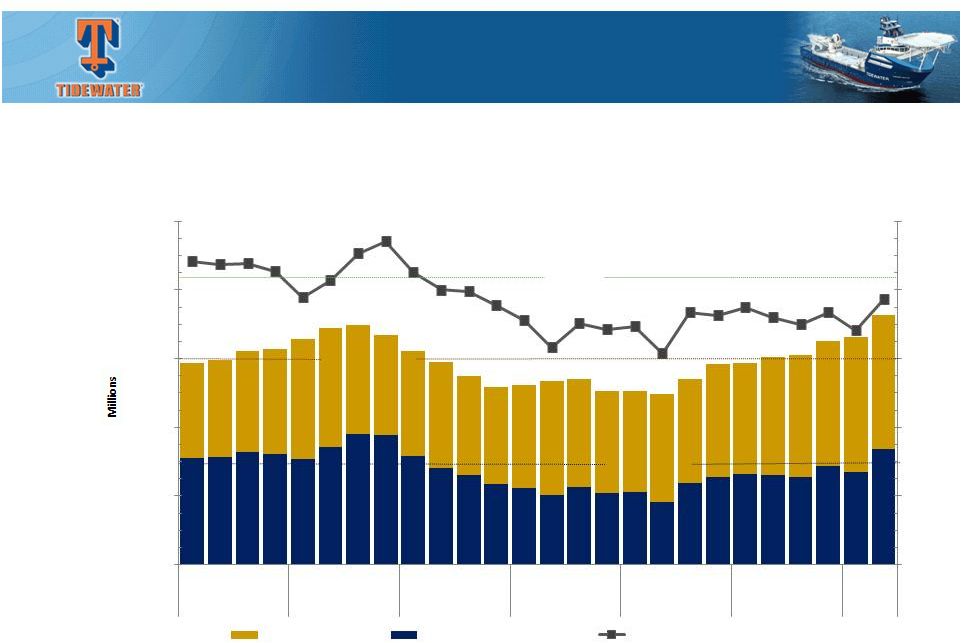 Total
Revenue
and
Margin
Fiscal
2008-2014
Note: Vessel operating margin is defined as vessel revenue less
vessel operating expenses
24
Prior peak period (FY2009)
averaged quarterly revenue of
$339M, quarter operating
margin of $175.6M at 51.8%
-
$100
$300
$400
$500
Q1
Q2
Q3
Q4
Q1
Q2
Q3
Q4
Q1
Q2
Q3
Q4
Q1
Q2
Q3
Q4
Q1
Q2
Q3
Q4
Q1
Q2
Q3
Q4
Q1
Q2
FY08
FY09
FY10
FY11
FY12
FY13
FY14
Vessel Revenue ($)
Vessel Operating Margin ($)
Vessel Operating Margin (%)
53.0%
46.7%
56.4%
47.7%
38.0%
41.0%
36.9%
45.0%
42.0%
44.1%
40.8%
46.3%
$
$200
$300 million
$150 million
50.0% |
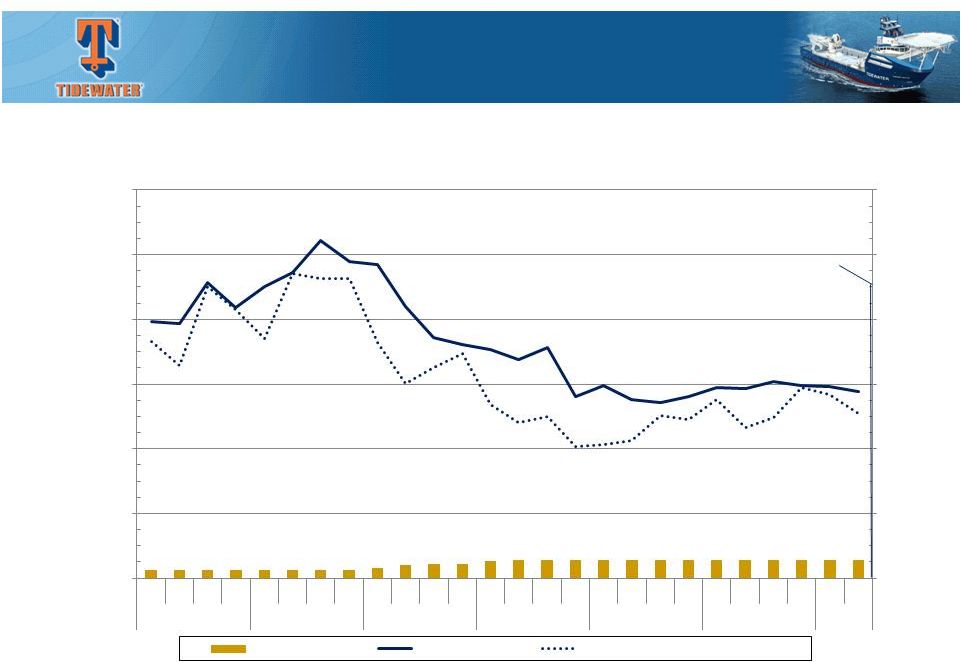 New
Vessel
Trends
by
Vessel
Type
Deepwater
AHTS
25
Q2 Fiscal 2014
Avg Day Rate: $28,885
Utilization: 87.9%
$26 million, or 7%, of Vessel Revenue in Q2 Fiscal 2014
40
80
120
160
200
240
-
$0
$10,000
$20,000
$30,000
$40,000
$50,000
$60,000
Average Day Rate, Adjusted Average Day Rate, and Average Fleet Size
FY08
FY09
FY10
FY11
FY12
FY13
FY14
Average Fleet Size
Average Day Rate
Utilization-Adjusted Average Day Rate
5
5
5
5
5
5
5
5
6
8
9
9
11
11
11
11
11
11
11
11
11
11
11
11
11
11
Q1
Q2
Q3
Q4
Q1
Q2
Q3
Q4
Q1
Q2
Q3
Q4
Q1
Q2
Q3
Q4
Q1
Q2
Q3
Q4
Q1
Q2
Q3
Q4
Q1
Q2 |
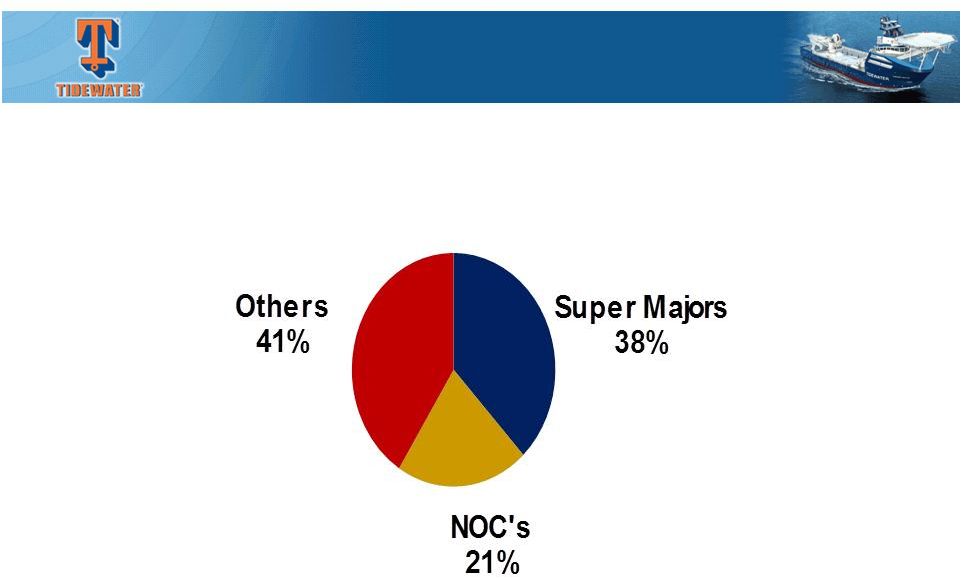 Current
Revenue
Mix
Quality
of
Customer
Base
Our top 10 customers in Fiscal 2013 (4 Super Majors, 2 NOC’s,
3 IOC’s and 1 independent) accounted for 58% of our revenue
26 |