Attached files
| file | filename |
|---|---|
| 8-K/A - 8-K/A - AVAYA INC | avayaform8-ka12513.htm |

Bank of America Merrill Lynch 2013 Leveraged Finance Conference December 2013 Dave Vellequette, CFO

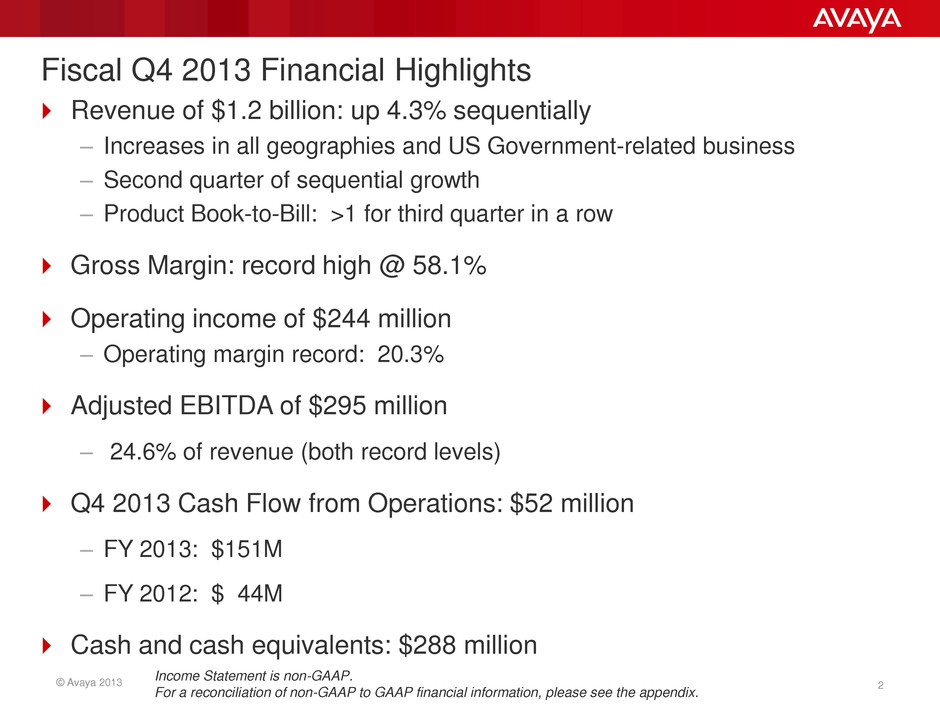
© Avaya 2013 2 Fiscal Q4 2013 Financial Highlights Revenue of $1.2 billion: up 4.3% sequentially – Increases in all geographies and US Government-related business – Second quarter of sequential growth – Product Book-to-Bill: >1 for third quarter in a row Gross Margin: record high @ 58.1% Operating income of $244 million – Operating margin record: 20.3% Adjusted EBITDA of $295 million – 24.6% of revenue (both record levels) Q4 2013 Cash Flow from Operations: $52 million – FY 2013: $151M – FY 2012: $ 44M Cash and cash equivalents: $288 million Income Statement is non-GAAP. For a reconciliation of non-GAAP to GAAP financial information, please see the appendix.

© Avaya 2013 3 Business Business 3Q13 Actual 4Q13 Actual B/(W) QoQ Model @ 1,100 Model @ 1,150 Products 561 617 56 515 555 % Margin 58.5% 62.4% 3.9% 61.6% 62.0% Services 590 583 (7) 585 595 % Margin 53.6% 53.5% -0.1% 55.0% 55.0% TOTAL REVENUE 1,151 1,200 49 1,100 1,150 Non-GAAP Gross Profit 644 697 53 639 671 % Non-GAAP Margin 56.0% 58.1% 2.1% 58.0% 58.3% Opex 473 453 20 446 453 % of Revenue 41.1% 37.8% 3.4% 40.5% 39.4% Non-GAAP Operating Income* 171 244 73 193 218 % Revenue 14.9% 20.3% 5.5% 17.5% 19.0% Adjusted EBITDA 225 295 70 250 275 % of Revenue 19.5% 24.6% 5.1% 22.7% 23.9% * Excl Intangibles, Integration, Restructuring, Acquisition P&L ($M) Non-GAAP • Product gross margin maintained above model • Gross Margin % was a record performance. • Adjusted EBITDA $ and % were record levels • We continue to target having all of the Cost Reduction Actions in place by end of calendar 2013 We have structured our cost improvement initiatives such that, if the quarterly revenue is between $1.10 billion and $1.15 billion, our operational structure, absent any incremental investments, would generate adjusted EBITDA in the range of $250 and $275 million For a reconciliation of non-GAAP to GAAP financial information, please see the appendix.

© Avaya 2013 4 Annual Financial Performance FY2010 FY2011 FY2012 FY2013 Revenue ($B) $5.1 $5.5 $5.2 $4.7 EBITDA (%) 16% 18% 19% 20% Gross Margin (%) Product 54% 57% 58% 59% Services 46% 48% 50% 53% Corporate-wide 50% 53% 54% 56% Net Promoter Score – – 32 41 Revenue / Employee $267K $298K $305K $330K Ending Headcount 18,925 18,588 16,951 14,315 Transformational initiatives have driven operational improvements in margin and profitability Amounts shown are non-GAAP. Amounts included may be rounded to the approximate nearest Million for revenue and full integer EBITDA and Margin percentages. For a reconciliation of non-GAAP to GAAP financial information, please see the appendix.

© Avaya 2013 5 0.15 2.0 1.1 1.3 1.4 $0.0 $0.5 $1.0 $1.5 $2.0 $2.5 2013 2014 2015 2016 2017 2018 2019 2020 2021 Avaya Debt Maturity Profile ($ in Billions, by calendar year) Senior Secured Bonds (9%) Senior Secured Bonds (7%) Cash Pay Notes (9.75%) PIK Toggle Notes (10.125%) TLB – 5 (8.0%) TLB – 4 (7.5%) TLB – 3 (4.8%) 2nd Lien Bonds (10.5%) No significant debt maturities until 2017 and beyond Amortization of $38M, paid annually against term loan amounts

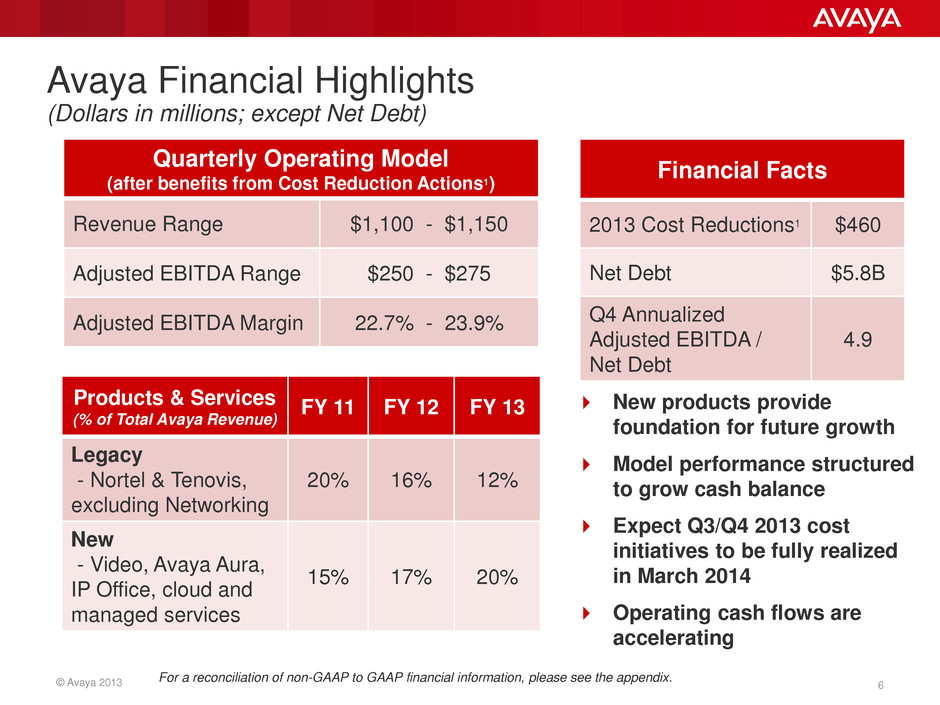
© Avaya 2013 6 Avaya Financial Highlights (Dollars in millions; except Net Debt) Quarterly Operating Model (after benefits from Cost Reduction Actions1) Revenue Range $1,100 - $1,150 Adjusted EBITDA Range $250 - $275 Adjusted EBITDA Margin 22.7% - 23.9% Financial Facts 2013 Cost Reductions1 $460 Net Debt $5.8B Q4 Annualized Adjusted EBITDA / Net Debt 4.9 Products & Services (% of Total Avaya Revenue) FY 11 FY 12 FY 13 Legacy - Nortel & Tenovis, excluding Networking 20% 16% 12% New - Video, Avaya Aura, IP Office, cloud and managed services 15% 17% 20% New products provide foundation for future growth Model performance structured to grow cash balance Expect Q3/Q4 2013 cost initiatives to be fully realized in March 2014 Operating cash flows are accelerating For a reconciliation of non-GAAP to GAAP financial information, please see the appendix.

© Avaya 2013 7 Forward-Looking Statements Certain statements contained in this presentation are forward-looking statements, including statements regarding our future financial and operating performance, as well as statements regarding our future growth plans and drivers. These statements may be identified by the use of forward-looking terminology such as "anticipate," "believe," "continue," "could," "estimate," "expect,“ "intend," "may," "might," "plan," "potential," "predict," "should" or "will" or other similar terminology. We have based these forward-looking statements on our current expectations, assumptions, estimates and projections. While we believe these expectations, assumptions, estimates and projections are reasonable, such forward looking statements are only predictions and involve known and unknown risks and uncertainties, many of which are beyond our control. These and other important factors may cause our actual results, performance or achievements to differ materially from any future results, performance or achievements expressed or implied by these forward-looking statements. For a list and description of such risks and uncertainties, please refer to our filings with the SEC that are available at www.sec.gov and in particular, our 2013 Form 10-K for the year ended September 30, 2013. We disclaim any intention or obligation to update or revise any forward-looking statements, whether as a result of new information, future events or otherwise. For a reconciliation of non-GAAP to GAAP financial information, please see the appendix and our Form 10-K filed with the SEC on 11/22/2013.

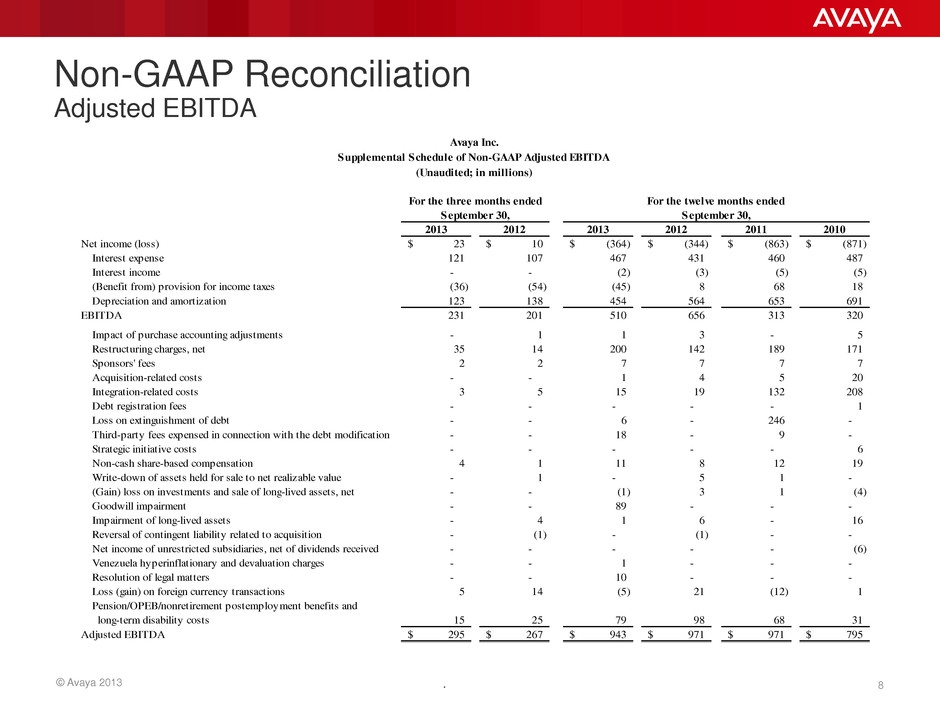
© Avaya 2013 8 Non-GAAP Reconciliation Adjusted EBITDA . 2013 2012 2013 2012 2011 2010 Net income (loss) 23$ 10$ (364)$ (344)$ (863)$ (871)$ Interest expense 121 107 467 431 460 487 Interest income - - (2) (3) (5) (5) (Benefit from) provision for income taxes (36) (54) (45) 8 68 18 Depreciation and amortization 123 138 454 564 653 691 231 201 510 656 313 320 Impact of purchase accounting adjustments - 1 1 3 - 5 Restructuring charges, net 35 14 200 142 189 171 Sponsors' fees 2 2 7 7 7 7 Acquisition-related costs - - 1 4 5 20 Integration-related costs 3 5 15 19 132 208 Debt registration fees - - - - - 1 Loss on extinguishment of debt - - 6 - 246 - Third-party fees expensed in connection with the debt modification - - 18 - 9 - Strategic initiative costs - - - - - 6 Non-cash share-based compensation 4 1 11 8 12 19 Write-down of assets held for sale to net realizable value - 1 - 5 1 - (Gain) loss on investments and sale of long-lived assets, net - - (1) 3 1 (4) Goodwill impairment - - 89 - - - Impairment of long-lived assets - 4 1 6 - 16 Reversal of contingent liability related to acquisition - (1) - (1) - - Net income of unrestricted subsidiaries, net of dividends received - - - - - (6) Venezuela hyperinflationary and devaluation charges - - 1 - - - Resolution of legal matters - - 10 - - - Loss (gain) on foreign currency transactions 5 14 (5) 21 (12) 1 Pension/OPEB/nonretirement postemployment benefits and long-term disability costs 15 25 79 98 68 31 Adjusted EBITDA 295$ 267$ 943$ 971$ 971$ 795$ EBITDA For the three months ended September 30, Avaya Inc. Supplemental Schedule of Non-GAAP Adjusted EBITDA (Unaudited; in millions) For the twelve months ended September 30,

© Avaya 2013 9 Non-GAAP Reconciliation Gross Margin and Operating Income Sept. 30, Dec. 31, Mar. 31, June 30, Sept. 30, Sept. 30, Sept. 30, Sept. 30, Sept. 30, 2012 2012 2013 2013 2013 2010 2011 2012 2013 GAAP Gross Profit 646$ 666$ 586$ 627$ 681$ 2,172$ 2,632$ 2,586$ 2,560$ GAAP Gross Margin 50.6% 53.7% 52.4% 54.5% 56.8% 42.9% 47.4% 50.0% 54.4% Items excluded: Amortization of technology intangible assets 46 22 14 13 14 291 257 192 63 Acquisition/integration-related costs - - - - - 54 26 - - Impairment of capitalized software development costs 4 - - 1 - - - 6 1 Share-based compensation 1 1 - 2 2 5 6 4 5 Purchase accounting adjustments 1 - - 1 - 5 - 3 1 Non-GAAP Gross Profit 698$ 689$ 600$ 644$ 697$ 2,527$ 2,921$ 2,791$ 2,630$ Non-GAAP Gross Margin 54.7% 55.6% 53.7% 56.0% 58.1% 49.9% 52.6% 54.0% 55.9% Reconciliation of Non-GAAP Operating Income GAAP Operating Income (Loss) 76$ 23$ (72)$ 14$ 113$ (381) (94)$ 115$ 78$ Percentage of Revenue 6% 2% -6% 1% 9% -8% -2% 2% 2% Items excluded: Amortization of acquired assets 103 79 71 70 70 509 483 418 290 Restructuring and impairment charges, net 15 84 18 63 35 187 189 147 200 Acquisition/integration-related costs 6 5 6 5 4 228 136 24 20 Share-based compensation 1 2 1 4 4 19 12 8 11 Impairment of capitalized software development costs 4 - - 1 - - - 6 1 Incremental accelerated depreciation - - - 3 18 - - - 21 Strategic initiative costs - - - - - 6 - - - Goodwill impairment - - 89 - - - - - 89 Resolution of legal matters - - - 10 - - - - 10 Purchase accounting adjustments 1 - - 1 - 5 - 3 1 Non-GAAP Operating Income 206$ 193$ 113$ 171$ 244$ 573$ 726$ 721$ 721$ Percentage of Revenue 16.1% 15.6% 10.1% 14.9% 20.3% 11.3% 13.1% 13.9% 15.3% Reconciliation of Non-GAAP Gross Profit and Non-GAAP Gross Margin Avaya Inc. Supplemental Schedules of Non-GAAP Reconciliations (Unaudited; in millions) For the Twelve Months EndedFor the Three Months Ended

© Avaya 2013 10 Non-GAAP Reconciliation Product and Services Gross Margins Sept. 30, Dec. 31, Mar. 31, June 30, Sept. 30, Sept. 30, Sept. 30, Sept. 30, Sept. 30, 2012 2012 2013 2013 2013 2010 2011 2012 2013 Revenue 652$ 631$ 529$ 560$ 617$ 2,602$ 2,976$ 2,672$ 2,337$ Costs (exclusive of amortization of technology intangible assets)ts (exclusive of amortization of technology intangible assets) 284 261 236 234 232 1,243 1,314 1,145 963 Amortization of technology intangible assetsortiz tion of technol gy intangible assets 46 22 14 13 14 291 257 192 63 GAAP Gross Profit 322 348 279 313 371 1,068 1,405 1,335 1,311 GAAP Gross Margin 49.4% 55.2% 52.7% 55.9% 60.1% 41.0% 47.2% 50.0% 56.1% Items excluded: Amortization of technology intangible assets 46 22 14 13 14 291 257 192 63 Acquisition/integration-related costs - - - - - 37 18 - - Impairment of capitalized software development costs 4 - - 1 - - - 6 1 Purchase accounting adjustments 1 - - 1 - - (3) 3 1 Non-GAAP Gross Profit 373$ 370$ 293$ 328$ 385$ 1,396$ 1,677$ 1,536$ 1,376$ Non-GAAP Gross Margin 57.2% 58.6% 55.4% 58.5% 62.4% 53.7% 56.3% 57.4% 58.9% Revenue 625$ 609$ 589$ 590$ 583$ 2,458$ 2,571$ 2,499$ 2,371$ Costs 301 291 282 276 273 1,354 1,344 1,248 1,122 GAAP Gross Profit 324 318 307 314 310 1,104 1,227 1,251 1,249 GAAP Gross Margin 51.8% 52.2% 52.1% 53.2% 53.2% 44.9% 47.7% 50.1% 52.7% Items excluded: Acquisition/integration-related costs - - - - - 17 8 - - Share-based compensation 1 1 - 2 2 5 6 4 5 Purchase accounting adjustments - - - - - 5 3 - - Non-GAAP Gross Profit 325$ 319$ 307$ 316$ 312$ 1,131$ 1,244$ 1,255$ 1,254$ Non-GAAP Gross Margin 52.0% 52.4% 52.1% 53.6% 53.5% 45.9% 48.3% 50.2% 52.9% Reconciliation of Non-GAAP Gross Profit and Non-GAAP Gross Margin - Services Avaya Inc. Supplemental Schedules of Non-GAAP Reconciliation of Gross Profit and Gross Margin by Portfolio (Unaudited; in millions) For the Three Months Ended Reconciliation of Non-GAAP Gross Profit and Non-GAAP Gross Margin - Products For the Twelve Months Ended

