Attached files
| file | filename |
|---|---|
| EX-23.1 - EX-23.1 - Ryerson Holding Corp | d618878dex231.htm |
Table of Contents
As filed with the Securities and Exchange Commission on December 4, 2013.
Registration No 333-164484
UNITED STATES
SECURITIES AND EXCHANGE COMMISSION
Washington, D.C. 20549
AMENDMENT NO. 17
TO
FORM S-1
REGISTRATION STATEMENT
UNDER
THE SECURITIES ACT OF 1933
RYERSON HOLDING CORPORATION
(Exact name of registrant as specified in its charter)
| Delaware | 5051 | 26-1251524 | ||
| (State or other jurisdiction of incorporation or organization) |
(Primary Standard Industrial Classification Code Number) |
(I.R.S. Employer Identification No.) |
227 W. Monroe, 27th Floor
Chicago, Illinois 60606
(312) 292-5000
(Address, including zip code, and telephone number, including area code, of registrant’s principal executive offices)
Mark S. Silver
Vice President and Managing Counsel
Ryerson Holding Corporation
227 W. Monroe, 27th Floor
Chicago, Illinois 60606
(312) 292-5000
(Name, address, including zip code, and telephone number, including area code, of agent for service)
Copies to:
| Cristopher Greer, Esq. | James J. Clark, Esq. William J. Miller, Esq. | |
| Willkie Farr & Gallagher LLP 787 Seventh Avenue New York, New York 10019 (212) 728-8000 Facsimile: (212) 728-9214 |
Cahill Gordon & Reindel LLP 80 Pine Street New York, New York 10005 (212) 701-3000 Facsimile: (212) 269-5420 |
Approximate date of commencement of proposed sale to the public:
As soon as practicable after this Registration Statement becomes effective.
If any of the securities being registered on this Form are to be offered on a delayed or continuous basis pursuant to Rule 415 under the Securities Act, check the following box. ¨
If this Form is filed to register additional securities for an offering pursuant to Rule 462(b) under the Securities Act, check the following box and list the Securities Act registration statement number of the earlier effective registration statement for the same offering. ¨
If this Form is a post-effective amendment filed pursuant to Rule 462(c) under the Securities Act, check the following box and list the Securities Act registration statement number of the earlier effective registration statement for the same offering. ¨
If this Form is a post-effective amendment filed pursuant to Rule 462(d) under the Securities Act, check the following box and list the Securities Act registration statement number of the earlier effective registration statement for the same offering. ¨
Indicate by check mark whether the registrant is a large accelerated filer, an accelerated filer, a non-accelerated filer, or a smaller reporting company. See the definitions of “large accelerated filer,” “accelerated filer” and “smaller reporting company” in Rule 12b2 of the Exchange Act.
| Large accelerated filer ¨ | Accelerated filer ¨ | |
| Non-accelerated filer x | Smaller reporting company ¨ | |
| (Do not check if a smaller reporting company) |
|
| ||||
| Title of Each Class of Securities To Be Registered | Proposed Maximum Aggregate Offering Price(1)(2) |
Amount of Registration Fee(3) | ||
| Common Stock, par value $0.01 per share |
$300,000,000 | $34,380 | ||
|
| ||||
| (1) | Estimated solely for purposes of determining the registration fee in accordance with Rule 457(o) under the Securities Act of 1933, as amended. |
| (2) | Includes shares of common stock that may be purchased by the underwriters to cover over-allotments, if any. See “Underwriting.” |
| (3) | Previously paid. |
The Registrant hereby amends this Registration Statement on such date or dates as may be necessary to delay its effective date until the Registrant shall file a further amendment which specifically states that this Registration Statement shall thereafter become effective in accordance with Section 8(a) of the Securities Act of 1933, as amended, or until this Registration Statement shall become effective on such date as the Commission, acting pursuant to said Section 8(a), may determine.
Table of Contents
The information in this prospectus is not complete and may be changed. Neither we nor the selling stockholders may sell these securities until the registration statement filed with the Securities and Exchange Commission is effective. This prospectus is not an offer to sell these securities and is not soliciting an offer to buy these securities in any jurisdiction where the offer or sale is not permitted.
Subject to Completion
Preliminary Prospectus dated , 2013
PROSPECTUS
Shares

Ryerson Holding Corporation
Common Stock
We are selling shares of our common stock. The selling stockholders identified in this prospectus have granted the underwriters an option to purchase up to additional shares of common stock to cover over-allotments. We will not receive any proceeds from the sale of shares by the selling stockholders.
This is the initial public offering of our common stock. We currently expect the initial public offering price to be between $ and $ per share. We have applied to have our common stock listed on the New York Stock Exchange under the symbol “RYI.”
Investing in our common stock involves a high degree of risk. See “Risk Factors” beginning on page 18.
| Per Share | Total | |||||||
| Public Offering Price |
$ | $ | ||||||
| Underwriting Discount(1) |
$ | $ | ||||||
| Proceeds, before expenses, to us |
$ | $ | ||||||
| (1) | See “Underwriting” for a description of the compensation payable to the underwriters. |
The underwriters may also purchase up to an additional shares from the selling stockholders, at the public offering price, less the underwriting discount, within 30 days of the date of this prospectus.
Neither the Securities and Exchange Commission nor any state securities commission has approved or disapproved of these securities or determined if this prospectus is truthful or complete. Any representation to the contrary is a criminal offense.
The underwriters expect to deliver the shares to purchasers on or about , 2014.
| BofA Merrill Lynch | Deutsche Bank Securities | BMO Capital Markets |
| J.P. Morgan | Jefferies | |
| Wells Fargo Securities | KeyBanc Capital Markets | Citigroup | ||||
| Macquarie Capital | ||||||
The date of this prospectus is , 2013
Table of Contents

Table of Contents
You should rely only on the information contained in this prospectus and any free writing prospectus we may specifically authorize to be delivered or made available to you. We have not, and the selling stockholders and the underwriters have not, authorized anyone to provide you with different information. We are not, and the selling stockholders and the underwriters are not, making an offer of these securities in any jurisdiction where the offer is not permitted. You should not assume that the information contained in this prospectus and any free writing prospectus we may specifically authorize to be delivered or made available to you is accurate as of any date other than the date on the front of this prospectus, regardless of its time of delivery or of any sale of shares of our common stock. Our business, financial condition, results of operations and prospects may have changed since that date.
| Page | ||||
| 1 | ||||
| 18 | ||||
| 31 | ||||
| 33 | ||||
| 34 | ||||
| 36 | ||||
| 37 | ||||
| 38 | ||||
| MANAGEMENT’S DISCUSSION AND ANALYSIS OF FINANCIAL CONDITION AND RESULTS OF OPERATIONS |
40 | |||
| 62 | ||||
| 79 | ||||
| 84 | ||||
| 92 | ||||
| 96 | ||||
| 97 | ||||
| 99 | ||||
| 101 | ||||
| 105 | ||||
| 111 | ||||
| 113 | ||||
| 116 | ||||
| 124 | ||||
| 124 | ||||
| 124 | ||||
| F-1 | ||||
Table of Contents
INDUSTRY AND MARKET DATA
In this prospectus, we rely on and refer to information and statistics regarding the steel processing industry and our market share in the sectors in which we compete. We obtained this information and these statistics from sources other than us, which we have supplemented where necessary with information from publicly available sources, discussions with our customers and our own internal estimates. References in this prospectus to:
| • | American Iron and Steel Institute (“AISI”) refer to its SteelWorks website from March 2013, or its Steel Production Capacity Utilization index from November 2013; |
| • | The Institute for Supply Management refer to its October 2013 Manufacturing ISM Report on Business®; |
| • | United States Federal Reserve refer to its September 2013 “Summary of Economic Projections”; |
| • | The Metals Service Center Institute (“MSCI”) refer to its October 2013 edition of “MSCI Metal Activity Report”; |
| • | The Federal Reserve Bank of Philadelphia refer to its June 2013 issue of “The Livingston Survey”; |
| • | Euromonitor refer to its February 2013 “Consumer Appliances in the U.S.” report; |
| • | IBIS Worldwide refer to its January 2013 “Heating & Air Conditioning in the U.S.” report; |
| • | LMC Automotive refer to its Q3 2013 data; |
| • | MarketLine refer to its May 2013 “Machinery in the United States” report; |
| • | Wood Mackenzie refer to its October 2013 “Metals Market Service Monthly Update” reports; |
| • | Bureau of Economic Analysis refer to its November 2013 “Auto and Truck Seasonal Adjustment” data; and |
| • | Metal Center News refer to its September 2013 “Service Center Top 50” report. |
We use these sources and estimates and believe them to be reliable, but we cannot give you any assurance that any of the projected results will be achieved.
Table of Contents
This summary highlights information contained elsewhere in this prospectus. This summary does not contain all of the information that you should consider before investing in our common stock. You should read the entire prospectus carefully together with our consolidated financial statements and the related notes appearing elsewhere in this prospectus before making an investment decision. This prospectus contains forward-looking statements that involve risks and uncertainties. Our actual results could differ materially from those anticipated in such forward-looking statements as a result of certain factors, including those discussed in the “Risk Factors” and other sections of this prospectus.
Except as otherwise indicated herein or as the context otherwise requires, references in this prospectus to “Ryerson Holding,” “the Company,” “we,” “our,” and “us” refer to Ryerson Holding Corporation and its direct and indirect subsidiaries (including Ryerson Inc.). The term “Ryerson” refers to Ryerson Inc., a direct wholly owned subsidiary of Ryerson Holding, together with its subsidiaries on a consolidated basis. “Platinum” refers to Platinum Equity, LLC and its affiliated investment funds, certain of which are our principal stockholders, and “Platinum Advisors” refers to Platinum Equity Advisors, LLC. We refer to the issuance of our common stock being offered hereby as the “offering.”
Our Company
We believe we are one of the largest processors and distributors of metals in North America measured in terms of sales, with global operations in North America, China and a recently established presence in Brazil. Our industry is highly fragmented with the largest companies accounting for only a small percentage of total market share. Our customer base ranges from local, independently owned fabricators and machine shops to large, international original equipment manufacturers. We process and distribute a full line of over 75,000 products in stainless steel, aluminum, carbon steel and alloy steels and a limited line of nickel and red metals in various shapes and forms. More than one-half of the products we sell are processed to meet customer requirements. We use various processing and fabricating techniques to process materials to a specified thickness, length, width, shape and surface quality pursuant to customer orders. For the year ended December 31, 2012, we purchased 2.1 million tons of materials from suppliers throughout the world. For the nine months ended September 30, 2013, our Adjusted EBITDA, excluding LIFO expense was $128.1 million, revenue was $2,657.8 million and net income was $8.2 million. See note 4 in “Summary Historical Consolidated Financial and Other Data” for a reconciliation of Adjusted EBITDA to net income.
We operate over 90 facilities across North America, six facilities in China and one in Brazil. Our service centers are strategically located in close proximity to our customers, which allows us to quickly process and deliver our products and services, often within the next day of receiving an order. We own, lease or contract a fleet of tractors and trailers, allowing us to efficiently meet our customers’ delivery demands. In addition, our scale enables us to maintain low operating costs. Our operating expenses as a percentage of sales for the years ended December 31, 2011 and 2012 were 11.8% and 12.6%, respectively.
We serve more than 40,000 customers across a wide range of manufacturing end markets. We believe the diverse end markets we serve reduce the volatility of our business in the aggregate. Our geographic network and broad range of products and services allow us to serve large, international manufacturing companies across multiple locations.
Following this offering, because Platinum will control more than 50% of the voting power of our common stock, we will be considered a “controlled company” under the New York Stock Exchange rules. As such, we are permitted, and have elected, to opt out of compliance with certain NYSE corporate governance requirements. Accordingly, stockholders will not have the same protections afforded to stockholders of companies that are
1
Table of Contents
subject to all of the NYSE corporate governance requirements. See “Risk Factors” — We are exempt from certain corporate governance requirements because we are a controlled company within the meaning of the NYSE rules for a summary of the effects of a controlled company on investors.
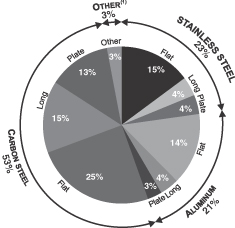
We are broadly diversified in our end markets and product lines in North America, as detailed below.
| 2012 Sales by End Market | 2012 Sales by Product | |
|
|
| |
| (1) “Other” includes copper, brass, nickel, pipe, valves and fittings. | ||
Industry and End Market Outlook
Ryerson participates in the metals service center industry providing steel, aluminum and other metals products across a wide range of industrial manufacturing end markets. Our business performance is therefore impacted by a number of factors tied to industrial activity, including economic growth, end market demand and metals pricing. With steel products accounting for 76% of our 2012 sales, it is the largest driver of our business. Aluminum products account for 21% of our business, with other metals accounting for the remainder.
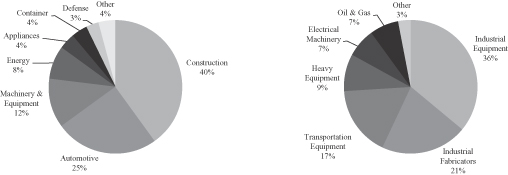
Macroeconomic Outlook. Steel is utilized in a diverse range of manufacturing and fabrication applications with a variety of end market demand drivers. The primary drivers of demand for the steel industry are the construction, automotive, machinery and equipment, and energy end markets, which, according to the American Iron and Steel Institute, account for approximately 85% of shipments collectively. As evidenced by our end market sales segmentation, we are not reliant on a single specific sector, but rather broader diversified industrial activity. Our primary end markets include industrial equipment and fabrication, transportation equipment, heavy equipment, electrical machinery and oil and gas. We believe that we are well positioned in these markets and that they are poised for growth as the broader industrial sectors continue to grow. The charts below, which reflect the most recently available data from AISI, show our end market exposure as well as the broader steel market.
2
Table of Contents
| 2012 Steel Shipments by Market Classification (AISI) | 2012 Ryerson Sales by End Market | |
| ||
| Source: American Iron and Steel Institute | Source: Company estimates | |
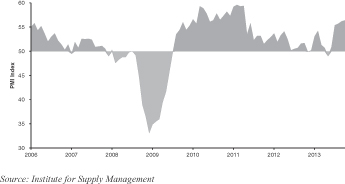
While some of the key end market drivers of steel industry demand do not directly overlap with our end markets, they do impact broader steel demand and pricing, which can impact our business. Recently, leading indicators in the key steel industry end markets referenced above have begun to show sustained growth and continue to build positive momentum. For example, housing starts have shown stable growth over the last 24 months, while non-residential construction, which typically lags housing, is starting to show signs of sustained improvement as well. Additionally, U.S. automotive sales continue to rise according to the Bureau of Economic Analysis, reaching 15.2 million vehicles on a seasonally adjusted annualized rate basis in October 2013 versus 14.3 million for October of 2012. Machinery and equipment, a key end market for us, includes a variety of industrial manufacturing end markets, many of which are showing signs of significant growth. This is evidenced by the Institute for Supply Management’s (“ISM”) Purchasing Managers’ Index (“PMI”), which reached 56.4 in October 2013. The United States Federal Reserve midpoint GDP growth estimates of 3.0% and 3.25% for 2014 and 2015, respectively. Finally, the oil and gas end market continues to be a long-term growth market in steel. Much of this growth is attributable to growth in North American drilling and refining, substantially impacted by activity in United States shale oil and gas and the Canadian oil sands. Additionally, investment in new petrochemical production capacity in the United States as a result of relatively low domestic natural gas prices may further bolster steel demand. The following chart shows the historical movements of the Purchasing Managers’ Index.
ISM Purchasing Managers’ Index
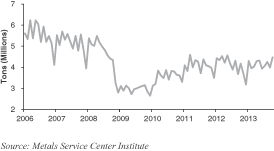
According to MSCI, total inventory levels of carbon steel, stainless steel and aluminum at U.S. service centers reached a trough in August 2009 and bottomed at the lowest levels since the data series began in 1977. Although industry demand recovered in 2010, 2011 and 2012, shipments and inventory are still well below pre-downturn averages, which we believe suggests long-term growth potential that may be realized if these metrics return to, or exceed, their historical averages.
3
Table of Contents
| North American Monthly Service Center Shipments | North American Monthly Service Center Inventory | |
|
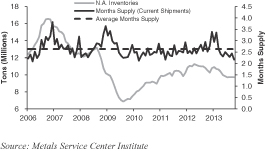
|
Ryerson End Market Outlook. Although our revenue for the nine months ended September 30, 2013 decreased 16.3% compared to the nine months ended September 30, 2012 due to weaker economic conditions in the metals market, according to the latest Livingston Survey, published by the Federal Reserve Bank of Philadelphia, U.S. industrial production is expected to grow by 2.8% and 3.1% in 2013 and 2014, respectively. Two of our largest end markets, industrial equipment and fabrication, include numerous diversified industrial manufacturing markets which, along with the broader economy, are showing signs of sustained growth. For example, in the U.S. major appliances and Heating Ventilation and Air Conditioning (“HVAC”) equipment, both markets we serve, are projected to grow at even higher rates. Specifically, major appliances are expected to grow 6.5% and 6.1% in 2014 and 2015, respectively, according to Euromonitor. According to IBIS Worldwide, HVAC is expected to grow 2.2% and 3.7% over the same periods.
In addition, we also serve the transportation equipment, heavy equipment and electrical equipment markets which are expected to show significant growth in the coming years. Transportation equipment, including commercial vehicle production, represents 17% of our sales and is expected to grow 2.8% per year in the U.S. between 2013 and 2015 according to LMC Automotive. Machinery and heavy equipment, including construction and agricultural equipment, represents 9% of our end-market sales and is projected to grow 7.1% per year in the U.S. between 2012 and 2016 according to MarketLine.
Metals Pricing. Along with improvements in volume, as indicated by demand trends in the end markets, movements in the price of steel will also impact our business. Steel prices are driven by a number of factors, including input prices, capacity utilization and foreign imports. Currently, input costs are providing support for steel pricing, as they flow directly through the pricing of the mills’ steel output. Additionally, we believe that recent closings of mills, including the Sparrows Point steel mill, among others, that have been dismantled, combined with continued growth in the global economy and end market demand, should begin to absorb global capacity, resulting in increased utilization. The U.S. steel industry production capacity utilization rate increased to 77.5% by the end of November 2013 from a low of 34% in December 2008, according to AISI. North American production capacity utilization levels remain below the 85% average utilization level observed in the post- consolidation restructured steel industry from 2002 to 2008. Although our average selling price decreased 10.3% in the nine months ended September 30, 2013 compared to the nine months ended September 30, 2012 due to decreases in metals prices across all of our products, with some of the largest decreases in our carbon plate, stainless steel plate and stainless steel long product lines, we believe that the combination of higher input prices, increased global demand and increased capacity utilization will support steel price increases in the near future, positively impacting our business.
Aluminum pricing also remains well below pre-downturn levels but has stabilized recently. Global output of aluminum is projected to increase 6.6% in 2014 according to Wood Mackenzie, fueled by factors including the rebound in U.S. construction and increased demand from the transportation and infrastructure markets in China.
4
Table of Contents
Industry Consolidation. The United States service center industry is a highly fragmented market with the top 50 service centers controlling approximately 25% of industry sales, according to Metal Center News, only 12 of which have sales over $1 billion. Such fragmentation has historically resulted in the smaller service centers having less negotiating leverage with both the larger consolidated steel mills, as well as larger customers. In recent years, however, there has been increased consolidation among larger players resulting in fewer customers of size for the mills and greater purchasing power for service centers. A recent example is the acquisition of Metals USA Holding Corp. by Reliance Steel & Aluminum Co. We believe that there is significant opportunity for consolidation and we expect the trend will continue.
Our Competitive Strengths
Leading Market Position in North America.
We believe we are one of the largest service center companies for carbon and stainless steel as well as aluminum based on sales in the North American market where we have a broad geographic presence with over 90 locations.
Our service centers are located near our customer locations, enabling us to provide timely delivery to customers across numerous geographic markets. Additionally, our widespread network of locations in the United States, Canada and Mexico helps us to utilize our expertise to more efficiently serve customers with complex supply chain requirements across multiple manufacturing locations. We believe this is a key differentiator among customers who need a supplier that can reliably and consistently support them. Our ability to transfer inventory among our facilities better enables us to more timely and profitably source and process specialized items at regional locations throughout our network than if we were required to maintain inventory of all products and specialized equipment at each location.
We believe with our significant footprint in the North American market, combined with our significant scale and operating leverage, a cyclical recovery of the service center industry supported by long-term growth trends in Ryerson’s end-markets should allow us to experience higher growth rates relative to North American economic improvement, but there can be no guarantee that we will experience such higher growth rates.
Broad Geographic Reach across Attractive End Markets.
Our operations cover a diverse range of industries, including industrial equipment, industrial fabrication, electrical machinery, transportation equipment, heavy equipment and oil and gas. Manufacturing growth has accelerated since November 2012 as shown by the ISM index (as described in the Industry and End Market Outlook), and we believe industries we serve will provide strong demand for our products and services as the North American manufacturing economy continues to recover. We also believe that the continued trend of moving manufacturing to the United States from overseas should benefit us with our broad North American platform. In addition, we expect to benefit from continued growth in international markets that will help spur demand at domestic manufacturing facilities that sell into the global market. We believe that our ability to quickly adjust our offering based on regional and industry specific trends creates stability while also providing the opportunity to access specific growth markets.
Established Platform for Organic and Acquisition Growth.
Since 2011, we have opened seven new service centers in previously underserved North American regions. We have acquired another ten facilities to complement our existing locations and expanded the product offering in many locations based on customer demand. Over the last two years, a significant portion of our capital expenditures have been made to expand our long and plate processing capabilities at 15 existing locations. We believe that our expanded presence in select regions and products positions us well to capture further growth in these regions and products.
5
Table of Contents
Although there can be no guarantee of growth, we believe a number of our other strategies, such as improving our product mix, pricing our products and services based on the value we provide our customers, growing our large national network, and expanding our diverse operating capabilities, will provide us with growth opportunities.
In addition, we have utilized our leadership and experience in the North American markets to establish operations in China, the largest and one of the highest growth metals markets in the world, as well as in Brazil.
Given the highly fragmented nature of the service center industry, we believe there are numerous additional opportunities to acquire businesses and incorporate them into our existing infrastructure. Given our large scale and geographic reach, we believe we can add value to these businesses in a number of ways, including providing greater purchasing power, access to additional end markets and broadening product mix. Although the Company does not have any current plans to engage in any specific acquisitions, from time to time and in the ordinary course of business, the Company regularly evaluates potential acquisition opportunities.
Lean Operating Structure Providing Operating Leverage.
Since the acquisition by Platinum, we have transformed our operating model by decentralizing our operations and reducing our cost base. Decentralization has improved our customer service by moving key functions such as procurement, credit and operations support to our regional offices. From 2007 through the end of 2009, we engaged in a number of cost reduction initiatives that included a headcount reduction of approximately 1,700, representing 33% of our workforce, and the closure of 14 redundant or underperforming facilities in North America. Furthermore, in 2011, we also completed the decentralization of credit, operations, and procurement and reduced field staffing levels. In that overall period, we believe that we have generated annual fixed cost savings of approximately $200 million since 2007. We believe this reduction has improved our operating efficiency while also providing the flexibility for further growth in our targeted markets.
We have also focused on process improvements in inventory management. Despite an increase in average inventory days from 74 days in 2011 to 86 days in 2013, our average inventory days have improved on an overall basis from 100 days in 2006. This reduction has decreased our exposure to metals price movements as well as increased capacity in our facilities to devote to higher margin products. These organizational and operating changes have improved our operating structure, working capital management and efficiency.
As a result of our initiatives, we have increased our financial flexibility and believe we have a favorable cost structure compared to many of our peers. This will provide significant operating leverage.
Extensive Breadth of Products and Services for Diverse Customer Base.
We carry a full range of over 75,000 products, including aluminum, carbon, stainless and alloy steels and a limited line of nickel and red metals. In addition, we provide a broad range of processing and fabrication services to meet the needs of our 40,000 customers and fulfill more than 1,000,000 orders per year. We also provide supply chain solutions, including just-in-time delivery, and value-added components to many original equipment manufacturers.
We believe our broad product mix and marketing approach provides customers with a “one-stop shop” solution few other service center companies are able to offer.
For the year ended December 31, 2012, no single customer accounted for more than 2% of our sales, and our top 10 customers accounted for less than 10% of sales.
6
Table of Contents
Strong Relationships with Suppliers.
We are among the largest purchasers of metals in North America and have long-term relationships with many of our North American suppliers. We believe we are frequently one of the largest customers of our suppliers and that concentrating our orders among a core group of suppliers is an effective method for obtaining favorable pricing and service. We believe we have the opportunity to further leverage this strength through continued focus on price and volume using an analytics-driven approach to procurement. In addition, we view our strategic suppliers as supply chain partners. Our coordinated effort focused on logistics, lead times, rolling schedules, and scrap return programs ultimately results in value-based buying that is advantageous for us. Metals producers worldwide are consolidating, and large, geographically diversified customers, such as Ryerson, are desirable partners for these larger suppliers. Our relationships with suppliers often provides us with access to metals when supply is constrained. Through our knowledge of the global metals marketplace and capabilities of specific mills we believe we have developed a global purchasing strategy that allows us to secure favorable prices across our product lines.
Experienced Management Team with Deep Industry Knowledge.
Our senior management team has extensive industry and operational experience and has been instrumental in optimizing and implementing our strategy in the last two years. Our senior management has an average of more than 20 years of experience in the metals or service center industries. The senior executive team’s extensive experience in international markets and outside the service center industry provides perspective to drive profitable growth.
Our CEO, Mr. Michael Arnold, joined the Company in January 2011 and has 34 years of diversified industrial experience. Mr. Edward Lehner, who has been our CFO since August 2012, has 24 years of experience predominantly in the metals industry. Under their leadership, we have increased our focus on positioning the Company for growth and enhanced profitability.
Our Strategy
Expand Margins.
We are actively pursuing strategies to achieve increased gross margins. We believe this will allow our profitability to accelerate as volumes in our industry improve. Although the first nine months of net sales in 2013 decreased by 16.3% as compared to the first nine months of net sales in 2012, we have employed and continue to employ the initiatives below, which have resulted in an increase in our gross margins as a percentage of sales, excluding LIFO expense, by over 100 basis points, from 15.7% in Q3 2012 to 16.9% in Q3 2013. We have excluded LIFO expense from the gross margin as a percentage of sales metric in order to provide a means of comparison amongst our competitors who may not use the same basis of accounting for inventories.
Optimize Product Mix. We see significant opportunities to continue to improve our margins by increasing long and plate products supplied to our customers, as long and plate products typically generate higher margins than flat products. We have established regional long product inventory to provide a broad line of stainless, aluminum, carbon and alloy long products as well as the necessary processing equipment to meet demanding requirements of these customers. In addition, over the past two years, 45% of our capital expenditures have gone toward upgrading and adding plate and long processing capabilities throughout our operational footprint. We expect to continue to optimize product mix through these initiatives.
Optimize Customer Mix. We have increased our focus on serving a diversified group of industrial customers that value our customized processing services which we price on a transaction-by-transaction basis as opposed to larger volume program account customers who typically have fixed pricing arrangements over varying time periods. Our sales to customers using transactional pricing arrangements typically generate higher margins and require less working capital investment. We have re-evaluated and re-priced many of our lower margin program accounts which has resulted in an increase in our margins, as evidenced above.
7
Table of Contents
Expand Value-added Processing Services. We seek to continue to improve our margins by complementing our products with first stage manufacturing and other processing capabilities that add value for our customers. Additionally, for certain customers we have assumed the management and responsibility for complex supply chains involving numerous suppliers, fabricators and processors. We leverage our capabilities to deliver the highest value proposition to our customers by providing a wide breadth of competitive products and services, as well as superior customer service and product quality.
Improve Supply Chain and Procurement Management. As a large purchaser of metals we continue to use analytic-driven processes to develop supply chains which lower our procured costs, shorten our lead times, improve our working capital management and decrease our exposure to commodity price fluctuations.
Improve Operating Efficiency.
We are committed to improving our operating capabilities through continuous business improvements and cost reductions. We have made, and continue to make, improvements in a variety of areas, including operations, sales, delivery, administration and working capital management. Furthermore, we continue to focus on better customer service and the hiring, retention and promotion of high performing employees as well as place greater emphasis on working capital efficiencies. In particular with respect to inventory, our goal of maintaining approximately 75-80 days of sales on hand reduces our exposure to metals prices and increases capacity in facilities to devote to higher margin products. Our streamlined organizational structure combines local decision making with regional and national sourcing to improve efficiency.
Pursue Profitable Growth Through Expansion and Value-Accretive Acquisitions.
We are focused on increasing our sales to existing customers, as well as expanding our customer base globally, but there can be no guarantee we will be able to expand. We expect to continue increasing revenue through a variety of sales initiatives and by targeting attractive markets.
In North America, we have expanded and continue to expand in markets that we believe are underserved. We opened seven new facilities since 2011 in Texas, Georgia, Iowa, Illinois, Utah and Mexico, and have expanded higher-margin plate fabrication or long-product capabilities at many existing locations, where we have observed an opportunity to generate attractive returns. We are continuously monitoring opportunities for further expansion across the United States, Canada and Mexico. We expect to leverage our expertise in North America and selectively expand our business in China and Brazil as well as additional high growth emerging markets.
Since 2010, we have completed five strategic acquisitions: Texas Steel Processing Inc., SFI-Gray Steel Inc., Singer Steel Company, Turret Steel and Açofran Aços e Metais Ltda. These acquisitions have provided various opportunities for long-term value creation through the expansion of our product and service capabilities, geographic reach, operational distribution network, end markets diversification, cross-selling opportunities and the addition of transactional-based customers. Although the Company does not have any current plans to engage in any specific acquisitions, we regularly evaluate potential acquisitions of service center companies that complement our existing customer base and product offerings, and plan to continue pursuing our disciplined approach to such acquisitions.
Maintain Flexible Capital Structure and Strong Liquidity Position.
Our management team is focused on maintaining a strong level of liquidity that will facilitate our plans to execute our various growth strategies. Throughout the economic downturn, we maintained liquidity in excess of $300 million. Liquidity as of September 30, 2013 was approximately $423 million, comprised of $319 million of availability under Ryerson’s senior secured $1.35 billion asset-based revolving credit facility and foreign debt facilities, and $104 million of cash-on-hand and marketable securities. We have no financial maintenance covenants in our debt agreements unless availability under the Ryerson Credit Facility falls below $125 million.
8
Table of Contents
Substantially all of the proceeds from this offering will be used to further reduce our outstanding indebtedness. In addition, following the 2012 bond refinancing, there are no significant debt maturities until the maturity of the Ryerson Credit Facility, which occurs on the earlier of (a) April 3, 2018 or (b) August 16, 2017 (60 days prior to the scheduled maturity date of the 9% Senior Secured Notes due 2017 issued by Ryerson and its wholly owned subsidiary, Joseph T. Ryerson & Son Inc. (the “2017 Notes”)), if the 2017 Notes are then outstanding.
Risk Factors
An investment in our common stock is subject to substantial risks and uncertainties. Before investing in our common stock, you should carefully consider the following, as well as the more detailed discussion of risk factors and other information included in this prospectus:
| • | although the financial markets are in a state of recovery, the economic downturn reduced both demand for our products and metals prices; |
| • | the metals distribution business is very competitive and increased competition could reduce our gross margins and net income; |
| • | we may not be able to sustain the annual cost savings realized as part of our cost reduction initiatives; and |
| • | we may not be able to successfully consummate and complete the integration of future acquisitions, and if we are unable to do so, we may be unable to increase our growth rates. |
Recent Developments
Stock Split
On , 2013, our Board of Directors approved a for 1.00 stock split of the Company’s common stock to be effected prior to the closing of this offering. Our consolidated financial statements as of December 31, 2012 and 2011 and for the years ended December 31, 2012, 2011 and 2010 give retroactive effect to the stock split.
The Sponsor
Platinum Equity, LLC (together with its affiliates, “Platinum Equity”) is a global acquisition firm headquartered in Beverly Hills, California with principal offices in New York, Boston and London. Since its founding in 1995, Platinum Equity has completed more than 145 acquisitions in a broad range of market sectors including packaging, technology, industrials, logistics, distribution, maintenance and service. Platinum Equity’s current portfolio includes over 30 companies in a variety of different industries that serve customers around the world. Platinum Equity has a diversified capital base that includes the assets of its portfolio companies, which generated more than $15 billion in revenue in 2012, as well as capital commitments from institutional investors in private equity funds managed by the firm. Platinum Equity’s M&A&O® (Mergers & Acquisitions & Operations) approach to investing focuses on acquiring businesses that need operational support to realize their full potential and can benefit from Platinum Equity’s expertise in transition, integration and operations.
Joseph T. Ryerson & Son, Inc. (“JT Ryerson”), one of our subsidiaries, is party to a corporate advisory services agreement (the “Services Agreement”) with Platinum Advisors, an affiliate of Platinum. In connection with this offering, Platinum Advisors and JT Ryerson intend to terminate the Services Agreement, pursuant to which JT Ryerson will pay Platinum Advisors $ million as consideration for terminating the Services Agreement. We refer to this as the “Services Agreement Termination.” See “Certain Relationships and Related Party Transactions—Services Agreement.” Upon the consummation of this offering, the Company and Platinum
9
Table of Contents
will enter into an amended and restated investor rights agreement (the “Investor Rights Agreement”) which will provide, among other things, that for so long as Platinum collectively beneficially owns (i) at least 30% of the voting power of the outstanding capital stock of the Company, Platinum will have the right to nominate for election to the board of directors of the Company no fewer than that number of directors that would constitute a majority of the number of directors if there were no vacancies on the board, (ii) at least 15% but less than 30% of the voting power of the outstanding capital stock of the Company, Platinum will have the right to nominate two directors and (iii) at least 5% but less than 15% of the voting power of the outstanding capital stock of the Company, Platinum will have the right to nominate one director. For additional information with respect to Platinum’s rights pursuant to the Investor Rights Agreement, see “Certain Relationships and Related Party Transactions—Investor Rights Agreement.”
10
Table of Contents
Corporate Structure
Our current corporate structure is made up as follows: Ryerson Holding, the issuer of the common stock offered hereby, owns all of the common stock of Ryerson Inc. and all of the membership interests of Rhombus JV Holdings, LLC. Ryerson Inc. owns, directly or indirectly, all of the common stock of the following entities: JT Ryerson; Ryerson Americas, Inc.; Ryerson International, Inc.; Ryerson Pan-Pacific LLC; J.M. Tull Metals Company, Inc.; RdM Holdings, Inc.; RCJV Holdings, Inc.; Ryerson Procurement Corporation; Ryerson International Material Management Services, Inc.; Ryerson International Trading, Inc.; Ryerson Canada, Inc.; Ryerson Metals de Mexico, S. de R.L. de C.V.; 862809 Ontario, Inc.; Leets Assurance, Ltd.; Integris Metals Mexicana, S.A. de C.V.; Servicios Empresariales Ryerson Tull, S.A. de C.V.; Servicios Corporativos RIM, S.A. de C.V.; Turret Holding Corporation; Turret Steel Industries, Inc.; Turret Steel Canada, ULC; Sunbelt-Turret Steel, Inc.; Ryerson Brasil Participacoes Ltda; Ryerson Holdings (Brazil), LLC; EPE LLC; Ryerson Canada Finance ULC; Imperial Trucking Company, LLC; Wilcox-Turret Cold Drawn, Inc.; and Ryerson Holdings (India) Pte Ltd. Platinum currently owns 99% of the capital stock of Ryerson Holding and will own approximately % of the capital stock following this offering. The chart below illustrates in summary form our material operating subsidiaries.
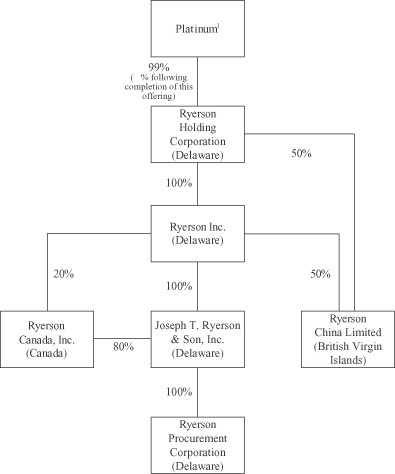
| 1 | Platinum refers to the following entities: Platinum Equity Capital Partners, L.P.; Platinum Equity Capital Partners-PF, L.P.; Platinum Equity Capital Partners-A, L.P.; Platinum Equity Capital Partners II, L.P.; Platinum Equity Capital Partners-PF II, L.P.; Platinum Equity Capital Partners-A II, L.P.; and Platinum Rhombus Principals, LLC. For additional detail regarding ownership by Platinum, see “Principal and Selling Stockholders.” |
11
Table of Contents
Corporate Information
Ryerson Holding and Ryerson Inc. are each incorporated under the laws of the State of Delaware. Ryerson Holding was formed in July 2007. Our principal executive offices are located at 227 W. Monroe, 27th Floor, Chicago, Illinois 60606. Our telephone number is (312) 292-5000.
On January 1, 2006, Ryerson Inc. changed its name from Ryerson Tull, Inc. to Ryerson Inc. On January 4, 2010, Ryerson Holding changed its name from Rhombus Holding Corporation to Ryerson Holding Corporation. Our website is located at www.ryerson.com. Our website and the information contained on the website or connected thereto will not be deemed to be incorporated into this prospectus and you should not rely on any such information in making your decision whether to purchase our securities.
12
Table of Contents
The Offering
| Issuer |
Ryerson Holding Corporation. |
| Common stock offered by us |
shares. |
| Underwriters’ over-allotment option to purchase additional common stock from the selling stockholders |
Up to shares. |
| Common stock outstanding before this offering |
5,000,000 shares. |
| Common stock to be outstanding immediately following this offering |
shares. |
| Use of proceeds |
We estimate that our net proceeds from this offering will be approximately $ million, assuming an initial public offering price of $ per share, the mid-point of the estimated initial public offering price range. |
We intend to use the net proceeds to us from this offering to (i) redeem $ in aggregate principal amount of the 11.25% Senior Notes due 2018 issued by Ryerson and its wholly owned subsidiary Joseph T. Ryerson & Son Inc. (the “2018 Notes”), (ii) repay approximately $ of the borrowings outstanding under our $1.35 billion revolving credit facility agreement that matures on the earlier of (a) April 3, 2018 or (b) August 16, 2017 (60 days prior to the scheduled maturity date of the 2017 Notes), if the 2017 Notes are then outstanding (as amended, the “Ryerson Credit Facility”), (iii) pay Platinum Advisors $ as consideration for terminating the Services Agreement, (iv) redeem up to $ in aggregate principal amount of the 9% Senior Secured Notes due 2017 issued by Ryerson and its wholly owned subsidiary Joseph T. Ryerson & Son Inc. (the “2017 Notes” and together with the 2018 Notes, the “2017 and 2018 Notes”) and (v) pay related transaction fees, expenses and premiums in connection with this offering, which we currently expect to equal approximately $22.0 million.
| If the over-allotment is exercised, we will not receive any proceeds from the sale of our common stock by the selling stockholders. |
| Risk factors |
See “Risk Factors” on page 17 of this prospectus for a discussion of factors you should carefully consider before deciding to invest in our common stock. |
| Dividend policy |
We do not anticipate declaring or paying any regular cash dividends on our common stock in the foreseeable future. Any payment of cash dividends on our common stock in the future will be at the discretion of our Board of Directors and will depend upon our results of operations, earnings, capital requirements, financial condition, future prospects, contractual restrictions, including under the Ryerson Credit Facility and our outstanding notes, and other factors deemed relevant by our Board of Directors. |
13
Table of Contents
| Proposed New York Stock Exchange symbol |
“RYI.” |
| Directed share program |
At our request, the underwriters have reserved up to 5% of the shares of common stock for sale at the initial public offering price to persons who are employees, officers, directors and other parties associated with us through a directed share program. The number of shares of common stock available for sale to the general public will be reduced by the number of directed shares purchased by participants in the program. Any directed shares not purchased will be offered by the underwriters to the general public on the same basis as all other shares of common stock offered. We have agreed to indemnify the underwriters against certain liabilities and expenses, including liabilities under the Securities Act, in connection with the sales of the directed shares. Individuals who purchase shares in excess of $1,000,000 in the directed share program will be subject to a 25-day lock-up period, except that any of our executive officers or directors or any selling stockholders who purchase shares in the directed share program will remain subject to the 180-day lock-up period from the date of this prospectus, as described in “Underwriting—No Sales of Similar Securities.” |
The number of shares to be outstanding after this offering is based on 5,000,000 shares of common stock outstanding immediately before this offering and the shares of common stock being sold by us in this offering, and assumes no exercise by the underwriters of their option to purchase shares of our common stock in this offering to cover over-allotments, if any. The number of shares to be outstanding after this offering excludes shares of common stock reserved for future grants under our stock incentive plan assuming such plan is adopted in connection with this offering.
Unless we specifically state otherwise, the information in this prospectus assumes:
| • | an initial public offering price of $ per share, the mid-point of the offering range set forth on the cover page of this prospectus; |
| • | the underwriters do not exercise their over-allotment option; and |
| • | a for 1.00 stock split that will occur prior to the closing of this offering. |
14
Table of Contents
Summary Historical Consolidated Financial and Other Data
The following table presents our summary historical consolidated financial data, as of the dates and for the periods indicated. Our summary historical consolidated statements of operations data for the years ended December 31, 2010, 2011 and 2012 and the summary historical balance sheet data as of December 31, 2011 and 2012 have been derived from our audited consolidated financial statements included elsewhere in this prospectus.
Our selected historical consolidated financial data as of September 30, 2012 and 2013 and for the nine months ended September 30, 2012 and 2013 have been derived from our unaudited consolidated financial statements included elsewhere in this prospectus. The September 30, 2012 and 2013 unaudited financial statements have been prepared on a basis consistent with our audited consolidated financial statements and reflect all adjustments, consisting of normal recurring adjustments that are, in the opinion of management, necessary for a fair presentation of the financial position and results of operations for the periods presented. The results of any interim period are not necessarily indicative of the results that may be expected for any other interim period or for the full fiscal year, and the historical results set forth below do not necessarily indicate results expected for any future period.
You should read the summary financial and other data set forth below along with the sections in this prospectus entitled “Use of Proceeds,” “Selected Consolidated Financial Data,” “Management’s Discussion and Analysis of Financial Condition and Results of Operations” and the consolidated financial statements and related notes included elsewhere in this prospectus. The share and per share information presented below has been adjusted to give effect to the for 1.00 stock split that will occur immediately prior to the closing of this offering.
| Year Ended December 31, | Nine Months Ended September 30, |
|||||||||||||||||||
| 2010 | 2011 | 2012 | 2012 | 2013 | ||||||||||||||||
| ($ in millions) | ||||||||||||||||||||
| Statements of Operations Data: |
||||||||||||||||||||
| Net sales |
$ | 3,895.5 | $ | 4,729.8 | $ | 4,024.7 | $ | 3,174.4 | $ | 2,657.8 | ||||||||||
| Cost of materials sold |
3,355.7 | 4,071.0 | 3,315.1 | 2,619.1 | 2,188.4 | |||||||||||||||
|
|
|
|
|
|
|
|
|
|
|
|||||||||||
| Gross profit |
539.8 | 658.8 | 709.6 | 555.3 | 469.4 | |||||||||||||||
| Warehousing, selling, general and administrative |
506.9 | 539.7 | 508.9 | 389.9 | 363.2 | |||||||||||||||
| Restructuring and other charges |
12.0 | 11.1 | 1.1 | — | 2.1 | |||||||||||||||
| Gain on insurance settlement |
(2.6 | ) | — | — | — | — | ||||||||||||||
| Impairment charges on fixed assets and goodwill |
1.4 | 9.3 | 1.0 | 0.9 | 8.8 | |||||||||||||||
| Pension and other postretirement benefits curtailment (gain) loss |
2.0 | — | (1.7 | ) | — | — | ||||||||||||||
|
|
|
|
|
|
|
|
|
|
|
|||||||||||
| Operating profit |
20.1 | 98.7 | 200.3 | 164.5 | 95.3 | |||||||||||||||
| Other income and (expense), net (1) |
(3.2 | ) | 4.6 | (33.5 | ) | (1.0 | ) | 2.1 | ||||||||||||
| Interest and other expense on debt (2) |
(107.5 | ) | (123.1 | ) | (126.5 | ) | (97.6 | ) | (83.3 | ) | ||||||||||
|
|
|
|
|
|
|
|
|
|
|
|||||||||||
| Income (loss) before income taxes |
(90.6 | ) | (19.8 | ) | 40.3 | 65.9 | 14.1 | |||||||||||||
| Provision (benefit) for income taxes (3) |
13.1 | (11.0 | ) | (5.5 | ) | 9.6 | 5.9 | |||||||||||||
|
|
|
|
|
|
|
|
|
|
|
|||||||||||
| Net income (loss) |
(103.7 | ) | (8.8 | ) | 45.8 | 56.3 | 8.2 | |||||||||||||
| Less: Net income (loss) attributable to noncontrolling interest |
0.3 | (0.7 | ) | (1.3 | ) | (0.7 | ) | (0.9 | ) | |||||||||||
|
|
|
|
|
|
|
|
|
|
|
|||||||||||
| Net income (loss) attributable to Ryerson Holding Corporation |
$ | (104.0 | ) | $ | (8.1 | ) | $ | 47.1 | $ | 57.0 | $ | 9.1 | ||||||||
|
|
|
|
|
|
|
|
|
|
|
|||||||||||
15
Table of Contents
| Year Ended December 31, | Nine Months Ended September 30, |
|||||||||||||||||||
| 2010 | 2011 | 2012 | 2012 | 2013 | ||||||||||||||||
| ($ in millions, except per share data) | ||||||||||||||||||||
| Earnings (loss) per share of common stock: |
||||||||||||||||||||
| Basic earnings (loss) per share |
$ | (20.80 | ) | $ | (1.62 | ) | $ | 9.41 | $ | 11.41 | $ | 1.82 | ||||||||
|
|
|
|
|
|
|
|
|
|
|
|||||||||||
| Diluted earnings (loss) per share |
$ | (20.80 | ) | $ | (1.62 | ) | $ | 9.41 | $ | 11.41 | $ | 1.82 | ||||||||
|
|
|
|
|
|
|
|
|
|
|
|||||||||||
| Weighted average shares outstanding — Basic |
5.0 | 5.0 | 5.0 | 5.0 | 5.0 | |||||||||||||||
| Weighted average shares outstanding — Diluted |
5.0 | 5.0 | 5.0 | 5.0 | 5.0 | |||||||||||||||
| Balance Sheet Data (at period end): |
||||||||||||||||||||
| Cash and cash equivalents |
$ | 62.6 | $ | 61.7 | $ | 71.2 | $ | 54.4 | $ | 81.1 | ||||||||||
| Restricted cash |
15.6 | 5.3 | 3.9 | 4.3 | 4.6 | |||||||||||||||
| Inventory |
783.4 | 732.4 | 741.5 | 779.8 | 702.8 | |||||||||||||||
| Working capital |
858.8 | 806.6 | 796.7 | 801.4 | 738.9 | |||||||||||||||
| Property, plant and equipment, net |
479.2 | 479.7 | 472.3 | 478.9 | 450.4 | |||||||||||||||
| Total assets |
2,053.5 | 2,058.4 | 1,954.1 | 2,056.4 | 1,922.5 | |||||||||||||||
| Long-term debt, including current maturities |
1,211.3 | 1,316.2 | 1,305.4 | 1,260.1 | 1,240.1 | |||||||||||||||
| Other Financial Data: |
||||||||||||||||||||
| Cash flows provided by (used in) operations |
$ | (198.7 | ) | $ | 54.5 | $ | 186.5 | $ | 86.1 | $ | 88.0 | |||||||||
| Cash flows used in investing activities |
(44.4 | ) | (115.0 | ) | (35.3 | ) | (29.5 | ) | (12.9 | ) | ||||||||||
| Cash flows provided by (used in) financing activities |
185.1 | 57.9 | (143.4 | ) | (65.5 | ) | (62.5 | ) | ||||||||||||
| Capital expenditures |
27.0 | 47.0 | 40.8 | 32.0 | 16.5 | |||||||||||||||
| Depreciation and amortization |
38.4 | 43.0 | 47.0 | 34.6 | 34.7 | |||||||||||||||
| EBITDA (4) |
55.0 | 147.0 | 215.1 | 198.8 | 133.0 | |||||||||||||||
| Adjusted EBITDA (4) |
81.1 | 174.5 | 264.7 | 212.7 | 154.7 | |||||||||||||||
| Adjusted EBITDA, excluding LIFO (4) |
133.5 | 223.1 | 201.6 | 166.3 | 128.1 | |||||||||||||||
| Ratio of Tangible Assets to Total Net Debt (5) |
1.5x | 1.4x | 1.3x | 1.4x | 1.4x | |||||||||||||||
| Volume and Per Ton Data: |
||||||||||||||||||||
| Tons shipped (000) |
2,252 | 2,433 | 2,149 | 1,671 | 1,559 | |||||||||||||||
| Average number of employees |
4,126 | 4,236 | 4,021 | 4,061 | 3,888 | |||||||||||||||
| Tons shipped per employee |
546 | 574 | 534 | 411 | 401 | |||||||||||||||
| Average selling price per ton |
$ | 1,730 | $ | 1,944 | $ | 1,873 | $ | 1,900 | $ | 1,705 | ||||||||||
| Gross profit per ton |
240 | 271 | 330 | 332 | 301 | |||||||||||||||
| Operating profit per ton |
9 | 41 | 93 | 98 | 61 | |||||||||||||||
| (1) | The year ended December 31, 2010 includes $2.6 million of foreign exchange losses related to the repayment of a long-term loan to our Canadian operations. The year ended December 31, 2011 includes a $5.8 million gain on bargain purchase related to our Singer acquisition. The year ended December 31, 2012 includes a $32.8 million loss on the redemption of the Ryerson Notes and Ryerson Holding Notes. |
| (2) | The year ended December 31, 2011 includes a $1.1 million write off of debt issuance costs associated with our prior credit facility upon entering into an amended revolving credit facility on March 14, 2011. |
| (3) | The year ended December 31, 2011 includes income tax benefits of $18.0 million relating to the purchase accounting impact of the Turret and Singer acquisitions. The year ended December 31, 2012 includes an income tax benefit of $15.2 million related to the release of valuation allowance associated with certain state deferred tax assets. |
| (4) | EBITDA, for the periods presented, represents net income before interest and other expense on debt, provision for income taxes, depreciation and amortization. Adjusted EBITDA gives further effect to, among other things, loss on retirement of debt, impairment charges on fixed assets and goodwill, reorganization expenses and the payment of management fees. We believe that the presentation of EBITDA, Adjusted EBITDA and Adjusted EBITDA, excluding LIFO expense (income) provides useful information to investors regarding our operational performance because they enhance an investor’s overall understanding of our core financial performance and provide a basis of comparison of results between current, past and future periods. We also disclose the metric Adjusted EBITDA, excluding LIFO expense (income), to provide a means of comparison amongst our competitors who may not use the same basis of accounting for inventories. EBITDA, Adjusted EBITDA and Adjusted EBITDA, excluding LIFO expense (income) are three of the primary metrics management uses for planning and forecasting in future periods, including trending and analyzing the core operating performance of our business without the effect of U.S. generally |
16
Table of Contents
| accepted accounting principles, or GAAP, expenses, revenues and gains (losses) that are unrelated to the day to day performance of our business. We also establish compensation programs for our executive management and regional employees that are based upon the achievement of pre-established EBITDA, Adjusted EBITDA and Adjusted EBITDA, excluding LIFO expense (income) targets. We also use EBITDA, Adjusted EBITDA and Adjusted EBITDA, excluding LIFO expense (income) to benchmark our operating performance to that of our competitors. EBITDA, Adjusted EBITDA and Adjusted EBITDA, excluding LIFO expense (income) do not represent, and should not be used as a substitute for, net income or cash flows from operations as determined in accordance with generally accepted accounting principles, and neither EBITDA, Adjusted EBITDA and Adjusted EBITDA, excluding LIFO expense (income) is necessarily an indication of whether cash flow will be sufficient to fund our cash requirements. Our definitions of EBITDA, Adjusted EBITDA and Adjusted EBITDA, excluding LIFO expense (income) may differ from that of other companies. Set forth below is the reconciliation of net income to EBITDA, as further adjusted to Adjusted EBITDA and Adjusted EBITDA, excluding LIFO expense (income). |
| Year Ended December 31, | Nine Months Ended September 30, |
|||||||||||||||||||
| 2010 | 2011 | 2012 | 2012 | 2013 | ||||||||||||||||
| ($ in millions) | ||||||||||||||||||||
| Net income (loss) attributable to Ryerson Holding |
$ | (104.0 | ) | $ | (8.1 | ) | $ | 47.1 | $ | 57.0 | $ | 9.1 | ||||||||
| Interest and other expense on debt |
107.5 | 123.1 | 126.5 | 97.6 | 83.3 | |||||||||||||||
| Provision (benefit) for income taxes |
13.1 | (11.0 | ) | (5.5 | ) | 9.6 | 5.9 | |||||||||||||
| Depreciation and amortization |
38.4 | 43.0 | 47.0 | 34.6 | 34.7 | |||||||||||||||
|
|
|
|
|
|
|
|
|
|
|
|||||||||||
| EBITDA |
55.0 | 147.0 | 215.1 | 198.8 | 133.0 | |||||||||||||||
| Reorganization |
19.1 | 17.8 | 5.8 | 4.7 | 8.5 | |||||||||||||||
| Advisory service fee |
5.0 | 5.0 | 5.0 | 3.8 | 3.8 | |||||||||||||||
| Loss on retirement of debt |
— | — | 32.8 | — | — | |||||||||||||||
| Foreign currency transaction (gains) losses |
2.7 | 0.8 | 1.5 | 1.6 | (1.6 | ) | ||||||||||||||
| Gain on insurance settlement |
(2.6 | ) | — | — | — | — | ||||||||||||||
| Impairment charges on fixed assets and goodwill |
1.4 | 9.3 | 1.0 | 0.9 | 8.8 | |||||||||||||||
| Gain on bargain purchase |
— | (5.8 | ) | — | — | — | ||||||||||||||
| Purchase consideration |
— | — | 4.3 | 3.5 | 2.7 | |||||||||||||||
| Other adjustments |
0.5 | 0.4 | (0.8 | ) | (0.6 | ) | (0.5 | ) | ||||||||||||
|
|
|
|
|
|
|
|
|
|
|
|||||||||||
| Adjusted EBITDA |
81.1 | 174.5 | 264.7 | 212.7 | 154.7 | |||||||||||||||
| LIFO expense (income) |
52.4 | 48.6 | (63.1 | ) | (46.4 | ) | (26.6 | ) | ||||||||||||
|
|
|
|
|
|
|
|
|
|
|
|||||||||||
| Adjusted EBITDA, excluding LIFO expense (income) |
$ | 133.5 | $ | 223.1 | $ | 201.6 | $ | 166.3 | $ | 128.1 | ||||||||||
|
|
|
|
|
|
|
|
|
|
|
|||||||||||
| (5) | The table below sets forth the inputs used for the calculations of the ratio of tangible assets to total net debt for the years ended December 31, 2010, 2011 and 2012 and nine months ended September 30, 2012 and 2013. |
| Year ended December 31, | Nine Months Ended September 30, |
|||||||||||||||||||
| 2010 | 2011 | 2012 | 2012 | 2013 | ||||||||||||||||
| ($ in millions) | ||||||||||||||||||||
| Receivables less provision for allowances, claims and doubtful accounts |
$ | 497.9 | $ | 513.9 | $ | 394.1 | $ | 484.4 | $ | 420.2 | ||||||||||
| Inventories |
783.4 | 732.4 | 741.5 | 779.8 | 702.8 | |||||||||||||||
| Assets held for sale |
14.3 | 10.0 | 3.6 | 3.7 | 4.5 | |||||||||||||||
| Property, plant and equipment, net of accumulated depreciation |
479.2 | 479.7 | 472.3 | 478.9 | 450.4 | |||||||||||||||
|
|
|
|
|
|
|
|
|
|
|
|||||||||||
| Tangible Assets |
$ | 1,774.8 | $ | 1,736.0 | $ | 1,611.5 | $ | 1,746.8 | $ | 1,577.9 | ||||||||||
|
|
|
|
|
|
|
|
|
|
|
|||||||||||
| Long-term debt, including current maturities |
$ | 1,211.3 | $ | 1,316.2 | $ | 1,305.4 | $ | 1,260.1 | $ | 1,240.1 | ||||||||||
| Less cash and cash equivalents |
(62.6 | ) | (61.7 | ) | (71.2 | ) | (54.4 | ) | (81.1 | ) | ||||||||||
|
|
|
|
|
|
|
|
|
|
|
|||||||||||
| Total Net Debt |
$ | 1,148.7 | $ | 1,254.5 | $ | 1,234.2 | $ | 1,205.7 | $ | 1,159.0 | ||||||||||
|
|
|
|
|
|
|
|
|
|
|
|||||||||||
| Ratio of Tangible Assets to Total Net Debt |
1.5x | 1.4x | 1.3x | 1.4x | 1.4x | |||||||||||||||
|
|
|
|
|
|
|
|
|
|
|
|||||||||||
17
Table of Contents
Investing in our common stock involves a high degree of risk. You should carefully consider the risks described below, together with the other information contained in this prospectus, before making your decision to invest in shares of our common stock. We cannot assure you that any of the events discussed in the risk factors below will not occur. These risks could have a material and adverse impact on our business, results of operations, financial condition and cash flows. If that were to happen, the trading price of our common stock could decline, and you could lose all or part of your investment.
Risks Relating to Our Business
We service industries that are highly cyclical, and any downturn in our customers’ industries could reduce our sales and profitability. The economic downturn has reduced demand for our products and may continue to reduce demand until an economic recovery.
Many of our products are sold to industries that experience significant fluctuations in demand based on economic conditions, energy prices, seasonality, consumer demand and other factors beyond our control. These industries include manufacturing, electrical products and transportation. We do not expect the cyclical nature of our industry to change.
The U.S. economy entered an economic recession in December 2007, which spread to many global markets in 2008 and 2009 and affected Ryerson and other metals service centers. Beginning in late 2008 and continuing through 2013, the metals industry, including Ryerson and other service centers, felt additional effects of the global economic crisis and recovery thereto and the impact of the credit market disruption. These events contributed to a rapid decline in both demand for our products and pricing levels for those products. The Company has implemented a number of actions to conserve cash, reduce costs and strengthen its competitiveness, including curtailing non-critical capital expenditures, initiating headcount reductions and reductions of certain employee benefits, among other actions. However, there can be no assurance that these actions, or any others that the Company may take in response to further deterioration in economic and financial conditions, will be sufficient.
The volatility of the market could result in a material impairment of goodwill.
We evaluate goodwill annually on October 1 and whenever events or changes in circumstances indicate potential impairment. Events or changes in circumstances that could trigger an impairment review include significant underperformance relative to our historical or projected future operating results, significant changes in the manner or the use of our assets or the strategy for our overall business, and significant negative industry or economic trends. We test for impairment of goodwill by calculating the fair value of a reporting unit using an average of an income approach based on discounted future cash flows and a market approach at the date of valuation. Under the discounted cash flow method, the fair value of each reporting unit is estimated based on expected future economic benefits discounted to a present value at a rate of return commensurate with the risk associated with the investment. Projected cash flows are discounted to present value using an estimated weighted average cost of capital, which considers both returns to equity and debt investors. Significant changes in any one of the assumptions made as part of our analysis, which could occur as a result of actual events, or further declines in the market conditions for our products, could significantly impact our impairment analysis. An impairment charge, if incurred, could be material.
The metals distribution business is very competitive and increased competition could reduce our revenues and gross margins.
The principal markets that we serve are highly competitive. The metals distribution industry is fragmented and competitive, consisting of a large number of small companies and a few relatively large companies. Competition is based principally on price, service, quality, production capabilities, inventory availability and
18
Table of Contents
timely delivery. Competition in the various markets in which we participate comes from companies of various sizes, some of which have greater financial resources than we have and some of which have more established brand names in the local markets served by us. Increased competition could reduce our market share, force us to lower our prices or to offer increased services at a higher cost, which could reduce our profitability.
The economic downturn has reduced metals prices. Though prices have risen since the onset of the economic downturn, we cannot assure you that prices will continue to rise. Changing metals prices may have a significant impact on our liquidity, net sales, gross margins, operating income and net income.
The metals industry as a whole is cyclical and, at times, pricing and availability of metal can be volatile due to numerous factors beyond our control, including general domestic and international economic conditions, labor costs, sales levels, competition, levels of inventory held by other metals service centers, consolidation of metals producers, higher raw material costs for the producers of metals, import duties and tariffs and currency exchange rates. This volatility can significantly affect the availability and cost of materials for us.
We, like many other metals service centers, maintain substantial inventories of metal to accommodate the short lead times and just-in-time delivery requirements of our customers. Accordingly, we purchase metals in an effort to maintain our inventory at levels that we believe to be appropriate to satisfy the anticipated needs of our customers based upon historic buying practices, contracts with customers and market conditions. When metals prices decline, as they did in 2008 and 2009, customer demands for lower prices and our competitors’ responses to those demands could result in lower sale prices and, consequently, lower margins as we use existing metals inventory. Notwithstanding recent price increases, metals prices may decline, and declines in those prices or further reductions in sales volumes could adversely impact our ability to maintain our liquidity and to remain in compliance with certain financial covenants under the Ryerson Credit Facility, as well as result in us incurring inventory or goodwill impairment charges. Changing metals prices therefore could significantly impact our liquidity, net sales, gross margins, operating income and net income.
We have a substantial amount of indebtedness, which could adversely affect our financial position and prevent us from fulfilling our obligations.
We currently have a substantial amount of indebtedness, including, as of September 30, 2013, $600.0 million outstanding under our 2017 Notes and $300.0 million outstanding under our 2018 Notes, and may incur additional indebtedness in the future. As of September 30, 2013, after giving effect to this offering and the application of net proceeds from this offering our total indebtedness would have been approximately $ million and we would have had approximately $ million of unused capacity under the Ryerson Credit Facility. Our substantial indebtedness may:
| • | make it difficult for us to satisfy our financial obligations, including making scheduled principal and interest payments on our outstanding notes and our other indebtedness; |
| • | limit our ability to borrow additional funds for working capital, capital expenditures, acquisitions and general corporate and other purposes; |
| • | limit our ability to use our cash flow or obtain additional financing for future working capital, capital expenditures, acquisitions or other general corporate purposes; |
| • | require us to use a substantial portion of our cash flow from operations to make debt service payments; |
| • | limit our flexibility to plan for, or react to, changes in our business and industry; |
| • | place us at a competitive disadvantage compared to our less leveraged competitors; and |
| • | increase our vulnerability to the impact of adverse economic and industry conditions. |
We may also incur additional indebtedness in the future. The terms of the Ryerson Credit Facility and the indentures governing our outstanding notes restrict but do not prohibit us from doing so, and the indebtedness incurred in compliance with these restrictions could be substantial. If new indebtedness is added to our current debt levels, the related risks that we now face could intensify.
19
Table of Contents
The covenants in the Ryerson Credit Facility and the indentures governing our outstanding notes impose, and covenants contained in agreements governing indebtedness we incur in the future may impose, restrictions that may limit our operating and financial flexibility.
The Ryerson Credit Facility and the indentures governing our outstanding notes contain a number of significant restrictions and covenants that limit our ability and the ability of our restricted subsidiaries, including Ryerson Inc., to:
| • | incur additional debt; |
| • | pay dividends on our capital stock or repurchase our capital stock; |
| • | make certain investments or other restricted payments; |
| • | create liens or use assets as security in other transactions; |
| • | merge, consolidate or transfer or dispose of substantially all of our assets; and |
| • | engage in transactions with affiliates. |
The terms of the Ryerson Credit Facility require that, in the event availability under the facility declines to a certain level, we maintain a minimum fixed charge coverage ratio at the end of each fiscal quarter. Total credit availability is limited by the amount of eligible accounts receivable and inventory pledged as collateral under the agreement insofar as the Company is subject to a borrowing base comprised of the aggregate of these two amounts, less applicable reserves. As of September 30, 2013, total credit availability was $291 million based upon eligible accounts receivable and inventory pledged as collateral.
Additionally, subject to certain exceptions, the indentures governing the outstanding notes restrict Ryerson’s ability to pay us dividends to the extent of 50% of future net income, once prior losses are offset. Future net income is defined in the indenture governing the notes as net income adjusted for, among other things, the inclusion of dividends from joint ventures actually received in cash by Ryerson, and the exclusion of: (i) all extraordinary gains or losses; (ii) a certain portion of net income allocable to minority interest in unconsolidated persons or investments in unrestricted subsidiaries; (iii) gains or losses in respect of any asset sale on an after tax basis; (iv) the net income from any disposed or discontinued operations or any net gains or losses on disposed or discontinued operations, on an after-tax basis; (v) any gain or loss realized as a result of the cumulative effect of a change in accounting principles; (vi) any fees and expenses paid in connection with the issuance of the notes; (vii) non-cash compensation expense incurred with any issuance of equity interest to an employee; and (viii) any net after-tax gains or losses attributable to the early extinguishment of debt. Our future indebtedness may contain covenants more restrictive in certain respects than the restrictions contained in the Ryerson Credit Facility and the indentures governing the notes. Operating results below current levels or other adverse factors, including a significant increase in interest rates, could result in our being unable to comply with financial covenants that are contained in the Ryerson Credit Facility or that may be contained in any future indebtedness. In addition, complying with these covenants may also cause us to take actions that are not favorable to holders of our notes and may make it more difficult for us to successfully execute our business strategy and compete against companies that are not subject to such restrictions.
We may not be able to generate sufficient cash to service all of our indebtedness.
Our ability to make payments on our indebtedness depends on our ability to generate cash in the future. Our outstanding notes, the Ryerson Credit Facility and our other outstanding indebtedness are expected to account for significant cash interest expenses. Accordingly, we will have to generate significant cash flows from operations to meet our debt service requirements. If we do not generate sufficient cash flow to meet our debt service and working capital requirements, we may be required to sell assets, seek additional capital, reduce capital expenditures, restructure or refinance all or a portion of our existing indebtedness, or seek additional financing. Moreover, insufficient cash flow may make it more difficult for us to obtain financing on terms that are acceptable to us, or at all. Furthermore, Platinum has no obligation to provide us with debt or equity financing and we therefore may be unable to generate sufficient cash to service all of our indebtedness.
20
Table of Contents
Because a portion of our indebtedness bears interest at rates that fluctuate with changes in certain prevailing short-term interest rates, we are vulnerable to interest rate increases.
A portion of our indebtedness, including the Ryerson Credit Facility, bears interest at rates that fluctuate with changes in certain short-term prevailing interest rates. As of September 30, 2013, we had approximately $318.5 million of outstanding borrowings under the Ryerson Credit Facility, with an additional $291 million available for borrowing under such facility. Assuming a consistent level of debt, a 100 basis point change in the interest rate on our floating rate debt effective from the beginning of the year would increase or decrease our interest expense under the Ryerson Credit Facility by approximately $3.6 million on an annual basis. If interest rates increase dramatically, we could be unable to service our debt which could have a material adverse effect on our business, financial condition, results of operations or cash flows.
We may not be able to successfully consummate and complete the integration of future acquisitions, and if we are unable to do so, we may be unable to increase our growth rates.
We have grown through a combination of internal expansion, acquisitions and joint ventures. We intend to continue to grow through selective acquisitions, but we may not be able to identify appropriate acquisition candidates, obtain financing on satisfactory terms, consummate acquisitions or integrate acquired businesses effectively and profitably into our existing operations. Restrictions contained in the agreements governing our notes, the Ryerson Credit Facility or our other existing or future debt may also inhibit our ability to make certain investments, including acquisitions and participations in joint ventures.
Our future success will depend on our ability to complete the integration of these future acquisitions successfully into our operations. After any acquisition, customers may choose to diversify their supply chains to reduce reliance on a single supplier for a portion of their metals needs. We may not be able to retain all of our and an acquisition’s customers, which may adversely affect our business and sales. Integrating acquisitions, particularly large acquisitions, requires us to enhance our operational and financial systems and employ additional qualified personnel, management and financial resources, and may adversely affect our business by diverting management away from day-to-day operations. Further, failure to successfully integrate acquisitions may adversely affect our profitability by creating significant operating inefficiencies that could increase our operating expenses as a percentage of sales and reduce our operating income. In addition, we may not realize expected cost savings from acquisitions, which may also adversely affect our profitability.
We may not be able to retain or expand our customer base if the North American manufacturing industry continues to erode through moving offshore or through acquisition and merger or consolidation activity in our customers’ industries.
Our customer base primarily includes manufacturing and industrial firms. Some of our customers operate in industries that are undergoing consolidation through acquisition and merger activity; some are considering or have considered relocating production operations overseas or outsourcing particular functions overseas; and some customers have closed as they were unable to compete successfully with overseas competitors. Our facilities are predominately located in the United States and Canada. To the extent that our customers cease U.S. operations, relocate or move operations overseas to regions in which we do not have a presence, we could lose their business. Acquirers of manufacturing and industrial firms may have suppliers of choice that do not include us, which could impact our customer base and market share.
Certain of our operations are located outside of the United States, which subjects us to risks associated with international activities.
Certain of our operations are located outside of the United States, primarily in Canada, China, Mexico and Brazil. We are subject to the Foreign Corrupt Practices Act (“FCPA”), which generally prohibits U.S. companies and their intermediaries from making corrupt payments or otherwise corruptly giving any other thing of value to
21
Table of Contents
foreign officials for the purpose of obtaining or keeping business or otherwise obtaining favorable treatment, and requires companies to maintain adequate record-keeping and internal accounting practices. The FCPA applies to covered companies, individual directors, officers, employees and agents. Under the FCPA, U.S. companies may be held liable for some actions taken by strategic or local partners or representatives. If we or our intermediaries fail to comply with the requirements of the FCPA, governmental authorities in the United States could seek to impose civil and/or criminal penalties.
The Chinese government exerts substantial influence over the manner in which we must conduct our business activities, particularly with regards to the land our facilities are located on.
The Chinese government has exercised and continues to exercise substantial control over the Chinese economy through regulation and state ownership. Our ability to operate in China may be harmed by changes in its laws and regulations, including those relating to taxation, import and export tariffs, environmental regulations, land use rights, property and other matters. We believe that our operations in China are in material compliance with all applicable legal and regulatory requirements. However, the central or local governments of the jurisdictions in which we operate may impose new, stricter regulations or interpretations of existing regulations that would require additional expenditures and efforts on our part to ensure our compliance with such regulations or interpretations. Moreover, the Chinese court system does not provide the same property and contract right guarantees as do courts in the United States and, accordingly, disputes may be protracted and resolution of claims may result in significant economic loss.
Additionally, although in recent years the Chinese government has implemented measures emphasizing the utilization of market forces for economic reform, there is no private ownership of land in China and all land ownership is held by the government of China, its agencies, and collectives, which issue land use rights that are generally renewable. We lease the land where our Chinese facilities are located from the Chinese government. Although we believe our relationship with the Chinese government is sound, if the Chinese government decided to terminate our land use rights agreements, our assets could become impaired and our ability to meet customer orders could be impacted.
Operating results experience seasonal fluctuations.
A portion of our customers experience seasonal slowdowns. Our sales in the months of July, November and December traditionally have been lower than in other months because of a reduced number of shipping days and holiday or vacation closures for some customers. Consequently, our sales in the first two quarters of the year are usually higher than in the third and fourth quarters.
Damage to our information technology infrastructure could harm our business.
The unavailability of any of our computer-based systems for any significant period of time could have a material adverse effect on our operations. In particular, our ability to manage inventory levels successfully largely depends on the efficient operation of our computer hardware and software systems. We use management information systems to track inventory information at individual facilities, communicate customer information and aggregate daily sales, margin and promotional information. Difficulties associated with upgrades, installations of major software or hardware, and integration with new systems could have a material adverse effect on results of operations. We will be required to expend substantial resources to integrate our information systems with the systems of companies we have acquired. The integration of these systems may disrupt our business or lead to operating inefficiencies. In addition, these systems are vulnerable to, among other things, damage or interruption from fire, flood, tornado and other natural disasters, power loss, computer system and network failures, operator negligence, physical and electronic loss of data, or security breaches and computer viruses.
22
Table of Contents
Any significant work stoppages can harm our business.
As of September 30, 2013, we employed approximately 3,300 persons in North America, 400 persons in China, and 50 persons in Brazil. Our North American workforce was comprised of approximately 1,600 office employees and approximately 1,700 plant employees. Twenty-nine percent of our plant employees were members of various unions, including the United Steel Workers and the International Brotherhood of Teamsters. Our relationship with the various unions has generally been good.
Ten contracts covering approximately 312 persons were scheduled to expire in 2011. One of these contracts, which covered 59 employees, was not renewed due to facility closure. Eight of these contracts were successfully negotiated in 2011 and the remaining contract covering 60 employees was extended and successfully negotiated in 2012. Six contracts covering approximately 258 employees were scheduled to expire in 2012. We reached agreement on the renewal of all six contracts in 2012. One contract covering 11 employees is scheduled to expire in 2013. Negotiations are scheduled to begin in December 2013. Eight contracts covering approximately 170 employees are scheduled to expire in 2014.
Certain employee retirement benefit plans are underfunded and the actual cost of those benefits could exceed current estimates, which would require us to fund the shortfall.
As of December 31, 2012, our pension plan had an unfunded liability of $370 million. Our actual costs for benefits required to be paid may exceed those projected and future actuarial assessments to the extent that those costs exceed the current assessment. Under those circumstances, the adjustments required to be made to our recorded liability for these benefits could have a material adverse effect on our results of operations and financial condition and cash payments to fund these plans could have a material adverse effect on our cash flows. We may be required to make substantial future contributions to improve the plan’s funded status.
Future funding for postretirement employee benefits other than pensions also may require substantial payments from current cash flow.
We provide postretirement life insurance and medical benefits to eligible retired employees. Our unfunded postretirement benefit obligation as of December 31, 2012 was $130 million. Our actual costs for benefits required to be paid may exceed those projected and future actuarial assessments to the extent that those costs exceed the current assessment. Under those circumstances, adjustments will be required to be made to our recorded liability for these benefits.
Any prolonged disruption of our processing centers could harm our business.
We have dedicated processing centers that permit us to produce standardized products in large volumes while maintaining low operating costs. We may suffer prolonged disruption in the operations of any of these facilities, whether due to labor or technical difficulties, destruction or damage to any of the facilities or otherwise.
If we are unable to retain and attract management and key personnel, it may adversely affect our business.
We believe that our success is due, in part, to our experienced management team. Losing the services of one or more members of our management team could adversely affect our business and possibly prevent us from improving our operational, financial and information management systems and controls. In the future, we may need to retain and hire additional qualified sales, marketing, administrative, operating and technical personnel, and to train and manage new personnel. Our ability to implement our business plan is dependent on our ability to retain and hire a large number of qualified employees each year.
23
Table of Contents
Our existing international operations and potential joint ventures may cause us to incur costs and risks that may distract management from effectively operating our North American business, and such operations or joint ventures may not be profitable.
We maintain foreign operations in Canada, China, Mexico and Brazil. International operations are subject to certain risks inherent in conducting business in, and with, foreign countries, including price controls, exchange controls, export controls, economic sanctions, duties, tariffs, limitations on participation in local enterprises, nationalization, expropriation and other governmental action, and changes in currency exchange rates. While we believe that our current arrangements with local partners provide us with experienced business partners in foreign countries, events or issues, including disagreements with our partners, may occur that require attention of our senior executives and may result in expenses or losses that erode the profitability of our foreign operations or cause our capital investments abroad to be unprofitable.
Lead time and the cost of our products could increase if we were to lose one of our primary suppliers.
If, for any reason, our primary suppliers of aluminum, carbon steel, stainless steel or other metals should curtail or discontinue their delivery of such metals in the quantities needed and at prices that are competitive, our business could suffer. The number of available suppliers could be reduced by factors such as industry consolidation and bankruptcies affecting steel and metal producers. For the year ended December 31, 2012, our top 25 suppliers represented approximately 75% of our purchases. We could be significantly and adversely affected if delivery were disrupted from a major supplier. If, in the future, we were unable to obtain sufficient amounts of the necessary metals at competitive prices and on a timely basis from our traditional suppliers, we may not be able to obtain such metals from alternative sources at competitive prices to meet our delivery schedules, which could have a material adverse effect on our sales and profitability.
We could incur substantial costs related to environmental, health and safety laws.
Our operations are subject to increasingly stringent environmental, health and safety laws. These include laws that impose limitations on the discharge of pollutants into the air and water and establish standards for the treatment, storage and disposal of regulated materials and the investigation and remediation of contaminated soil, surface water and groundwater. Failure to maintain or achieve compliance with these laws or with the permits required for our operations could result in substantial increases in operating costs and capital expenditures. In addition, we may be subject to fines and civil or criminal sanctions, third party claims for property damage or personal injury, worker’s compensation or personal injury claims, cleanup costs or temporary or permanent discontinuance of operations. Certain of our facilities are located in industrial areas, have a history of heavy industrial use and have been in operation for many years and, over time, we and other predecessor operators of these facilities have generated, used, handled and disposed of hazardous and other regulated wastes. Environmental liabilities could exist, including cleanup obligations at these facilities or at off-site locations where materials from our operations were disposed of, which could result in future expenditures that cannot be currently quantified and which could have a material adverse effect on our financial position, results of operations or cash flows. Such liabilities may be imposed without regard to fault or the legality of a party’s conduct and may, in certain circumstances, be joint and several. Future changes to environmental, health and safety laws, including those related to climate change, could result in material liabilities and costs, constrain operations or make such operations more costly for us, our suppliers and our customers. In October 2011, the United States Environmental Protection Agency named us as one of more than 100 businesses that may be a potentially responsible party for the Portland Harbor Superfund Site. We do not currently have sufficient information available to us to determine the total cost of any required investigation or remediation of the Portland Harbor site and, therefore, management cannot predict the ultimate outcome of this matter or estimate a range of potential loss at this time.
24
Table of Contents
New regulations related to conflict-free minerals may force us to incur additional expenses and place us at a competitive disadvantage.
On August 22, 2012, under the Dodd-Frank Wall Street Reform and Consumer Protection Act of 2010 (the “Dodd-Frank Act”), the SEC adopted new requirements for reporting companies that use certain minerals and metals, known as “conflict minerals”, in their products, whether or not these products are manufactured by third parties. These requirements will require companies to diligence, disclose and report whether or not such minerals originate from the Democratic Republic of Congo and adjoining countries. Since our supply chain is complex, we may not be able to conclusively verify the origins for all metals used in our products and we may face reputational challenges with our customers. Additionally, as there may be only a limited number of suppliers offering “conflict free” metals, we cannot be sure that we will be able to obtain necessary metals from such suppliers in sufficient quantities or at competitive prices. Accordingly, we could incur significant cost related to the compliance process, including potential difficulty or added costs in satisfying the disclosure requirements. Moreover, we may encounter challenges to satisfy those customers who require that all of the components of our products be certified as conflict free which could place us at a competitive disadvantage if we are unable to do so.
We are subject to litigation that could strain our resources and distract management.
From time to time, we are involved in a variety of claims, lawsuits and other disputes arising in the ordinary course of business. These suits concern issues including product liability, contract disputes, employee-related matters and personal injury matters. It is not feasible to predict the outcome of all pending suits and claims, and the ultimate resolution of these matters as well as future lawsuits could have a material adverse effect on our business, financial condition, results of operations or cash flows or reputation.
We may face product liability claims that are costly and create adverse publicity.
If any of the products that we sell cause harm to any of our customers, we could be exposed to product liability lawsuits. If we were found liable under product liability claims, we could be required to pay substantial monetary damages. Further, even if we successfully defended ourself against this type of claim, we could be forced to spend a substantial amount of money in litigation expenses, our management could be required to spend valuable time in the defense against these claims and our reputation could suffer.
Our ability to use our net operating loss carryforwards and certain other tax attributes may be limited.
As of September 30, 2013, we had U.S. federal net operating loss carryforwards totaling approximately $162 million, which expire between December 31, 2030 and December 31, 2031. Under Section 382 of the Internal Revenue Code of 1986, as amended, if a corporation undergoes an “ownership change,” the corporation’s ability to use its pre-change net operating loss carryforwards and certain other pre-change tax attributes to offset its post-change income may be limited significantly. In general, an “ownership change” will occur if there is a cumulative change in our ownership by “5-percent shareholders” that exceeds 50 percentage points over a rolling three-year period. It is not expected that the offering will result in an “ownership change.” However, because the potential existence and amount of our “5-percent shareholders,” if any, resulting from the offering is not within our control, there is no assurance that the offering will not result in an ownership change. Moreover, even if an ownership change does not result from the offering, subsequent events over which we will have little or no control (including changes in the direct and indirect ownership of our 5-percent shareholders) may cause us to experience an ownership change in the near future. An ownership change could significantly limit the future use of our pre-change tax attributes and thereby significantly increase our future tax liabilities.
25
Table of Contents
Our risk management strategies may result in losses.
From time to time, we may use fixed-price and/or fixed-volume supplier contracts to offset contracts with customers. Additionally, we may use foreign exchange contracts and interest rate swaps to hedge Canadian dollar and floating rate debt exposures. These risk management strategies pose certain risks, including the risk that losses on a hedge position may exceed the amount invested in such instruments. Moreover, a party in a hedging transaction may be unavailable or unwilling to settle our obligations, which could cause us to suffer corresponding losses. A hedging instrument may not be effective in eliminating all of the risks inherent in any particular position. Our profitability may be adversely affected during any period as a result of use of such instruments.
We may be adversely affected by currency fluctuations in the U.S. dollar versus the Canadian dollar and the Chinese renminbi.
We have significant operations in Canada which incur the majority of their metal supply costs in U.S. dollars but earn the majority of their sales in Canadian dollars. Additionally, we have significant assets in China. We may from time to time experience losses when the value of the U.S. dollar strengthens against the Canadian dollar or the Chinese renminbi, which could have a material adverse effect on our results of operations. In addition, we will be subject to translation risk when we consolidate our Canadian and Chinese subsidiaries’ net assets into our balance sheet. Fluctuations in the value of the U.S. dollar versus the Canadian dollar or Chinese renminbi could reduce the value of these assets as reported in our financial statements, which could, as a result, reduce our stockholders’ equity.
Risks Relating to Our Common Stock and this Offering
There is no existing market for our common stock, and we do not know if one will develop to provide you with adequate liquidity.
Prior to this offering, there has not been a public market for our common stock. We cannot predict the extent to which investor interest in our company will lead to the development of an active trading market on the New York Stock Exchange (“NYSE”), or otherwise, or how liquid that market might become. If an active trading market does not develop, you may have difficulty selling any of our common stock that you buy in this offering. Consequently, you may not be able to sell our common stock at prices equal to or greater than the price you paid in this offering. In addition, an inactive trading market may impair our ability to raise additional capital by selling shares and may impair our ability to acquire other companies by using our shares as consideration.
The initial public offering price of the shares has been determined by negotiations between the Company and the representative of the underwriters. Among the factors considered in determining the initial public offering price were our record of operations, our current financial condition, our future prospects, our markets, the economic conditions in and future prospects for the industry in which we compete, our management, and currently prevailing general conditions in the equity securities markets, including current market valuations of publicly traded companies considered comparable to our company. We cannot assure you, however, that the prices at which the shares will sell in the public market after this offering will not be lower than the initial public offering price or that an active trading market in our common stock will develop and continue after this offering.
Our stock price may be volatile, and your investment in our common stock could suffer a decline in value.
The stock markets have experienced extreme price and volume fluctuations that have affected and continue to affect the market prices of equity securities of many companies. These fluctuations have often been unrelated or disproportionate to the operating performance of those companies. These broad market and industry fluctuations, as well as general economic, political and market conditions such as recessions, interest rate changes or international currency fluctuations, may negatively affect the market price of our common stock. The
26
Table of Contents
initial public offering price for our common stock was determined by negotiations between the Company and the representative of the underwriters and may not be indicative of prices that will prevail in the open market following this offering. You may not be able to resell your shares at or above the initial public offering price due to fluctuations in the market price of our common stock caused by changes in our operating performance or prospects, including possible changes due to the cyclical nature of the metals distribution industry and other factors such as fluctuations in metals prices, which could cause short-term swings in profit margins. If the market price of our ordinary shares after this offering does not exceed the initial public offering price, you may not realize any return on your investment in us and may lose some or all of your investment. In addition, companies that have historically experienced volatility in the market price of their stock have been subject to securities class action litigation. We may be the target of this type of litigation in the future. Securities litigation against us could result in substantial costs and divert our management’s attention from other business concerns.
Future sales of our common stock in the public market could lower our share price.
We may sell additional shares of common stock into the public markets after this offering. The market price of our common stock could decline as a result of sales of a large number of shares of our common stock in the public markets after this offering or the perception that these sales could occur. These sales, or the possibility that these sales may occur, also might make it more difficult for us to sell equity securities at a time and at a price that we deem appropriate.
After the consummation of this offering, we will have shares of common stock outstanding. Of the remaining outstanding shares, 5,000,000, or %, of our total outstanding shares will be restricted from immediate resale under the “lock-up” agreements between us and all of our directors, officers and stockholders and the underwriters described in the section entitled “Underwriting” below, but may be sold into the market after those “lock-up” restrictions expire, in certain limited circumstances as set forth in the “lock-up” agreements, or if they are waived by as the representative of the underwriters, in their discretion. The outstanding shares subject to the “lock-up” restrictions will generally become available for sale following the expiration of the lock-up agreements, which is 180 days after the date of this prospectus, subject to the volume limitations and manner-of-sale requirements under Rule 144 of the Securities Act of 1933, as amended (the “Securities Act”).
This offering will cause immediate and substantial dilution in net tangible book value.
The initial public offering price of a share of our common stock is substantially higher than the net tangible book value (deficit) per share of our outstanding common stock immediately after this offering. Net tangible book value (deficit) per share represents the amount of total tangible assets less total liabilities, divided by the number of shares of common stock outstanding. If you purchase our common stock in this offering, you will incur an immediate dilution of approximately $ in the net tangible book value per share of common stock based on our net tangible book value as of September 30, 2013. You may experience additional dilution if we issue common stock in the future. As a result of this dilution, you may receive significantly less than the full purchase price you paid for the shares in the event of a liquidation. See “Dilution.”
Our controlling stockholder and its affiliates will be able to influence matters requiring stockholder approval and could discourage the purchase of our outstanding shares at a premium.
Prior to this offering, Platinum owned 99% of our outstanding common stock. Upon completion of this offering, Platinum will continue to control all matters submitted for approval by our stockholders through its ownership of approximately % of our outstanding common stock. These matters could include the election of all of the members of our Board of Directors, amendments to our organizational documents, or the approval of any proxy contests, mergers, tender offers, sales of assets or other major corporate transactions.
Upon the consummation of this offering, the Company and Platinum will enter into an amended and restated investor rights agreement (the “Investor Rights Agreement”) which will provide, among other things, that for so
27
Table of Contents
long as Platinum collectively beneficially owns (i) at least 30% of the voting power of the outstanding capital stock of the Company, Platinum will have the right to nominate for election to the board of directors of the Company no fewer than that number of directors that would constitute a majority of the number of directors if there were no vacancies on the board, (ii) at least 15% but less than 30% of the voting power of the outstanding capital stock of the Company, Platinum will have the right to nominate two directors and (iii) at least 5% but less than 15% of the voting power of the outstanding capital stock of the Company, Platinum will have the right to nominate one director. The agreement will also provide that if the size of the board of directors is increased or decreased at any time, Platinum’s nomination rights will be proportionately increased or decreased, respectively, rounded up to the nearest whole number, except that if the board of directors increases its size within 180 days of the date of the agreement, Platinum will have the right to designate director nominees to fill each newly created directorship. As a result of Platinum’s ownership of a majority of the Company’s outstanding capital stock as well its board nomination rights pursuant to the Investor Rights Agreement as described above, Platinum will continue to be able to significantly influence or effectively control our policies and operations, including the appointment of management, future issuances of our common stock or other securities and the payment of dividends. In addition, Platinum will have significant control over our decisions to enter into any other corporate transaction. For additional information on the Investor Rights Agreement and Platinum’s rights thereunder, please see “Certain Relationships and Related Party Transactions—Investor Rights Agreement.”
The interests of Platinum may not in all cases be aligned with your interests as a holder of common stock. For example, a sale of a substantial number of shares of stock in the future by Platinum could cause our stock price to decline. Further, Platinum could cause us to make acquisitions that increase the amount of the indebtedness that is secured or senior to the Company’s existing debt or sell revenue-generating assets, impairing our ability to make payments under such debt. Additionally, Platinum is in the business of making investments in companies and may from time to time acquire and hold interests in businesses that compete directly or indirectly with us. Accordingly, Platinum may also pursue acquisition opportunities that may be complementary to our business, and as a result, those acquisition opportunities may not be available to us. In addition, Platinum may have an interest in pursuing acquisitions, divestitures and other transactions that, in their judgment, could enhance their equity investment, even though such transactions might involve risks to you as a holder of our common stock. For example, in January 2010, we closed an offering (the “Ryerson Holding Offering”) pursuant to which we issued the Ryerson Holding Notes, 96% of the gross proceeds of which were paid to Platinum as a cash dividend.
We are exempt from certain corporate governance requirements because we are a “controlled company” within the meaning of the NYSE rules and, as a result, you will not have the protections afforded by these corporate governance requirements.
Because Platinum will control more than 50% of the voting power of our common stock after this offering, we are considered to be a “controlled company” for purposes of the NYSE listing requirements. Under the NYSE rules, a “controlled company” may elect not to comply with certain NYSE corporate governance requirements, including (1) the requirement that a majority of our Board of Directors consist of independent directors, (2) the requirement that the nominating and corporate governance committee of our Board of Directors be composed entirely of independent directors, (3) the requirement that the compensation committee of our Board of Directors be composed entirely of independent directors and (4) the requirement for an annual performance evaluation of the nomination/corporate governance and compensation committees. Given that Platinum will control a majority of the voting power of our common stock after this offering, we are permitted, and have elected, to opt out of compliance with certain NYSE corporate governance requirements. Accordingly, you will not have the same protections afforded to stockholders of companies that are subject to all of the NYSE corporate governance requirements.
28
Table of Contents
We will incur increased costs and demands upon our management and other personnel as a result of complying with the laws and regulations affecting public companies, which could harm our operating results.
As a public company, we will incur significant legal, accounting and other expenses. In addition, the Sarbanes-Oxley Act, as well as related rules implemented by the SEC and the NYSE, impose various requirements on public companies. Our management and other personnel will need to devote a substantial amount of time to these compliance requirements. Although prior to October 2012 we were filing Forms 10-K and 10-Q pursuant to the terms of our then outstanding notes, these rules will increase our legal and financial compliance costs and will make certain activities more time-consuming and costly. To the extent we become an accelerated or large accelerated filer, our annual reports must also contain a statement that our independent registered public accounting firm has issued an attestation report on the effectiveness of our internal control over financial reporting.
The Sarbanes-Oxley Act requires, among other things, that we maintain effective internal control over financial reporting and disclosure controls and procedures. In particular, we will be required to perform system and process evaluation and testing of our internal control over financial reporting to allow management and our independent registered accounting firm to report on the effectiveness of our internal control over financial reporting, as required by Section 404 of the Sarbanes-Oxley Act. Our compliance with Section 404 will require that we incur substantial accounting expense and expend significant management time on compliance-related issues. If our management identifies one or more material weaknesses in our internal control over financial reporting, we will be unable to assert that our internal control over financial reporting is effective. If we are unable to assert that our internal control over financial reporting is effective, or if our independent registered public accounting firm is unable to express an opinion on the effectiveness of our internal control over financial reporting, market perception of our financial condition and the trading price of our stock may be adversely affected and customer perception of our business may suffer.
Our corporate documents and Delaware law will contain provisions that could discourage, delay or prevent a change in control of the Company.
Our amended and restated certificate of incorporation and amended and restated bylaws will contain provisions that may make the acquisition of our company more difficult without the approval of our Board of Directors. These provisions:
| • | establish a classified Board of Directors so that not all members of our Board of Directors are elected at one time; |
| • | authorize the issuance of undesignated preferred stock, the terms of which may be established and the shares of which may be issued without stockholder approval, and which may include super voting, special approval, dividend, or other rights or preferences superior to the rights of the holders of common stock; |
| • | provide that the Board of Directors is expressly authorized to make, alter, or repeal our amended and restated bylaws; |
| • | prohibit stockholders from acting by written consent if less than a majority of the voting power of our outstanding stock is controlled by Platinum; and |
| • | establish advance notice requirements for nominations for elections to our Board of Directors or for proposing matters that can be acted upon by stockholders at stockholder meetings. |
These anti-takeover provisions and other provisions under Delaware law could discourage, delay or prevent a transaction involving a change in control of our company, even if doing so would benefit our stockholders. These provisions could also discourage proxy contests and make it more difficult for you and other stockholders to elect directors of your choosing and to cause us to take other corporate actions you desire.
29
Table of Contents
Any issuance of preferred stock could make it difficult for another company to acquire us or could otherwise adversely affect holders of our common stock, which could depress the price of our common stock.
Upon completion of this offering, our Board of Directors will have the authority to issue preferred stock and to determine the preferences, limitations and relative rights of shares of preferred stock and to fix the number of shares constituting any series and the designation of such series, without any further vote or action by our stockholders. Our preferred stock could be issued with voting, liquidation, dividend and other rights superior to the rights of our common stock. The potential issuance of preferred stock may delay or prevent a change in control of us, discouraging bids for our common stock at a premium over the market price, and adversely affect the market price and the voting and other rights of the holders of our common stock.
We do not intend to pay regular cash dividends on our stock after this offering.
We do not anticipate declaring or paying regular cash dividends on our common stock or any other equity security in the foreseeable future. The amounts that may be available to us to pay cash dividends are restricted under our debt agreements. Any payment of cash dividends on our common stock in the future will be at the discretion of our Board of Directors and will depend upon our results of operations, earnings, capital requirements, financial condition, future prospects, contractual restrictions and other factors deemed relevant by our Board of Directors. Therefore, you should not rely on dividend income from shares of our common stock. For more information, see “Dividend Policy.” Your only opportunity to achieve a return on your investment in us may be if the market price of our common stock appreciates and you sell your shares at a profit but there is no guarantee that the market price for our common stock after this offering will ever exceed the price that you pay for our common stock in this offering.
30
Table of Contents
This prospectus contains “forward-looking statements.” Such statements can be identified by the use of forward-looking terminology such as “believes,” “expects,” “may,” “estimates,” “will,” “should,” “plans” or “anticipates” or the negative thereof or other variations thereon or comparable terminology, or by discussions of strategy. Readers are cautioned that any such forward-looking statements are not guarantees of future performance and may involve significant risks and uncertainties, and that actual results may vary materially from those in the forward-looking statements as a result of various factors. Among the factors that significantly impact the metals distribution industry and our business are:
| • | cyclicality of our business, due to the cyclical nature of our customers’ businesses; |
| • | impairment of goodwill that could result from, among other things, volatility in the markets in which we operate; |
| • | remaining competitive and maintaining market share in the highly fragmented metals distribution industry, in which price is a competitive tool and in which customers who purchase commodity products are often able to source metals from a variety of sources; |
| • | managing the costs of purchased metals relative to the price at which we sell our products during periods of rapid price escalation, when we may not be able to pass through pricing increases fully to our customers quickly enough to maintain desirable gross margins, or during periods of generally declining prices, when our customers may demand that price decreases be passed fully on to them more quickly than we are able to obtain similar discounts from our suppliers; |
| • | our substantial indebtedness and the covenants in instruments governing such indebtedness; |
| • | the failure to effectively integrate newly acquired operations; |
| • | regulatory and other operational risks associated with our operations located outside of the United States; |
| • | fluctuating operating results depending on seasonality; |
| • | potential damage to our information technology infrastructure; |
| • | work stoppages; |
| • | certain employee retirement benefit plans that are underfunded and the actual costs could exceed current estimates; |
| • | future funding for postretirement employee benefits may require substantial payments from current cash flow; |
| • | prolonged disruption of our processing centers; |
| • | ability to retain and attract management and key personnel; |
| • | ability of management to focus on North American and foreign operations; |
| • | termination of supplier arrangements; |
| • | the incurrence of substantial costs or liabilities to comply with, or as a result of violations of, environmental laws; |
| • | the impact of new or pending litigation against us; |
| • | a risk of product liability claims; |
| • | following this offering, a single investor group will continue to control all matters submitted for approval by our stockholders, and the interests of that single investor group may conflict with yours as a holder of our common stock; |
31
Table of Contents
| • | our risk management strategies may result in losses; |
| • | currency fluctuations in the U.S. dollar versus the Canadian dollar and the Chinese renminbi; |
| • | management of inventory and other costs and expenses; and |
| • | consolidation in the metals producer industry, from which we purchase products, which could limit our ability to effectively negotiate and manage costs of inventory or cause material shortages, either of which would impact profitability. |
These forward-looking statements involve a number of risks and uncertainties that could cause actual results to differ materially from those suggested by the forward-looking statements. Forward-looking statements should, therefore, be considered in light of various factors, including those set forth in this prospectus under “Risk Factors” and the caption “Industry and Operating Trends” included in “Management’s Discussion and Analysis of Financial Condition and Results of Operations” and elsewhere in this prospectus. Moreover, we caution you not to place undue reliance on these forward-looking statements, which speak only as of the date they were made. We do not undertake any obligation to publicly release any revisions to these forward-looking statements to reflect events or circumstances after the date of this prospectus or to reflect the occurrence of unanticipated events.
32
Table of Contents
We estimate that the net proceeds from the sale of the shares of common stock that we are offering will be approximately $ million after deducting the underwriting discount and estimated offering expenses of $ million and assuming an initial public offering price of $ per share, the mid-point of the estimated initial public offering price range. A $1.00 increase (decrease) in the assumed initial public offering price of $ per share would increase (decrease) the net proceeds from the sales of shares of common stock that we are offering by $ million after deducting the underwriting discount and estimated offering expenses of $ million.
We intend to use the net proceeds to us from this offering to (i) redeem $ in aggregate principal amount of the 11.25% Senior Notes due 2018 issued by Ryerson and its wholly owned subsidiary Joseph T. Ryerson & Son Inc. (the “2018 Notes”), (ii) repay approximately $ of the borrowings outstanding under our $1.35 billion revolving credit facility agreement that matures on the earlier of (a) April 3, 2018 or (b) August 16, 2017 (60 days prior to the scheduled maturity date of the 2017 Notes), if the 2017 Notes are then outstanding (as amended, the “Ryerson Credit Facility”), (iii) pay Platinum Advisors $ as consideration for terminating the Services Agreement, (iv) redeem up to $ in aggregate principal amount of the 9% Senior Secured Notes due 2017 issued by Ryerson and its wholly owned subsidiary Joseph T. Ryerson & Son Inc. (the “2017 Notes” and together with the 2018 Notes, the “2017 and 2018 Notes”) and (v) pay related transaction fees, expenses and premiums in connection with this offering, which we currently expect to equal approximately $22.0 million. The proceeds from the offering of the 2017 and 2018 Notes were used by us to (a) repay in full our 14 ½% Senior Discount Notes due 2015 (the “Ryerson Holding Notes”), plus accrued and unpaid interest up to, but not including, the repayment date of the Ryerson Holding Notes, (b) repay in full our Floating Rate Senior Secured Notes due November 1, 2014 (the “2014 Notes”), plus accrued and unpaid interest up to, but not including, the repayment date of the 2014 Notes, (c) repay in full our 12% Senior Secured Notes due November 1, 2015 (the “2015 Notes” and together with the 2014 Notes, the “Old Ryerson Notes”), plus accrued and unpaid interest up to, but not including, the repayment date of the 2015 Notes, (d) repay outstanding indebtedness under the Ryerson Credit Facility and (e) pay related transaction fees, expenses and premiums in connection with the offering of the 2017 and 2018 Notes.
We will not receive any proceeds resulting from any exercise by the underwriters of the over-allotment option to purchase additional shares from the selling stockholders identified in this prospectus. In the aggregate, if the over-allotment is exercised, the selling stockholders will receive approximately $ million after deducting the underwriting discount and estimated offering expenses of $ million and assuming an initial public offering price of $ per share, the mid-point of the estimated initial public offering price range.
The foregoing represents our current intentions with respect to the use and allocation of the net proceeds of this offering based upon our present plans and business conditions, but our management will have significant flexibility and discretion in applying the net proceeds. The occurrence of unforeseen events or changed business conditions could result in application of the net proceeds of this offering in a manner other than as described in this prospectus.
Pending our use of any of the net proceeds of this offering for the purposes stated above, we may invest such proceeds in investment grade, short-term, interest-bearing securities or other investments approved by our management.
33
Table of Contents
The following table sets forth our cash and cash equivalents and our total capitalization as of September 30, 2013:
| • | on a historical basis; and |
| • | on an As adjusted basis to give effect to (1) the sale of shares of our common stock offered hereby assuming an initial public offering price of $ per share, the mid-point of the estimated initial public offering price range, (2) the application of the net proceeds from this offering as described in “Use of Proceeds” and (3) the Services Agreement Termination. |
You should read this table together with the information contained in “Use of Proceeds,” “Selected Consolidated Financial Data,” “Management’s Discussion and Analysis of Financial Condition and Results of Operations” and the consolidated financial statements and related financial information contained elsewhere in this prospectus.
| As of September 30, 2013 | ||||||||
| Historical | As adjusted(1) | |||||||
| ($ in millions) | ||||||||
| Cash and cash equivalents |
$ | 81.1 | $ | 81.1 | ||||
|
|
|
|
|
|||||
| Debt: |
||||||||
| Ryerson Credit Facility(2)(3) |
318.5 | |||||||
| Ryerson Inc. 9% Senior Secured Notes due 2017 |
600.0 | |||||||
| Ryerson Inc. 11 1/4% Senior Notes due 2018 |
300.0 | |||||||
| Foreign debt |
21.6 | 21.6 | ||||||
|
|
|
|
|
|||||
| Total debt |
1,240.1 | |||||||
| Redeemable noncontrolling interest |
1.3 | 1.3 | ||||||
| Equity: |
||||||||
| Common Stock, par value $0.01 per share, 10,000,000 shares authorized, and 5,000,000 issued and outstanding; 10,000,000 shares authorized, and issued and outstanding, as adjusted(4) |
— | |||||||
| Paid-in-capital |
189.9 | |||||||
| Accumulated deficit(5) |
(225.3 | ) | ||||||
| Accumulated other comprehensive loss |
(253.5 | ) | (253.5 | ) | ||||
| Noncontrolling interest |
2.0 | 2.0 | ||||||
|
|
|
|
|
|||||
| Total stockholders’ equity (deficit) |
(286.9 | ) | ||||||
|
|
|
|
|
|||||
| Total capitalization |
$ | 954.5 | $ | |||||
|
|
|
|
|
|||||
| (1) | A $1.00 increase (decrease) in the assumed initial public offering price of $ per share would increase (decrease) total stockholders’ equity by $ million assuming the number of shares offered by us, as set forth on the cover page of this prospectus, remains the same and after deducting the underwriting discount and estimated offering expenses of $ million. |
| (2) | In connection with this offering, Platinum and JT Ryerson intend to terminate the Services Agreement, pursuant to which JT Ryerson will pay Platinum Advisors $ million as consideration for terminating the monitoring fee payable thereunder. The “As Adjusted” amount reflects the expense incurred for the payment of the termination fee. For a discussion of the Services Agreement, see “Certain Relationships and Related Party Transactions.” |
| (3) | As of October 31, 2013, we had approximately $364 million outstanding and $243 million of availability under the Ryerson Credit Facility. |
| (4) | Share amounts give effect to the for 1.00 stock split that will occur prior to the closing of this offering. |
34
Table of Contents
The number of shares of our common stock shown as issued and outstanding in the table above excludes (i) shares of our common stock that may be purchased by the underwriters to cover over-allotments and (ii) shares of common stock reserved for future grants under our stock incentive plan (assuming our stock incentive plan, which is described in “Executive Compensation—Stock Incentive Plan,” is adopted in connection with this offering).
| (5) | The “As Adjusted” amount reflects the $ million fee paid to Platinum Advisors in consideration for terminating the Services Agreement. |
35
Table of Contents
Dilution is the amount by which the offering price paid by the purchasers of our common stock to be sold in this offering will exceed the net tangible book value per share of our common stock immediately after this offering. The net tangible book value per share presented below is equal to the amount of our total tangible assets (total assets less intangible assets) less total liabilities as of September 30, 2013, divided by the number of shares of our common stock that would have been held by our common stockholders of record immediately prior to this offering after giving effect to the for 1.00 stock split. Our net tangible book value as of September 30, 2013, was approximately $ million, or $ per share. After giving effect to the sale of the shares of common stock we propose to offer pursuant to this prospectus at an assumed public offering price of $ per share, the mid-point of the range of estimated initial public offering prices set forth on the cover page of this prospectus and the application of the net proceeds therefrom, and after deducting the underwriting discount and estimated offering expenses, our net tangible book value as of September 30, 2013 would have been $ million, or $ per share. This represents an immediate dilution in net tangible book value of $ per share.
The following tables illustrate this dilution:
| Initial public offering price per share |
$ | |||||||
| Net tangible book value per share at September 30, 2013 |
$ | |||||||
| Increase in net tangible book value per share attributable to cash payments made by new investors |
||||||||
|
|
|
|
|
|||||
| Net tangible book value per share after this offering |
||||||||
|
|
|
|||||||
| Dilution of net tangible book value per share to new investors |
$ | |||||||
|
|
|
A $1.00 increase (decrease) in the assumed initial public offering price of $ per share (the mid-point of the range on the cover page of this prospectus) would (decrease) increase our net tangible book value (deficit) by $ million, the net tangible book value (deficit) per share after this offering by $ per share and the decrease in net tangible book value (deficit) to new investors in this offering by $ per share, assuming the number of shares offered by us, as set forth on the cover page of this prospectus, remains the same and after deducting the estimated underwriting discounts and commissions and estimated offering expenses.
The following table summarizes the number of shares purchased from us and the total consideration and average price per share paid to us, by existing holders of common stock, and the total number of shares purchased from the Company, the total consideration paid to the Company and the price per share paid by new investors purchasing shares in this offering:
| Shares Purchased | Total Consideration |
Average Price Per Share |
||||||||||||||||
| Number | Percent | Amount | Percent | |||||||||||||||
| (dollars in thousands, except per share amounts) | ||||||||||||||||||
| Existing holders of common stock |
% | $ | % | $ | ||||||||||||||
| Investors purchasing common stock in this offering |
||||||||||||||||||
|
|
|
|
|
|
|
|
||||||||||||
| Total |
100% | $ | 100% | $ | ||||||||||||||
If the underwriters’ over-allotment option is exercised in full:
| • | the percentage of our shares of common stock held by our existing holders of common stock will decrease to shares, or approximately % of the total number of shares of common stock outstanding after this offering; and |
| • | the number of our shares of common stock held by investors purchasing common stock in this offering will increase to shares, or approximately % of the total number of shares of common stock outstanding after this offering. |
36
Table of Contents
We have in the past paid cash dividends to our stockholders. See “Certain Relationships and Related Party Transactions—Dividend Payments.” We do not currently anticipate declaring or paying regular cash dividends on our common stock in the foreseeable future. Any payment of cash dividends on our common stock in the future will be at the discretion of our Board of Directors and will depend upon our results of operations, earnings, capital requirements, financial condition, future prospects, contractual restrictions, including restrictions contained in our existing debt documents or the terms of any of our future debt or other agreements that we may enter into from time to time, and other factors deemed relevant by our Board of Directors. See “Description of Certain Indebtedness,” and “Description of Capital Stock—Common Stock.”
37
Table of Contents
SELECTED CONSOLIDATED FINANCIAL DATA
The following table sets forth our selected historical consolidated financial information. Our selected historical consolidated statements of operations data for the years ended December 31, 2010, 2011 and 2012 and the summary historical balance sheet data as of December 31, 2011 and 2012 have been derived from our audited consolidated financial statements included elsewhere in this prospectus. The selected historical consolidated statements of operations data for the years ended December 31, 2008 and 2009 and the summary historical balance sheet data as of December 31, 2008, 2009 and 2010 were derived from the audited financial statements and related notes thereto, which are not included in this prospectus.
Our selected historical consolidated financial data as of September 30, 2012 and 2013 and for the nine months ended September 30, 2012 and 2013 have been derived from our unaudited consolidated financial statements included elsewhere in this prospectus. The September 30, 2012 and 2013 unaudited financial statements have been prepared on a basis consistent with our audited consolidated financial statements and reflect all adjustments, consisting of normal recurring adjustments that are, in the opinion of management, necessary for a fair presentation of the financial position and results of operations for the periods presented. The results of any interim period are not necessarily indicative of the results that may be expected for any other interim period or for the full fiscal year, and the historical results set forth below do not necessarily indicate results expected for any future period.
The information presented below should be read together with “Management’s Discussion and Analysis of Financial Condition and Results of Operations” and the consolidated financial statements and the notes thereto included elsewhere in this prospectus. The share and per share information presented below has been adjusted to give effect to the for 1.00 stock split that will occur prior to the closing of this offering.
| Year Ended December 31, | Nine Months Ended September 30, |
|||||||||||||||||||||||||||
| 2008 | 2009 | 2010 | 2011 | 2012 | 2012 | 2013 | ||||||||||||||||||||||
| Statements of Operations Data: |
($ in millions, except per share data) | |||||||||||||||||||||||||||
| Net sales |
$ | 5,309.8 | $ | 3,066.1 | $ | 3,895.5 | $ | 4,729.8 | $ | 4,024.7 | $ | 3,174.4 | $ | 2,657.8 | ||||||||||||||
| Cost of materials sold |
4,596.9 | 2,610.0 | 3,355.7 | 4,071.0 | 3,315.1 | 2,619.1 | 2,188.4 | |||||||||||||||||||||
|
|
|
|
|
|
|
|
|
|
|
|
|
|
|
|||||||||||||||
| Gross profit(1) |
712.9 | 456.1 | 539.8 | 658.8 | 709.6 | 555.3 | 469.4 | |||||||||||||||||||||
| Warehousing, selling, general and administrative |
586.1 | 483.8 | 506.9 | 539.7 | 508.9 | 389.9 | 363.2 | |||||||||||||||||||||
| Restructuring and other charges |
— | — | 12.0 | 11.1 | 1.1 | — | 2.1 | |||||||||||||||||||||
| Gain on insurance settlement |
— | — | (2.6 | ) | — | — | — | — | ||||||||||||||||||||
| Gain on sale of assets |
— | (3.3 | ) | — | — | — | — | — | ||||||||||||||||||||
| Impairment charges on fixed assets and goodwill |
— | 19.3 | 1.4 | 9.3 | 1.0 | 0.9 | 8.8 | |||||||||||||||||||||
| Pension and other postretirement benefits curtailment (gain) loss |
— | (2.0 | ) | 2.0 | — | (1.7 | ) | — | — | |||||||||||||||||||
|
|
|
|
|
|
|
|
|
|
|
|
|
|
|
|||||||||||||||
| Operating profit (loss) |
126.8 | (41.7 | ) | 20.1 | 98.7 | 200.3 | 164.5 | 95.3 | ||||||||||||||||||||
| Other income and (expense), net(2) |
29.2 | (10.1 | ) | (3.2 | ) | 4.6 | (33.5 | ) | (1.0 | ) | 2.1 | |||||||||||||||||
| Interest and other expense on debt(3) |
(109.9 | ) | (72.9 | ) | (107.5 | ) | (123.1 | ) | (126.5 | ) | (97.6 | ) | (83.3 | ) | ||||||||||||||
|
|
|
|
|
|
|
|
|
|
|
|
|
|
|
|||||||||||||||
| Income (loss) before income taxes |
46.1 | (124.7 | ) | (90.6 | ) | (19.8 | ) | 40.3 | 65.9 | 14.1 | ||||||||||||||||||
| Provision (benefit) for income taxes(4) |
14.8 | 67.5 | 13.1 | (11.0 | ) | (5.5 | ) | 9.6 | 5.9 | |||||||||||||||||||
|
|
|
|
|
|
|
|
|
|
|
|
|
|
|
|||||||||||||||
| Net income (loss) |
31.3 | (192.2 | ) | (103.7 | ) | (8.8 | ) | 45.8 | 56.3 | 8.2 | ||||||||||||||||||
| Less: Net income (loss) attributable to noncontrolling interest |
(1.2 | ) | (1.5 | ) | 0.3 | (0.7 | ) | (1.3 | ) | (0.7 | ) | (0.9 | ) | |||||||||||||||
|
|
|
|
|
|
|
|
|
|
|
|
|
|
|
|||||||||||||||
| Net income (loss) attributable to Ryerson Holding Corporation |
$ | 32.5 | $ | (190.7 | ) | $ | (104.0 | ) | $ | (8.1 | ) | $ | 47.1 | $ | 57.0 | $ | 9.1 | |||||||||||
|
|
|
|
|
|
|
|
|
|
|
|
|
|
|
|||||||||||||||
| Earnings (loss) per share of common stock: |
||||||||||||||||||||||||||||
| Basic: |
||||||||||||||||||||||||||||
| Basic earnings (loss) per share |
$ | 6.50 | $ | (38.14 | ) | $ | (20.80 | ) | $ | (1.62 | ) | $ | 9.41 | $ | 11.41 | $ | 1.82 | |||||||||||
|
|
|
|
|
|
|
|
|
|
|
|
|
|
|
|||||||||||||||
| Diluted: |
||||||||||||||||||||||||||||
| Diluted earnings (loss) per share |
$ | 6.50 | $ | (38.14 | ) | $ | (20.80 | ) | $ | (1.62 | ) | $ | 9.41 | $ | 11.41 | $ | 1.82 | |||||||||||
|
|
|
|
|
|
|
|
|
|
|
|
|
|
|
|||||||||||||||
| Cash dividends per common share |
$ | — | $ | 11.30 | $ | 42.76 | $ | — | $ | 7.00 | — | — | ||||||||||||||||
| Weighted average shares outstanding — Basic |
5.0 | 5.0 | 5.0 | 5.0 | 5.0 | 5.0 | 5.0 | |||||||||||||||||||||
| Weighted average shares outstanding — Diluted |
5.0 | 5.0 | 5.0 | 5.0 | 5.0 | 5.0 | 5.0 | |||||||||||||||||||||
38
Table of Contents
| Year Ended December 31, | Nine Months Ended September 30, |
|||||||||||||||||||||||||||
| 2008 | 2009 | 2010 | 2011 | 2012 | 2012 | 2013 | ||||||||||||||||||||||
| Balance Sheet Data (at period end): |
($ in millions) | |||||||||||||||||||||||||||
| Cash and cash equivalents |
$ | 130.4 | $ | 115.0 | $ | 62.6 | $ | 61.7 | $ | 71.2 | $ | 54.4 | $ | 81.1 | ||||||||||||||
| Restricted cash |
7.0 | 19.5 | 15.6 | 5.3 | 3.9 | 4.3 | 4.6 | |||||||||||||||||||||
| Inventory |
819.5 | 601.7 | 783.4 | 732.4 | 741.5 | 779.8 | 702.8 | |||||||||||||||||||||
| Working capital |
1,084.2 | 750.4 | 858.8 | 806.6 | 796.7 | 801.4 | 738.9 | |||||||||||||||||||||
| Property, plant and equipment, net |
547.7 | 477.5 | 479.2 | 479.7 | 472.3 | 478.9 | 450.4 | |||||||||||||||||||||
| Total assets |
2,281.9 | 1,775.8 | 2,053.5 | 2,058.4 | 1,954.1 | 2,056.4 | 1,922.5 | |||||||||||||||||||||
| Long-term debt, including current maturities |
1,030.3 | 754.2 | 1,211.3 | 1,316.2 | 1,305.4 | 1,260.1 | 1,240.1 | |||||||||||||||||||||
| Total equity (deficit) |
392.2 | 154.3 | (182.5 | ) | (267.6 | ) | (293.9 | ) | (198.4 | ) | (286.9 | ) | ||||||||||||||||
| Other Financial Data: |
||||||||||||||||||||||||||||
| Cash flows provided by (used in) operations |
$ | 280.5 | $ | 284.9 | $ | (198.7 | ) | $ | 54.5 | $ | 186.5 | $ | 86.1 | $ | 88.0 | |||||||||||||
| Cash flows provided by (used in) investing activities |
19.3 | 32.1 | (44.4 | ) | (115.0 | ) | (35.3 | ) | (29.5 | ) | (12.9 | ) | ||||||||||||||||
| Cash flows provided by (used in) financing activities |
(197.0 | ) | (342.4 | ) | 185.1 | 57.9 | (143.4 | ) | (65.5 | ) | (62.5 | ) | ||||||||||||||||
| Capital expenditures |
30.1 | 22.8 | 27.0 | 47.0 | 40.8 | 32.0 | 16.5 | |||||||||||||||||||||
| Depreciation and amortization |
37.6 | 36.9 | 38.4 | 43.0 | 47.0 | 34.6 | 34.7 | |||||||||||||||||||||
| Volume and Per Ton Data: |
||||||||||||||||||||||||||||
| Tons shipped (000) |
2,505 | 1,881 | 2,252 | 2,433 | 2,149 | 1,671 | 1,559 | |||||||||||||||||||||
| Average selling price per ton |
$ | 2,120 | $ | 1,630 | $ | 1,730 | $ | 1,944 | $ | 1,873 | $ | 1,900 | $ | 1,705 | ||||||||||||||
| Gross profit per ton |
285 | 242 | 240 | 271 | 330 | 332 | 301 | |||||||||||||||||||||
| Operating expenses per ton |
234 | 264 | 231 | 230 | 237 | 234 | 240 | |||||||||||||||||||||
| Operating profit (loss) per ton |
51 | (22 | ) | 9 | 41 | 93 | 98 | 61 | ||||||||||||||||||||
| (1) | The year ended December 31, 2008 includes a LIFO liquidation gain of $15.6 million, or $9.9 million after-tax. |
| (2) | The year ended December 31, 2008 includes a $18.2 million gain on the retirement of debt as well as a $6.7 million gain on the sale of corporate bonds. The year ended December 31, 2009 includes $11.8 million of foreign exchange losses related to short-term loans from our Canadian operations, offset by the recognition of a $2.7 million gain on the retirement of debt. The year ended December 31, 2010 includes $2.6 million of foreign exchange losses related to the repayment of a long-term loan to our Canadian operations. The year ended December 31, 2011 includes a $5.8 million gain on bargain purchase related to our Singer acquisition. The year ended December 31, 2012 includes a $32.8 million loss on the redemption of the Ryerson Notes and Ryerson Holding Notes. |
| (3) | The year ended December 31, 2011 includes a $1.1 million write off of debt issuance costs associated with our prior credit facility upon entering into an amended revolving credit facility on March 14, 2011. |
| (4) | The year ended December 31, 2009 includes a $92.7 million tax expense related to the establishment of a valuation allowance against the Company’s US deferred tax assets and a $14.5 million income tax charge on the sale of our joint venture in India. The year ended December 31, 2011 includes income tax benefits of $18.0 million relating to the purchase accounting impact of the Turret and Singer acquisitions. The year ended December 31, 2012 includes an income tax benefit of $15.2 million related to the release of valuation allowance associated with certain state deferred tax assets. |
39
Table of Contents
MANAGEMENT’S DISCUSSION AND ANALYSIS OF
FINANCIAL CONDITION AND RESULTS OF OPERATIONS
The following discussion and analysis should be read in conjunction with the “Selected Historical Consolidated Financial Data” and the accompanying consolidated financial statements and related notes included elsewhere in this prospectus. This discussion contains forward-looking statements that involve risks and uncertainties. See the section entitled “Forward-Looking Statements.” Our actual results and the timing of selected events could differ materially from those discussed in these forward-looking statements as a result of certain factors, including those discussed in “Risk Factors” and elsewhere in this prospectus.
Overview
Business
Ryerson Holding Corporation (“Ryerson Holding”), a Delaware corporation, is the parent company of Ryerson Inc. (“Ryerson”). Ryerson Holding is 99% owned by affiliates of Platinum.
Ryerson conducts materials distribution operations in the United States through its wholly-owned direct subsidiary Joseph T. Ryerson & Son, Inc. (“JT Ryerson”), a Delaware corporation, in Canada through its indirect wholly-owned subsidiary Ryerson Canada, Inc., a Canadian corporation (“Ryerson Canada”) and in Mexico through its indirect wholly-owned subsidiary Ryerson Metals de Mexico, S. de R.L. de C.V., a Mexican corporation (“Ryerson Mexico”). In addition to our North American operations, we conduct materials distribution operations in China through Ryerson China Limited (“Ryerson China”), a company in which we have a 100% ownership percentage and in Brazil through Açofran Aços e Metais Ltda (“Açofran”), a company in which we have had a 50% direct ownership percentage since February 17, 2012. Unless the context indicates otherwise, Ryerson Holding, Ryerson, JT Ryerson, Ryerson Canada, Ryerson China, Ryerson Mexico and Açofran together with their subsidiaries, are collectively referred to herein as “Ryerson Holding,” “we,” “us,” “our,” or the “Company.”
Industry and Operating Trends
We purchase large quantities of metal products from primary producers and sell these materials in smaller quantities to a wide variety of metals-consuming industries. More than one-half of the metals products sold are processed by us by burning, sawing, slitting, blanking, cutting to length or other techniques. We sell our products and services to many industries, including machinery manufacturers, metals fabricators, electrical machinery producers, transportation equipment manufacturers, construction, wholesale distributors, and metals mills and foundries. Revenue is recognized upon delivery of product to customers. The timing of shipment is substantially the same as the timing of delivery to customers given the proximity of our distribution sites to our customers.
Sales, cost of materials sold, gross profit and operating expense control are the principal factors that impact our profitability:
Net Sales. Our sales volume and pricing is driven by market demand, which is largely determined by overall industrial production and conditions in specific industries in which our customers operate. Sales prices are also primarily driven by market factors such as overall demand and availability of product. Our net sales include revenue from product sales, net of returns, allowances, customer discounts and incentives.
Cost of materials sold. Cost of materials sold includes metal purchase and in-bound freight costs, third-party processing costs and direct and indirect internal processing costs. The cost of materials sold fluctuates with our sales volume and our ability to purchase metals at competitive prices. Increases in sales volume generally enable us both to improve purchasing leverage with suppliers, as we buy larger quantities of metals inventories, and to reduce operating expenses per ton sold.
40
Table of Contents
Gross profit. Gross profit is the difference between net sales and the cost of materials sold. Our sales prices to our customers are subject to market competition. Achieving acceptable levels of gross profit is dependent on our acquiring metals at competitive prices, our ability to manage the impact of changing prices and efficiently managing our internal and external processing costs.
Operating expenses. Optimizing business processes and asset utilization to lower fixed expenses such as employee, facility and truck fleet costs which cannot be rapidly reduced in times of declining volume, and maintaining low fixed cost structure in times of increasing sales volume, have a significant impact on our profitability. Operating expenses include costs related to warehousing and distributing our products as well as selling, general and administrative expenses.
The metals service center industry is generally considered cyclical with periods of strong demand and higher prices followed by periods of weaker demand and lower prices due to the cyclical nature of the industries in which the largest consumers of metals operate. However, domestic metals prices are volatile and remain difficult to predict due to its commodity nature and the extent which prices are affected by interest rates, foreign exchange rates, energy prices, international supply/demand imbalances, surcharges and other factors.
Results of Operations
| Nine Months Ended September 30, 2013 |
% of Net Sales |
Nine Months Ended September 30, 2012 |
% of Net Sales |
Year Ended December 31, 2012 |
% of Net Sales |
Year Ended December 31, 2011 |
% of Net Sales |
Year Ended December 31, 2010 |
% of Net Sales |
|||||||||||||||||||||||||||||||
| Net sales |
$ | 2,657.8 | 100.0 | % | $ | 3,174.4 | 100.0 | % | $ | 4,024.7 | 100.0 | % | $ | 4,729.8 | 100.0 | % | $ | 3,895.5 | 100.0 | % | ||||||||||||||||||||
| Cost of materials sold |
2,188.4 | 82.3 | 2,619.1 | 82.5 | 3,315.1 | 82.4 | 4,071.0 | 86.1 | 3,355.7 | 86.1 | ||||||||||||||||||||||||||||||
|
|
|
|
|
|
|
|
|
|
|
|
|
|
|
|
|
|
|
|
|
|||||||||||||||||||||
| Gross profit |
469.4 | 17.7 | 555.3 | 17.5 | 709.6 | 17.6 | 658.8 | 13.9 | 539.8 | 13.9 | ||||||||||||||||||||||||||||||
| Warehousing, delivery, selling, general and administrative expenses |
363.2 | 13.7 | 389.9 | 12.3 | 508.9 | 12.6 | 539.7 | 11.4 | 506.9 | 13.0 | ||||||||||||||||||||||||||||||
| Restructuring and other charges |
2.1 | 0.1 | — | — | 1.1 | — | 11.1 | 0.2 | 12.0 | 0.3 | ||||||||||||||||||||||||||||||
| Gain on insurance settlement |
— | — | — | — | — | — | — | — | (2.6 | ) | (0.1 | ) | ||||||||||||||||||||||||||||
| Impairment charges on fixed assets and goodwill |
8.8 | 0.3 | 0.9 | — | 1.0 | — | 9.3 | 0.2 | 1.4 | 0.1 | ||||||||||||||||||||||||||||||
| Pension and other postretirement benefits curtailment (gain) loss |
— | — | — | — | (1.7 | ) | — | — | — | 2.0 | 0.1 | |||||||||||||||||||||||||||||
|
|
|
|
|
|
|
|
|
|
|
|
|
|
|
|
|
|
|
|
|
|||||||||||||||||||||
| Operating profit |
95.3 | 3.6 | 164.5 | 5.2 | 200.3 | 5.0 | 98.7 | 2.1 | 20.1 | 0.5 | ||||||||||||||||||||||||||||||
| Other expenses |
(81.2 | ) | (3.1 | ) | (98.6 | ) | (3.1 | ) | (160.0 | ) | (4.0 | ) | (118.5 | ) | (2.5 | ) | (110.7 | ) | (2.8 | ) | ||||||||||||||||||||
|
|
|
|
|
|
|
|
|
|
|
|
|
|
|
|
|
|
|
|
|
|||||||||||||||||||||
| Income (loss) before income taxes |
14.1 | 0.5 | 65.9 | 2.1 | 40.3 | 1.0 | (19.8 | ) | (0.4 | ) | (90.6 | ) | (2.3 | ) | ||||||||||||||||||||||||||
| Provision (benefit) for income taxes |
5.9 | 0.2 | 9.6 | 0.3 | (5.5 | ) | (0.1 | ) | (11.0 | ) | (0.2 | ) | 13.1 | 0.3 | ||||||||||||||||||||||||||
|
|
|
|
|
|
|
|
|
|
|
|
|
|
|
|
|
|
|
|
|
|||||||||||||||||||||
| Net income (loss) |
8.2 | 0.3 | 56.3 | 1.8 | 45.8 | 1.1 | (8.8 | ) | (0.2 | ) | (103.7 | ) | (2.6 | ) | ||||||||||||||||||||||||||
| Less: Net income (loss) attributable to noncontrolling interest |
(0.9 | ) | — | (0.7 | ) | — | (1.3 | ) | (0.1 | ) | (0.7 | ) | — | 0.3 | — | |||||||||||||||||||||||||
|
|
|
|
|
|
|
|
|
|
|
|
|
|
|
|
|
|
|
|
|
|||||||||||||||||||||
| Net income (loss) attributable to Ryerson Holding Corporation |
$ | 9.1 | 0.3 | % | $ | 57.0 | 1.8 | % | 47.1 | 1.2 | % | (8.1 | ) | (0.2 | )% | $ | (104.0 | ) | (2.6 | )% | ||||||||||||||||||||
|
|
|
|
|
|
|
|
|
|
|
|
|
|
|
|
|
|
|
|
|
|||||||||||||||||||||
| Basic and diluted earnings (loss) per share |
$ | 1.82 | $ | 11.41 | $ | 9.41 | $ | (1.62 | ) | $ | (20.80 | ) | ||||||||||||||||||||||||||||
|
|
|
|
|
|
|
|
|
|
|
|||||||||||||||||||||||||||||||
41
Table of Contents
Comparison of First Nine Months of 2013 to Nine Months of 2012
Net sales
Revenue for the first nine months of 2013 decreased 16.3% from the same period a year ago to $2,657.8 million. Average selling price and tons sold decreased across all of our product lines primarily due to weaker economic conditions in the metals market in the first nine months of 2013. Average selling price decreased 10.3% against the price levels in the first nine months of 2012 with the largest decreases in our carbon plate, stainless steel plate and stainless steel long product lines. Tons sold in the first nine months of 2013 decreased 6.7% compared to the same period a year ago with the largest decreases in shipments of aluminum plate, carbon plate and aluminum flat products.
Cost of materials sold
Cost of materials sold decreased 16.4% in the first nine months of 2013 to $2,188.4 million compared to $2,619.1 million for the same period in 2012. The decrease is primarily due to a decrease in the average cost of materials sold per ton in addition to the decrease in tons sold. The average cost of materials sold per ton decreased to $1,404 in the first nine months of 2013 from $1,568 in the first nine months of 2012. The average cost of materials sold for our carbon plate, stainless steel plate and stainless steel long product lines decreased more than our other products, in line with the relative change in average selling price per ton. During the first nine months of 2013, LIFO income was $26.6 million compared to LIFO income of $46.4 million in the first nine months of 2012.
Gross profit
Gross profit decreased by $85.9 million to $469.4 million in the first nine months of 2013. Gross profit per ton decreased to $301 per ton in the first nine months of 2013 from $332 per ton in the year-ago period due to the decrease in average selling price. Gross profit as a percent of sales in the first nine months of 2013 increased to 17.7% from 17.5% a year ago. While revenue per ton decreased in the first nine months of 2013 as compared to the first nine months of 2012, our cost of materials sold decreased at a faster pace resulting in higher gross margins.
Operating expenses
Total operating expenses decreased by $16.7 million to $374.1 million in the first nine months of 2013 from $390.8 million in the first nine months of 2012. The decrease was primarily due to lower salaries and wages of $6.3 million and lower benefit costs of $3.6 million resulting from lower employment levels, lower delivery costs of $6.2 million resulting from lower volume, lower facility expenses, primarily operating supplies and utilities, of $5.6 million, decreased bonus and commission expenses of $2.5 million and lower administrative expenses, primarily bank, audit and professional services fees, of $2.3 million, partially offset by an impairment charge on goodwill of $6.8 million, higher restructuring costs of $2.1 million related to the closure of a facility in the second quarter of 2013 and higher impairment charges on fixed assets of $1.1 million. On a per ton basis, the first nine months of 2013 operating expenses increased to $240 per ton from $234 per ton in the first nine months of 2012.
Operating profit
For the first nine months of 2013, the Company reported an operating profit of $95.3 million, or $61 per ton, compared to $164.5 million, or $98 per ton, in the first nine months of 2012, as a result of the factors discussed above.
Other expenses
Interest and other expense on debt decreased to $83.3 million in the first nine months of 2013 from $97.6 million in the first nine months of 2012, primarily due to lower interest rates after we refinanced our debt in the fourth quarter of 2012. On October 10, 2012, we issued $600 million of 9% Senior Secured Notes (the “2017 Notes”) and $300 million of 11 1/4% Senior Notes due 2018 (the “2018 Notes,” and together with the 2017 Notes the “2017 and 2018 Notes”). In connection therewith, we redeemed the Ryerson Holding Notes and Ryerson Notes. In addition, interest expense on our borrowings under the Ryerson Credit Facility was also lower in the third quarter of 2013 compared to the third quarter of 2012 primarily due to a lower level of borrowings outstanding. Other income and (expense), net was income of $2.1 million in the first nine months of 2013 as compared to expense of $1.0 million in the same period a year ago. The other income and (expense), net in both periods was primarily related to foreign currency gains or losses.
42
Table of Contents
Provision for income taxes
In the first nine months of 2013, the Company recorded income tax expense of $5.9 million compared to $9.6 million in the first nine months of 2012. The $5.9 million income tax expense in the first nine months of 2013 primarily represents foreign and U.S. state income tax expense for the period and adjustments related to our tax LIFO inventory method. The $9.6 million income tax expense in the first nine months of 2012 primarily represented foreign and U.S. state income tax expense for the period, adjustments related to our tax LIFO inventory method and changes in the valuation allowance. Due to existing U.S. federal tax loss carry forwards and a valuation allowance on related deferred tax assets, no U.S. federal income tax expense on earnings was recorded in either period. The valuation allowance was adjusted in the first nine months of 2013 and 2012 for changes in our deferred tax assets.
Noncontrolling Interest
Ryerson China’s and Açofran’s results of operations was a loss in the first nine months of 2013. Ryerson China’s results of operations was also a loss in the first nine months of 2012. The portion of the loss attributable to the noncontrolling interest in Ryerson China and Açofran was $0.9 million and $0.7 million for the nine months ended September 30, 2013 and 2012, respectively.
Earnings per share
Basic and diluted earnings per share was $1.82 in the first nine months of 2013 compared to $11.41 in the first nine months of 2012. The changes in earnings per share are due to the results of operations discussed above.
Comparison of the year ended December 31, 2011 with the year ended December 31, 2012
Net Sales
Net sales decreased 14.9% to $4.0 billion in 2012 as compared to $4.7 billion in 2011. Tons sold per ship day were 8,528 in 2012 as compared to 9,655 in 2011. Volume decreased 11.7% in 2012 reflecting our efforts to improve margins by focusing on less price sensitive transactional customers who buy in smaller quantities instead of large volume program buyers. Tons sold in 2012 decreased across all of our product lines compared to 2011 with the largest decreases in shipments of our stainless steel flat, carbon steel flat and aluminum flat product lines. The average selling price per ton decreased in 2012 to $1,873 from $1,944 in 2011 reflecting weaker market conditions compared to 2011. Average selling prices per ton decreased for most of our product lines in 2012 with the largest decrease in our stainless steel flat and stainless steel plate product lines.
Cost of Materials Sold
Cost of materials sold decreased 18.6% to $3.3 billion in 2012 compared to $4.1 billion in 2011. The decrease in cost of materials sold in 2012 compared to 2011 was primarily due to the decrease in tons sold. The average cost of materials sold per ton decreased to $1,543 in 2012 from $1,673 in 2011. The average cost of materials sold for our stainless steel plate and stainless steel flat product lines decreased more than our other products, in line with the change in average selling price per ton.
During 2012, LIFO income was $63 million related to decreases in pricing for all product lines. During 2011, LIFO expense was $49 million primarily related to increases in the cost of carbon steel.
Gross Profit
Gross profit as a percentage of sales improved to 17.6% in 2012 compared to 13.9% in 2011 for reasons discussed above. Gross profit increased 7.7% to $709.6 million in 2012 as compared to $658.8 million in 2011.
43
Table of Contents
Operating Expenses
Operating expenses as a percentage of sales increased to 12.6% in 2012 from 11.8% in 2011. Operating expenses in 2012 decreased $50.8 million from $560.1 million in 2011 primarily due to the following reasons:
| • | lower salaries and wages of $12.9 million resulting from lower employment levels, |
| • | lower incentive plan expenses of $10.4 million, |
| • | lower restructuring charges of $10.0 million, |
| • | lower impairment charges of $8.3 million, |
| • | lower delivery costs of $6.8 million due to lower volume, |
| • | lower bad debt expense of $3.7 million, and |
| • | the other postretirement benefits curtailment gain of $1.7 million in 2012. |
These changes were partially offset by:
| • | higher amortization of intangibles expense of $3.3 million in 2012 primarily due to the acquisition of Turret Steel in December of 2011. |
On a per ton basis, operating expenses increased to $237 per ton in 2012 from $230 per ton in 2011.
Operating Profit
As a result of the factors above, in 2012 we reported an operating profit of $200.3 million, or 5.0% of sales, compared to an operating profit of $98.7 million, or 2.1% of sales, in 2011.
Other Expenses
Interest and other expense on debt increased to $126.5 million in 2012 from $123.1 million in 2011, primarily due to higher interest expense related to our Ryerson Holding Notes until their redemption in October 2012 as interest expense was calculated on the outstanding principal amount, which increased as the discount was amortized, as well as higher interest rates on the Ryerson Holding Notes in 2012. The interest rate on the Ryerson Holding Notes was 15.50% from January 1, 2011 through July 31, 2011, 16.50% from August 1, 2011 through April 30, 2012 and 17.00% from May 1, 2012 until the Notes were redeemed. Partially offsetting the higher expense related to Ryerson Holding Notes was lower interest expense in the fourth quarter of 2012 due to the issuance of new notes at lower interest rates to replace the Ryerson Holding Notes and our Old Ryerson Notes.
On October 10, 2012, we issued the 2017 and 2018 Notes. In connection therewith, we redeemed the $368.7 million outstanding principal of our 2015 Notes, the $102.9 million outstanding principal of our 2014 Notes and the $344.9 million outstanding principle of our Ryerson Holding Notes. The excess of the proceeds from the issuance of the 2017 and 2018 Notes over the redemption of the Old Ryerson Notes and the Ryerson Holding Notes was used to repay borrowings on our credit facility.
Other income and (expense), net was expense of $33.5 million in 2012 as compared to income of $4.6 million in 2011. The year 2012 expense was primarily related to a $32.8 million loss on the redemption of the Old Ryerson Notes and the Ryerson Holding Notes. The year 2011 included a $5.8 million bargain purchase gain on our acquisition of Singer Steel Company (“Singer”).
Provision for Income Taxes
The Company recorded an income tax benefit of $5.5 million in 2012 compared to an income tax benefit of $11.0 million in 2011. The $5.5 million income tax benefit in 2012 primarily relates to the impact of acquisition-related elections and settlements, as well as net changes in valuation allowance. The $11.0 million income tax
44
Table of Contents
benefit in 2011 primarily relates to $18.0 million of tax benefits relating to the purchase accounting impact of the acquisitions of Singer and Turret Steel Industries Inc., Sunbelt-Turret Steel, Inc., Wilcox-Turret Cold Drawn, Inc., Imperial Trucking Company, LLC (collectively, “Turret”) net of foreign tax expense.
Noncontrolling Interest
Ryerson China’s and Açofran’s results of operations was a loss in 2012. Ryerson China’s results of operations was also a loss in 2011. The portion of the loss attributable to the noncontrolling interest in Ryerson China and Açofran was $1.3 million for 2012 and $0.7 million for 2011.
Earnings (Loss) Per Share
Basic and diluted earnings (loss) per share was $9.41 in 2012 and $(1.62) in 2011. The changes in earnings (loss) per share are due to the results of operations discussed above.
Comparison of the year ended December 31, 2010 with the year ended December 31, 2011
Net Sales
Net sales increased 21.4% to $4.7 billion in 2011 as compared to $3.9 billion in 2010. Tons sold per ship day were 9,655 in 2011 as compared to 8,972 in 2010. Volume increased 8.0% in 2011 as improvement in the manufacturing sector of the economy favorably impacted all of our product lines. The average selling price per ton increased in 2011 to $1,944 from $1,730 in 2010 reflecting the improvement in market conditions compared to 2010. Average selling prices per ton increased for all of our product lines in 2011 with the largest increase in our carbon plate and carbon long product lines.
Cost of Materials Sold
Cost of materials sold increased 21.3% to $4.1 billion in 2011 compared to $3.4 billion in 2010. The increase in cost of materials sold in 2011 compared to 2010 was primarily due to an 11.0% increase in average mill prices in 2011 along with the 8.0% increase in tons sold reflecting the improvement in the economy. The average cost of materials sold per ton increased to $1,673 in 2011 from $1,490 in 2010. The average cost of materials sold for our carbon plate and carbon long product lines increased more than our other products, in line with the change in average selling price per ton.
During 2011, LIFO expense was $49 million, primarily related to an increase in the cost of carbon steel. During 2010, LIFO expense was $52 million primarily related to increases in the costs of stainless and carbon steel.
Gross Profit
Gross profit as a percentage of sales was 13.9% in both 2011 and 2010. Gross profit increased 22.0% to $658.8 million in 2011 as compared to $539.8 million in 2010.
Operating Expenses
Operating expenses as a percentage of sales decreased to 11.8% in 2011 from 13.4% in 2010. Operating expenses in 2011 increased $40.4 million from $519.7 million in 2010 primarily due to the following reasons:
| • | higher delivery costs of $11.9 million resulting from higher volume, |
| • | higher salaries and wages of $11.8 million, |
| • | higher facility costs of $4.8 million, |
| • | higher outside consultant costs of $4.3 million, |
| • | the $11.1 million restructuring charge in 2011, |
45
Table of Contents
| • | the $9.3 million impairment charges on fixed assets and goodwill included in 2011 results, and |
| • | the gain on insurance settlement of $2.6 million in 2010. |
These changes were partially offset by:
| • | the $12.0 million restructuring and other charges along with the $2.0 million pension curtailment loss in 2010, and |
| • | the impairment charge of $1.4 million in 2010 to reduce the carrying value of certain assets to their net realizable value. |
On a per ton basis, operating expenses were $230 per ton in 2011 compared to $231 per ton in 2010.
Operating Profit
As a result of the factors above, in 2011 we reported an operating profit of $98.7 million, or 2.1% of sales, compared to an operating profit of $20.1 million, or 0.5% of sales, in 2010.
Other Expenses
Interest and other expense on debt increased to $123.1 million in 2011 from $107.5 million in 2010, primarily due to increased interest expense associated with our Ryerson Holding Notes. The Ryerson Holding Notes were issued on January 29, 2010 resulting in twelve months of interest expense in 2011 compared to eleven months in 2010. The interest rate on the Ryerson Holding Notes also increased from 14.50% at issuance to 15.50% at November 1, 2010 until July 31, 2011 and then to 16.50% at August 1, 2011. In addition, interest expense increased due to a higher level of borrowing on our credit facility and to recording a charge of $1.1 million in the first quarter of 2011 to write off debt issuance costs associated with our prior credit facility upon entering into an amended revolving credit facility. Other income and (expense), net was income of $4.6 million in 2011 as compared to expense of $3.2 million in 2010. The year 2011 included a $5.8 million bargain purchase gain on our acquisition of Singer Steel Company (“Singer”). The year 2010 was negatively impacted by $2.6 million of foreign exchange loss realized upon the repayment of a long-term loan to our Canadian operations.
Provision for Income Taxes
The Company recorded an income tax benefit of $11.0 million in 2011 compared to an income tax expense of $13.1 million in 2010. The $11.0 million income tax benefit in 2011 primarily relates to $18.0 million of tax benefits relating to the purchase accounting impact of the acquisitions of Singer and Turret Steel Industries Inc., Sunbelt-Turret Steel, Inc., Wilcox-Turret Cold Drawn, Inc., Imperial Trucking Company, LLC (collectively, “Turret”) net of foreign tax expense. The $13.1 million income tax expense in 2010 primarily relates to additional valuation allowance recorded against deferred tax assets due to changes in the deferred tax asset amounts, adjustments to reflect the filing of the Company’s 2009 federal income tax return and to foreign income tax expense.
Noncontrolling Interest
Ryerson China incurred a loss in 2011. The portion of the loss attributable to the noncontrolling interest in Ryerson China was $0.7 million for 2011. The portion of the income attributable to the noncontrolling interest in Ryerson China was $0.3 million for 2010.
Earnings (Loss) Per Share
Basic and diluted earnings (loss) per share was $(1.62) in 2011 and $(20.80) in 2010. The changes in earnings (loss) per share are due to the results of operations discussed above.
46
Table of Contents
Liquidity and Capital Resources
The Company’s primary sources of liquidity are cash and cash equivalents, cash flows from operations and borrowing availability under our $1.35 billion revolving credit facility agreement that matures on the earlier of (a) April 3, 2018 or (b) August 16, 2017 (60 days prior to the scheduled maturity of the 2017 Notes), if the 2017 Notes are then outstanding (as amended and restated, the “Ryerson Credit Facility”). Its principal source of operating cash is from the sale of metals and other materials. Its principal uses of cash are for payments associated with the procurement and processing of metals and other materials inventories, costs incurred for the warehousing and delivery of inventories and the selling and administrative costs of the business, capital expenditures, and for interest payments on debt.
The following table summarizes the Company’s cash flows:
| Year Ended December 31, | Nine Months Ended September 30, |
|||||||||||||||||||
| 2012 | 2011 | 2010 | 2013 | 2012 | ||||||||||||||||
| (In millions) | ||||||||||||||||||||
| Net cash provided by (used in) operating activities |
$ | 186.5 | $ | 54.5 | $ | (198.7 | ) | $ | 88.0 | $ | 86.1 | |||||||||
| Net cash used in investing activities |
(35.3 | ) | (115.0 | ) | (44.4 | ) | (12.9 | ) | (29.5 | ) | ||||||||||
| Net cash provided by (used in) financing activities |
(143.4 | ) | 57.9 | 185.1 | (62.5 | ) | (65.5 | ) | ||||||||||||
| Effect of exchange rates on cash |
1.7 | 1.7 | 5.6 | (2.7 | ) | 1.6 | ||||||||||||||
|
|
|
|
|
|
|
|
|
|
|
|||||||||||
| Net increase (decrease) in cash and cash equivalents |
$ | 9.5 | $ | (0.9 | ) | $ | (52.4 | ) | $ | 9.9 | $ | (7.3 | ) | |||||||
|
|
|
|
|
|
|
|
|
|
|
|||||||||||
The Company had cash and cash equivalents at September 30, 2013 of $81.1 million, compared to $71.2 million at December 31, 2012. The Company had $1,240 million and $1,305 million of total debt outstanding and a debt-to-capitalization ratio of 129% and 129% at September 30, 2013 and December 31, 2012, respectively. The Company had total liquidity (defined as cash and cash equivalents, marketable securities and availability under the Ryerson Credit Facility and foreign debt facilities) of $423 million at September 30, 2013 versus $406 million at December 31, 2012.
The Company had cash and cash equivalents at December 31, 2012 of $71.2 million, compared to $61.7 million at December 31, 2011 and $62.6 million at December 31, 2010. The Company had $1,305 million and $1,316 million of total debt outstanding, a debt-to-capitalization ratio of 129% and 125% and $293 million and $274 million available under the Ryerson Credit Facility at December 31, 2012 and 2011, respectively. The Company had total liquidity of $406 million at December 31, 2012 versus $368 million at December 31, 2011. Total liquidity is a non-GAAP financial measure. We believe that total liquidity provides additional information for measuring our ability to fund our operations. Total liquidity does not represent, and should not be used as a substitute for, net income or cash flows from operations as determined in accordance with GAAP and total liquidity is not necessarily an indication of whether cash flow will be sufficient to fund our cash requirements. At December 31, 2010, the Company had $1,211 million of total debt outstanding, a debt-to-capitalization ratio of 118%, $317 million available under the Ryerson Credit Facility, and total liquidity of $414 million.
Below is a reconciliation of cash and cash equivalents to total liquidity:
| September 30, 2013 |
December 31, 2012 |
December 31, 2011 |
December 31, 2010 |
|||||||||||||
| (In millions) |
||||||||||||||||
| Cash and cash equivalents |
$ | 81 | $ | 71 | $ | 62 | $ | 63 | ||||||||
| Marketable securities |
23 | 21 | 10 | 20 | ||||||||||||
| Availability on Ryerson Credit Facility and foreign debt facilities |
319 | 314 | 296 | 331 | ||||||||||||
|
|
|
|
|
|
|
|
|
|||||||||
| Total liquidity |
$ | 423 | $ | 406 | $ | 368 | $ | 414 | ||||||||
|
|
|
|
|
|
|
|
|
|||||||||
47
Table of Contents
Of the total cash and cash equivalents as of September 30, 2013, $59.3 million was held in subsidiaries outside the United States, which is deemed to be permanently reinvested. Ryerson does not currently foresee a need to repatriate funds from its non-U.S. subsidiaries. Although Ryerson has historically satisfied needs for more capital in the U.S. through debt or equity issuances, Ryerson could elect to repatriate funds held in foreign jurisdictions. This alternative could result in higher effective tax rates.
Net cash provided by operating activities of $88.0 million in the first nine months of 2013 was primarily due to a decrease in inventory of $36.5 million as the Company reduced inventory levels to correspond to the weaker metals market, an increase in accounts payable of $36.4 million resulting from a higher level of material purchases at the end of the third quarter of 2013 compared to year-end 2012, non-cash depreciation and amortization expense of $34.7 million, an increase in accrued liabilities of $21.4 million, non-cash impairment charges on fixed assets and goodwill of $8.8 million and net income of $8.2 million, partially offset by an increase in accounts receivable of $27.2 million resulting from higher sales levels in the first nine months of 2013 compared to year-end 2012 and pension contributions of $37.3 million. Net cash provided by operating activities of $86.1 million in the first nine months of 2012 was primarily due to net income of $56.3 million, non-cash interest amortization of $37.7 million, non-cash depreciation and amortization expense of $34.6 million, and a decrease in accounts receivable of $32.3 million resulting from lower sales levels in the third quarter of 2012, partially offset by an increase in inventory of $43.2 million and pension contributions of $39.3 million.
During the years ended December 31, 2012 and 2011, net cash provided by operating activities was $186.5 million and $54.5 million, respectively. During the year ended December 31, 2010, net cash used by operating activities was $198.7 million. Net income (loss) was $45.8 million, $(8.8) million and $(103.7) million for the years ended December 31, 2012, 2011 and 2010, respectively. In addition to the net income in 2012, cash provided by operating activities of $186.5 million during the year ended December 31, 2012 was primarily the result of a decrease in accounts receivable of $120.8 million reflecting lower volume in 2012, non-cash depreciation and amortization expense of $47.0 million and non-cash interest amortization of $39.0 million, partially offset by pension contributions of $45.9 million and a decrease in accounts payable of $38.3 million. Cash provided by operating activities was $54.5 million during the year ended December 31, 2011 and was primarily the result of a decrease in inventories of $92.9 million resulting from increased sales, partially offset by a decrease in accounts payable of $71.7 million. Cash used by operating activities was $198.7 million during the year ended December 31, 2010 and was primarily the result of an increase in inventories of $170.9 million resulting from higher inventory purchases to support increased sales levels, an increase in accounts receivable of $137.5 million reflecting higher sales levels, partially offset by an increase in accounts payable of $102.3 million.
Net cash used in investing activities for the first nine months of 2013 was $12.9 million compared to $29.5 million for the first nine months of 2012. Capital expenditures during the first nine months of 2013 totaled $16.5 million compared to $32.0 million in the first nine months of 2012. The Company sold property, plant and equipment and assets held for sale generating cash proceeds of $4.3 million and $8.5 million during the first nine months of 2013 and 2012, respectively.
Net cash used by investing activities was $35.3 million, $115.0 million and $44.4 million in 2012, 2011 and 2010, respectively. Capital expenditures for the years ended December 31, 2012, 2011 and 2010 were $40.8 million, $47.0 million and $27.0 million, respectively. The Company sold property, plant and equipment and assets held for sale generating cash proceeds of $11.6 million, $11.3 million and $5.5 million during the years ended December 31, 2012, 2011 and 2010, respectively. In 2012, 2011 and 2010, the Company made several acquisitions, resulting in cash outflows of $5.1 million, $95.2 million and $12.0 million, respectively.
Net cash used by financing activities in the first nine months of 2013 was $62.5 million compared to $65.5 million in the first nine months of 2012. Net cash used by financing activities in the first nine months of 2013 was primarily related to repayments on credit facility borrowings as a result of the net cash provided by operating activities discussed above. Net cash used by financing activities in the first nine months of 2012 was primarily related to repayments on credit facility borrowings as a result of the net income for the first nine months of 2012.
48
Table of Contents
Net cash used in financing activities was $143.4 million for the year ended December 31, 2012, primarily due to the redemption of the Old Ryerson Notes and the Ryerson Holding Notes for $829.5 million, a distribution of $35.0 million to Platinum, repayment of credit facility borrowings for $149.0 million, and the payment of $18.1 million in fees related to the issuance of the 2017 and 2018 Notes, partially offset by the issuance of the 2017 and 2018 Notes for $900.0 million. The $149.0 million reduction in credit facility borrowings was primarily due to the $186.5 million of net cash provided by operating activities and excess proceeds from the issuance of the 2017 and 2018 Notes over the redemption of the Old Ryerson Notes and the Ryerson Holding Notes, partially offset by the capital spending of $40.8 million and the distribution of $35.0 million to Platinum. Net cash provided by financing activities was $57.9 million for the year ended December 31, 2011, primarily related to increased credit facility borrowings to finance accounts receivable and inventory to support increased sales levels in 2011. Net cash provided by financing activities was $185.1 million for the year ended December 31, 2010, primarily related to the issuance of the Ryerson Holding Notes and increased credit facility borrowings to finance accounts receivable and inventory to support increased sales levels in 2010, offset by a $213.8 million distribution made to our stockholders. We also acquired Van Shung Chong Holdings Limited’s (“VSC”), our former joint venture partner, remaining 20 percent ownership in Ryerson China for $17.5 million in 2010.
We believe that cash flow from operations and proceeds from the Ryerson Credit Facility will provide sufficient funds to meet our contractual obligations and operating requirements in the normal course of business.
As a result of net cash provided by operating activities, total debt in the condensed consolidated balance sheet decreased to $1,240.1 million at September 30, 2013 from $1,305.4 million at December 31, 2012.
Total debt outstanding as of September 30, 2013 consisted of the following amounts: $318.5 million borrowing under the Ryerson Credit Facility, $600.0 million under the 2017 Notes, $300.0 million under the 2018 Notes, and $21.6 million of foreign debt. Availability at September 30, 2013 and December 31, 2012 under the Ryerson Credit Facility was $291 million and $293 million, respectively. Discussion of our outstanding debt follows.
Ryerson Credit Facility
On April 3, 2013, Ryerson amended and restated its $1.35 billion revolving credit facility agreement (as amended and restated, the “Ryerson Credit Facility”) to, among other things, extend the maturity date to the earlier of (a) April 3, 2018 and (b) August 16, 2017 (60 days prior to the scheduled maturity date of the 9% Senior Secured Notes due October 15, 2017 (“2017 Notes”)), if the 2017 Notes are then outstanding. At September 30, 2013, Ryerson had $318.5 million of outstanding borrowings, $24 million of letters of credit issued and $291 million available under the $1.35 billion Ryerson Credit Facility compared to $383.5 million of outstanding borrowings, $24 million of letters of credit issued and $293 million available at December 31, 2012. Total credit availability is limited by the amount of eligible accounts receivable and inventory pledged as collateral under the agreement insofar as Ryerson is subject to a borrowing base comprised of the aggregate of these two amounts, less applicable reserves. Eligible accounts receivable, at any date of determination, are comprised of the aggregate value of all accounts directly created by a borrower in the ordinary course of business arising out of the sale of goods or the rendition of services, each of which has been invoiced, with such receivables adjusted to exclude various ineligible accounts, including, among other things, those to which a borrower does not have sole and absolute title and accounts arising out of a sale to an employee, officer, director, or affiliate of a borrower. Eligible inventory, at any date of determination, is comprised of the aggregate value of all inventory owned by a borrower, with such inventory adjusted to exclude various ineligible inventory, including, among other things, any inventory that is classified as “supplies” or is unsaleable in the ordinary course of business and 50% of the value of any inventory that (i) has not been sold or processed within a 180 day period and (ii) is calculated to have more than 365 days of supply based upon the immediately preceding 6 months consumption. The weighted average interest rate on the borrowings under the Ryerson Credit Facility was 1.9 percent and 2.6 percent at September 30, 2013 and December 31, 2012, respectively.
49
Table of Contents
The total $1.35 billion revolving credit facility has an allocation of $1.215 billion to Ryerson’s subsidiaries in the United States and an allocation of $135 million to Ryerson Canada. Amounts outstanding under the U.S. facility bear interest at a rate determined by reference to the base rate (Bank of America’s prime rate) or a LIBOR rate or, for the Canadian facility a rate determined by reference to the Canadian base rate (Bank of America-Canada Branch’s “Base Rate” for loans in U.S. Dollars in Canada) or the BA rate (average annual rate applicable to Canadian Dollar bankers’ acceptances) or a LIBOR rate and the Canadian prime rate (Bank of America-Canada Branch’s “Prime Rate.”). The spread over the base rate and Canadian prime rate is between 0.50% and 1.00% and the spread over the LIBOR and for the bankers’ acceptances is between 1.50% and 2.00%, depending on the amount available to be borrowed. Until December 31, 2013, the spread will be fixed at 0.75% over the base rate and Canadian prime rate and 1.75% over the LIBOR rate and bankers’ acceptance rate. Overdue amounts and all amounts owed during the existence of a default bear interest at 2% above the rate otherwise applicable thereto. The Company also pays commitment fees on amounts not borrowed at a rate between 0.25% and 0.375% depending on the average borrowings as a percentage of the total $1.35 billion agreement during a rolling three month period.
Borrowings under the Ryerson Credit Facility are secured by (i) in the case of the U.S. facility, first-priority liens on all of the inventory, accounts receivable, lockbox accounts (excluding any proceeds therein of collateral securing the 2017 and 2018 Notes on a first priority lien basis) and related U.S. assets of Ryerson, the U.S. subsidiary borrowers and certain other U.S. subsidiaries of Ryerson that act as guarantors, and (ii) in the case of the Canadian facility, the assets securing the U.S. Facility and also first priority liens on all of the inventory, accounts receivable, lockbox accounts and related assets of Ryerson’s Canadian subsidiary borrower and its Canadian subsidiaries that act as guarantors thereof.
The Ryerson Credit Facility contains covenants that, among other things, restrict Ryerson and its subsidiaries with respect to the incurrence of debt, the creation of liens, transactions with affiliates, mergers and consolidations, sales of assets and acquisitions. The Ryerson Credit Facility also requires that, if availability under such facility falls below a certain level, the Company maintain a minimum fixed charge coverage ratio as of the end of each calendar month.
The Ryerson Credit Facility contains events of default with respect to, among other things, default in the payment of principal when due or the payment of interest, fees and other amounts due thereunder after a specified grace period, material misrepresentations, failure to perform certain specified covenants, certain bankruptcy events, the invalidity of certain security agreements or guarantees, material judgments and the occurrence of a change of control of Ryerson. If such an event of default occurs, the lenders under the Ryerson Credit Facility will be entitled to various remedies, including acceleration of amounts outstanding under the Ryerson Credit Facility and all other actions permitted to be taken by secured creditors.
The lenders under the Ryerson Credit Facility have the ability to reject a borrowing request if any event, circumstance or development has occurred that has had or could reasonably be expected to have a material adverse effect on Ryerson. If Ryerson or any significant subsidiaries of the other borrowers becomes insolvent or commences bankruptcy proceedings, all amounts borrowed under the Ryerson Credit Facility will become immediately due and payable.
Proceeds from borrowings under the Ryerson Credit Facility and repayments of borrowings thereunder that are reflected in the Consolidated Statements of Cash Flows represent borrowings under the Company’s revolving credit agreement with original maturities greater than three months. Net proceeds (repayments) under the Ryerson Credit Facility represent borrowings under the Ryerson Credit Facility with original maturities less than three months.
2017 and 2018 Notes
On October 10, 2012, Ryerson and its wholly owned subsidiary, Joseph T. Ryerson & Son, Inc., issued the 2017 and 2018 Notes. The 2017 Notes bear interest at a rate of 9% per annum. The 2018 Notes bear interest at a
50
Table of Contents
rate of 11.25% per annum. The 2017 Notes are fully and unconditionally guaranteed on a senior secured basis and the 2018 Notes are fully and unconditionally guaranteed on a senior unsecured basis by all of our existing and future domestic subsidiaries that are co-borrowers or guarantee obligations under the Ryerson Credit Facility.
The 2017 Notes and related guarantees are secured by a first-priority lien on substantially all of our and our guarantors’ present and future assets located in the United States (other than receivables, inventory, related general intangibles, certain other assets and proceeds thereof), subject to certain exceptions and customary permitted liens. The 2017 Notes and related guarantees are secured on a second-priority basis by a lien on the assets that secure our obligations under the Ryerson Credit Facility. The 2018 Notes are not secured. The 2017 and 2018 Notes contain customary covenants that, among other things, limit, subject to certain exceptions, our ability, and the ability of our restricted subsidiaries, to incur additional indebtedness, pay dividends on our capital stock or repurchase our capital stock, make investments, sell assets, engage in acquisitions, mergers or consolidations or create liens or use assets as security in other transactions. Subject to certain exceptions, Ryerson may only pay dividends to Ryerson Holding to the extent of 50% of future net income, once prior losses are offset.
The 2017 Notes will become redeemable by the Company, in whole or in part, at any time on or after April 15, 2015 and the 2018 Notes will become redeemable, in whole or in part, at any time on or after October 15, 2015, in each case at specified redemption prices. The 2017 and 2018 Notes are redeemable prior to such dates at a redemption price equal to 100% of the principal amount, together with accrued and unpaid interest, if any, to the redemption date, plus a make-whole premium. In addition, the Company may redeem up to 35% of the outstanding (i) 2017 Notes prior to April 15, 2015 with the net cash proceeds from certain equity offerings at a price equal to 109.000% of the principal amount of the 2017 Notes, plus accrued but unpaid interest and (ii) 2018 Notes prior to October 15, 2015 with the net cash proceeds from certain equity offerings at a price equal to 111.250% of the principal amount of the 2018 Notes, plus accrued but unpaid interest. If a change of control occurs, Ryerson must offer to purchase the 2017 and 2018 Notes at 101% of their principal amount, plus accrued and unpaid interest.
Pursuant to registration rights agreements relating to the 2017 and 2018 Notes, we agreed to file with the SEC by July 7, 2013, registration statements with respect to offers to exchange each of the 2017 and 2018 Notes for new issues of our debt securities registered under the Securities Act, with terms substantially identical to those of the 2017 and 2018 Notes and to consummate such exchange offers no later than October 5, 2013. Ryerson completed the exchange offer on September 10, 2013. As a result of completing the exchange offer, Ryerson satisfied its obligation under the registration rights agreements covering each of the 2017 and 2018 Notes.
Ryerson Holding Notes
As of November 1, 2012, all of the Ryerson Holding Notes, which were first issued on January 29, 2010, were repurchased or redeemed and cancelled. The Company recorded a $15.6 million loss on the repurchase and cancellation of debt related to the Ryerson Holding Notes within other income and (expense), net on the Consolidated Statements of Operations.
2014 and 2015 Notes
As of November 1, 2012, all of the Old Ryerson Notes, which were first issued on October 19, 2007, were repurchased or redeemed and cancelled. The Company recorded a $17.2 million loss on the repurchase and cancellation of debt related to the Old Ryerson Notes within other income and (expense), net on the Consolidated Statements of Operations.
51
Table of Contents
During 2011, $7.5 million principal amount of the 2015 Notes were repurchased for $7.7 million and retired, resulting in the recognition of a $0.2 million loss within other income and (expense), net on the Consolidated Statements of Operations.
Foreign Debt
As of September 30, 2013, Ryerson China’s total foreign borrowings were $21.6 million, which were owed to banks in Asia at a weighted average interest rate of 4.2% and secured by inventory, property, plant, and equipment. As of December 31, 2012, Ryerson China’s total foreign borrowings were $21.4 million, which were owed to banks in Asia at a weighted average interest rate of 4.8% and secured by inventory and property, plant and equipment. As of September 30, 2013, Açofran had no foreign borrowings. As of December 31, 2012, Açofran’s total foreign borrowings were $0.5 million, which were owed to foreign banks at a weighted average interest rate of 11.2%.
Availability under the foreign credit lines was $28 million and $21 million at September 30, 2013 and December 31, 2012, respectively. Letters of credit issued by our foreign subsidiaries totaled $9 million and $8 million at September 30, 2013 and December 31, 2012, respectively.
Pension Funding
The Company made contributions of $45.9 million in 2012, $43.9 million in 2011, and $46.6 million in 2010 to improve the Company’s pension plans funded status. At December 31, 2012, as reflected in “NOTES TO CONSOLIDATED FINANCIAL STATEMENTS—Note 10: Employee Benefits” pension liabilities exceeded plan assets by $370 million. The Company anticipates that it will have a minimum required pension contribution of approximately $48 million in 2013 under the Employee Retirement Income Security Act of 1974 (“ERISA”) and Pension Protection Act (“PPA”) in the U.S and the Ontario Pension Benefits Act in Canada. Through the nine months ended September 30, 2013, the Company has made approximately $37 million in pension contributions, and anticipates an additional $11 million contribution in the remaining three months of 2013. Future contribution requirements depend on the investment returns on plan assets, the impact of discount rates on pension liabilities, and changes in regulatory requirements. The Company is unable to determine the amount or timing of any such contributions required by ERISA or whether any such contributions would have a material adverse effect on the Company’s financial position or cash flows. The Company believes that cash flow from operations and the Ryerson Credit Facility described above will provide sufficient funds to make the minimum required contribution in 2013.
Income Tax Payments
The Company made income tax payments of $5.2 million in 2012 and received income tax refunds of $3.1 million and $46.8 million in 2011 and 2010, respectively.
Off-Balance Sheet Arrangements
In the normal course of business with customers, vendors and others, we have entered into off-balance sheet arrangements, such as letters of credit, which totaled $31 million as of September 30, 2013. Additionally, other than normal course long-term operating leases included in the following Contractual Obligations table, we do not have any material off-balance sheet financing arrangements. None of these off-balance sheet arrangements are likely to have a material effect on our current or future financial condition, results of operations, liquidity or capital resources.
52
Table of Contents
Contractual Obligations
The following presents a pro forma contractual obligations table at September 30, 2013 in consideration of the Company’s debt obligations immediately after this stock offering:
| Payments Due by Period | ||||||||||||||||||||
| Total | Less than 1 year |
1 – 3 years |
4 – 5 years |
After 5 years |
||||||||||||||||
| (In millions) | ||||||||||||||||||||
| Contractual Obligations(1)(2) |
||||||||||||||||||||
| 2017 Notes |
$ | $ | — | $ | — | $ | $ | — | ||||||||||||
| 2018 Notes |
— | — | — | |||||||||||||||||
| Ryerson Credit Facility |
— | — | — | |||||||||||||||||
| Foreign Debt |
22 | 22 | — | — | — | |||||||||||||||
| Interest on 2017 Notes, 2018 Notes, Foreign Debt and Ryerson Credit Facility (3) |
||||||||||||||||||||
| Purchase Obligations (4) |
43 | 41 | 2 | — | — | |||||||||||||||
| Operating Leases |
123 | 25 | 40 | 27 | 31 | |||||||||||||||
| Pension Withdrawal Liability |
1 | — | — | — | 1 | |||||||||||||||
| Capital Leases |
1 | — | — | 1 | — | |||||||||||||||
|
|
|
|
|
|
|
|
|
|
|
|||||||||||
| Total |
$ | $ | $ | $ | $ | |||||||||||||||
|
|
|
|
|
|
|
|
|
|
|
|||||||||||
| (1) | The contractual obligations disclosed above do not include our potential future pension funding obligations (see previous discussion under “Pension Funding” caption). |
| (2) | Due to uncertainty regarding the completion of tax audits and possible outcomes, we do not know the timing of when our obligations related to unrecognized tax benefits will occur, if at all. See Note 17 “Income Taxes” of the notes to our consolidated year-end financial statements for additional detail. |
| (3) | Interest payments related to the variable rate debt were estimated using the weighted average interest rate for the Ryerson Credit Facility. |
| (4) | The purchase obligations with suppliers are entered into when we receive firm sales commitments with certain of our customers. |
The following table presents contractual obligations at September 30, 2013:
| Payments Due by Period | ||||||||||||||||||||
| Total | Less than 1 year |
1 – 3 years |
4 – 5 years |
After 5 years |
||||||||||||||||
| Contractual Obligations(1)(2) |
(In millions) | |||||||||||||||||||
| 2017 Notes |
$ | 600 | $ | — | $ | — | $ | 600 | $ | — | ||||||||||
| 2018 Notes |
300 | — | — | — | 300 | |||||||||||||||
| Ryerson Credit Facility (3) |
318 | — | — | 318 | — | |||||||||||||||
| Foreign Debt |
22 | 22 | — | — | — | |||||||||||||||
| Interest on 2017 Notes, 2018 Notes, Foreign Debt and Ryerson Credit Facility(3)(4) |
419 | 94 | 188 | 135 | 2 | |||||||||||||||
| Purchase Obligations (5) |
43 | 41 | 2 | — | — | |||||||||||||||
| Operating Leases |
123 | 25 | 40 | 27 | 31 | |||||||||||||||
| Pension Withdrawal Liability |
1 | — | — | — | 1 | |||||||||||||||
| Capital Leases |
1 | — | — | 1 | — | |||||||||||||||
|
|
|
|
|
|
|
|
|
|
|
|||||||||||
| Total |
$ | 1,827 | $ | 182 | $ | 230 | $ | 1,081 | $ | 334 | ||||||||||
|
|
|
|
|
|
|
|
|
|
|
|||||||||||
| (1) | The contractual obligations disclosed above do not include our potential future pension funding obligations (see previous discussion under “Pension Funding” caption). |
53
Table of Contents
| (2) | Due to uncertainty regarding the completion of tax audits and possible outcomes, we do not know the timing of when our obligations related to unrecognized tax benefits will occur, if at all. See Note 17 “Income Taxes” of the notes to our consolidated year-end financial statements for additional detail. |
| (3) | Assumes a maturity date of August 16, 2017. |
| (4) | Interest payments related to the variable rate debt were estimated using the weighted average interest rate for the Ryerson Credit Facility. |
| (5) | The purchase obligations with suppliers are entered into when we receive firm sales commitments with certain of our customers. |
Subsequent Events
JT Ryerson, one of our subsidiaries, is party to a corporate advisory services agreement with Platinum Advisors, an affiliate of Platinum, pursuant to which Platinum Advisors provides JT Ryerson certain business, management, administrative and financial advice. On , JT Ryerson’s Board of Directors approved the termination of this services agreement contingent on the closing of the initial public offering. As consideration for terminating the monitoring fee payable thereunder, JT Ryerson will pay Platinum Advisors $ million. The Company will recognize the termination fee within Warehousing, delivery, selling, general and administrative expense upon the closing of the initial public offering. The unaudited pro forma balance sheet presents the effect of funding the termination payment to the principal stockholder. The unaudited pro forma balance sheet is presented for informational purposes only in accordance with Staff Accounting Bulletin Topic 1.B.3.
On , our Board of Directors approved a for 1.00 stock split of the Company’s common stock to be effected prior to the closing of this offering. Per share and share amounts presented herein have been adjusted for all periods presented to give retroactive effect to the for 1.00 stock split.
Capital Expenditures
Capital expenditures during the first nine months of 2013 totaled $16.5 million compared to $32.0 million in the first nine months of 2012, and were primarily for machinery and equipment.
Capital expenditures during 2012, 2011 and 2010 totaled $40.8 million, $47.0 million and $27.0 million, respectively. Capital expenditures were primarily for machinery and equipment.
The Company anticipates capital expenditures, excluding acquisitions, to be approximately $25 million in 2013. The spending includes improvements in the Company’s North American processing capabilities and expenditures in emerging markets.
Restructuring
2012
In 2012, the Company recorded a charge of $1.3 million related to the closure of one of its facilities. The charge consists of employee-related costs, primarily severance for 42 employees. In the fourth quarter of 2012, the Company paid $0.3 million in employee costs related to this facility closure.
During 2012, the Company paid $4.0 million in employee costs and $0.2 million in tenancy costs related to its October 2011 reorganization plan. The Company also recorded a $0.4 million reduction to this reorganization reserve for employee-related costs and recorded a charge of $0.2 million related to tenancy costs. The $0.2 million net credit reduced the reserve for the October 2011 reorganization to zero and was credited to restructuring and other charges in the Consolidated Statements of Operations.
In 2012, the Company paid the remaining $0.1 million of employee costs related to the facility closed in the fourth quarter of 2010.
54
Table of Contents
2011
In October 2011, the Company implemented a reorganization plan that reduced headcount by 292 employees resulting in a restructuring charge of $9.8 million recorded in the fourth quarter. The Company reduced headcount in a continued effort to decentralize functions to its regions as well as to execute management’s strategy of focusing on long and fabricated product sales. The charge consists of restructuring expenses of $8.4 million for employee-related costs, primarily severance, and additional non-cash pensions and other post-retirement benefit costs totaling $1.4 million. In the fourth quarter of 2011, the Company paid $4.0 million in employee costs related to this restructuring.
In 2011, the Company recorded an additional charge of $1.3 million related to the closure of one of its facilities for which it had recorded a charge of $12.5 million in the fourth quarter of 2010. The charge consists of additional employee-related costs, primarily severance. In 2011, the Company paid $1.3 million in employee costs related to this facility closure.
During 2011, the Company paid the remaining $0.2 million of tenancy and other costs related to the exit plan liability recorded on October 19, 2007.
2010
During 2010, the Company paid $0.7 million related to the exit plan liability recorded on October 19, 2007. In the fourth quarter of 2010, the Company recorded a $12.5 million charge related to the closure of one of its facilities. The charge consists of restructuring expenses of $0.4 million for employee-related costs, including severance for 66 employees, and additional non-cash pensions and other post-retirement benefits costs totaling $12.1 million. Included in the non-cash pension charge is a pension curtailment loss of $2.0 million. In the fourth quarter of 2010, the Company paid $0.3 million in employee costs related to this facility closure.
Other Charges
In the fourth quarter of 2010, the Company also recorded a charge of $1.5 million for costs related to the retirement of its former Chief Executive Officer, which is recorded within the “Restructuring and other charges” line of the Consolidated Statements of Operations.
Deferred Tax Amounts
At December 31, 2012, the Company had a net deferred tax liability of $83 million comprised primarily of a deferred tax asset of $143 million related to pension liabilities, a deferred tax asset related to postretirement benefits other than pensions of $49 million, $30 million of Alternative Minimum Tax (“AMT”) credit carryforwards, and deferred tax assets of $76 million related to federal, local and foreign loss carryforwards, offset by a valuation allowance of $147 million, and deferred tax liabilities of $109 million related to fixed assets and $130 million related to inventory.
The Company’s deferred tax assets include $56 million related to US federal net operating loss (“NOL”) carryforwards, $12 million related to state NOL carryforwards and $8 million related to foreign NOL carryforwards, available at December 31, 2012.
In accordance with FASB ASC 740, “Income Taxes,” the Company assesses the realizability of its deferred tax assets. The Company records a valuation allowance when, based upon the evaluation of all available evidence, it is more-likely-than-not that all or a portion of the deferred tax assets will not be realized. In making this determination, we analyze, among other things, our recent history of earnings, the nature and timing of reversing book-tax temporary differences, tax planning strategies and future income. After considering both the positive and negative evidence available, in the second quarter of 2009, the Company determined that it was
55
Table of Contents
more-likely-than-not that it would not realize a portion of its U.S. deferred tax assets. As a result, the Company established a valuation allowance against a portion of its U.S. deferred tax assets. The Company has maintained a valuation allowance against a portion of its U.S. deferred tax assets since that time. As of December 31, 2010, the valuation allowance was $136.6 million, an increase of $37.8 million from the prior year. Of the $37.8 million increase during 2010, $36.5 million was charged to the income tax provision, $4.4 million was charged to other comprehensive income and $3.1 million reflected a decrease in net deferred tax assets for which a valuation allowance was fully provided. As of December 31, 2011, the valuation allowance was $151.7 million, an increase of $15.1 million from the prior year. Of the $15.1 million increase during 2011, $11.7 million was credited to the income tax provision predominantly due to the impact of purchase accounting for the Singer and Turret acquisitions and $26.8 million was charged to other comprehensive income predominantly due to increases in our unfunded pension liability. As of December 31, 2012, the Company had a valuation allowance of $147.3 million, a decrease of $4.4 million from the prior year. Of the $4.4 million decrease during 2012, $19.2 million was credited to the income tax provision, $13.6 million was charged to other comprehensive income and $1.2 million was added related to the purchase accounting of Açofran.
The Company recognized a total net tax benefit of $19.2 million related to 2012 changes in valuation allowance, including a $15.2 million tax benefit as a result of the release of valuation allowance related to certain state deferred tax assets recorded at one of its subsidiaries, JT Ryerson, at December 31, 2012. As described in Note 1 to the financial statements, the Company assesses the need for a valuation allowance considering all available positive and negative evidence, including past operating results, projections of future taxable income and the feasibility of ongoing tax planning strategies. The fourth quarter of 2012 was the first quarter in which JT Ryerson had sustained an operating profit in both the preceding cumulative three fiscal year period and in each of its two preceding fiscal years, providing objective evidence of JT Ryerson’s ability to earn future profits. Combined with JT Ryerson’s projections of future income providing additional subjective evidence of JT Ryerson’s ability to earn future profits and management’s judgment, the Company determined that these deferred tax assets were more likely than not realizable and accordingly the valuation allowance was no longer required.
The Company will continue to maintain a valuation allowance on definite-lived U.S. federal and state (excluding JT Ryerson) deferred tax assets until such time as in management’s judgment, considering all available positive and negative evidence and consistent with its determinations regarding JT Ryerson described above, the Company determines that these deferred tax assets are more likely than not realizable. If the current trend in our U.S. operating profit continues, it is possible that we will release some or all of the current valuation allowance recorded against the U.S. related deferred tax assets during the next twelve months.
Recent legislative proposals in the U.S. would repeal the use of the last-in-first-out method of accounting (“LIFO method”) for inventory for U.S. tax purposes. Currently, the Company carries a deferred tax liability associated with its use of the LIFO method that does not offset the Company’s deferred tax assets, with the effect that the Company carries a valuation allowance against most of its U.S. deferred tax assets. If legislation repealing the use of the LIFO method for tax purposes becomes law, we would expect to release a substantial portion of our valuation allowance during the quarter of that event. In addition, enactment of those proposals would generally result in an increase in the cash taxes the Company will need to pay over a 10 year period, resulting from repeal of the LIFO method.
Critical Accounting Estimates
Preparation of our financial statements requires us to make estimates and assumptions that affect the reported amount of assets and liabilities, disclosure of contingent assets and liabilities at the date of our financial statements, and the reported amounts of sales and expenses during the reporting period. Our critical accounting policies, including the assumptions and judgments underlying them, are disclosed under the caption “NOTES TO CONSOLIDATED FINANCIAL STATEMENTS—Note 1: Summary of Accounting and Financial Policies.” These policies have been consistently applied and address such matters as revenue recognition, depreciation
56
Table of Contents
methods, inventory valuation, asset impairment recognition and pension and postretirement expense. While policies associated with estimates and judgments may be affected by different assumptions or conditions, we believe our estimates and judgments associated with the reported amounts are appropriate in the circumstances. Actual results may differ from those estimates.
We consider the policies discussed below as critical to an understanding of our financial statements, as application of these policies places the most significant demands on management’s judgment, with financial reporting results relying on estimation of matters that are uncertain.
Provision for allowances, claims and doubtful accounts: We perform ongoing credit evaluations of customers and set credit limits based upon review of the customers’ current credit information and payment history. We monitor customer payments and maintain a provision for estimated credit losses based on historical experience and specific customer collection issues that we have identified. Estimation of such losses requires adjusting historical loss experience for current economic conditions and judgments about the probable effects of economic conditions on certain customers. We cannot guarantee that the rate of future credit losses will be similar to past experience. Provisions for allowances and claims are based upon historical rates, expected trends and estimates of potential returns, allowances, customer discounts and incentives. We consider all available information when assessing the adequacy of the provision for allowances, claims and doubtful accounts.
Inventory valuation: Our inventories are stated at the lower of cost or market. Inventory costs reflect metal and in-bound freight purchase costs, third-party processing costs and internal direct and allocated indirect processing costs. Cost is primarily determined by the LIFO method. We regularly review inventory on hand and record provisions for obsolete and slow-moving inventory based on historical and current sales trends. Changes in product demand and our customer base may affect the value of inventory on hand which may require higher provisions for obsolete inventory.
Income Taxes: Our income tax expense, deferred tax assets and liabilities and reserve for uncertain tax positions reflect our best estimate of taxes to be paid. The Company is subject to income taxes in the U.S. and several foreign jurisdictions. The determination of the consolidated income tax expense requires judgment and estimation by management. It is possible that actual results could differ from the estimates that management has used to determine its consolidated income tax expense.
We record operating loss and tax credit carryforwards and the estimated effect of temporary differences between the tax basis of assets and liabilities and the reported amounts in the Consolidated Balance Sheet. We follow detailed guidelines in each tax jurisdiction when reviewing tax assets recorded on the balance sheet and provide for valuation allowances as required. Deferred tax assets are reviewed for recoverability based on historical taxable income, the expected reversals of existing temporary differences, tax planning strategies and on forecasts of future taxable income. The forecasts of future taxable income require assumptions regarding volume, selling prices, margins, expense levels and industry cyclicality. If we are unable to generate sufficient future taxable income in certain tax jurisdictions, we may be required to record additional valuation allowances against our deferred tax assets related to those jurisdictions.
The Company’s income tax provisions are based on calculations and assumptions that are subject to examination by the IRS and other tax authorities. Although the Company believes that the positions taken on filed tax returns are reasonable, it has established tax and interest reserves in recognition that various taxing authorities may challenge the positions taken. For uncertain tax positions, the Company applies the provisions of relevant authoritative guidance, which requires application of a “more likely than not” threshold to the recognition and derecognition of tax positions. The Company’s ongoing assessments of the more likely than not outcomes of tax authority examinations and related tax positions require significant judgment and can increase or decrease the Company’s effective tax rate.
57
Table of Contents
Long-lived Assets and Other Intangible Assets: Long-lived assets held and used are reviewed for impairment whenever events or changes in circumstances indicate that the carrying amount of an asset may not be recoverable. We estimate the future cash flows expected to result from the use of the asset and its eventual disposition. If the sum of the expected future cash flows (undiscounted and without interest charges) is less than the carrying amount of the asset, an impairment is recognized. Determining whether an impairment has occurred typically requires various estimates and assumptions, including determining which undiscounted cash flows are directly related to the potentially impaired asset, the useful life over which cash flows will occur, their amount, and the asset’s residual value, if any. Any related impairment loss is calculated based upon comparison of the fair value to the carrying value of the asset. Separate intangible assets that have finite useful lives are amortized over their useful lives. An impaired long-lived or intangible asset would be written down to fair value, based on various available valuation techniques, including the discounted cash flow method.
Goodwill: We assess the recoverability of the carrying value of recorded goodwill annually in the fourth quarter of each year or whenever indicators of potential impairment exist. We test for impairment of goodwill by assessing various qualitative factors with respect to developments in our business and the overall economy and calculating the fair value of a reporting unit using the discounted cash flow method, as necessary. Factors that may be considered indicators of impairment include: deterioration in general economic conditions; declines in the market conditions of our products, including metals prices; reduced future cash flow estimates; and slower growth rates in our industry, among others. If we determine that it is more likely than not that the fair value of a reporting unit is less than the carrying value based on our qualitative assessment, we will proceed to the two-step goodwill impairment test. In step one, we compare the fair value of the reporting unit in which goodwill resides to its carrying value. If the carrying amount exceeds the fair value, the second step of the goodwill impairment test is performed to measure the amount of the impairment loss, if any. In the second step, the implied fair value of the goodwill is estimated as the fair value of the reporting unit used in the first step less the fair value of all other net tangible and intangible assets of the reporting unit. If the carrying amount of goodwill exceeds its implied fair value, an impairment loss is recognized in an amount equal to that excess, not to exceed the carrying amount of the goodwill. The fair value of the reporting units are estimated using an average of an income approach and a market approach as this combination is deemed to be the most indicative of our fair value in an orderly transaction between market participants. An income approach based on discounted future cash flows requires us to estimate income from operations based on projected results and discount rates based on a weighted average cost of capital of comparable companies. A market approach estimates fair value using market multiples of various financial measures of comparable public companies. If these estimates or their related assumptions for commodity prices and demand change in the future, we may be required to record impairment charges for these assets.
Based on the impairment test performed on October 1, 2012, the Company concluded that the fair values for each reporting unit exceeded the carrying values. The discount rate for each reporting unit was estimated to be 14% at October 1, 2012. The Company determines a discount rate based on an estimate of a reasonable risk-adjusted return an investor would expect to realize on an investment in the reporting unit. Our U.S. reporting unit’s fair value exceeded its carrying value by more than 25%. Certain of our foreign subsidiary reporting units’ fair values exceeded their carrying values by approximately 8%. The goodwill balance at risk for these foreign subsidiaries is approximately $7 million. Deterioration in market conditions in our industry or products, changes in expected future cash flows, expected growth rates or to discount rates could result in impairment charges in future periods.
We performed an interim impairment test of goodwill as of June 30, 2013 for one reporting unit as a result of its financial performance for the first half of 2013 compared to its forecasted results. Based on this evaluation, it was determined that the fair value of the reporting unit was less than the carrying value. As required by ASC 350, the Company then performed an allocation of the fair value to all the assets and liabilities of the reporting unit, including identifiable intangible assets, based on their fair values, to determine the implied fair value of goodwill. Accordingly, the Company recorded a goodwill impairment charge of $6.8 million in the second quarter of 2013 for the difference between the carrying value of the goodwill in the reporting unit and its implied fair value. The remaining goodwill balance for this reporting unit is zero.
58
Table of Contents
Purchase Price Accounting: Business combinations are accounted for using the acquisition method of accounting. This method requires the Company to record assets and liabilities of the business acquired at their estimated fair market values as of the acquisition date. Any excess of the cost of the acquisition over the fair value of the net assets acquired is recorded as goodwill. The Company uses valuation specialists, where necessary, to perform appraisals and assist in the determination of the fair values of the assets acquired and liabilities assumed. These valuations require management to make estimates and assumptions that are critical in determining the fair values of the assets and liabilities.
Pension and postretirement benefit plan assumptions: We sponsor various benefit plans covering a substantial portion of our employees for pension and postretirement medical costs. Statistical methods are used to anticipate future events when calculating expenses and liabilities related to the plans. The statistical methods include assumptions about, among other things, the discount rate, expected return on plan assets, rate of increase of health care costs and the rate of future compensation increases. Our actuarial consultants also use subjective factors such as withdrawal and mortality rates when estimating expenses and liabilities. The discount rate used for U.S. plans reflects the market rate for high-quality fixed-income investments on our annual measurement date (December 31) and is subject to change each year. The discount rate was determined by matching, on an approximate basis, the coupons and maturities for a portfolio of corporate bonds (rated Aa or better by Moody’s Investor Services or AA or better by Standard and Poor’s) to the expected plan benefit payments defined by the projected benefit obligation. The discount rates used for plans outside the U.S. are based on a combination of relevant indices regarding corporate and government securities, the duration of the liability and appropriate judgment.
When calculating pension expense for 2012, we assumed the pension plans’ assets would generate a long-term rate of return of 8.75% and 6.50% for the U.S. and Canadian plans, respectively. The expected long-term rate of return assumption was developed based on historical experience and input from the trustee managing the plans’ assets. The expected long-term rate of return on plan assets is based on a target allocation of assets, which is based on a goal of earning the highest rate of return while maintaining risk at acceptable levels. Our projected long-term rate of return for the U.S. pension plan is slightly higher than some market indices due to the active management of our plans’ assets, and is supported by the historical returns on our plans’ assets. The plans strive to have assets sufficiently diversified so that adverse or unexpected results from one security class will not have an unduly detrimental impact on the entire portfolio. We regularly review actual asset allocation and the pension plans’ investments are periodically rebalanced to the targeted allocation when considered appropriate. Pension expense increases as the expected rate of return on plan assets decreases. Lowering the expected long-term rate of return on plan assets by 50 basis points would have increased 2012 pension expense by approximately $3 million.
Future pension obligations for the U.S. and Canadian plans were discounted using a weighted average rate of 4.00% and 4.20% at December 31, 2012, respectively. Lowering the discount rate by 50 basis points would increase the pension liability at December 31, 2012 by approximately $56 million.
The calculation of other postretirement benefit expense and obligations requires the use of a number of assumptions, including the assumed discount rate for measuring future payment obligations and the health care cost trend rate. A one percentage point increase (decrease) in assumed health care trend rates would increase (decrease) our total service and interest cost for the year ended December 31, 2012 by $0.3 million and $(0.2) million, respectively. A one percentage point decrease in the weighted average discount rate would increase the postretirement benefit liability by approximately $6 million.
The assumptions used in the actuarial calculation of expenses and liabilities may differ materially from actual results due to changing market and economic conditions, higher or lower withdrawal rates or longer or shorter life spans of participants. These differences may result in a significant impact on the amount of pension or postretirement benefit expense we may record in the future.
Legal contingencies: We are involved in a number of legal and regulatory matters including those discussed in the “NOTES TO CONSOLIDATED FINANCIAL STATEMENTS—Note 11: Commitments and Contingencies.” We determine whether an estimated loss from a loss contingency should be accrued by assessing
59
Table of Contents
whether a loss is deemed probable and can be reasonably estimated. We analyze our legal matters based on available information to assess potential liability. We consult with outside counsel involved in our legal matters when analyzing potential outcomes. We cannot determine at this time whether any potential liability related to this litigation would materially affect our financial position, results of operations or cash flows.
Recent Accounting Pronouncements
Recent accounting pronouncements are discussed within the “NOTES TO CONSOLIDATED FINANCIAL STATEMENTS—Note 1: Summary of Accounting and Financial Policies.”
Quantitative and Qualitative Disclosures About Market Risk
Interest rate risk
We are exposed to market risk related to our fixed-rate and variable-rate long-term debt. Market risk is the potential loss arising from adverse changes in market rates and prices, such as interest rates. Changes in interest rates may affect the market value of our fixed-rate debt. The estimated fair value of our long-term debt and the current portions thereof using quoted market prices of Company debt securities recently traded and market-based prices of similar securities for those securities not recently traded was $1,275 million at September 30, 2013 and $1,296 million at December 31, 2012 as compared with the carrying value of $1,240 million and $1,305 million at September 30, 2013 and December 31, 2012, respectively.
A hypothetical 1% increase in interest rates on variable rate debt would have increased interest expense for the first nine months of 2013 by approximately $2.7 million.
Foreign exchange rate risk
We are subject to exposure from fluctuations in foreign currencies. We use foreign currency exchange contracts to hedge our Canadian subsidiaries’ variability in cash flows from the forecasted payment of currencies other than the functional currency. The Canadian subsidiaries’ foreign currency contracts were principally used to purchase U.S. dollars. We had foreign currency contracts with a U.S. dollar notional amount of $1.7 million outstanding at September 30, 2013 and a value of zero. We do not currently account for these contracts as hedges but rather mark these contracts to market with a corresponding offset to current earnings.
Commodity price risk
Metal prices can fluctuate significantly due to several factors including changes in foreign and domestic production capacity, raw material availability, metals consumption and foreign currency rates. Declining metal prices could reduce our revenues, gross profit and net income. From time to time, we may enter into fixed price sales contracts with our customers for certain of our inventory components. We may enter into metal commodity futures and options contracts to reduce volatility in the price of these metals. We do not currently account for these contracts as hedges, but rather mark these contracts to market with a corresponding offset to current earnings. As of September 30, 2013, we had 173 tons of nickel futures or option contracts, 1,300 tons of hot roll steel coil option contracts, and 50 tons of aluminum price swaps outstanding with liability values of $0.3 million, zero and zero, respectively.
Investor Rights Agreement
Ryerson Holding and Platinum are party to an investor rights agreement and have agreed to enter into the Investor Rights Agreement upon the consummation of this offering that will provide for, among other things, demand, piggyback and Form S-3 registration rights and board nomination rights.
60
Table of Contents
The Investor Rights Agreement will provide that Platinum may make written demands of us to require us to register the shares of our common stock owned by Platinum; provided, however that we will not be obligated to effect more than two such demand registrations. In addition, Platinum will have piggyback registration rights entitling them to require us to register shares of our common stock owned by them in connection with any registration statements filed by us after the completion of this offering, subject to certain exceptions. Upon the closing of this offering, we have agreed to use commercially reasonable efforts to qualify for registration on Form S-3 for secondary sales. After we have qualified for the use of Form S-3, Platinum will, subject to certain exceptions, have the right to request an unlimited number of registrations on Form S-3. We will not be obligated to effect a registration unless certain pricing or timing conditions are first satisfied.
The Investor Rights Agreement provides that we will indemnify Platinum against losses suffered by it in connection with any untrue or alleged untrue statement of a material fact contained in any prospectus, offering circular, or other document delivered or made available to investors (or in any related registration statement or any amendment or supplement thereto) or any omission or alleged omission to state therein a material fact required to be stated therein or necessary to make the statement therein not misleading, except insofar as the same may be caused by or contained in any information furnished in writing to us by Platinum for use therein.
The Investor Rights Agreement will provide that for so long as Platinum collectively beneficially owns at least (i) 30% of the voting power of the outstanding capital stock of the Company, Platinum will have the right to nominate for election to the board of directors of the Company no fewer than that number of directors that would constitute a majority of the number of directors if there were no vacancies on the board, (ii) at least 15% but less than 30% of the voting power of the outstanding capital stock of the Company, Platinum will have the right to nominate two directors and (iii) at least 5% but less than 15% of the voting power of the outstanding capital stock of the Company, Platinum will have the right to nominate one director. The agreement will also provide that if the size of the board of directors is increased or decreased at any time, Platinum’s nomination rights will be proportionately increased or decreased, respectively, rounded up to the nearest whole number, except that if the board of directors increases its size within 180 days of the date of the agreement, Platinum will have the right to designate director nominees to fill each newly created directorship.
The Investor Rights Agreement was negotiated among management and Platinum, and we believe the Investor Rights Agreement is on arm’s-length terms.
61
Table of Contents
Our Company
We believe we are one of the largest processors and distributors of metals in North America measured in terms of sales, with global operations in North America, China and a recently established presence in Brazil. Our industry is highly fragmented with the largest companies accounting for only a small percentage of total market share. We believe we have an established and growing presence in China and that we are the only major North American metal service center whose activities in China represent a meaningful portion of overall operations in terms of revenue, which we believe positions us favorably in the largest metals market in the world. Our customer base ranges from local, independently owned fabricators and machine shops to large, international original equipment manufacturers. We process and distribute a full line of over 75,000 products in stainless steel, aluminum, carbon steel and alloy steels and a limited line of nickel and red metals in various shapes and forms. More than one-half of the products we sell are processed to meet customer requirements. We use various processing and fabricating techniques to process materials to a specified thickness, length, width, shape and surface quality pursuant to customer orders. For the year ended December 31, 2012, we purchased 2.1 million tons of materials from suppliers throughout the world. For the nine months ended September 30, 2013, our Adjusted EBITDA, excluding LIFO expense was $128.1 million, revenue was $2,657.8 million and net income was $8.2 million. See note 4 in “Summary Historical Consolidated Financial and Other Data” for a reconciliation of Adjusted EBITDA to net income.
We operate over 90 facilities across North America and seven facilities in China and one in Brazil. Our service centers are strategically located in close proximity to our customers, which allows us to quickly process and deliver our products and services, often within the next day of receiving an order. We own, lease or contract a fleet of tractors and trailers, allowing us to efficiently meet our customers’ delivery demands. In addition, our scale enables us to maintain low operating costs. Our operating expenses as a percentage of sales for the years ended December 31, 2011 and 2012 were 11.8% and 12.6%, respectively.
In addition to providing a wide range of flat and long metals products, we offer numerous value-added processing and fabrication services such as sawing, slitting, blanking, cutting to length, leveling, flame cutting, laser cutting, edge trimming, edge rolling, roll forming, tube manufacturing, polishing, shearing, forming, stamping, punching, rolling shell plate to radius and beveling to process materials to a specified thickness, length, width, shape and surface quality pursuant to specific customer orders. Our value proposition also includes providing a superior level of customer service and responsiveness, technical services and inventory management solutions. Our breadth of services allows us to create long-term partnerships with our customers and enhances our profitability.
We serve more than 40,000 customers across a wide range of manufacturing end markets. We believe the diverse end markets we serve reduce the volatility of our business in the aggregate. Our geographic network and broad range of products and services allow us to serve large, international manufacturing companies across multiple locations.
62
Table of Contents
We are broadly diversified in our end markets and product lines in North America, as detailed below.
| 2012 Sales by End Market |
2012 Sales by Product | |
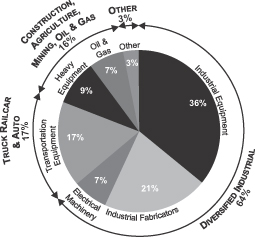
|
| |
| (1) “Other” includes copper, brass, nickel, pipe, valves and fittings. | ||
Industry Overview
Metals service centers serve as key intermediaries between metal producers and end users of metal products. Metal producers offer commodity products and typically sell metals in the form of standard-sized coils, sheets, plates, structurals, bars and tubes. Producers prefer large order quantities, longer lead times and limited inventory in order to maximize capacity utilization. End users of metal products seek to purchase metals with customized specifications, including value-added processing. End market customers look for “one-stop” suppliers that can offer processing services along with lower order volumes, shorter lead times, and more reliable delivery. As an intermediary, metals service centers aggregate end-users’ demand, purchase metal in bulk to take advantage of economies of scale and then process and sell metal that meets specific customer requirements. The end-markets for metals service centers are highly diverse and include machinery, manufacturing, construction and transportation.
The metals service center industry is comprised of many companies, the majority of which have limited product lines and inventories, with customers located in a specific geographic area. The industry is highly fragmented, with a large number of small companies and few relatively large companies. In general, competition is based on quality, service, price and geographic proximity.
The metals service center industry typically experiences cash flow trends that are counter-cyclical to the revenue and volume growth of the industry. Companies that participate in the industry have assets that are composed primarily of working capital. During an industry downturn, companies generally reduce working capital investments and generate cash as inventory and accounts receivable balances decline. As a result, operating cash flow and liquidity tend to increase during a downturn, which typically facilitates industry participants’ ability to cover fixed costs and repay outstanding debt.
The industry is divided into three major groups: general line service centers, specialized service centers, and processing centers, each of which targets different market segments. General line service centers handle a broad line of metals products and tend to concentrate on distribution rather than processing. General line service centers range in size from a single location to a nationwide network of locations. For general line service centers, individual order size in terms of dollars and tons tends to be small relative to processing centers, while the total number of orders is typically high. Specialized service centers focus their activities on a narrower range of product and service offerings than do general line companies. Such service centers provide a narrower range of
63
Table of Contents
services to their customers and emphasize product expertise and lower operating costs, while maintaining a moderate level of investment in processing equipment. Processing centers typically process large quantities of metals purchased from primary producers for resale to large industrial customers, such as the automotive industry. Because orders are typically large, operation of a processing center requires a significant investment in processing equipment.
We compete with many other general line service centers, specialized service centers and processing centers on a regional and local basis, some of which may have greater financial resources and flexibility than us. We also compete to a lesser extent with primary metal producers. Primary metal producers typically sell to very large customers that require regular shipments of large volumes of steel. Although these large customers sometimes use metals service centers to supply a portion of their metals needs, metals service center customers typically are consumers of smaller volumes of metals than are customers of primary steel producers. Although we purchase from foreign steelmakers, some of our competitors purchase a higher percentage of metals than us from foreign steelmakers. Such competitors may benefit from favorable exchange rates or other economic or regulatory factors that may result in a competitive advantage. This competitive advantage may be offset somewhat by higher transportation costs and less dependable delivery times associated with importing metals into North America.
Competitive Strengths
Leading Market Position in North America.
We believe we are one of the largest service center companies for carbon and stainless steel as well as aluminum based on sales in the North American market where we have a broad geographic presence with over 90 locations.
Our service centers are located near our customer locations, enabling us to provide timely delivery to customers across numerous geographic markets. Additionally, our widespread network of locations in the United States, Canada and Mexico helps us to utilize our expertise to more efficiently serve customers with complex supply chain requirements across multiple manufacturing locations. We believe this is a key differentiator among customers who need a supplier that can reliably and consistently support them. Our ability to transfer inventory among our facilities better enables us to more timely and profitably source and process specialized items at regional locations throughout our network than if we were required to maintain inventory of all products and specialized equipment at each location.
We believe with our significant footprint in the North American market, combined with our significant scale and operating leverage, a cyclical recovery of the service center industry supported by long-term growth trends in Ryerson’s end-markets should allow us to experience higher growth rates relative to North American economic improvement, but there can be no guarantee that we will experience such higher growth rates.
Broad Geographic Reach across Attractive End Markets.
Our operations cover a diverse range of industries, including industrial equipment, industrial fabrication, electrical machinery, transportation equipment, heavy equipment and oil and gas. Manufacturing growth has accelerated since November 2012 as shown by the ISM index (as described in the Industry and End Market Outlook), and we believe industries we serve will provide strong demand for our products and services as the North American manufacturing economy continues to recover. We also believe that the continued trend of moving manufacturing to the United States from overseas should benefit us with our broad North American platform. In addition, we expect to benefit from continued growth in international markets that will help spur demand at domestic manufacturing facilities that sell into the global market. We believe that our ability to quickly adjust our offering based on regional and industry specific trends creates stability while also providing the opportunity to access specific growth markets.
64
Table of Contents
Established Platform for Organic and Acquisition Growth.
Since 2011, we have opened seven new service centers in previously underserved North American regions. We have acquired another ten facilities to complement our existing locations and expanded the product offering in many locations based on customer demand. Over the last two years, a significant portion of our capital expenditures have been made to expand our long and plate processing capabilities at 15 existing locations. We believe that our expanded presence in select regions and products positions us well to capture further growth in these regions and products.
Although there can be no guarantee of growth, we believe a number of our other strategies, such as improving our product mix, pricing our products and services based on the value we provide our customers, growing our large national network, and expanding our diverse operating capabilities, will provide us with growth opportunities.
In addition, we have utilized our leadership and experience in the North American markets to establish operations in China, the largest and one of the highest growth metals markets in the world, as well as in Brazil.
Given the highly fragmented nature of the service center industry, we believe there are numerous additional opportunities to acquire businesses and incorporate them into our existing infrastructure. Given our large scale and geographic reach, we believe we can add value to these businesses in a number of ways, including providing greater purchasing power, access to additional end markets and broadening product mix. Although the Company does not have any current plans to engage in any specific acquisitions, from time to time and in the ordinary course of business, the Company regularly evaluates potential acquisition opportunities.
Lean Operating Structure Providing Operating Leverage.
Since the acquisition by Platinum, we have transformed our operating model by decentralizing our operations and reducing our cost base. Decentralization has improved our customer service by moving key functions such as procurement, credit and operations support to our regional offices. From 2007 through the end of 2009, we engaged in a number of cost reduction initiatives that included a headcount reduction of approximately 1,700, representing 33% of our workforce, and the closure of 14 redundant or underperforming facilities in North America. Furthermore, in 2011, we also completed the decentralization of credit, operations, and procurement and reduced field staffing levels. In that overall period, we believe that we have generated annual fixed cost savings of approximately $200 million since 2007. We believe this reduction has improved our operating efficiency while also providing the flexibility for further growth in our targeted markets.
We have also focused on process improvements in inventory management. Despite an increase in average inventory days from 74 days in 2011 to 86 days in 2013, our average inventory days have improved on an overall basis from 100 days in 2006. This reduction has decreased our exposure to metals price movements as well as increased capacity in our facilities to devote to higher margin products. These organizational and operating changes have improved our operating structure, working capital management and efficiency.
As a result of our initiatives, we have increased our financial flexibility and believe we have a favorable cost structure compared to many of our peers. This will provide significant operating leverage.
Extensive Breadth of Products and Services for Diverse Customer Base.
We carry a full range of over 75,000 products, including aluminum, carbon, stainless and alloy steels and a limited line of nickel and red metals. In addition, we provide a broad range of processing and fabrication services to meet the needs of our 40,000 customers and fulfill more than 1,000,000 orders per year. We also provide supply chain solutions, including just-in-time delivery, and value-added components to many original equipment manufacturers.
We believe our broad product mix and marketing approach provides customers with a “one-stop shop” solution few other service center companies are able to offer.
65
Table of Contents
For the year ended December 31, 2012, no single customer accounted for more than 2% of our sales, and our top 10 customers accounted for less than 10% of sales.
Strong Relationships with Suppliers.
We are among the largest purchasers of metals in North America and have long-term relationships with many of our North American suppliers. We believe we are frequently one of the largest customers of our suppliers and that concentrating our orders among a core group of suppliers is an effective method for obtaining favorable pricing and service. We believe we have the opportunity to further leverage this strength through continued focus on price and volume using an analytics-driven approach to procurement. In addition, we view our strategic suppliers as supply chain partners. Our coordinated effort focused on logistics, lead times, rolling schedules, and scrap return programs ultimately results in value-based buying that is advantageous for us. Metals producers worldwide are consolidating, and large, geographically diversified customers, such as Ryerson, are desirable partners for these larger suppliers. Our relationships with suppliers often provides us with access to metals when supply is constrained. Through our knowledge of the global metals marketplace and capabilities of specific mills we believe we have developed a global purchasing strategy that allows us to secure favorable prices across our product lines.
Experienced Management Team with Deep Industry Knowledge.
Our senior management team has extensive industry and operational experience and has been instrumental in optimizing and implementing our strategy in the last two years. Our senior management has an average of more than 20 years of experience in the metals or service center industries. The senior executive team’s extensive experience in international markets and outside the service center industry provides perspective to drive profitable growth.
Our CEO, Mr. Michael Arnold, joined the Company in January 2011 and has 34 years of diversified industrial experience. Mr. Edward Lehner, who has been our CFO since August 2012, has 24 years of experience predominantly in the metals industry. Under their leadership, we have increased our focus on positioning the Company for growth and enhanced profitability.
Our Strategy
Expand Margins.
We are actively pursuing strategies to achieve increased gross margins. We believe this will allow our profitability to accelerate as volumes in our industry improve. Although the first nine months of net sales in 2013 decreased by 16.3% as compared to the first nine months of net sales in 2012, we have employed and continue to employ the initiatives below, which have resulted in an increase in our gross margins as a percentage of sales, excluding LIFO expense, by over 100 basis points, from 15.7% in Q3 2012 to 16.9% in Q3 2013. We have excluded LIFO expense from the gross margin as a percentage of sales metric in order to provide a means of comparison amongst our competitors who may not use the same basis of accounting for inventories.
Optimize Product Mix. We see significant opportunities to continue to improve our margins by increasing long and plate products supplied to our customers, as long and plate products typically generate higher margins than flat products. We have established regional long product inventory to provide a broad line of stainless, aluminum, carbon and alloy long products as well as the necessary processing equipment to meet demanding requirements of these customers. In addition, over the past two years, 45% of our capital expenditures have gone toward upgrading and adding plate and long processing capabilities throughout our operational footprint. We expect to continue to optimize product mix through these initiatives.
Optimize Customer Mix. We have increased our focus on serving a diversified group of industrial customers that value our customized processing services which we price on a transaction-by-transaction basis as opposed to
66
Table of Contents
larger volume program account customers who typically have fixed pricing arrangements over varying time periods. Our sales to customers using transactional pricing arrangements typically generate higher margins and require less working capital investment. We have re-evaluated and re-priced many of our lower margin program accounts which has resulted in an increase in our margins, as evidenced above.
Expand Value-added Processing Services. We seek to continue to improve our margins by complementing our products with first stage manufacturing and other processing capabilities that add value for our customers. Additionally, for certain customers we have assumed the management and responsibility for complex supply chains involving numerous suppliers, fabricators and processors. We leverage our capabilities to deliver the highest value proposition to our customers by providing a wide breadth of competitive products and services, as well as superior customer service and product quality.
Improve Supply Chain and Procurement Management. As a large purchaser of metals we continue to use analytic-driven processes to develop supply chains which lower our procured costs, shorten our lead times, improve our working capital management and decrease our exposure to commodity price fluctuations.
Improve Operating Efficiency.
We are committed to improving our operating capabilities through continuous business improvements and cost reductions. We have made, and continue to make, improvements in a variety of areas, including operations, sales, delivery, administration and working capital management. Furthermore, we continue to focus on better customer service and the hiring, retention and promotion of high performing employees as well as place greater emphasis on working capital efficiencies. In particular with respect to inventory, our goal of maintaining approximately 75-80 days of sales on hand reduces our exposure to metals prices and increases capacity in facilities to devote to higher margin products. Our streamlined organizational structure combines local decision making with regional and national sourcing to improve efficiency.
Pursue Profitable Growth Through Expansion and Value-Accretive Acquisitions.
We are focused on increasing our sales to existing customers, as well as expanding our customer base globally, but there can be no guarantee we will be able to expand. We expect to continue increasing revenue through a variety of sales initiatives and by targeting attractive markets.
In North America, we have expanded and continue to expand in markets that we believe are underserved. We opened seven new facilities since 2011 in Texas, Georgia, Iowa, Illinois, Utah and Mexico, and have expanded higher-margin plate fabrication or long-product capabilities at many existing locations, where we have observed an opportunity to generate attractive returns. We are continuously monitoring opportunities for further expansion across the United States, Canada and Mexico. We expect to leverage our expertise in North America and selectively expand our business in China and Brazil as well as additional high growth emerging markets.
Since 2010, we have completed five strategic acquisitions: Texas Steel Processing Inc., SFI-Gray Steel Inc., Singer Steel Company, Turret Steel and Açofran Aços e Metais Ltda. These acquisitions have provided various opportunities for long-term value creation through the expansion of our product and service capabilities, geographic reach, operational distribution network, end markets diversification, cross-selling opportunities and the addition of transactional-based customers. Although the Company does not have any current plans to engage in any specific acquisitions, we regularly evaluate potential acquisitions of service center companies that complement our existing customer base and product offerings, and plan to continue pursuing our disciplined approach to such acquisitions.
Maintain Flexible Capital Structure and Strong Liquidity Position.
Our management team is focused on maintaining a strong level of liquidity that will facilitate our plans to execute our various growth strategies. Throughout the economic downturn, we maintained liquidity in excess of
67
Table of Contents
$300 million. Liquidity as of September 30, 2013 was approximately $423 million, comprised of $319 million of availability under Ryerson’s senior secured $1.35 billion asset-based revolving credit facility and foreign debt facilities, and $104 million of cash-on-hand and marketable securities. We have no financial maintenance covenants in our debt agreements unless availability under the Ryerson Credit Facility falls below $125 million.
Substantially all of the proceeds from this offering will be used to further reduce our outstanding indebtedness. In addition, following the 2012 bond refinancing, there are no significant debt maturities until the maturity of the Ryerson Credit Facility, which occurs on the earlier of (a) April 3, 2018 or (b) August 16, 2017 (60 days prior to the scheduled maturity date of the 2017 Notes), if the 2017 Notes are then outstanding.
Industry and End Market Outlook
Ryerson participates in the metals service center industry providing steel, aluminum and other metals products across a wide range of industrial manufacturing end markets. Our business performance is therefore impacted by a number of factors tied to industrial activity, including economic growth, end market demand and metals pricing. With steel products accounting for 76% of our 2012 sales, it is the largest driver of our business. Aluminum products account for 21% of our business, with other metals accounting for the remainder.
Macroeconomic Outlook. Steel is utilized in a diverse range of manufacturing and fabrication applications with a variety of end market demand drivers. The primary drivers of demand for the steel industry are the construction, automotive, machinery and equipment, and energy end markets, which, according to the American Iron and Steel Institute, account for approximately 85% of shipments collectively. As evidenced by our end market sales segmentation, we are not reliant on a single specific sector, but rather broader diversified industrial activity. Our primary end markets include industrial equipment and fabrication, transportation equipment, heavy equipment, electrical machinery and oil and gas. We believe that we are well positioned in these markets and that they are poised for growth as the broader industrial sectors continue to grow. The charts below, which reflect the most recently available data from AISI, show our end market exposure as well as the broader steel market.
| 2012 Steel Shipments by Market Classification (AISI) | 2012 Ryerson Sales by End Market | |
|
| ||
| Source:American Iron and Steel Institute |
Source:Company estimates | |
While some of the key end market drivers of steel industry demand do not directly overlap with our end markets, they do impact broader steel demand and pricing, which can impact our business. Recently, leading indicators in the key steel industry end markets referenced above have begun to show sustained growth and continue to build positive momentum. For example, housing starts have shown stable growth over the last 24 months, while non-residential construction, which typically lags housing, is starting to show signs of sustained improvement as well. Additionally, U.S. automotive sales continue to rise according to the Bureau of Economic Analysis, reaching 15.2 million vehicles on a seasonally adjusted annualized rate basis in October 2013 versus 14.3 million for October of 2012. Machinery and equipment, a key end market for us, includes a variety of industrial manufacturing end markets, many of which are showing signs of significant growth. This is evidenced by the Institute for Supply Management’s (“ISM”) Purchasing Managers’ Index (“PMI”), which reached 56.4 in October 2013. The United States Federal Reserve midpoint GDP growth estimates of 3.0% and 3.25% for 2014
68
Table of Contents
and 2015, respectively. Finally, the oil and gas end market continues to be a long-term growth market in steel. Much of this growth is attributable to growth in North American drilling and refining, substantially impacted by activity in United States shale oil and gas and the Canadian oil sands. Additionally, investment in new petrochemical production capacity in the United States as a result of relatively low domestic natural gas prices may further bolster steel demand. The following chart shows the historical movements of the Purchasing Managers’ Index.
ISM Purchasing Managers’ Index
According to MSCI, total inventory levels of carbon steel, stainless steel and aluminum at U.S. service centers reached a trough in August 2009 and bottomed at the lowest levels since the data series began in 1977. Although industry demand recovered in 2010, 2011 and 2012, shipments and inventory are still well below pre-downturn averages, which we believe suggests long-term growth potential that may be realized if these metrics return to, or exceed, their historical averages.
| North American Monthly Service Center Shipments | North American Monthly Service Center Inventory | |
|
|
|
Ryerson End Market Outlook. Although our revenue for the nine months ended September 30, 2013 decreased 16.3% compared to the nine months ended September 30, 2012 due to weaker economic conditions in the metals market, according to the latest Livingston Survey, published by the Federal Reserve Bank of Philadelphia, U.S. industrial production is expected to grow by 2.8% and 3.1% in 2013 and 2014, respectively. Two of our largest end markets, industrial equipment and fabrication, include numerous diversified industrial manufacturing markets which, along with the broader economy, are showing signs of sustained growth. For example, in the U.S. major appliances and Heating Ventilation and Air Conditioning (“HVAC”) equipment, both markets we serve, are projected to grow at even higher rates. Specifically, major appliances are expected to grow 6.5% and 6.1% in 2014 and 2015, respectively, according to Euromonitor. According to IBIS Worldwide, HVAC is expected to grow 2.2% and 3.7% over the same periods.
In addition, we also serve the transportation equipment, heavy equipment and electrical equipment markets which are expected to show significant growth in the coming years. Transportation equipment, including commercial vehicle production, represents 17% of our sales and is expected to grow 2.8% per year in the U.S.
69
Table of Contents
between 2013 and 2015 according to LMC Automotive. Machinery and heavy equipment, including construction and agricultural equipment, represents 9% of our end-market sales and is projected to grow 7.1% per year in the U.S. between 2012 and 2016 according to MarketLine.
Metals Pricing. Along with improvements in volume, as indicated by demand trends in the end markets, movements in the price of steel will also impact our business. Steel prices are driven by a number of factors, including input prices, capacity utilization and foreign imports. Currently, input costs are providing support for steel pricing, as they flow directly through the pricing of the mills’ steel output. Additionally, we believe that recent closings of mills, including the Sparrows Point steel mill, among others, that have been dismantled, combined with continued growth in the global economy and end market demand, should begin to absorb global capacity, resulting in increased utilization. The U.S. steel industry production capacity utilization rate increased to 77.5% by the end of November 2013 from a low of 34% in December 2008, according to AISI. North American production capacity utilization levels remain below the 85% average utilization level observed in the post- consolidation restructured steel industry from 2002 to 2008. Although our average selling price decreased 10.3% in the first nine months of 2013 compared to the first nine months of 2012 due to decreases in metals prices across all of our products with some of the largest decreases in our carbon plate, stainless steel plate and stainless steel long product lines, we believe that the combination of higher input prices, increased global demand and increased capacity utilization will support steel price increases in the near future, positively impacting our business.
Aluminum pricing also remains well below pre-downturn levels but has stabilized recently. Global output of aluminum is projected to increase 6.6% in 2014 according to Wood Mackenzie, fueled by factors including the rebound in U.S. construction and increased demand from the transportation and infrastructure markets in China.
Industry Consolidation. The United States service center industry is a highly fragmented market with the top 50 service centers controlling approximately 25% of industry sales, according to Metal Center News, only 12 of which have sales over $1 billion. Such fragmentation has historically resulted in the smaller service centers having less negotiating leverage with both the larger consolidated steel mills, as well as larger customers. In recent years, however, there has been increased consolidation among larger players resulting in fewer customers of size for the mills and greater purchasing power for service centers. A recent example is the acquisition of Metals USA Holding Corp. by Reliance Steel & Aluminum Co. We believe that there is significant opportunity for consolidation and we expect the trend will continue.
Products and Services
We carry a full line of carbon steel, stainless steel, alloy steels and aluminum, and a limited line of nickel and red metals. These materials are inventoried in a number of shapes, including coils, sheets, rounds, hexagons, square and flat bars, plates, structurals and tubing.
The following table shows our percentage of sales by major product lines for 2010, 2011 and 2012:
| Product Line |
2010 | 2011 | 2012 | |||||||||
| Carbon Steel Flat |
29 | % | 27 | % | 25 | % | ||||||
| Carbon Steel Plate |
8 | 11 | 13 | |||||||||
| Carbon Steel Long |
9 | 10 | 15 | |||||||||
| Stainless Steel Flat |
21 | 18 | 15 | |||||||||
| Stainless Steel Plate |
4 | 4 | 4 | |||||||||
| Stainless Steel Long |
3 | 4 | 4 | |||||||||
| Aluminum Flat |
15 | 15 | 14 | |||||||||
| Aluminum Plate |
3 | 3 | 3 | |||||||||
| Aluminum Long |
4 | 4 | 4 | |||||||||
| Other |
4 | 4 | 3 | |||||||||
|
|
|
|
|
|
|
|||||||
| Total |
100 | % | 100 | % | 100 | % | ||||||
|
|
|
|
|
|
|
|||||||
70
Table of Contents
More than one-half of the materials sold by us are processed. We use processing and fabricating techniques such as sawing, slitting, blanking, cutting to length, leveling, flame cutting, laser cutting, edge trimming, edge rolling, polishing and shearing to process materials to specified thickness, length, width, shape and surface quality pursuant to specific customer orders. Among the most common processing techniques used by us are slitting, which involves cutting coiled metals to specified widths along the length of the coil, and leveling, which involves flattening metals and cutting them to exact lengths. We also use third-party fabricators to outsource certain processes that we are not able to perform internally (such as pickling, painting, forming and drilling) to enhance our value-added services.
The plate burning and fabrication processes are particularly important to us. These processes require sophisticated and expensive processing equipment. As a result, rather than making investments in such equipment, manufacturers have increasingly outsourced these processes to metals service centers.
As part of securing customer orders, we also provide services to our customers to assure cost effective material application while maintaining or improving the customers’ product quality.
Our services include: just-in-time inventory programs, production of kits containing multiple products for ease of assembly by the customer, consignment arrangements and the placement of our employees at a customer’s site for inventory management and production and technical assistance. We also provide special stocking programs in which products that would not otherwise be stocked by us are held in inventory to meet certain customers’ needs. These services are designed to reduce customers’ costs by minimizing their investment in inventory and improving their production efficiency.
Customers
Our customer base is diverse, numbering approximately 40,000 and includes most metal-consuming industries, most of which are cyclical. For the year ended December 31, 2012, no single customer accounted for more than 2% of our sales, and the top 10 customers accounted for less than 10% of our sales. Substantially all of our sales are attributable to our U.S. operations and substantially all of our long-lived assets are located in the United States. Our Canadian operations comprised 10% of our sales in each of 2010, 2011 and 2012, our China operations comprised 4%, 4%, and 3% of our sales in 2010, 2011 and 2012, respectively, our Mexican operations comprised less than 1% of our sales in each of 2010, 2011 and 2012, and our Brazilian operations comprised less than 1% of our sales in 2012. Canadian assets were 10%, 10% and 11% of consolidated assets at December 31, 2010, 2011 and 2012, respectively. Chinese assets were 5% of consolidated assets at December 31, 2010, 2011 and 2012. Mexican assets were less than 1% of consolidated assets at December 31, 2010, 2011 and 2012. Brazilian assets were less than 1% of consolidated assets at December 31, 2012.
Some of our largest customers have procurement programs with us, typically ranging from three months to one year in duration. Pricing for these contracts is generally based on a pricing formula rather than a fixed price for the program duration. However, certain customer contracts are at fixed prices; in order to minimize our financial exposure, we generally match these fixed-price sales programs with fixed-price supply programs. In general, sales to customers are priced at the time of sale based on prevailing market prices.
Suppliers
For the year ended December 31, 2012, our top 25 suppliers accounted for approximately 75% of our purchase dollars.
We purchase the majority of our inventories at prevailing market prices from key suppliers with which we have established relationships to obtain improvements in price, quality, delivery and service. We are generally able to meet our materials requirements because we use many suppliers, because there is a substantial overlap of product offerings from these suppliers, and because there are a number of other suppliers able to provide identical or similar products. Because of the competitive nature of the business, when metal prices increase due to product demand, mill surcharges, supplier consolidation or other factors that in turn lead to supply constraints
71
Table of Contents
or longer mill lead times, we may not be able to pass our increased material costs fully to customers. In recent years, there have been significant consolidations among suppliers of carbon steel, stainless steel, and aluminum. Continued consolidation among suppliers could lead to disruptions in our ability to meet our material requirements as the sources of our products become more concentrated from fewer producers. We believe we will be able to meet our material requirements because we believe that we have good relationships with our suppliers and believe we will continue to be among the largest customers of our suppliers.
Facilities
Our owned and leased facilities as of September 30, 2013 are set forth below.
Operations in the United States
Ryerson, through JT Ryerson, maintains 84 operational facilities, including 6 locations that are dedicated to administration services, in the United States. All of our metals service center facilities are in good condition and are adequate for JT Ryerson’s existing operations. Approximately 46% of these facilities are leased. The lease terms expire at various times through 2023. Owned properties noted as vacated below have been closed and are in the process of being sold. JT Ryerson’s properties and facilities are adequate to serve its present and anticipated needs.
| Location |
Own/Lease | |
| Birmingham, AL |
Owned | |
| Mobile, AL |
Owned | |
| Fort Smith, AR |
Owned | |
| Hickman, AR** |
Leased | |
| Little Rock, AR(2) |
Owned | |
| Phoenix, AZ |
Owned | |
| Dos Palos, CA |
Leased | |
| Fresno, CA |
Leased | |
| Livermore, CA |
Leased | |
| Vernon, CA |
Owned | |
| Commerce City, CO |
Owned | |
| South Windsor, CT |
Leased | |
| Wilmington, DE |
Leased | |
| Wilmington, DE |
Owned | |
| Jacksonville, FL |
Owned | |
| Tampa Bay, FL |
Owned | |
| Duluth, GA |
Owned/Vacated | |
| Norcross, GA |
Leased | |
| Norcross, GA |
Owned | |
| Des Moines, IA |
Owned | |
| Eldridge, IA |
Leased | |
| Marshalltown, IA |
Owned | |
| Boise, ID |
Leased | |
| Chicago, IL (Headquarters)* |
Leased | |
| Chicago, IL(2) |
Leased |
72
Table of Contents
| Location |
Own/Lease | |
| Dekalb, IL |
Leased | |
| Elgin, IL |
Leased | |
| Lisle, IL* |
Leased | |
| Burns Harbor, IN |
Owned | |
| Indianapolis, IN |
Owned | |
| Wichita, KS |
Leased | |
| Shelbyville, KY** |
Owned | |
| Shreveport, LA |
Owned | |
| St. Rose, LA |
Owned | |
| Devens, MA |
Owned | |
| Grand Rapids, MI* |
Leased | |
| Jenison, MI |
Owned/Vacated | |
| Lansing, MI |
Leased | |
| Minneapolis, MN |
Owned | |
| Plymouth, MN |
Owned | |
| Maryland Heights, MO |
Leased | |
| North Kansas City, MO |
Owned | |
| Greenwood, MS |
Leased/Vacated | |
| Jackson, MS |
Owned | |
| Charlotte, NC |
Owned | |
| Charlotte, NC |
Owned/Vacated | |
| Charlotte, NC |
Leased | |
| Greensboro, NC |
Owned | |
| Pikeville, NC |
Leased | |
| Youngsville, NC |
Leased | |
| Omaha, NE |
Owned | |
| Lancaster, NY |
Owned | |
| Liverpool, NY* |
Leased/Vacated | |
| Cleveland, OH |
Owned | |
| Columbus, OH |
Leased | |
| Hamilton, OH* |
Leased | |
| Streetsboro, OH |
Leased | |
| Warren, OH |
Leased | |
| Oklahoma City, OK |
Owned | |
| Tulsa, OK |
Owned | |
| Portland, OR |
Leased/Vacated | |
| Tigard, OR |
Leased | |
| Ambridge, PA** |
Owned | |
| Fairless Hills, PA |
Leased | |
| Pittsburgh, PA* |
Leased |
73
Table of Contents
| Location |
Own/Lease | |
| Charleston, SC |
Owned | |
| Greenville, SC |
Owned | |
| Chattanooga, TN |
Owned | |
| Knoxville, TN* |
Leased | |
| Memphis, TN |
Owned | |
| Cooper, TX |
Leased | |
| Dallas, TX(2) |
Owned | |
| El Paso, TX |
Leased | |
| Houston, TX |
Owned | |
| Houston, TX(3) |
Leased | |
| McAllen, TX |
Leased | |
| Salt Lake City, UT |
Leased | |
| Pounding Mill, VA |
Owned | |
| Richmond, VA |
Owned | |
| Renton, WA |
Owned | |
| Spokane, WA |
Owned | |
| Baldwin, WI |
Leased | |
| Green Bay, WI |
Leased | |
| Green Bay, WI |
Owned | |
| Milwaukee, WI |
Owned |
| * | Office space only |
| ** | Processing centers |
Operations in Canada
Ryerson Canada, a wholly owned indirect Canadian subsidiary of Ryerson, has 10 operational facilities in Canada. All of the metals service center facilities are in good condition and are adequate for Ryerson Canada’s existing and anticipated operations. Three facilities are leased.
| Location |
Own/Lease | |
| Calgary, AB |
Owned | |
| Edmonton, AB |
Owned | |
| Richmond, BC |
Owned | |
| Winnipeg, MB |
Owned | |
| Winnipeg, MB |
Leased | |
| Saint John, NB |
Owned | |
| Brampton, ON |
Leased | |
| Sudbury, ON |
Owned/Vacated | |
| Toronto, ON (includes Canadian Headquarters) |
Owned | |
| Laval, QC |
Leased/Vacated | |
| Vaudreuil, QC |
Leased | |
| Saskatoon, SK |
Owned | |
74
Table of Contents
Operations in China
Ryerson China, an indirect wholly owned subsidiary of Ryerson, has six service and processing centers in China, at Guangzhou, Dongguan, Kunshan and Tianjin, performing coil processing, sheet metal fabrication and plate processing. Ryerson China’s headquarters office building is located in Kunshan. We own three buildings in China and have purchased the related land use rights. The remainder of our facilities are leased. All of the facilities are in good condition and are adequate for Ryerson China’s existing and anticipated operations.
Operations in Mexico
Ryerson Mexico, an indirect wholly owned subsidiary of Ryerson, has two facilities in Mexico. We have service centers in Monterrey and Tijuana, both of which are leased. The facilities are in good condition and are adequate for Ryerson Mexico’s existing and anticipated operations.
Operations in Brazil
On February 17, 2012, we acquired 50% of the issued and outstanding capital stock of Açofran. We, through Açofran, lease one service center in São Paulo, Brazil. The facility is in good condition and is adequate for its existing and anticipated operations.
Sales and Marketing
We maintain our own sales force. In addition to our office sales staff, we market and sell our products through the use of our field sales force that we believe has extensive product and customer knowledge and through a comprehensive catalog of our products. Our office and field sales staffs, which together as of September 30, 2013 consist of approximately 670 employees, include technical and metallurgical personnel.
A portion of our customers experience seasonal slowdowns. Our sales in the months of July, November and December traditionally have been lower than in other months because of a reduced number of shipping days and holiday or vacation closures for some customers. Consequently, our sales in the first two quarters of the year are usually higher than in the third and fourth quarters.
Capital Expenditures
In recent years we have made capital expenditures to maintain, improve and expand processing capabilities. Additions by us to property, plant and equipment, together with retirements for the five years ended December 31, 2012, excluding the initial purchase price of acquisitions and the initial effect of fully consolidating a joint venture, are set forth below. The net capital change during such period aggregated to an increase of $59.9 million.
| Additions | Retirements or Sales |
Net | ||||||||||
| (In millions) | ||||||||||||
| 2012 |
$ | 40.8 | $ | 18.0 | $ | 22.8 | ||||||
| 2011 |
47.0 | 14.9 | 32.1 | |||||||||
| 2010 |
27.0 | 5.5 | 21.5 | |||||||||
| 2009 |
22.8 | 17.4 | 5.4 | |||||||||
| 2008 |
30.1 | 52.0 | (21.9 | ) | ||||||||
We currently anticipate capital expenditures, excluding acquisitions, of up to approximately $25 million for 2013. We expect capital expenditures will be funded from cash generated by operations and available borrowings.
75
Table of Contents
Employees
As of September 30, 2013, we employed approximately 3,300 persons in North America, 400 persons in China, and 50 persons in Brazil. Our North American workforce was comprised of approximately 1,600 office employees and approximately 1,700 plant employees. Twenty-nine percent of our plant employees were members of various unions, including the United Steel Workers and the International Brotherhood of Teamsters. Our relationship with the various unions has generally been good.
Ten contracts covering approximately 312 persons were scheduled to expire in 2011. One of these contracts, which covered 59 employees, was not renewed due to facility closure. Eight of these contracts were successfully negotiated in 2011 and the remaining contract covering 60 employees was extended and successfully negotiated in 2012. Six contracts covering approximately 258 employees were scheduled to expire in 2012. We reached agreement on the renewal of all six of contracts in 2012. In 2013, there is one contract covering 11 employees scheduled to expire in 2013. Negotiations are scheduled to begin in December 2013. Eight contracts covering approximately 170 employees are scheduled to expire in 2014.
Environmental, Health and Safety Matters
Our facilities and operations are subject to many foreign, federal, state and local laws and regulations relating to the protection of the environment and to health and safety. In particular, our operations are subject to extensive requirements relating to waste disposal, recycling, air and water emissions, the handling of regulated materials, remediation, underground storage tanks, asbestos-containing building materials, workplace exposure and other matters. We believe that our operations are currently in substantial compliance with all such laws and do not presently anticipate substantial expenditures in the foreseeable future in order to meet environmental, workplace health or safety requirements or to pay for any investigations, corrective action or claims. Claims, enforcement actions, or investigations regarding personal injury, property damage, or violation of environmental laws could result in substantial costs to us, divert our management’s attention and result in significant liabilities, fines, or the suspension or interruption of our facilities.
We continue to analyze and implement safeguards to mitigate any environmental, health and safety risks we may face. As a result, additional costs and liabilities may be incurred to comply with future requirements or to address newly discovered conditions, which costs and liabilities could have a material adverse effect on the results of operations, financial condition or cash flows. For example, there is increasing likelihood that additional regulation of greenhouse gas emissions will occur at the foreign, federal, state and local level, which could affect us, our suppliers, and our customers. While the costs of compliance could be significant, given the uncertain outcome and timing of future action by the U.S. federal government and states on this issue, we cannot accurately predict the financial impact of future greenhouse gas regulations on our operations or our customers at this time. We do not currently anticipate any new programs disproportionately impacting us compared to our competitors.
Some of the properties currently or previously owned or leased by us are located in industrial areas or have a long history of heavy industrial use. We may incur environmental liabilities with respect to these properties in the future including cost of investigations, corrective action, claims for natural resource damages, claims by third parties relating to property damages or claims relating to contamination at sites where we have sent waste for treatment or disposal. Based on currently available information we do not expect any investigation or remediation matters or claims related to properties presently or formerly owned or operated or to which we have sent waste for treatment or disposal would have a material adverse effect on our financial condition, results of operations or cash flows.
In October 2011, the United States Environmental Protection Agency named us as one of more than 100 businesses that may be a potentially responsible party for the Portland Harbor Superfund Site. We do not currently have sufficient information available to us to determine the total cost of any required investigation or remediation of the Portland Harbor site and management cannot predict the ultimate outcome of this matter or estimate a range of potential loss at this time.
76
Table of Contents
Capital and operating expenses for pollution control projects were less than $500,000 per year for the past five years. Excluding any potential additional remediation costs resulting from any corrective action for the properties described above, we expect spending for pollution control projects to remain at historical levels.
Our United States operations are also subject to the Department of Transportation Federal Motor Carrier Safety Regulations. We operate a private trucking motor fleet for making deliveries to some of our customers. Our drivers do not carry any material quantities of hazardous materials. Our foreign operations are subject to similar regulations. Future regulations could increase maintenance, replacement, and fuel costs for our fleet. These costs could have a material adverse effect on our results of operations, financial condition or cash flows.
Intellectual Property
We own several U.S. and foreign trademarks, service marks and copyrights. Certain of the trademarks are registered with the U.S. Patent and Trademark Office and, in certain circumstances, with the trademark offices of various foreign countries. We consider certain other information owned by us to be trade secrets. We protect our trade secrets by, among other things, entering into confidentiality agreements with our employees regarding such matters and implementing measures to restrict access to sensitive data and computer software source code on a need-to-know basis. We believe that these safeguards adequately protect our proprietary rights and vigorously defend these rights. While we consider all of our intellectual property rights as a whole to be important, we do not consider any single right to be essential to our operations as a whole. The 2017 and 2018 Notes are secured by our intellectual property.
Foreign Operations
Ryerson Canada
Ryerson Canada, an indirect wholly owned Canadian subsidiary of Ryerson, is a metals service center and processor. Ryerson Canada has facilities in Calgary (AB), Edmonton (AB), Richmond (BC), Winnipeg (MB), Saint John (NB), Brampton (ON), Toronto (ON) (includes Canadian headquarters), Vaudreuil (QC) and Saskatoon (SK), Canada.
Ryerson China
In 2006, Ryerson Inc. and VSC and its subsidiary, CAMP BVI, formed Ryerson China to enable us, through this foreign operation, to provide metals distribution services in China. We invested $28.3 million in Ryerson China for a 40% equity interest. We increased ownership of Ryerson China from 40% to 80% in the fourth quarter of 2008 for a total purchase cost of $18.5 million. We consolidated the operations of Ryerson China as of October 31, 2008. On July 12, 2010, we acquired VSC’s remaining 20% equity interest in Ryerson China for $17.5 million. As a result, Ryerson China is now an indirect wholly owned subsidiary of Ryerson Holding. Ryerson China is based in Kunshan and operates processing and service centers in Guangzhou, Dongguan, Kunshan and Tianjin.
Ryerson Mexico
Ryerson Mexico, an indirect wholly owned subsidiary of Ryerson, operates as a metals service center and processor. Ryerson formed Ryerson Mexico in 2010 to expand operations into the Mexican market. Ryerson Mexico has a service centers in Monterrey, Mexico and Tijuana, Mexico.
Brazil
In February 2012, we acquired 50% of the issued and outstanding capital stock of Açofran. As of such date, we, through Açofran, lease one service center in São Paulo, Brazil.
77
Table of Contents
Legal Proceedings
From time to time, we are named as a defendant in legal actions incidental to our ordinary course of business. We do not believe that the resolution of these claims will have a material adverse effect on our financial position, results of operations or cash flows. We maintain liability insurance coverage to assist in protecting our assets from losses arising from or related to activities associated with business operations.
On December 27, 2011, Nancy Hoffman, Mark Hoffman, and Karen Hoffman (collectively, the “plaintiffs”) filed a sixth amended complaint in the Circuit Court of Cook County, Illinois naming JT Ryerson and three other entities as defendants (collectively, the “defendants”) in a lawsuit (Nancy Hoffman, et.al. v. Dorlan Crane, et.al.). That complaint asserted negligence and loss of consortium counts against the defendants for personal injuries allegedly suffered by plaintiffs resulting from a motor vehicle accident. On February 10, 2012, a jury returned a verdict against the defendants and awarded damages totaling $27.7 million for which the defendants are purportedly jointly and severally liable. On August 28, 2012, our post-trial motion was denied. On September 24, 2012, we filed our Notice of Appeal to the Appellate Court of Illinois, First Judicial District. Any potential loss ranges from zero to $27.7 million plus interest. We believe that any loss will be covered by insurance. At this time, the Company cannot predict the likely outcome of this matter.
In October 2011, the United States Environmental Protection Agency named us as one of more than 100 businesses that may be a potentially responsible party for the Portland Harbor Superfund Site (“Portland Harbor”). We do not currently have sufficient information available to us to determine the total cost of any required investigation or remediation of the Portland Harbor site. We cannot predict the ultimate outcome of this matter or estimate a range of potential loss at this time.
78
Table of Contents
Set forth below is a list of the names, ages and positions of the executive officers and directors of Ryerson Holding as of the closing of this offering. All directors are elected to serve until their successors are elected and qualified. Following this offering, our amended and restated certificate of incorporation and our amended and restated bylaws will provide for a classified Board of Directors consisting of three classes of directors, each serving staggered three-year terms. See “Board of Directors, Committees and Executive Officers—Term and Class of Directors” below and “Description of Capital Stock—Anti-Takeover provisions of Delaware law,” and “—Charter and bylaw’s anti-takeover provisions” for more information.
| Name |
Age |
Position | ||||
| Michael C. Arnold |
56 | Chief Executive Officer and President | ||||
| Edward J. Lehner |
46 | Executive Vice President and Chief Financial Officer | ||||
| Robert L. Archambault |
48 | Director | ||||
| Kirk K. Calhoun* |
68 | Director | ||||
| Eva M. Kalawski |
57 | Director | ||||
| Jacob Kotzubei |
44 | Director | ||||
| Mary Ann Sigler |
58 | Director | ||||
| * | Mr. Calhoun will be joining the Board of Directors upon the closing of this offering. |
Biographies of Executive Officers
Michael C. Arnold has been our Chief Executive Officer and President since January 2011. Prior to joining Ryerson, he served as executive vice president for The Timken Company (“Timken”) and president of Timken’s Bearings and Power Transmission Group from 2007 to 2010. Timken is a global company that manufactures steel, bearings and related components. Mr. Arnold earned a Bachelor’s degree in Mechanical Engineering and an MBA in sales and marketing from the University of Akron.
Edward J. Lehner has been our Executive Vice President and Chief Financial Officer since August 2012. Prior to joining Ryerson, he served as chief financial officer and chief administrative officer for PSC Metals, Inc. from 2009 to 2012. PSC Metals is a North American ferrous and non-ferrous scrap processor. Mr. Lehner earned a Bachelor’s degree in Accounting from the University of Cincinnati.
In addition to the above-named executive officers, there are a number of Platinum employees who perform non-policy making officer functions at the Company.
Biographies of Directors
Robert L. Archambault has been a director since April 2010. Mr. Archambault joined Platinum in 1997 and is a Partner at the firm. Prior to joining Platinum, Mr. Archambault worked at Pilot Software, Inc., where he held the positions of VP Business Development, VP Professional Services and VP Channels, Americas. Mr. Archambault received a B.S. in Management from New York Maritime College. Mr. Archambault served as acting president of Ryerson from October 2007 through August 2008 and his familiarity with Ryerson and its business has led the Board of Directors to conclude that he has the necessary expertise to serve as a director of the Company.
Kirk K. Calhoun will join our Board of Directors as the chairman of the audit committee upon the completion of this offering. Mr. Calhoun joined the public accounting firm Ernst & Young, LLP in 1965 and served as a partner of the firm from 1975 until his retirement in 2002. Mr. Calhoun has a B.S. in Accounting from the University of Southern California and is a Certified Public Accountant (non-practicing) in California. He is currently lead director of the Board of Directors of Response Genetics, Inc. Previously Mr. Calhoun served
79
Table of Contents
on the boards of five public companies up until the dates of their respective sales, including Abraxis Bioscience, Inc., Myogen, Inc., Aspreva Pharmaceutical Corporation, Adams Respiratory Therapeutics, Inc., and Replidyne, Inc. Mr. Calhoun’s experience serving on public company audit committees and boards of directors and his past work as a partner with Ernst & Young, LLP has led the Board of Directors to conclude that Mr. Calhoun has the requisite expertise to serve as a director of the Company and qualifies as a financial expert for audit committee purposes.
Eva M. Kalawski has been a director since October 2007. Ms. Kalawski joined Platinum in 1997, is a Partner and serves as the firm’s General Counsel and Secretary. Ms. Kalawski serves or has served as an officer and/or director of many of Platinum’s portfolio companies. Prior to joining Platinum in 1997, Ms. Kalawski was Vice President of Human Resources, General Counsel and Secretary for Pilot Software, Inc. Ms. Kalawski earned a Bachelor’s Degree in Political Science and French from Mount Holyoke College and a Juris Doctor from Georgetown University Law Center. Ms. Kalawski’s expertise and experience managing the legal operations of many portfolio companies has led the Board of Directors to conclude that she has the background and skills necessary to serve as a director of the Company.
Jacob Kotzubei has been a director since January 2010. Mr. Kotzubei joined Platinum in 2002 and is a Partner at the firm. Mr. Kotzubei serves as an officer and/or director of a number of Platinum’s portfolio companies. Prior to joining Platinum in 2002, Mr. Kotzubei worked for 4 1/2 years for Goldman Sachs’ Investment Banking Division in New York City. Previously, he was an attorney at Sullivan & Cromwell LLP in New York City, specializing in mergers and acquisitions. Mr. Kotzubei received a Bachelor’s degree from Wesleyan University and holds a Juris Doctor from Columbia University School of Law where he was elected a member of the Columbia Law Review. Mr. Kotzubei’s experience in executive management oversight, private equity, capital markets and transactional matters has led the Board of Directors to conclude that he has the varied expertise necessary to serve as a director of the Company.
Mary Ann Sigler has been a director since January 2010. Ms. Sigler is the Chief Financial Officer of Platinum. Ms. Sigler joined Platinum in 2004 and is responsible for overall accounting, tax, and financial reporting as well as managing strategic planning projects for the firm. Prior to joining Platinum, Ms. Sigler was with Ernst & Young LLP for 25 years where she was a partner. Ms. Sigler has a B.A. in Accounting from California State University Fullerton and a Masters in Business Taxation from the University of Southern California. Ms. Sigler is a Certified Public Accountant in California, as well as a member of the American Institute of Certified Public Accountants and the California Society of Certified Public Accountants. Ms. Sigler’s experience in accounting and strategic planning matters has led the Board of Directors to conclude that she has the requisite qualifications to serve as a director of the Company and facilitate its continued growth.
Board of Directors, Committees and Executive Officers
Composition of Board of Directors
Our amended and restated certificate of incorporation and bylaws provide that the authorized number of directors shall be fixed from time to time by a resolution of the majority of our Board of Directors. As of the closing of this offering, our Board of Directors will be comprised of the following five members: Messrs. Archambault, Calhoun and Kotzubei, and Mses. Kalawski and Sigler.
Because Platinum will own more than 50% of the voting power of our common stock after this offering, we are considered to be a “controlled company” for purposes of the NYSE listing requirements. As such, we are permitted, and have elected, to opt out of the NYSE listing requirements that would otherwise require our Board of Directors to be comprised of a majority of independent directors and require our compensation committee and nominating and corporate governance committee to be comprised entirely of independent directors. Accordingly, you may not have the same protections afforded to stockholders of companies that are subject to all of the NYSE corporate governance requirements. Our Board of Directors has determined that upon the closing of this offering, Mr. Calhoun will be independent.
80
Table of Contents
Term and Class of Directors
Upon the closing of this offering, our Board of Directors will be divided into three staggered classes of directors of the same or nearly the same number. At each annual meeting of stockholders, a class of directors will be elected for a three-year term to succeed the directors of the same class whose terms are then expiring. The terms of the directors will expire upon election and qualification of successor directors at the Annual Meeting of Stockholders to be held during the years 2014 for the Class I directors, 2015 for the Class II directors and 2016 for the Class III directors.
| • | Our Class I directors will be Mses. Kalawski and Sigler; |
| • | Our Class II director will be Mr. Archambault; and |
| • | Our Class III directors will be Messrs. Calhoun and Kotzubei. |
Any additional directorships resulting from an increase in the number of directors will be distributed among the three classes so that, as nearly as possible, each class shall consist of one-third of the directors. The division of our Board of Directors into three classes with staggered three-year terms may delay or prevent a change of our management or a change in control.
Term of Executive Officers
Each executive officer is appointed and serves at the discretion of the Board of Directors and holds office until his or her successor is elected and qualified or until his or her earlier resignation or removal. There are no family relationships among any of our directors or executive officers.
Director Compensation
Following the completion of this offering, we intend to pay our independent director, and any additional independent directors, an annual retainer fee that is commensurate with market practice for public companies of similar size. Other than independent directors, we do not intend to compensate directors for serving on our Board of Directors or any of its committees. We do, however, intend to reimburse each member of our Board of Directors for out-of-pocket expenses incurred by them in connection with attending meetings of the Board of Directors and its committees.
Board Committees
In connection with the consummation of this offering, our Board of Directors will continue to have an audit committee, and will have a compensation committee and a nominating and corporate governance committee, each of which will have the composition and responsibilities described below.
Audit Committee. Our audit committee will oversee a broad range of issues surrounding our accounting and financial reporting processes and audits of our financial statements, including the following: (i) monitor the integrity of our financial statements, our compliance with legal and regulatory requirements, our independent registered public accounting firm’s qualifications and independence, and the performance of our internal audit function and independent registered public accounting firm, (ii) assume direct responsibility for the appointment, compensation, retention and oversight of the work of any independent registered public accounting firm engaged for the purpose of performing any audit, review or attest services and for dealing directly with any such accounting firm, (iii) provide a medium for consideration of matters relating to any audit issues and (iv) prepare the audit committee report that the rules require be included in our filings with the SEC. Upon completion of this offering, the members of our audit committee will be Messrs. Kotzubei and Calhoun and Ms. Sigler. Mr. Calhoun will serve as chairman of the audit committee and the composition of our audit committee will comply with all applicable NYSE rules, including the requirement that at least one member of the audit committee have accounting or related financial management expertise. Mr. Calhoun will qualify as an “audit
81
Table of Contents
committee financial expert” as such term is defined in Item 407(d)(5) of Regulation S-K and will be “independent” as such term is defined in Rule 10A-3(b)(1) under the Securities Exchange Act of 1934, as amended (the “Exchange Act”), and the rules of the NYSE. Neither Mr. Kotzubei nor Ms. Sigler is so independent.
In accordance with NYSE rules, we plan to appoint a second independent director to our Board of Directors within 90 days of the effective date of the registration statement of which this prospectus is a part, who will replace Mr. Kotzubei as a member of the audit committee and to appoint a third independent director to our Board of Directors within 12 months of the effective date of the registration statement of which this prospectus is a part, who will replace Ms. Sigler as a member of the audit committee such that all of our audit committee members will be independent as such term is defined in Rule 10A-3(b)(1) under the Exchange Act and applicable NYSE rules.
Our Board of Directors will adopt a written charter for the audit committee, which will be available on our website upon consummation of this offering.
Compensation Committee. Our compensation committee will review and recommend policy relating to compensation and benefits of our officers and employees, including reviewing and approving corporate goals and objectives relevant to the compensation of our Chief Executive Officer and other senior officers, evaluating the performance of these officers in light of those goals and objectives and setting compensation of these officers based on such evaluations. The compensation committee will review and evaluate, at least annually, the performance of the compensation committee and its members, including compliance of the compensation committee with its charter. Upon the closing of this offering, the members of our compensation committee will be Messrs. Archambault and Kotzubei, neither of which is independent as such term is defined in the rules of the NYSE, and Mr. Calhoun. Because Platinum will own more than 50% of the voting power of our common stock after this offering, we are considered to be a “controlled company” for the purposes of the NYSE listing requirements. As such, we are permitted, and have elected, to opt out of the NYSE listing requirements that would otherwise require our compensation committee to be comprised entirely of independent directors.
Our Board of Directors will adopt a written charter for the compensation committee, which will be available on our website upon consummation of this offering.
Nominating and Corporate Governance Committee. The nominating and corporate governance committee will oversee and assist our Board of Directors in identifying, reviewing and recommending nominees for election as directors; evaluate our Board of Directors and our management; develop, review and recommend corporate governance guidelines and a corporate code of business conduct and ethics; and generally advise our Board of Directors on corporate governance and related matters. Upon the closing of this offering, we will establish a nominating and corporate governance committee consisting of Mses. Kalawski and Sigler, none of whom are independent as such term is defined in the rules of the NYSE. Because Platinum will own more than 50% of the voting power of our common stock after this offering, we are considered to be a “controlled company” for the purposes of the NYSE listing requirements. As such, we are permitted, and have elected, to opt out of the NYSE listing requirements that would otherwise require our nominating and corporate governance committee to be comprised entirely of independent directors.
Our Board of Directors will adopt a written charter for the nominating and corporate governance committee, which will be available on our website upon consummation of this offering.
Our Board of Directors may from time to time establish other committees.
82
Table of Contents
Compensation Committee Interlocks and Insider Participation
We do not currently have a designated compensation committee. None of our executive officers has served as a member of the Board of Directors or compensation committee of any entity that has an executive officer serving as a member of our Board of Directors.
Indemnification
We maintain directors’ and officers’ liability insurance. Our amended and restated certificate of incorporation and amended and restated bylaws include provisions limiting the liability of directors and officers and indemnifying them under certain circumstances. We expect to enter into indemnification agreements with our directors to provide our directors and certain of their affiliated parties with additional indemnification and related rights. See “Description of Capital Stock—Limitation on liability of directors and indemnification” for further information.
Code of Ethics
Our Board of Directors has adopted a Code of Ethics that contains the ethical principles by which our chief executive officer and chief financial officer, among others, are expected to conduct themselves when carrying out their duties and responsibilities. A copy of our Code of Ethics may be found on our website at www.ryerson.com. We will provide a copy of our Code of Ethics to any person, without charge, upon request, by writing to the Compliance Officer, Ryerson Inc., 227 W. Monroe, 27th Floor, Chicago, Illinois 60606 (telephone number (312) 292-5000). We intend to satisfy the disclosure requirement under Item 5.05 of Form 8-K regarding an amendment to, or waiver from, a provision of our Code of Ethics by posting such information on Ryerson Inc.’s website at www.ryerson.com.
83
Table of Contents
Compensation Discussion and Analysis
Compensation Overview and Objectives
As a private company, our compensation decisions with respect to our named executive officers have historically been based on the goal of achieving performance at levels necessary to provide meaningful returns to our primary stockholder upon an ultimate liquidity event. To this end, our compensation decisions in 2012 were primarily based on the goals of recruiting, retaining, and motivating individuals who can help us meet and exceed our financial and operational goals.
Determination of Compensation
Ryerson’s Board of Directors (the “Ryerson Board”), in consultation with us, was principally responsible for establishing and making decisions with respect to our compensation and benefit plans in 2012, including all compensation decisions relating to our named executive officers. The following individuals served as named executive officers in 2012: (i) Michael C. Arnold, President and Chief Executive Officer of Ryerson Inc., (ii) Edward J. Lehner, Executive Vice President and Chief Financial Officer of Ryerson Inc., (iii) Matthias Heilmann, former Chief Operating Officer of Ryerson Inc., who resigned from Ryerson Inc. on January 31, 2012, (iv) Terence R. Rogers, former Chief Financial Officer of Ryerson Inc., who left the Company on April 12, 2012, and (v) William S. Johnson, former Interim Chief Financial Officer of Ryerson Inc., who resigned from Ryerson Inc. on November 2, 2012.
In determining the levels and mix of compensation, the Ryerson Board has not generally relied on formulaic guidelines but rather has sought to maintain a flexible compensation program that allowed it to adapt components and levels of compensation to motivate and reward individual executives within the context of our desire to maximize stockholder value. Subjective factors considered in compensation determinations included an executive’s skills and capabilities, contributions as a member of the executive management team, contributions to our overall performance, and whether the total compensation potential and structure were sufficient to ensure the retention of an executive when considering the compensation potential that may be available elsewhere. In making its determination, the Ryerson Board has not undertaken any formal benchmarking or reviewed any formal surveys of compensation for our competitors. During the first few months of 2012, the Ryerson Board consulted with each of the then named executive officers for recommendations regarding annual bonus targets and other compensation matters (including their own) and for financial analysis concerning the impact of various benefits and compensation structures. The Ryerson Board had no formal, regularly scheduled meetings to set compensation policy and instead met as circumstances required from time to time.
The Ryerson Board considered the slow pace of the economic recovery and its impact on our business as the biggest factor impacting compensation decisions during 2012. The Ryerson Board weighed the conflicting goals of providing an attractive and competitive compensation package against making appropriate adjustments to our cost structure in recognition of this slow recovery. The Ryerson Board considered the impact on employee morale and potential loss of key employees versus the desire to contain costs. The Ryerson Board believes that its compensation decisions in 2012 accomplished both goals.
The Ryerson Board believes that employment agreements with our named executive officers are valuable tools to both enhance our efforts to retain these executives and to protect our competitive and confidential information. The estimates of the value of the benefits potentially payable under these agreements upon a termination of employment or a change in control are set out below under the caption “Potential Payments Upon Termination or Change in Control.”
84
Table of Contents
Components of Compensation for 2012
The compensation provided to our named executive officers in 2012 consisted of the same elements generally available to our non-executive employees, including base salary, bonuses, perquisites and retirement and other benefits, each of which is described in more detail below. Additionally, our named executive officers participated in a long-term incentive program, also described in more detail below.
Base Salary
The base salary (or, with respect to Mr. Johnson, the monthly fee) payable to each named executive officer was intended to provide a fixed component of compensation reflecting the executive’s skill set, experience, role and responsibilities, as well as to recruit well-qualified executives. In determining base salary for any particular year (or, with respect to Mr. Johnson, the monthly fee for any particular month), the Ryerson Board generally considered, among other factors, competitive market practice, individual performance for the prior year, the mix of fixed compensation to overall compensation, and any minimum guarantees afforded to the named executive officer pursuant to any agreement. Pursuant to the terms of his contract, Mr. Johnson received a 25% increase in his monthly fee on June 25, 2012.
Annual Bonus
Ryerson Inc. maintains the Ryerson Annual Incentive Plan, as amended (the “AIP”), pursuant to which its key managers (including our named executive officers (other than Mr. Johnson)) were eligible to receive a performance-based cash bonus tied to our achievement of specified financial performance targets in 2012. Each participant’s threshold and target performance measures, as well as each participant’s target award (expressed as a percentage of the participant’s base salary) were established by the Ryerson Board. No cash AIP bonuses were payable unless we achieved the threshold set for the performance period. The Ryerson Board generally viewed the use of cash AIP bonuses as an effective means to compensate our named executive officers for achieving our annual financial goals and to provide meaningful returns to our primary stockholder upon a future liquidity event. The target AIP bonuses for Messrs. Arnold, Lehner, Heilmann and Rogers were 100%, 75%, 100% and 75% of their respective base salaries for 2012. In early 2012, the Ryerson Board set and communicated the performance targets to the named executive officers. The target AIP bonus levels were set to reflect the relative responsibility for our performance and to appropriately allocate the total cash opportunity between base salary and incentive based compensation. Mr. Johnson did not participate in the AIP, but in order to induce him to accept the position of Interim Chief Financial Officer, the terms of his offer letter provided for a $25,000 bonus award after the completion of three months of service.
For 2012, the Ryerson Board determined that a combination of earnings before interest, taxes, depreciation, amortization and restructuring expenses (“EBITDAR”) excluding last in, first out inventory accounting expense plus adjustments established by the Ryerson Board, if any and “economic value added” (“EVA”) should be used as the performance measure for determining the cash AIP bonus payable to our named executive officers. EVA is the amount by which (i) EBITDAR plus adjustments established by the Ryerson Board, if any, exceeded (ii) a carrying cost of capital applied to certain of our assets. The Ryerson Board chose these factors as the appropriate performance measures to motivate our key executives, including the named executive officers, to both maximize earnings and increase utilization of our working capital. Fifty percent of each named executive officer’s bonus opportunity for 2012 was based on the EBITDAR during 2012 and the remaining 50% was based on the EVA during 2012.
For 2012, threshold EBITDAR was set at approximately $275 million, target EBITDAR was set at $327 million, and maximum EBITDAR was set at $401 million. For 2012, the actual EBITDAR for AIP purposes was $207 million, which did not meet the threshold EBITDAR and thus did not result in cash bonuses. For 2012, threshold EVA was set at approximately $22 million, target EVA was set at approximately $66 million and maximum EVA was set at $125 million. For 2012, the actual EVA for AIP purposes was negative $28 million, which did not meet the threshold EVA and thus did not result in cash bonuses to any of our named executive officers for 2012.
85
Table of Contents
Long Term Incentive Bonus
In February of 2009, we adopted the Rhombus Holding Corporation Amended and Restated 2009 Participation Plan (the “Participation Plan”), designed to provide incentive to key employees, including our named executive officers, to maximize our performance and to provide maximum returns to our stockholders. Under the Participation Plan, participants are granted performance units, the value of which appreciate when and as the value of the Company increases from and after the date of grant, and it is this appreciation in value which is the basis upon which incentive compensation may become payable upon the occurrence of certain qualifying events, which are described below. The Compensation Committee for the Participation Plan (the “Compensation Committee”) determines who is eligible to receive an award, the size and timing of the award, and the value of the award at the time of grant. The maximum number of performance units that may be awarded under the Participation Plan is 87,500,000. The performance units generally mature over a 44-month period of time which the Compensation Committee believes acts as an incentive for participants to remain in our employ and to strive to create value throughout the investment cycle. Subject to certain thresholds, payment on the performance units is contingent upon the occurrence of either (i) a sale of some or all of the Company’s common stock by its stockholders or (ii) Ryerson Holding Corporation’s payment of a cash dividend. The Participation Plan will expire on February 15, 2014 (or earlier if terminated by the Compensation Committee prior to February 15, 2014) and all performance units will terminate upon the expiration of the Participation Plan. Performance units are generally forfeited upon a participant’s termination of employment. Before their termination, Messrs. Heilmann and Rogers each held grants of 8,750,000 performance units, which units were forfeited upon termination. No performance units were granted in 2012, although Mr. Arnold and Mr. Lehner are each eligible to receive a number of performance units that each represents 1% of the management allocation pursuant to their respective employment letters (described below).
Retirement Benefits
Ryerson currently sponsors a qualified defined benefit pension plan, which was frozen as of December 31, 1997. The plan is described in further detail below under the caption “Narrative Disclosure of the Pension Benefits Table.”
Ryerson’s tax-qualified employee savings and retirement plan (“401(k) Plan”) covers certain full and part-time employees, including our named executive officers. Under the 401(k) Plan, employees may elect to reduce their current compensation up to the statutorily prescribed annual limit and have the amount of such reduction contributed to the 401(k) Plan. The Ryerson Board believes that the 401(k) Plan provides an important and highly valued means for employees to save for retirement.
The Ryerson Board of Directors reviewed the basic employee matching contribution policy under the 401(k) Plan in 2012 and concluded that it was competitive as compared to that of other employers. With respect to the 401(k) Plan, in 2012, we matched 100% of the first 4% of the named executive officers’ contributed base salary and 50% of the contributions of the 5th and 6th percent of the named executive officers’ contributed base salary. Except for Mr. Johnson, all of our named executive officers participated in the 401(k) Plan on the same basis as our other employees in 2012.
Ryerson also maintains a nonqualified savings plan, which is an unfunded, nonqualified plan that allows highly compensated employees who make the maximum annual 401(k) contributions allowed by applicable law to the 401(k) Plan to make additional deferrals in excess of the statutory limits. We match up to 4% of all contributed base salary of the participants. The Ryerson Board believes that our nonqualified savings plan provides an enhanced opportunity for our eligible employees, including our named executive officers, to plan for and meet their retirement savings needs. Messrs. Rogers and Heilmann participated in this plan on the same terms as other eligible employees in 2012.
86
Table of Contents
Perquisites and Other Benefits
Except for Mr. Johnson, all of our named executives were eligible for coverage under the Company’s health insurance programs, and Company-provided life insurance, short-term disability and long term disability benefits.
Mr. Lehner’s employment letter provides payments for 12 months of temporary housing in Chicago, weekly round trip airfare to Ohio and payments pursuant to the relocation policy which provided for payment of or reimbursement for certain expenses such as moving expenses, buying or selling a home, and a tax gross-up for any income related to such relocation payments and reimbursements. The Ryerson Board believed that Mr. Lehner should not suffer any adverse financial impact due to his relocation from Ohio to Illinois.
The terms of Mr. Johnson’s contract provided for housing, bi-monthly travel to/from Chicago, Illinois and Orange County, California and reimbursement of certain other travel expenses which was capped in the aggregate at $8,000 per month. The Ryerson Board believed that Mr. Johnson should not suffer any adverse financial impact due to his commute from California to Illinois.
Employment/Severance, Non-compete, Change in Control and Non-solicitation Agreements
Ryerson Inc. is a party to a letter agreement with Mr. Arnold which provides for at-will employment, an annual base salary of $750,000 per year and a target annual bonus opportunity equal to 100% of his base salary, based on the achievement of targets established pursuant to the AIP. Additionally, Mr. Arnold is eligible to receive an allocation of a number of performance units under the Participation Plan that represents 1% of the management allocation. The offer letter also provides that we and Mr. Arnold will work together to structure an additional incentive compensation arrangement that will entitle Mr. Arnold to an after-tax economic return of between $2.8 and $3.2 million upon the occurrence of a liquidity event. In addition, the employment letter provides that Mr. Arnold is entitled to six weeks’ paid vacation.
In the event that Mr. Arnold’s employment is terminated by us without cause, he will, subject to his execution and non-revocation of a general release in favor of us and our affiliates, be entitled to continue to receive his base salary payable in installments in accordance with normal payroll practices for the lesser of (i) the 52-week period following such termination and (ii) the period beginning on the date of such termination and ending on the date on which Mr. Arnold secures employment, either as an employee or an independent contractor, with Platinum Equity.
Ryerson Inc. is a party to a letter agreement with Mr. Lehner, which provides for at-will employment, a base salary of $450,000 per year and a target annual bonus opportunity equal to 75% of his base salary, based on the achievement of targets established pursuant to the AIP. Mr. Lehner’s employment letter provides for a one-time $200,000 gross payment which shall be repayable if Mr. Lehner leaves Ryerson Inc. within 2 years of his start date without “good reason.” Further, the employment letter provides that Mr. Lehner be provided with certain temporary housing and relocation expenses in connection with his move from Ohio to Illinois. Additionally, Mr. Lehner is eligible to receive an allocation of a number of performance units under the Participation Plan that represents 1% of the management allocation. In the event that Mr. Lehner’s employment is terminated by us without cause, he will, subject to his execution and non-revocation of a post-employment non-competition agreement and a general release in favor of us and our affiliates, be entitled to continue to receive his base salary, payable in installments in accordance with the normal payroll practices, for the lesser of (i) the 52-week period immediately following such termination and (ii) the period beginning on the date of such termination and ending on the date on which Mr. Lehner secures employment, either as an employee or an independent contractor, with Platinum.
During 2012, the terms of employment for Mr. Rogers were governed by employment/severance, non-compete, confidentiality and similar arrangements with Ryerson Inc., pursuant to which Mr. Rogers served as
87
Table of Contents
Chief Financial Officer, which arrangements set his title, base salary, target cash AIP bonus, and other compensation elements, and imposes post-termination confidentiality, non-compete, and non-solicitation obligations that apply following the termination of an executive’s employment for any reason. The employment agreement sets a minimum base salary and target bonus, but the compensation paid to him exceeded the minimum amounts provided in the employment agreement. Additionally, Mr. Rogers’ employment agreement provided for severance upon a termination by us without cause or by him for good reason. On April 12, 2012, Mr. Rogers terminated his employment voluntarily and therefore the Company was under no obligation to pay severance.
Ryerson Inc. was a party to an employment letter with Mr. Heilmann which provided for at-will employment, a base salary of $350,000 and a target AIP bonus of 100% of base salary. Additionally, the employment letter provided that Mr. Heilmann be provided with certain temporary housing and relocation expenses in connection with his move from California to Illinois. Because Mr. Heilmann’s employment was terminated for reasons other than cause, he was paid $344,858.87 as an enhanced 52 weeks of severance pay based on his weekly base pay rate and received medical and dental benefits until January 31, 2013 pursuant to our severance plan. Mr. Heilmann is subject to invention assignment provisions and confidentiality provisions which run for a 3-year period following any termination of employment, as well as post-termination non-compete and non-solicitation covenants which run for a 12-month period immediately following any termination.
Ryerson Inc. was a party to a letter agreement with Mr. Johnson, which provided for compensation of $20,000 per month for the first three months. After completion of the first 3 months, Mr. Johnson’s compensation would increase to $25,000 per month. Additionally, the contract provided for a $25,000 bonus payment to Mr. Johnson after the completion of the first 3 months. The agreement had a minimum term of 90 days, after which it could be terminated by either party upon 30 days’ notice. Mr. Johnson’s agreement did not provide for any participation in the AIP.
The Ryerson Board believes that employment agreements with our named executive officers are valuable tools to both enhance our efforts to retain these executives and to protect our competitive and confidential information. The estimates of the value of the benefits potentially payable under these agreements upon a termination of employment or a change of control are set out below under the captions “Potential Payments Upon Termination or Change in Control.”
Stock Incentive Plan
We intend to adopt, prior to effectiveness, a stock incentive plan that will afford more flexibility to our compensation committee by allowing grants of a wide variety of equity awards to our key employees, directors and consultants, including incentive and nonqualified stock options, shares of restricted stock, restricted stock units, stock appreciation rights, performance awards and other awards that are valued by reference to, or otherwise based on, the fair market value of our common stock. This plan is designed to assist us in attracting, retaining, motivating and rewarding key employees, directors, and consultants, and promoting the creation of long-term value for our public stockholders by closely aligning the interests of the participants with those of our public stockholders.
Our compensation committee will administer the stock incentive plan and will be authorized to, among other things, designate participants, grant awards, determine the number of shares subject to awards and the terms and conditions relating to such awards, prescribe award agreements, interpret the plan, establish, amend and rescind any rules and regulations relating to the plan and to make any other determinations that it deems necessary or advisable for the administration of the plan. The compensation committee may also delegate to our officers or employees, or other committees, subject to applicable law, the authority, subject to such terms as the compensation committee determines appropriate, to perform such functions, including but not limited to administrative functions, including the appointment of agents to assist in the administration of the plan. Any action of the compensation committee (or its authorized delegates) will be final, conclusive and binding on all persons, including participants and their beneficiaries.
88
Table of Contents
The total number of shares of our common stock that we plan to make available for issuance or delivery under the plan will be shares, subject to adjustment in the event of any stock split, reverse stock split, reorganization, recapitalization, merger, consolidation, combination, share exchange or any other similar change in our capitalization, or in connection with any extraordinary dividend declared and paid in respect of shares of our common stock. For the purpose of determining the remaining shares of common stock available for grant under the plan, to the extent that an award expires or is canceled, forfeited, settled in cash or otherwise terminated without a delivery to the participant of the full number of shares to which the award related, the undelivered shares will again be available for grant. Similarly, shares withheld in payment of the exercise price of, or taxes relating to, an award, and shares equal in number to those surrendered in payment of any exercise price or taxes relating to an award shall be deemed to constitute shares not delivered to the participant and shall be deemed to be available again for future grants of awards under the plan. In order to qualify certain awards under the plan as “performance-based compensation” within the meaning of Section 162(m) of the Internal Revenue Code of 1986, as amended, or the Code, as of the first date required by Section 162(m) of the Code, no employee shall be eligible to be granted during any calendar year options, performance awards or stock appreciation rights covering more than the maximum number of shares of our common stock then-available for issue under the plan.
The plan provides for the grant of both incentive stock options, within the meaning of Section 422(b) of the Code, and non-qualified stock options. Stock options will vest in accordance with the terms of the applicable award agreement. Options granted under the plan will expire no later than the tenth (10th) anniversary of the applicable date of grant, except that, to the extent that incentive stock options are granted to a ten percent (10%) stockholder, such options will expire after five (5) years from the date of grant. Options will have an exercise price determined by the compensation committee at the time of grant, although options intended to not be considered “nonqualified deferred compensation” within the meaning of Section 409A of the Code, or to qualify as “performance-based compensation” within the meaning of Section 162(m) of the Code, will have an exercise price that is not less than the fair market value of our common stock on the grant date. The term “fair market value” is defined as the closing price of our common stock as of any particular date on the principal national securities exchange on which our common stock is listed and traded on such date, or if our common stock is not listed on an exchange, the amount determined by our Board in good faith and in a manner consistent with Section 409A of the Code to be the fair market value.
The stock incentive plan also expressly permits the compensation committee to grant shares of restricted stock, which generally refers to shares of our common stock that are subject to vesting conditions or other lapsing or repurchase rights upon a termination of a recipient’s employment, which conditions or rights are determined by the compensation committee at the time of award, and performance awards, which may be designated as performance units that have an initial value that is set by the compensation committee at the time of grant, or as performance shares that have an initial value equal to the fair market value of our common stock on the date of grant. Performance awards may be settled in cash, shares of our common stock or other awards (or a combination thereof). The performance objectives and other terms and conditions that must be satisfied in order for performance awards to become vested and payable are determined by the compensation committee at the time of award. Performance objectives may be described in terms of Company-wide objectives or objectives that are related to the performance of an individual participant or the participant’s employer, division, department or function within the Company or the participant’s employer. Performance objectives may be measured on an absolute or relative basis, and relative performance may be measured by comparison to a group of peer companies or to a financial market index. Performance objectives shall be limited to specific levels of, or increases in, one or more of the following: return on equity; diluted earnings per share; net earnings; total earnings; earnings growth; return on capital; working capital turnover; return on assets; earnings before interest and taxes; earnings before interest, taxes, depreciation, and amortization; sales; sales growth; gross margin; return on investment; increase in the fair market value per share; share price (including but not limited to growth measures and total stockholder return); operating profit; cash flow (including but not limited to operating cash flow and free cash flow); cash flow return on investment (which equals cash flow divided by total capital); inventory turns; financial return ratios; total return to shareholders; market share; earnings measures/ratios; economic value added; balance sheet measurements including but not limited to receivable turnover; internal rate
89
Table of Contents
of return; and expense targets. The Company may specify minimum acceptable levels of achievement below which no payment of awards will occur, and may establish formulas to determine the payment of awards if performance exceeds such minimum levels but falls short of the specified maximum levels of achievement. The compensation committee may adjust performance objectives and the related minimum acceptable level of achievement if it determines, in its discretion, that events or transactions have occurred after the applicable date of grant of a performance award that are unrelated to the performance of the Company or the participant and result in a distortion of the performance objectives or the related minimum acceptable level of achievement, including unusual or non-recurring events such as restructurings or discontinued operations, an event either not directly related to the operations of the Company or not within the reasonable control of the Company’s management or changes in applicable tax laws, regulations or accounting principles.
The compensation committee may also grant other awards that may be denominated in, payable in, valued in whole or in part by reference to or otherwise based on or related to our common stock, including restricted stock units and stock appreciation rights. Such awards will be subject to terms and conditions that are determined by the compensation committee at the time of the award.
The compensation committee may, in the event of a corporate event (as defined in the plan), provide that any outstanding awards, whether vested or unvested, be assumed or substituted, be accelerated as of the consummation of the corporate event, be cancelled as of the consummation of the corporate event and that holders of cancelled awards receive a payment in respect of such cancellation based on the amount of per-share consideration being paid in connection with the corporate event less, in the case of options and other awards subject to exercise, the applicable exercise price, or be replaced with a cash incentive program that preserves the value of replaced awards and contains identical vesting conditions.
Our Board will have the ability to amend the stock incentive plan or any awards granted thereunder at any time, provided that no amendment will be made that impairs the rights of the holder of any award. Our Board may also suspend or terminate the stock incentive plan at any time, and, unless sooner terminated, the stock incentive plan shall terminate on the day before the tenth (10th) anniversary of the date the stock incentive plan is adopted by our Board. All awards granted under the plan will be subject to incentive compensation clawback and recoupment policies implemented by our Board from time to time.
We intend to require participants in our Participation Plan to waive any and all rights thereunder in connection with their receipt of any award under the stock incentive plan and intend to terminate the Participation Plan following receipt of such waiver from each participant therein.
Compensation Risk Management
We have reviewed our compensation policies and practices and have determined that those policies and practices do not subject us to any material risk.
90
Table of Contents
Executive Compensation
The following table shows compensation of our principal executive officer, our principal financial officer, and our other named executive officers.
2012 Summary Compensation Table
| Name and Principal Position |
Year | Salary ($) |
Non-Equity Incentive Plan Compensation ($) |
Change in Pension and Nonqualified Deferred Compensation Earnings ($) (3) |
All other Compensation ($) (4) |
Total ($) (6) |
||||||||||||||||||
| Michael C. Arnold— President and Chief Executive Officer |
|
2012 2011 |
|
|
750,006 721,160 |
|
|
— 437,970 |
|
|
— — |
|
|
10,001 9,801 |
|
|
760,007 1,168,931 |
| ||||||
| Edward J. Lehner— Executive Vice President and Chief Financial Officer(1) |
2012 | 178,269 | — | — | 263,539 | 441,808 | ||||||||||||||||||
| Terence R. Rogers— Former Chief Financial Officer(2) |
|
2012 2011 2010 |
|
|
121,364 354,620 333,951 |
|
|
— 148,948 |
|
|
16,977 6,765 |
|
|
5,392 16,313 20,579 |
|
|
143,733 526,646 540,202 |
| ||||||
| William S. Johnson Interim Former Chief Financial Officer(2) |
2012 | 171,887 | 25,000 | — | 60,626 | 257,513 | ||||||||||||||||||
| Matthias L. Heilmann— Former Chief Operating Officer(5) |
|
2012 2011 |
|
|
69,564 384,068 359,649 |
|
|
— 224,718 |
|
|
— — — |
|
|
346,857 18,547 105,166 |
|
|
416,421 627,333 722,065 |
| ||||||
| (1) | Edward J. Lehner became the Executive Vice President and Chief Financial Officer on August 1, 2012. |
| (2) | During 2012, Mr. Rogers served as the Chief Financial Officer during the period from January 1, 2012 until resigning on April 12, 2012. Mr. Johnson served as Interim Chief Financial Officer from April 12, 2012 until the election of Mr. Lehner as Chief Financial Officer on August 1, 2012. |
| (3) | Shows the aggregate change in the actuarial present value of the named executive officer’s accumulated benefit under our qualified pension plan and supplemental pension plan from December 31, 2011 (the pension plan measurement date used for financial statement reporting purposes with respect to our audited financial statements for 2011) to December 31, 2012 (the pension plan measurement date used for financial statement reporting purposes with respect to our audited financial statements for 2012). We do not pay above-market or preferential earnings on compensation deferred under our nonqualified savings plan. |
| (4) | In 2012, we contributed to our qualified savings plan $10,001, $7,785, $5,392 and $1,998 for Messrs. Arnold, Lehner, Rogers and Heilmann, respectively, and did not make any contributions to any non-qualified plan account. Mr. Lehner’s other compensation also includes $32,770 for relocation expenses, a $22,984 tax gross up related to the relocation expenses and a $200,000 signing bonus. Mr. Johnson’s other compensation also includes $60,626 for housing and travel expenses. Mr. Heilmann’s other compensation also includes $344,859 for severance payments. |
| (5) | Mr. Heilmann’s employment with us terminated effective January 31, 2012, as a result of our election to eliminate our Chief Operating Officer position. |
91
Table of Contents
| Grant Date |
Estimated Possible Payouts Under Non-Equity Incentive Plan Awards |
|||||||||||||||||||
| Threshold ($) |
Target ($) |
Maximum ($) |
||||||||||||||||||
| Michael C. Arnold |
AIP | 03/29/12 | 375,000 | 750,000 | 1,500,000 | |||||||||||||||
| Edward J. Lehner |
AIP | 08/01/12 | 168,750 | 337,500 | 675,000 | |||||||||||||||
| Terence R. Rogers |
AIP | N/A | N/A | N/A | N/A | |||||||||||||||
| Mathias Heilmann |
AIP | N/A | N/A | N/A | N/A | |||||||||||||||
| William S. Johnson |
AIP | N/A | N/A | N/A | N/A | |||||||||||||||
Narrative Relating to Summary Compensation Table and
Grants of Plan-based Awards Table
Employment Agreements
Ryerson Inc. is a party to a letter agreement with Mr. Arnold, which provides for at-will employment, an annual base salary of $750,000 per year and has a target annual bonus opportunity equal to 100% of his base salary, based on the achievement of targets established pursuant to the AIP. Additionally, Mr. Arnold is eligible to receive an allocation of a number of performance units under the Participation Plan that represents 1% of the management allocation. The offer letter also provides that we and Mr. Arnold will work together to structure an additional incentive compensation arrangement that will entitle Mr. Arnold to an after-tax economic return of between $2.8 and $3.2 million upon the occurrence of a liquidity event. In addition, the employment letter provides that Mr. Arnold is entitled to six weeks’ paid vacation.
In the event that Mr. Arnold’s employment is terminated by us without cause, he will, subject to his execution and non-revocation of a general release in favor of us and our affiliates, be entitled to continue to receive his base salary, payable in installments in accordance with normal payroll practices, for the lessor of (i) the 52-week period immediately following such termination and (ii) the period beginning on the date of such termination and ending on the date on which Mr. Arnold secures employment, either as an employee or an independent contractor, with Platinum.
Ryerson Inc. is a party to a letter agreement with Mr. Lehner, which provides for at-will employment, a base salary of $450,000 per year and a target annual bonus opportunity equal to 75% of his base salary, based on the achievement of targets established pursuant to the AIP. Mr. Lehner’s employment letter provides for a one-time $200,000 gross payment which shall be repayable if Mr. Lehner leaves Ryerson Inc. within 2 years of his start date without “good reason.” Further, the employment letter provides that Mr. Lehner be provided with certain temporary housing and relocation expenses in connection with his move from Ohio to Illinois. Additionally, Mr. Lehner is eligible to receive an allocation of a number of performance units under the Participation Plan that represents 1% of the management allocation. In the event that Mr. Lehner’s employment is terminated by us without cause, he will, subject to his execution and non-revocation of a post-employment non-competition agreement and a general release in favor of us and our affiliates, be entitled to continue to receive his base salary, payable in installments in accordance with normal payroll practices, for the lesser of (i) the 52-week period immediately following such termination and (ii) the period beginning on the date of such termination and ending on the date on which Mr. Lehner secures employment, either as an employee or an independent contractor, with Platinum.
During 2012, the terms of employment for Mr. Rogers were governed by employment/severance, non-compete, confidentiality, and similar arrangements with Ryerson Inc., pursuant to which Mr. Rogers served as
92
Table of Contents
Chief Financial Officer, which arrangements set his title, base salary, target cash AIP bonus, and other compensation elements, and imposes post-termination confidentiality, non-compete, and non-solicitation obligations that apply following the termination of an executive’s employment for any reason. The employment agreement sets a minimum base salary and target bonus, but the compensation paid to him exceeded the minimum amounts provided in the employment agreement. Additionally, Mr. Rogers’ employment agreement provided for severance upon a termination by us without cause or by him for good reason. On April 12, 2012, Mr. Rogers terminated his employment voluntarily and therefore the Company was under no obligation to pay severance.
Ryerson Inc. was a party to an employment letter with Mr. Heilmann, which provided for at-will employment, a base salary of $350,000 and a target AIP bonus of 100% of base salary. Additionally, the employment letter provided that Mr. Heilmann be provided with certain temporary housing and relocation expenses in connection with his move from California to Illinois. Because Mr. Heilmann’s employment was terminated for reasons other than cause, he was paid $344,859 as an enhanced 52 weeks of severance pay based on his weekly base pay rate and received medical and dental benefits until January 31, 2013 pursuant to our severance plan. Mr. Heilmann is subject to invention assignment provisions and confidentiality provisions which run for a 3-year period following any termination of employment, as well as post-termination non-compete and non-solicitation covenants which run for a 12-month period immediately following any termination.
Ryerson Inc. was a party to a letter agreement with Mr. Johnson, which provided for compensation of $20,000 per month for the first three months. After completion of the first 3 months, Mr. Johnson’s compensation would increase to $25,000 per month. Additionally, the contract provided for a $25,000 bonus payment to Mr. Johnson after the completion of the first 3 months. The agreement had a minimum term of 90 days, after which it could be terminated by either party upon 30 days’ notice. Mr. Johnson’s agreement did not provide for any participation in the AIP.
Outstanding Equity Awards at Fiscal Year-End 2012
There were no outstanding equity awards at fiscal year-end 2012.
Pension Benefits
| Name |
Plan Name | Number of Years Credited Service (#)(1) |
Present Value of Accumulated Benefit ($)(2) |
|||||||
| Michael C. Arnold |
Pension Plan | — | — | |||||||
| Edward J. Lehner |
Pension Plan | — | — | |||||||
| Terence R. Rogers |
Pension Plan | 3.67 | 67,924 | |||||||
| Matthias Heilmann |
Pension Plan | — | — | |||||||
| William S. Johnson |
Pension Plan | — | — | |||||||
| (1) | Computed as of December 31, 2012, the same pension plan measurement date used for financial statement reporting purposes with respect to our audited financial statements for the last completed fiscal year. |
| (2) | The actuarial present value of the named executive officer’s accumulated benefit under the relevant plan, assuming retirement at age 65 with at least 5 years of credited service, computed as of December 31, 2012, the same pension plan measurement date used for financial statement reporting purposes with respect to our audited financial statements for the last completed fiscal year. The valuation method and material assumptions applied in quantifying the present value of the current accrued benefits under the Pension Plan include, amongst other assumptions, that the discount rate used to value the present value of accumulated benefits is 4.00%. |
93
Table of Contents
Narrative Disclosure of the Pension Benefits Table
Qualified Pension Plan
We froze benefit and service accruals under our qualified pension plan (the “Pension Plan”), effective as of December 31, 1997 and most participants, including our named executive officers, no longer accrue any benefit under these plans.
Full pension benefits are payable to eligible employees who, as of the date of separation from employment, are (i) age 65 or older with at least 5 years of vesting service, (ii) age 55 or older with at least 10 years of vesting service, or (iii) any age with at least 30 years of vesting service. Benefits may be reduced depending on age and service when an individual retires and/or chooses to have benefit payments begin. Benefits are reduced under (ii) above if voluntary retirement commences prior to the employee reaching age 62 with at least 15 years of vesting service. Benefits are not reduced if the age and service conditions under (i) or (iii) are met.
In general, benefits for salaried employees are based on two factors: (i) years of benefit service prior to the freeze date of the pension benefit, and (ii) average monthly earnings, based on the highest 36 months of earnings during the participant’s last ten years of service prior to the freeze date of the participant’s pension benefit.
Nonqualified Deferred Compensation
| Name |
Executive Contributions in Last Fiscal Year ($) |
Registrant Contributions in Last Fiscal Year ($) |
Aggregate Earnings in Last Fiscal Year ($)(3) |
Aggregate Balance at Last Fiscal Year End ($) |
||||||||||||
| Michael C. Arnold |
— | — | — | — | ||||||||||||
| Edward J. Lehner |
— | — | — | — | ||||||||||||
| Terence R. Rogers(1) |
— | — | — | — | ||||||||||||
| Matthias Heilmann |
— | — | 53 | 4,216 | ||||||||||||
| William S. Johnson(2) |
— | — | — | — | ||||||||||||
| (1) | Upon his departure on April 12, 2012, Mr. Rogers withdrew $79,704, which represented a disbursement of the entire balance of his nonqualified savings plan account. |
| (2) | Mr. Johnson was not eligible to participate in the nonqualified savings plan. |
| (3) | All account balances are deferred to a cash account which is credited with interest at the rate paid by our 401(k) Plan’s Managed Income Portfolio Fund II fund, which in 2012 ranged from 0.10% to 0.12% compounded monthly. The amounts reported in this column consist of interest earned on such deferred cash accounts. |
Narrative Disclosure of Nonqualified Deferred Compensation
The Internal Revenue Code imposes annual limits on employee contributions to our 401(k) Plan. Our nonqualified plan allows highly compensated employees who make the maximum annual 401(k) contributions to defer, on a pre-tax basis, amounts in excess of the limits applicable to deferrals under our 401(k) Plan. This nonqualified savings plan allows deferred amounts to be notionally invested in the Managed Income Portfolio Fund II (or any successor fund) that is available to the participants in our 401(k) Plan.
Generally, each of our named executive officers (other than Mr. Johnson) is eligible to participate in, our nonqualified savings plan. Our named executive officers will be entitled to the vested balance of their respective accounts when they retire or otherwise terminate employment. Participants are generally permitted to choose whether the benefits paid following their retirement will be paid in a lump sum or installments, with all amounts to be paid by the end of the calendar year in which the employee reaches age 75. For participants terminating employment for reasons other than retirement, the account balance is payable in a lump sum by no later than 60 days after the 1-year anniversary of the termination of employment.
94
Table of Contents
Potential Payments Upon Termination or Change in Control
Each of our named executive officers have entered into agreements, the material terms of which have been summarized above under the caption “Narrative Disclosure Relating to the Summary Compensation Table and Grants of Plan-based Awards Table.” Upon certain terminations of employment, our named executive officers (employed as of December 31, 2012) are entitled to payments of compensation and certain benefits. The table below reflects the amount of compensation and benefits payable to each named executive officer who was employed as of December 31, 2012 in the event of (i) termination for cause or without good reason (“voluntary termination”), (ii) termination other than for cause or with good reason (“involuntary termination”), (iii) termination by reason of an executive’s death or disability, or (iv) a change in control. The amounts shown assume that the applicable triggering event occurred on December 31, 2012, and therefore, are estimates of the amounts that would be paid to the named executive officers upon the occurrence of such triggering event.
| Name |
Reason for Termination |
Cash Severance ($) |
Continued Welfare Benefits ($) |
Total ($) |
||||||||||
| Mr. Arnold |
Voluntary | — | — | — | ||||||||||
| Involuntary | 750,000 | (1) | — | 750,000 | ||||||||||
| Death or Disability | — | — | — | |||||||||||
| Change in Control(2)(3) | — | — | — | |||||||||||
| Mr. Lehner |
Voluntary | — | — | — | ||||||||||
| Involuntary |
450,000 | (1) | — | 450,000 | ||||||||||
| Death or Disability |
— | — | — | |||||||||||
| Change in Control(3) |
— | — | — | |||||||||||
| (1) | Consists of 52 weeks of severance pay based on weekly base pay rate. |
| (2) | We have an obligation to structure an additional compensation arrangement that will entitle Mr. Arnold to an after-tax economic return of between $2.8 million and $3.2 million upon the occurrence of a liquidity event. However, no arrangement has been negotiated to date. |
| (3) | No performance units were granted in 2012, though Mr. Arnold and Mr. Lehner are eligible to receive a number of performance units that each represents 1%, respectively of the management allocation pursuant to their employment letters. |
Narrative Disclosure of Payments Upon Termination
Mr. Heilmann’s employment ended involuntarily on January 31, 2012 and pursuant to the terms of his employment letter we have made bi-weekly severance payments that totaled $344,859. We also provided him with $7,987 in continued health benefits.
Mr. Rogers’ employment ended voluntarily and therefore we were under no obligation to pay, nor did we pay, any severance to him. Upon his departure, Mr. Rogers withdrew $79,704 as a distribution for his nonqualified deferred savings plan account.
95
Table of Contents
We did not pay our current directors any compensation for serving on the Board of Directors during 2012.
96
Table of Contents
CERTAIN RELATIONSHIPS AND RELATED PARTY TRANSACTIONS
Services Agreement
JT Ryerson, one of our subsidiaries, is party to a corporate advisory services agreement (the “Services Agreement”) with Platinum Advisors, an affiliate of Platinum. Under the terms of the Services Agreement, Platinum Advisors provides to JT Ryerson certain general business, management, administrative and financial advice. In consideration of these and other services, JT Ryerson pays an annual advisory fee to Platinum Advisors of no greater than $5 million. The Services Agreement will continue in effect until terminated by Platinum Advisors. In addition to the fees paid to Platinum Advisors pursuant to the Services Agreement, JT Ryerson will pay Platinum’s out-of-pocket expenses incurred in connection with providing management services to JT Ryerson.
In connection with this offering, Platinum Advisors and JT Ryerson intend to terminate the Services Agreement, pursuant to which JT Ryerson will pay Platinum Advisors $ million as consideration for terminating the fee payable thereunder.
Participation Plan
In February of 2009, we adopted the Rhombus Holding Corporation 2009 Participation Plan (the “Participation Plan”), pursuant to which participants are granted performance units, the value of which appreciate when and as our value increases from and after the date of grant, and it is this appreciation in value which is the basis upon which incentive compensation may become payable upon the occurrence of certain qualifying events, which are described below. On February 16, 2009, the Compensation Committee granted 8,750,000 performance units to Mr. Rogers. These performance units matured in four equal installments; the first installment matured on the date of grant, the second matured on October 31, 2009, the third installment matured on October 31, 2010 and the remaining installment matured on October 31, 2011. Subject to certain thresholds, payment on the performance units is contingent upon the occurrence of either (i) a sale of some or all of our common stock by our stockholders, or (ii) our payment of a cash dividend. The Participation Plan will expire February 15, 2014 and all performance units will terminate upon the expiration of the Participation Plan. Performance units are generally forfeited upon a participant’s termination of employment. We intend to require participants in our Participation Plan to waive any and all rights thereunder in connection with their receipt of any award under the stock incentive plan that we intend to adopt prior to completion of this offering and intend to terminate the Participation Plan following receipt of such waiver from each participant therein. For additional information on the stock incentive plan, see “Executive Compensation—Stock Incentive Plan.”
Investor Rights Agreement
Ryerson Holding and Platinum are party to an investor rights agreement and have agreed to enter into an amended and restated investor rights agreement (the “Investor Rights Agreement”) upon the consummation of this offering that will provide for, among other things, demand, piggyback and Form S-3 registration rights and board nomination rights.
The Investor Rights Agreement will provide that Platinum may make written demands of us to require us to register the shares of our common stock owned by Platinum; provided, however that we will not be obligated to effect more than two such demand registrations. In addition, Platinum will have piggyback registration rights entitling them to require us to register shares of our common stock owned by them in connection with any registration statements filed by us after the completion of this offering, subject to certain exceptions. Upon the closing of this offering, we have agreed to use commercially reasonable efforts to qualify for registration on Form S-3 for secondary sales. After we have qualified for the use of Form S-3, Platinum will, subject to certain exceptions, have the right to request an unlimited number of registrations on Form S-3. We will not be obligated to effect a registration unless certain pricing or timing conditions are first satisfied.
The Investor Rights Agreement provides that we will indemnify Platinum against losses suffered by it in connection with any untrue or alleged untrue statement of a material fact contained in any prospectus, offering
97
Table of Contents
circular, or other document delivered or made available to investors (or in any related registration statement or any amendment or supplement thereto) or any omission or alleged omission to state therein a material fact required to be stated therein or necessary to make the statement therein not misleading, except insofar as the same may be caused by or contained in any information furnished in writing to us by Platinum for use therein.
The Investor Rights Agreement will provide that for so long as Platinum collectively beneficially owns at least (i) 30% of the voting power of the outstanding capital stock of the Company, Platinum will have the right to nominate for election to the board of directors of the Company no fewer than that number of directors that would constitute a majority of the number of directors if there were no vacancies on the board, (ii) at least 15% but less than 30% of the voting power of the outstanding capital stock of the Company, Platinum will have the right to nominate two directors and (iii) at least 5% but less than 15% of the voting power of the outstanding capital stock of the Company, Platinum will have the right to nominate one director. The agreement will also provide that if the size of the board of directors is increased or decreased at any time, Platinum’s nomination rights will be proportionately increased or decreased, respectively, rounded up to the nearest whole number, except that if the board of directors increases its size within 180 days of the date of the agreement, Platinum will have the right to designate director nominees to fill each newly created directorship.
The Investor Rights Agreement was negotiated among management and Platinum, and we believe the Investor Rights Agreement is on arm’s-length terms.
Distributions
In July 2009, we made distributions in an aggregate amount of approximately $56.5 million to our stockholders.
On January 29, 2010, we made a distribution in an aggregate amount of approximately $213.8 million to our stockholders with the proceeds from the issuance of the Ryerson Holding Notes.
On December 21, 2012, we made a distribution of $35.0 million to our stockholders.
Policies and Procedures Regarding Transactions with Related Persons
Upon consummation of the offering, our Board of Directors will have adopted written policies and procedures for transactions with related persons. As a general matter, the policy will require the audit committee to review and approve or disapprove the entry by us into certain transactions with related persons. The policy will contain transactions which are pre-approved transactions. The policy will only apply to transactions, arrangements and relationships where the aggregate amount involved could reasonably be expected to exceed $120,000 in any calendar year and in which a related person has a direct or indirect interest. A related person is: (i) any director, nominee for director or executive officer of our company; (ii) any immediate family member of a director, nominee for director or executive officer; and (iii) any person, and his or her immediate family members, or entity, including affiliates, that was a beneficial owner of 5% or more of any of our outstanding equity securities at the time the transaction occurred or existed.
The policy will provide that if advance approval of a transaction subject to the policy is not obtained, it must be promptly submitted to the committee for possible ratification, approval, amendment, termination or rescission. In reviewing any transaction, the committee will take into account, among other factors the committee deems appropriate, recommendations from senior management, whether the transaction is on terms no less favorable than terms generally available to a third party in similar circumstances and the extent of the related person’s interest in the transaction. Any related person transaction must be conducted at arm’s length. Any member of the audit committee who is a related person with respect to a transaction under review may not participate in the deliberations or vote on the approval or ratification of the transaction. However, such a director may be counted in determining the presence of a quorum at a meeting of the audit committee that considers the transaction.
98
Table of Contents
PRINCIPAL AND SELLING STOCKHOLDERS
99% of our issued and outstanding 5,000,000 shares of common stock is beneficially owned by Platinum. The following table sets forth certain information regarding the beneficial ownership of our common stock as of November 1, 2013, and on an as adjusted basis to give effect to the closing of the offering, with respect to each person known by us to beneficially own more than 5% of our common stock and each person that will be a selling stockholder in this offering. None of our directors or executive officers beneficially owns any of our common stock and following the closing of this offering, no director or executive officer will beneficially own more than 1% of our common stock.
Beneficial ownership is determined in accordance with the rules and regulations of the SEC. The number of shares and percentages of beneficial ownership set forth below are based on 5,000,000 shares of our common stock outstanding as of November 1, 2013, with the number of shares and percentages of beneficial ownership being determined after giving effect to the for 1.00 stock split that we will effect prior to the closing of this offering. Except as indicated in the footnotes to this table and subject to applicable community property laws, upon the closing of this offering, the persons named in the table will have sole voting and investment power with respect to all shares of common stock listed as beneficially owned by them. As of November 1, 2013, there were nine registered holders of our common stock. For more information regarding our principal stockholder or any of the selling stockholders and the relationship they have with us, see “Certain Relationships and Related Party Transactions.”
| Prior to This Offering | After This Offering | |||||||||||||||||||||||
| Assuming the Underwriters’ Over-Allotment Option Is Not Exercised |
Assuming the Underwriters’ Over-Allotment Option Is Exercised in Full(5) |
|||||||||||||||||||||||
| Beneficial Owner |
Number of Shares Beneficially Owned |
Percent of Shares Beneficially Owned |
Number of Shares Beneficially Owned |
Percent of Shares Beneficially Owned |
Shares Offered Pursuant to the Underwriters’ Over-Allotment Option |
Number of Shares Beneficially Owned |
Percent of Shares Beneficially Owned |
|||||||||||||||||
| Platinum(1)(2) |
4,950,000 | 99 | % | 4,950,000 | % | % | ||||||||||||||||||
| Moelis(3)(4) |
50,000 | 1 | % | 50,000 | % | % | ||||||||||||||||||
| (1) | Consists of (i) 711,236.84 shares of common stock held by Platinum Equity Capital Partners, L.P.; (ii) 132,868.42 shares of common stock held by Platinum Equity Capital Partners-PF, L.P.; (iii) 195,394.74 shares of common stock held by Platinum Equity Capital Partners-A, L.P.; (iv) 2,211,674 shares of common stock held by Platinum Equity Capital Partners II, L.P.; (v) 358,366 shares of common stock held by Platinum Equity Capital Partners-PF II, L.P.; (vi) 350,460 shares of common stock held by Platinum Equity Capital Partners-A II, L.P.; and (vii) 990,000 shares of common stock held by Platinum Rhombus Principals, LLC. Platinum is the beneficial owner of each of the Platinum entities listed above and Tom Gores is the Chairman and Chief Executive Officer of Platinum Equity, LLC, which, through its affiliates, manages Platinum. Mr. Gores may be deemed to share voting and investment power with respect to all shares of common stock of Ryerson Holding held beneficially by Platinum. Mr. Gores disclaims beneficial ownership of all shares of common stock of Ryerson Holding that are held by each of the Platinum entities listed above with respect to which Mr. Gores does not have a pecuniary interest therein. Eva M. Kalawski, Mary Ann Sigler, Jacob Kotzubei and Robert L. Archambault are directors of Ryerson Holding and each disclaims beneficial ownership of any shares of common stock of Ryerson Holding that they may be deemed to beneficially own because of their affiliation with Platinum, except to the extent of any pecuniary interest therein. |
| (2) | Address is 360 North Crescent Drive, Beverly Hills, California 90210. |
| (3) | Consists of (i) 46,448 shares of common stock held by Moelis Capital Partners Opportunity Fund I, LP and (ii) 3,552 shares of common stock held by Moelis Capital Partners Opportunity Fund I-A, LP. Moelis & Company Holdings LLC is the beneficial owner of each of the Moelis entities listed above (together with all other affiliated investment funds, “Moelis”) and Kenneth D. Moelis is the Chief Executive Officer of |
99
Table of Contents
| Moelis & Company Holdings LLC, which, through controlled affiliates, manages Moelis. Mr. Moelis may be deemed to have voting and investment power with respect to all shares of common stock of Ryerson Holding held beneficially by Moelis. Mr. Moelis is also a limited partner of Moelis Capital Partner Opportunity Fund I-A, LP. Mr. Moelis disclaims beneficial ownership of all shares of common stock of Ryerson Holding that are held by each of the Moelis entities listed above with respect to which Mr. Moelis does not have a pecuniary interest therein. |
| (4) | Address is 399 Park Avenue, 5th Floor, New York, New York 10022. |
| (5) | To the extent the underwriters’ option to purchase additional shares is not exercised in full, the shares sold by the selling stockholders will be decreased on a pro rata basis. |
100
Table of Contents
General
The following summary describes the material terms of our capital stock. However, you should refer to the actual terms of the capital stock contained in our amended and restated certificate of incorporation and applicable law. We intend to amend and restate our certificate of incorporation and bylaws prior to consummation of this offering. A copy of our amended and restated certificate of incorporation and amended and restated bylaws will be filed as exhibits to the Registration Statement of which this prospectus is a part. The following description refers to the terms of our amended and restated certificate of incorporation. Our amended and restated certificate of incorporation provides that our authorized capital stock will consist of 100 million shares of common stock, par value $0.01 per share, and 7 million shares of preferred stock, par value $0.01 per share, that are undesignated as to series.
As of November 1, 2013, there were nine record holders of our common stock.
Common Stock
The holders of common stock are entitled to one vote for each share held of record on all matters submitted to a vote of stockholders and are not entitled to cumulative votes with respect to the election of directors. The holders of common stock are entitled to receive dividends as may be declared by our Board of Directors out of legally available funds. Upon our liquidation, dissolution or winding up, the holders of common stock are entitled to share ratably in all assets that are legally available for distribution after payment of all debts and other liabilities, subject to the prior rights of any holders of preferred stock then outstanding. The holders of common stock have no other preemptive, subscription, redemption, sinking fund or conversion rights. All outstanding shares of our common stock are fully paid and nonassessable. The shares of common stock to be issued upon completion of the offering will also be fully paid and nonassessable. The rights, preferences and privileges of holders of common stock are subject to, and may be negatively impacted by, the rights of the holders of shares of any series of preferred stock which we may designate and issue in the future.
Undesignated Preferred Stock
There will not be any shares of preferred stock outstanding upon the closing of the offering. Under our amended and restated certificate of incorporation, which will become effective simultaneously with the offering, our Board of Directors has the authority, without action by our stockholders, to designate and issue any authorized but unissued shares of preferred stock in one or more series and to designate the rights, preferences and privileges of each series, any or all of which may be greater than the rights of our common stock. It is not possible to state the actual effect of the issuance of any shares of preferred stock upon the rights of holders of our common stock until our board determines the specific rights of the holders of preferred stock. However, the effects might include, among other things, restricting dividends on the common stock, diluting the voting power of the common stock, impairing the liquidation rights of the common stock and delaying or preventing a change in control of our common stock without further action by our stockholders. We have no present plans to issue any shares of preferred stock.
Anti-Takeover Provisions of Delaware Law
We are subject to Section 203 of the Delaware General Corporation Law. In general, Section 203 prohibits a publicly held Delaware corporation from engaging in a business combination with an interested stockholder for a period of three years following the date the person became an interested stockholder, unless the business combination or the transaction in which the person became an interested stockholder is approved in a prescribed manner. Generally, a business combination includes a merger, asset or stock sale, or other transaction resulting in a financial benefit to the interested stockholder. Generally, an interested stockholder is a person who, together with affiliates and associates, owns or, in the case of affiliates or associates of the corporation, within three years prior to the determination of interested stockholder status, owned 15% or more of a corporation’s voting stock.
101
Table of Contents
The existence of this provision could have anti-takeover effects with respect to transactions not approved in advance by our Board of Directors, such as discouraging takeover attempts that might result in a premium over the market price of our common stock. For these purposes Platinum will not constitute “interested stockholders.”
Stockholders will not be entitled to cumulative voting in the election of directors. The authorization of undesignated preferred stock will make it possible for our Board of Directors to issue preferred stock with voting or other rights or preferences that could impede the success of any attempt to effect a change of control of our company. The foregoing provisions of our amended and restated certificate of incorporation and the Delaware General Corporation Law may have the effect of deterring or discouraging hostile takeovers or delaying changes in control of our company.
Charter and Bylaws Anti-Takeover Provisions
Our amended and restated certificate of incorporation and our amended and restated bylaws each provide that on and following the date that Platinum no longer beneficially owns a majority of the voting power of all of our capital stock, any action required or permitted to be taken by our stockholders at an annual meeting or special meeting of the stockholders may only be taken at such annual or special meeting, and not by written consent without a meeting, if it is properly brought before such annual or special meeting.
Our amended and restated certificate of incorporation provides that our Board of Directors will be divided into three classes of directors, with the number of directors in each class to be as nearly equal as possible. Our classified board staggers terms of the three classes and will be implemented through one, two and three-year terms for the initial three classes, followed in each case by full three-year terms. With a classified board, only one-third of the members of our Board of Directors will be elected each year. This classification of directors will have the effect of making it more difficult for stockholders to change the composition of our Board of Directors. Our amended and restated certificate of incorporation and our amended and restated bylaws provide that the number of directors will be fixed from time to time exclusively pursuant to a resolution adopted by our Board of Directors, but must consist of not less than three directors. This provision will prevent stockholders from circumventing the provisions of our classified board.
Our amended and restated certificate of incorporation provides that, on and following the date that Platinum no longer beneficially owns a majority of the voting power of all of our capital stock, the affirmative vote of the holders of at least 66 2/3% of the voting power of our issued and outstanding capital stock, voting together as a single class, is required for the following:
| • | alteration, amendment or repeal of the staggered Board of Directors provisions in our amended and restated certificate of incorporation; and |
| • | alteration, amendment or repeal of certain provisions of our amended and restated bylaws, including the provisions relating to our stockholders’ ability to call special meetings, notice provisions for stockholder business to be conducted at an annual meeting, requests for stockholder lists and corporate records, nomination and removal of directors and filling of vacancies on our Board of Directors. |
Our amended and restated certificate of incorporation provides for the issuance by the Board of Directors of up to 7 million shares of preferred stock, with voting power, designations, preferences and other special rights. The issuance of preferred stock could decrease the amount of earnings and assets available for distribution to the holders of common stock or could adversely affect the rights and powers, including voting rights, of holders of common stock. In certain circumstances, such issuance could have the effect of decreasing the market price of the common stock. Preferred stockholders could also make it more difficult for a third party to acquire our company. At the closing of this offering, no shares of preferred stock will be outstanding and we currently have no plans to issue any shares of preferred stock.
Our amended and restated bylaws establish an advance notice procedure for stockholders to bring matters before special stockholder meetings, including proposed nominations of persons for election to our Board of Directors. These procedures specify the information stockholders must include in their notice and the timeframe
102
Table of Contents
in which they must give us notice. At a special stockholder meeting, stockholders may only consider nominations or proposals specified in the notice of meeting. A special stockholder meeting for any purpose may only be called by our Board of Directors, our Chairman, our Chief Executive Officer or, prior to the date that Platinum no longer beneficially owns a majority of the voting power of all of our capital stock, the holders of a majority of the voting power of our then outstanding voting stock.
Our amended and restated bylaws do not give the Board of Directors the power to approve or disapprove stockholder nominations of candidates or proposals regarding other business to be conducted at a meeting. However, our amended and restated bylaws may have the effect of precluding the conduct of that item of business at a meeting if the proper procedures are not followed. These provisions may discourage or deter a potential third party from conducting a solicitation of proxies to elect its own slate of directors or otherwise attempting to obtain control of our company.
The foregoing provisions of our amended and restated certificate of incorporation, our amended and restated bylaws and the Delaware General Corporation Law may have the effect of deterring or discouraging hostile takeovers or delaying changes in control of the company.
Limitation on Liability and Indemnification of Directors and Officers
Our amended and restated certificate of incorporation and bylaws will limit our directors’ and officers’ liability to the fullest extent permitted under Delaware corporate law. Specifically, our directors and officers will not be liable to us or our stockholders for monetary damages for any breach of fiduciary duty by a director or officer, except for liability:
| • | for any breach of the director’s or officer’s duty of loyalty to us or our stockholders; |
| • | for acts or omissions not in good faith or which involve intentional misconduct or a knowing violation of law; |
| • | under Section 174 of the Delaware General Corporation Law; or |
| • | for any transaction from which a director or officer derives an improper personal benefit. |
If the Delaware General Corporation Law is amended to authorize corporate action further eliminating or limiting the personal liability of directors or officers, then the liability of a director or officer of the Company shall be eliminated or limited to the fullest extent permitted by the Delaware General Corporation Law, as so amended.
The provision regarding indemnification of our directors and officers in our amended and restated certificate of incorporation will generally not limit liability under state or federal securities laws.
Delaware law and our amended and restated certificate of incorporation and bylaws provide that we will, in certain situations, indemnify any person made or threatened to be made a party to a proceeding by reason of that person’s former or present official capacity with our company against judgments, penalties, fines, settlements and reasonable expenses including reasonable attorney’s fees. Any person is also entitled, subject to certain limitations, to payment or reimbursement of reasonable expenses in advance of the final disposition of the proceeding. In addition, Ryerson Inc. is party to certain indemnification agreements pursuant to which it has agreed to indemnify the employees who are party thereto.
The limitation of liability and indemnification provisions in our amended and restated certificate of incorporation may discourage stockholders from bringing a lawsuit against directors for breach of their fiduciary duty. These provisions may also have the effect of reducing the likelihood of derivative litigation against directors and officers, even though such an action, if successful, might otherwise benefit us and our stockholders. In addition, your investment may be adversely affected to the extent that, in a class action or direct suit, we pay the costs of settlement and damage awards against directors and officers pursuant to these indemnification provisions.
103
Table of Contents
Transfer Agent and Registrar
Our transfer agent and registrar for our common stock is American Stock Transfer & Trust Company, LLC.
Listing
At present, there is no established trading market for our common stock. We have applied to have our common stock listed on the NYSE under the symbol “RYI.”
104
Table of Contents
DESCRIPTION OF CERTAIN INDEBTEDNESS
Ryerson Credit Facility
General
As of September 30, 2013, we are party to the Ryerson Credit Facility, a senior secured asset-based revolving credit facility with Bank of America, N.A. that allows it to borrow up to $1.35 billion of revolving loans.
Availability under the Ryerson Credit Facility is determined by a U.S. and a Canadian borrowing base of specified percentages of Ryerson’s eligible inventories and accounts receivable, but in no event in excess of $1.35 billion. All borrowings under the Ryerson Credit Facility are subject to the satisfaction of customary conditions, including absence of a default and accuracy of representations and warranties. As of September 30, 2013, Ryerson Inc. had outstanding borrowings under the Ryerson Credit Facility of $318.5 million.
Interest and Fees
Borrowings under the Ryerson Credit Facility bear interest at a rate per annum equal to:
| • | in the case of borrowings in U.S. Dollars, the applicable margin plus, at Ryerson Inc.’s option, either (1) a base rate determined by reference to the prime rate of Bank of America, N.A. or (2) a LIBOR rate determined by reference to the costs of funds for deposits in the currency of such borrowing for the interest period relevant to such borrowing adjusted for certain additional costs; or |
| • | in the case of borrowings in Canadian Dollars, the applicable margin plus, at Ryerson Inc.’s option, either (1) a base rate determined by reference to the Canadian base rate of Bank of America-Canada, (2) a rate determined by reference to Canadian dollar bankers’ acceptances (the “BA rate”) or (3) a Canadian prime rate. |
Borrowings under the Ryerson Credit Facility are based on the base rate and Canadian prime rate borrowings plus a spread or LIBOR and BA rate plus a spread. The initial applicable margin may be reduced based on excess availability.
Ryerson Inc. is also required to pay the lenders under the Ryerson Credit Facility a commitment fee in respect of unused commitments ranging from 0.25% to 0.375% per annum based on the average usage of the Ryerson Credit Facility during a rolling three-month period. Ryerson Inc. is also required to pay customary letter of credit and agency fees.
Collateral and Guarantors
Certain of Ryerson Inc.’s existing and future domestic subsidiaries act as co-borrowers. We and our existing and future domestic subsidiaries guarantee the obligations under the Ryerson Credit Facility. The Ryerson Credit Facility is secured by a first-priority security interest in substantially all of Ryerson Holding, Ryerson Inc., and Ryerson Inc.’s current and future domestic subsidiaries’ current assets, including accounts receivable, inventory and related general intangibles and proceeds of the foregoing, and certain other assets (in each case subject to certain exceptions). In addition, one of Ryerson Inc.’s Canadian subsidiaries acts as a borrower under the Canadian subfacility. Obligations under the Canadian subfacility of the Ryerson Credit Facility are also guaranteed by, and secured by a first-priority security interest in the comparable assets of Ryerson Inc.’s Canadian subsidiaries.
Incremental Facility Amounts
The Ryerson Credit Facility also permits Ryerson Inc. to increase the aggregate amount of such facility from time to time in minimum tranches of $100.0 million and up to a maximum aggregate amount of $400.0 million subject to certain conditions and adjustments. The existing lenders under the Ryerson Credit Facility will be entitled, but not obligated, to provide the incremental commitments.
105
Table of Contents
Covenants, Representations and Other Matters
The Ryerson Credit Facility also includes negative covenants restricting or limiting Ryerson Inc.’s ability, and the ability of its subsidiaries, to, among other things:
| • | incur, assume or permit to exist indebtedness or guarantees; |
| • | incur liens; |
| • | make loans and investments; |
| • | enter into joint ventures; |
| • | declare dividends, make payments on or redeem or repurchase capital stock; |
| • | engage in mergers, acquisitions and other business combinations; |
| • | prepay, redeem or purchase certain indebtedness, including outstanding notes; |
| • | make certain capital expenditures; |
| • | sell assets; |
| • | enter into transactions with affiliates; and |
| • | alter the business that we conduct. |
These negative covenants are subject to certain baskets and exceptions.
A minimum fixed charge coverage ratio will be applicable under the Ryerson Credit Facility only if (i) less than 10% of the lesser of (A) the aggregate commitments and (B) the borrowing base under the facility were available on any business day or (ii) if less than $125.0 million under the facility were available at any time.
The Ryerson Credit Facility contains certain customary representations and warranties with respect to, among other things, the organization and qualification of the borrowers, power and authority of the borrowers to enter into the Ryerson Credit Facility, the reliability of each borrower’s financial statements, the solvent financial condition of each borrower and the compliance by each borrower with all applicable laws. A material misrepresentation of any of the representations and warranties contained in the Ryerson Credit Facility will result in an event of default and the lenders under the Ryerson Credit Facility will be entitled to various remedies, including acceleration of amounts due under the Ryerson Credit Facility and all other actions permitted to be taken by secured creditors.
The Ryerson Credit Facility contains events of default with respect to, among other things, default in the payment of principal when due or the payment of interest, fees and other amounts after a specified grace period, material misrepresentations, failure to perform certain specified covenants, certain bankruptcy events, invalidity of certain security agreements or guarantees, material judgments or the occurrence of a change of control of Ryerson. If such an event of default occurs, the lenders under the Ryerson Credit Facility will be entitled to various remedies, as described above.
Amortization and Final Maturity
There is no scheduled amortization under the Ryerson Credit Facility. The principal amount outstanding of the loans under the Ryerson Credit Facility will be due and payable in full at maturity, which occurs on the earlier of (a) April 3, 2018 or (b) August 16, 2017 (60 days prior to the scheduled maturity date of the 2017 Notes), if the 2017 Notes are then outstanding. If at any time the aggregate amount of outstanding loans, unreimbursed letter of credit drawings and undrawn letters of credit under the Ryerson Credit Facility exceeds the lesser of (1) the commitment amount and (2) the borrowing base, Ryerson Inc. will be required to repay outstanding loans or cash collateralize letters of credit in an aggregate amount equal to such excess, with no
106
Table of Contents
reduction of the commitment amount. In addition, Ryerson Inc. will be required to repay outstanding loans or cash collateralize letters of credit with the proceeds from certain asset sales, in such amount as is necessary if excess availability under the Ryerson Credit Facility is less than a predetermined amount. If excess availability under the Ryerson Credit Facility is less than such predetermined amount or certain events of default have occurred under the Ryerson Credit Facility, Ryerson Inc. will be required to repay outstanding loans and cash collateralize letters of credit with the cash we are required to deposit daily in a collection account maintained with the agent under the Ryerson Credit Facility.
The 2017 Notes and 2018 Notes
Senior Secured Notes Due 2017
General
On October 10, 2012, Ryerson Inc. and JT Ryerson issued $600 million in aggregate principal amount of senior secured notes due 2017 (the “2017 Notes”). The 2017 Notes are fully and unconditionally guaranteed on a senior secured basis by each of Ryerson Inc.’s existing and future domestic subsidiaries that are co-borrowers or guarantee obligations under the Ryerson Credit Facility. The 2017 Notes and guarantees are secured by a first-priority lien on substantially all of Ryerson Inc.’s and Ryerson Inc.’s guarantors’ present and future assets located in the United States (other than receivables, inventory, related general intangibles, certain other assets and proceeds thereof), in each case subject to certain exceptions and customary permitted liens. The 2017 Notes and guarantees are secured on a second-priority basis by a lien on the assets that secure Ryerson Inc.’s obligations under the Ryerson Credit Facility including receivables and inventory and related general intangibles, certain other assets and proceeds thereof. This second-priority lien is subject to a first-priority lien securing the Ryerson Credit Facility and other customary liens permitted under such facility, until such facility and obligations are paid in full.
In connection with the issuance of the 2017 Notes, Ryerson Inc. and JT Ryerson entered into a registration rights agreement, pursuant to which Ryerson Inc. agreed to file with the SEC by July 7, 2013, a registration statement with respect to an offer to exchange each of the 2017 Notes for a new issue of debt securities registered under the Securities Act, with terms substantially identical to those of the 2017 Notes and to consummate an exchange offer no later than October 5, 2013. Ryerson completed the exchange offer on September 10, 2013. As a result of completing the exchange offer, Ryerson satisfied its obligation under the registration rights agreements covering the 2017 Notes.
From time to time, Ryerson Inc. may in the future repurchase the 2017 Notes in the open market.
Interest
The 2017 Notes bear interest at a fixed rate of 9.000% per annum.
Redemption
The 2017 Notes are redeemable by Ryerson Inc., in whole or in part, at any time on or after April 15, 2015, at specified redemption prices. In addition, Ryerson Inc. may redeem up to 35% of the outstanding 2017 Notes before April 15, 2015 with the net cash proceeds from certain equity offerings at a price equal to 109.000% of the principal amount of the 2017 Notes, plus accrued but unpaid interest. Ryerson Inc. may also redeem some or all of the 2017 Notes before April 15, 2015 at a redemption price equal to 100% of the principal amount, plus accrued and unpaid interest, if any, to the redemption date, plus a “make-whole” premium.
Change of Control
If a change of control occurs, Ryerson Inc. is required to make an offer to purchase the 2017 Notes at 101% of their principal amount, plus accrued and unpaid interest.
107
Table of Contents
Covenants
The indenture governing the 2017 Notes contains customary covenants that, among other things, limit, subject to certain exceptions, Ryerson Inc.’s ability, and the ability of its restricted subsidiaries, to:
| • | incur additional indebtedness; |
| • | pay dividends on its capital stock or repurchase its capital stock; |
| • | make certain investments or other restricted payments; |
| • | create liens or use assets as security in other transactions; |
| • | merge, consolidate or transfer or dispose of substantially all of our assets; and |
| • | engage in transactions with affiliates. |
Events of Default
Each of the following constitutes an “Event of Default” under the indenture governing the 2017 Notes:
| • | default in the payment in respect of the principal of (or premium, if any, on) any 2017 Note at its maturity; |
| • | default in the payment of any interest upon any 2017 Note when it becomes due and payable, and continuance of such default for a period of 30 days; |
| • | failure to perform or comply with the provisions of the indenture governing the 2017 Notes relating to consolidations, mergers, conveyance, transfers or leases involving Ryerson Inc. or its subsidiaries or Ryerson Inc.’s assets or the assets of its subsidiaries; |
| • | except as permitted by the indenture governing the 2017 Notes, any guarantee of a significant subsidiary ceases to be in full force and effect and enforceable in accordance with its terms; |
| • | default in the performance, or breach, of any other covenant or agreement of Ryerson Inc. or any guarantor in the indenture (other than the items discussed directly above) governing the 2017 Notes and continuance of such default or breach for a period of 60 days (or 120 days with respect to a default under the “Provision of Financial Information” covenant contained in the indenture governing the 2017 Notes) after written notice thereof has been given to Ryerson Inc. by the trustee or to Ryerson Inc. and the trustee by holders of at least 25% in aggregate principal amount of the outstanding 2017 Notes; |
| • | a default or defaults under any bonds, debentures, notes or other evidences of debt (other than the 2017 Notes) by Ryerson Inc. or any of its restricted subsidiaries having, individually or in the aggregate, a principal or similar amount outstanding of at least $20 million, which resulted in the acceleration of the maturity of such debt prior to its express maturity or a failure to pay at least $20 million of such debt when due and payable after the expiration of any applicable grace period; |
| • | the entry against Ryerson Inc. or any of its restricted subsidiaries that is a significant subsidiary of a final judgment or final judgments for the payment of money in an aggregate amount in excess of $20 million, by a court or courts of competent jurisdiction, which judgments remain undischarged, unwaived, unstayed, unbonded or unsatisfied for a period of 60 consecutive days; |
| • | certain events in bankruptcy, insolvency or reorganization affecting Ryerson Inc. or any of its significant subsidiaries; or |
| • | unless the collateral securing the 2017 Notes has been released from the notes under the security documents, default by Ryerson Inc. or any of its subsidiaries in the performance of its obligations pursuant to its security documents which adversely affects the enforceability, validity, perfection or priority of the note liens on a material portion of the note collateral granted to the collateral agent for |
108
Table of Contents
| the benefit of the trustee and the holders of the 2017 Notes, the repudiation or disaffirmation by Ryerson Inc. or any of its subsidiaries of its material obligations under the security documents or the determination in a judicial proceeding that the security documents are unenforceable or invalid against Ryerson Inc. or any of its subsidiaries party thereto for any reason with respect to a material portion of the note collateral (which default, repudiation, disaffirmation or determination is not rescinded, stayed, or waived by the persons having such authority pursuant to the security documents) or otherwise cured within 60 days after Ryerson Inc. receives written notice thereof specifying the occurrence from the trustee or holders of at least 66 2/3% of the outstanding principal amount and demanding that such default be remedied. |
Senior Notes Due 2018
General
Also on October 10, 2012, Ryerson Inc. and JT Ryerson issued $300 million in aggregate principal amount of senior notes due 2018 (the “2018 Notes”). The 2018 Notes are fully and unconditionally guaranteed on a senior basis by each of Ryerson Inc.’s existing and future domestic subsidiaries that are co-borrowers or guarantee obligations under the Ryerson Credit Facility.
In connection with the issuance of the 2018 Notes, Ryerson Inc. and JT Ryerson entered into a registration rights agreement, pursuant to which Ryerson Inc. agreed to file with the SEC by July 7, 2013, a registration statement with respect to an offer to exchange each of the 2018 Notes for a new issue of debt securities registered under the Securities Act, with terms substantially identical to those of the 2018 Notes and to consummate an exchange offer no later than October 5, 2013. Ryerson completed the exchange offer on September 10, 2013. As a result of completing the exchange offer, Ryerson satisfied its obligation under the registration rights agreements covering the 2018 Notes.
From time to time, Ryerson Inc. may in the future repurchase the 2018 Notes in the open market.
Interest
The 2018 Notes bear interest at a fixed rate of 11.250% per annum.
Redemption
The 2018 Notes are redeemable by Ryerson Inc., in whole or in part, at any time on or after October 15, 2015, at specified redemption prices. In addition, we may redeem up to 35% of the outstanding 2018 Notes before October 15, 2015 with the net cash proceeds from certain equity offerings at a price equal to 111.250% of the principal amount of the 2018 Notes, plus accrued but unpaid interest. We may also redeem some or all of the 2018 Notes before October 15, 2015 at a redemption price equal to 100% of the principal amount, plus accrued and unpaid interest, if any, to the redemption date, plus a “make-whole” premium.
Change of Control
If a change of control occurs, Ryerson Inc. is required to make an offer to purchase the 2018 Notes at 101% of their principal amount, plus accrued and unpaid interest.
Covenants
The indenture governing the 2018 Notes contains customary covenants that, among other things, limit, subject to certain exceptions, Ryerson Inc.’s ability, and the ability of its restricted subsidiaries, to:
| • | incur additional indebtedness; |
| • | pay dividends on its capital stock or repurchase its capital stock; |
| • | make certain investments or other restricted payments; |
109
Table of Contents
| • | create liens or use assets as security in other transactions; |
| • | merge, consolidate or transfer or dispose of substantially all of our assets; and |
| • | engage in transactions with affiliates. |
Events of Default
Each of the following constitutes an “Event of Default” under the indenture governing the 2018 Notes:
| • | default in the payment in respect of the principal of (or premium, if any, on) any 2018 Note at its maturity; |
| • | default in the payment of any interest upon any 2018 Note when it becomes due and payable, and continuance of such default for a period of 30 days; |
| • | failure to perform or comply with the provisions of the indenture governing the 2018 Notes relating to consolidations, mergers, conveyance, transfers or leases involving Ryerson Inc. or its subsidiaries or Ryerson Inc.’s assets or the assets of its subsidiaries; |
| • | except as permitted by the indenture governing the 2018 Notes, any guarantee of a significant subsidiary ceases to be in full force and effect and enforceable in accordance with its terms; |
| • | default in the performance, or breach, of any other covenant or agreement of Ryerson Inc. or any guarantor in the indenture (other than the items discussed directly above) governing the 2018 Notes and continuance of such default or breach for a period of 60 days (or 120 days with respect to a default under the “Provision of Financial Information” covenant contained in the indenture governing the 2018 Notes) after written notice thereof has been given to Ryerson Inc. by the trustee or to Ryerson Inc. and the trustee by holders of at least 25% in aggregate principal amount of the outstanding 2018 Notes; |
| • | a default or defaults under any bonds, debentures, notes or other evidences of debt (other than the 2018 Notes) by Ryerson Inc. or any of its restricted subsidiaries having, individually or in the aggregate, a principal or similar amount outstanding of at least $20 million, which resulted in the acceleration of the maturity of such debt prior to its express maturity or a failure to pay at least $20 million of such debt when due and payable after the expiration of any applicable grace period; |
| • | the entry against Ryerson Inc. or any of its restricted subsidiaries that is a significant subsidiary of a final judgment or final judgments for the payment of money in an aggregate amount in excess of $20 million, by a court or courts of competent jurisdiction, which judgments remain undischarged, unwaived, unstayed, unbonded or unsatisfied for a period of 60 consecutive days; or |
| • | certain events in bankruptcy, insolvency or reorganization affecting Ryerson Inc. or any of its significant subsidiaries. |
Foreign Debt
As of September 30, 2013, Ryerson China’s total foreign borrowings were $21.6 million, which were owed to banks in Asia at a weighted average interest rate of 4.2% and secured by inventory, property, plant and equipment. As of December 31, 2012, Ryerson China’s total foreign borrowings were $21.4 million, which were owed to banks in Asia at a weighted average interest rate of 4.8% and secured by inventory, property, plant and equipment. As of September 30, 2013, Açofran had no foreign borrowings. As of December 31, 2012, Açofran’s total foreign borrowings were $0.5 million, which were owed to foreign banks at a weighted average interest rate of 11.2%. Availability under the foreign credit lines was $28 million and $21 million at September 30, 2013 and December 31, 2012, respectively. Letters of credit issued by our foreign subsidiaries totaled $9 million and $8 million at September 30, 2013 and December 31, 2012, respectively.
110
Table of Contents
SHARES ELIGIBLE FOR FUTURE SALE
Prior to this offering, there was no public market for our common stock, and we cannot predict what effect, if any, market sales of shares of common stock or the availability of shares of common stock for sale will have on the market price of our common stock. Nevertheless, sales of substantial amounts of common stock in the public market, or the perception that such sales could occur, could materially and adversely affect the market price of our common stock and could impair our future ability to raise capital through the sale of our equity or equity-related securities at a time and price that we deem appropriate. None of our common stock is subject to outstanding options or warrants to purchase, or securities convertible into, common stock of Ryerson Holding.
As of November 1, 2013, there were nine holders of record of our common stock. Upon the closing of this offering, we will have outstanding an aggregate of shares of our common stock. Of the outstanding shares, the shares sold in this offering, including any shares sold in this offering in connection with the exercise by the underwriters of their over-allotment option, will be freely tradable without restriction or further registration under the Securities Act, except that any shares purchased in this offering by our “affiliates,” as that term is defined under Rule 144 of the Securities Act, may be sold only in compliance with the limitations described below. The remaining outstanding shares of common stock that are not sold in this offering, or shares, will be deemed “restricted securities” as that term is defined under Rule 144. Restricted securities may be sold in the public market only if registered or if they qualify for an exemption from registration under the Securities Act, such as under Rule 144 under the Securities Act, which are summarized below.
Rule 144
In general, under Rule 144 under the Securities Act of 1933, as in effect on the date of this prospectus, a person who is not one of our affiliates at any time during the three months preceding a sale, and who has beneficially owned shares of our common stock for at least six months would be entitled to sell an unlimited number of shares of our common stock provided current public information about us is available and, after one year, an unlimited number of shares of our common stock without restriction. Our affiliates who have beneficially owned shares of our common stock for at least six months are entitled to sell within any three-month period a number of shares that does not exceed the greater of:
| • | 1% of the number of shares of our common stock then outstanding, which will equal approximately shares immediately after this offering, based on the number of shares of our common stock outstanding upon completion of this offering; or |
| • | the average weekly trading volume of our common stock on the NYSE during the four calendar weeks preceding the filing of a notice on Form 144 with respect to the sale. |
Sales under Rule 144 by our affiliates are also subject to manner of sale provisions and notice requirements and to the availability of current public information about us.
Lock-up Agreements
In connection with this offering, we, our directors, our executive officers and all our stockholders have agreed, subject to certain exceptions, with the underwriters not to dispose of or hedge any shares of our common stock or securities convertible into or exchangeable for shares of common stock during the period from the date of this prospectus continuing through the date 180 days after the date of this prospectus, except with the prior written consent of . has advised us that they have no current intent or arrangement to release any of the shares subject to the lock-up agreements prior to the expiration of the lock-up period. The lock-up agreements permit stockholders to transfer common stock and other securities subject to the lock-up agreements in certain circumstances; any waiver is at the discretion of .
111
Table of Contents
The 180-day restricted period described in the preceding paragraph will be extended if:
| • | during the last 17 days of the 180-day restricted period we issue an earnings release or announce material news or a material event; or |
| • | prior to the expiration of the 180-day restricted period, we announce that we will release earnings results during the 16-day period beginning on the last day of the 180-day period, |
in which case the restrictions described in the preceding paragraph will continue to apply until the expiration of the 18-day period beginning on the date of the issuance of the earnings release or the announcement of the material news or material event.
Taking into account the lock-up agreements described above, and assuming that does not release any parties from these agreements, that there is no extension of the lock-up period, that the underwriters do not exercise their over-allotment option, that no parties to the lock-up agreements will purchase shares, and no other individuals will purchase shares, in excess of $1,000,000 in the directed share program, that no stockholders that hold the registration rights described in “Certain Relationships and Related Party Transactions—Investor Rights Agreement” exercise those rights and without giving effect to the terms of the lock-up provisions contained in the investor rights agreement, the following securities will be eligible for sale in the public market at the following times pursuant to the provisions of Rule 144:
| Measurement Date |
Aggregate Shares Eligible for Public Sale |
Comments | ||
| On the date of this prospectus |
Shares sold in this offering. | |||
| 180 days after the completion of this offering |
Consists of shares eligible for sale under Rule 144. | |||
| One year after the completion of this offering |
Consists of shares eligible for sale under Rule 144. |
Initial Public Offering Price
Prior to this offering, there has been no public market for our common stock. The initial public offering price will be negotiated between us and the representatives of the underwriters. Among the factors to be considered in these negotiations are:
| • | the history of, and prospects for, our company and the industry in which we compete; |
| • | our past and present financial performance; |
| • | an assessment of our management; |
| • | the present state of our development; |
| • | the prospects for our future earnings; |
| • | the prevailing conditions of the applicable U.S. securities market at the time of this offering; |
| • | market valuations of publicly traded companies that we and the representative of the underwriters believe to be comparable to us; and |
| • | other factors deemed relevant. |
The estimated initial public offering price range set forth on the cover of this preliminary prospectus is subject to change as a result of market conditions and other factors.
112
Table of Contents
MATERIAL U.S. FEDERAL INCOME AND ESTATE TAX CONSIDERATIONS
The following is a general discussion of the material U.S. federal income and estate tax consequences of the ownership and disposition of our common stock by a “non-U.S. holder,” but is not a complete analysis of all the potential U.S. federal income and estate tax consequences relating thereto. For this purpose, you are a “non-U.S. holder” if you are, for U.S. federal income tax purposes:
| • | a nonresident alien individual, |
| • | a foreign corporation, or |
| • | a foreign estate or trust. |
A “non-U.S. holder” does not include an individual who is present in the United States for 183 days or more in the taxable year of disposition and is not otherwise a resident of the United States for U.S. federal income tax purposes. Such an individual is urged to consult his or her own tax advisor regarding the U.S. federal income and estate tax consequences of the ownership and disposition of common stock.
If an entity treated as a partnership for U.S. federal income tax purposes holds common stock, the tax treatment of a partner will generally depend on the status of the partner and upon the activities of the partnership. Accordingly, partnerships that are considering an investment in our common stock and partners in such partnerships should consult their respective tax advisors with respect to the U.S. federal income and estate tax consequences of the ownership and disposition of common stock.
This discussion does not address all aspects of U.S. federal income and estate taxation that may be relevant in light of a non-U.S. holder’s special tax status or special circumstances. U.S. expatriates, insurance companies, tax-exempt organizations, dealers in securities, banks or other financial institutions, “controlled foreign corporations,” “passive foreign investment companies,” corporations that accumulate earnings to avoid U.S. federal income tax and investors that hold common stock as part of a hedge, straddle or conversion transaction are among those categories of potential investors that may be subject to special rules not covered in this discussion. This discussion does not address any U.S. federal tax consequences other than income and estate tax consequences or any tax consequences arising under the laws of any state, local or non-U.S. taxing jurisdiction. Furthermore, the following discussion is based on current provisions of the Internal Revenue Code of 1986, as amended, Treasury Regulations and administrative and judicial interpretations thereof, all as in effect on the date hereof, and all of which are subject to change, possibly with retroactive effect. Accordingly, each non-U.S. holder should consult its tax advisors regarding the U.S. federal, state, local and non-U.S. income, estate and other tax consequences of acquiring, holding and disposing of shares of our common stock.
INVESTORS CONSIDERING THE PURCHASE OF SECURITIES PURSUANT TO THIS OFFERING ARE ENCOURAGED TO CONSULT THEIR OWN TAX ADVISORS REGARDING THE APPLICATION OF THE U.S. FEDERAL INCOME AND ESTATE TAX LAWS TO THEIR PARTICULAR SITUATIONS AND THE APPLICATION OF OTHER FEDERAL TAX LAWS, FOREIGN, STATE AND LOCAL LAWS, AND TAX TREATIES.
Dividends
Payments on common stock will constitute dividends for U.S. federal income tax purposes to the extent paid from our current or accumulated earnings and profits, as determined under U.S. federal income tax principles. Amounts not treated as dividends for U.S. federal income tax purposes will constitute a return of capital and will first be applied against and reduce a holder’s adjusted basis in the common stock (determined on a share-by-share basis), but not below zero, and then the excess, if any, will be treated as gain from the sale of common stock.
As discussed under “Dividend Policy” above, we do no currently anticipate paying any dividends in the foreseeable future. In the event that we do pay dividends, amounts paid to a non-U.S. holder of common stock which are treated as dividends for U.S. federal income tax purposes generally will be subject to U.S. withholding
113
Table of Contents
tax at a rate of 30% of the gross amount of the dividends or such lower rate as may be specified by an applicable tax treaty. In order to receive a reduced treaty rate, a non-U.S. holder generally must provide a valid Internal Revenue Service, or IRS, Form W-8BEN or other successor form certifying qualification for the reduced rate.
Dividends received by a non-U.S. holder that are effectively connected with a U.S. trade or business conducted by the non-U.S. holder are exempt from such withholding tax. In order to obtain this exemption, a non-U.S. holder must provide a valid IRS Form W-8ECI or other applicable form properly certifying such exemption. Such effectively connected dividends, although not subject to withholding tax will generally be subject to regular U.S. federal income tax as if the non-U.S. holder were a U.S. resident, unless an applicable income tax treaty provides otherwise. A non-U.S. corporation receiving effectively connected dividends may also be subject to an additional “branch profits tax” imposed at a rate of 30% (or a lower treaty rate) on the earnings and profits attributable to its effectively connected income.
Gain on Disposition of Common Stock
A non-U.S. holder generally will not be subject to U.S. federal income tax on any gain realized upon the sale or other disposition of common stock unless:
| • | the gain is “effectively connected” with the non-U.S. holder’s conduct of a trade or business in the United States, or |
| • | we are or have been a U.S. real property holding corporation (“USRPHC”), as defined below, at any time within the five-year period preceding the disposition or the non-U.S. holder’s holding period, whichever period is shorter (the “relevant period”). |
Unless an applicable treaty provides otherwise, gain described in the first bullet point above generally will be subject to regular U.S. federal income tax as if the U.S. holder were a U.S. resident and, in the case of non-U.S. holders taxed as corporations, the branch profits tax described above may also apply.
Generally, a corporation is a USRPHC if the fair market value of its U.S. real property interests, as defined in the Code and applicable regulations, equals or exceeds 50% of the aggregate fair market value of its worldwide real property interests and its other assets used or held for use in a trade or business.
We believe that we are not, and currently do not anticipate becoming, a USRPHC. However, there can be no assurance that our current analysis is correct or that we will not become a USRPHC in the future. Even if we are or become a USRPHC, as long as our common stock is regularly traded on an established securities market, such common stock will be treated as U.S. real property interests only if the non-U.S. holder actually or constructively held more than 5% of such regularly traded common stock at some time during the relevant period.
Backup Withholding and Information Reporting
Information returns will be filed with the Internal Revenue Service in connection with payments of dividends and the proceeds from a sale or other disposition of common stock. You may have to comply with certification procedures to establish that you are not a U.S. person in order to avoid information reporting and backup withholding tax requirements. The certification procedures required to claim a reduced rate of withholding under a treaty generally will satisfy the certification requirements necessary to avoid the backup withholding tax as well. The amount of any backup withholding from a payment to you will be allowed as a credit against your U.S. federal income tax liability and may entitle you to a refund, provided that the required information is timely furnished to the Internal Revenue Service.
U.S. Federal Estate Tax
Shares of common stock held (or deemed held) by an individual who is a non-U.S. holder at the time of his or her death generally will be included in such non-U.S. holder’s gross estate for U.S. federal estate tax purposes, unless an applicable estate tax treaty provides otherwise.
114
Table of Contents
Foreign Account Tax Compliance Act
The Foreign Account Tax Compliance Act (“FATCA”) generally imposes a 30% U.S. withholding tax on dividends paid on, and gross proceeds from the sale or other disposition of, our common stock, if paid either to a:
| • | foreign financial institution (“FFI”) (whether such FFI is the beneficial owner or an intermediary), that does not meet the information reporting requirements of FATCA, or a |
| • | non-financial foreign entity (“NFFE”) (whether such NFFE is the beneficial owner or an intermediary) that is not exempt from the FATCA requirements and does not meet relevant information reporting requirements. |
Pursuant to recently issued Treasury regulations and recently published administrative guidance, FATCA withholding applies to dividends paid on or after July 1, 2014 and to the gross proceeds from the disposition of stock on or after January 1, 2017. Non-U.S. holders are urged to consult their of tax advisors regarding the impact of FATCA on their ownership and disposition of our common stock.
115
Table of Contents
Merrill Lynch, Pierce, Fenner & Smith Incorporated, Deutsche Bank Securities Inc. and BMO Capital Markets Corp. are acting as book-running managers of this offering and representatives of each of the underwriters named below. Subject to the terms and conditions set forth in a purchase agreement among us, the selling stockholders and the underwriters, we and the selling stockholders have agreed to sell to the underwriters, and each of the underwriters has agreed, severally and not jointly, to purchase from us the number of shares of common stock set forth opposite its name below.
| Underwriter | Number of Shares | |||
| Merrill Lynch, Pierce, Fenner & Smith Incorporated |
||||
| Deutsche Bank Securities Inc. |
||||
| BMO Capital Markets Corp. |
||||
| J.P. Morgan Securities LLC |
||||
| Jefferies LLC |
||||
| Wells Fargo Securities, LLC |
||||
| KeyBanc Capital Markets Inc. |
||||
| Citigroup Global Markets Inc. |
||||
| Macquarie Capital (USA) Inc. |
||||
|
| ||||
| Total |
||||
|
|
Subject to the terms and conditions set forth in the purchase agreement, the underwriters have agreed, severally and not jointly, to purchase all of the shares sold under the purchase agreement if any of these shares are purchased. If an underwriter defaults, the purchase agreement provides that the purchase commitments of the nondefaulting underwriters may be increased or the purchase agreement may be terminated.
We and the selling stockholders have agreed to indemnify the underwriters against certain liabilities, including liabilities under the Securities Act and liabilities incurred in connection with the directed share program referred to below, or to contribute to payments the underwriters may be required to make in respect of those liabilities.
The underwriters are offering the shares, subject to prior sale, when, as and if issued to and accepted by them, subject to approval of legal matters by their counsel, including the validity of the shares, and other conditions contained in the purchase agreement, such as the receipt by the underwriters of officer’s certificates and legal opinions. The underwriters reserve the right to withdraw, cancel or modify offers to the public and to reject orders in whole or in part.
Commissions and Discounts
The representative has advised us and the selling stockholders that the underwriters propose initially to offer the shares to the public at the public offering price set forth on the cover page of this prospectus and to dealers at that price less a concession not in excess of $ per share. After the initial offering, the public offering price, concession or any other term of the offering may be changed.
116
Table of Contents
The following table shows the public offering price, underwriting discount and proceeds before expenses to us and the selling stockholders. The information assumes either no exercise or full exercise by the underwriters of their overallotment option.
| Per Share | Without Option | With Option | ||||||||||
| Public offering price |
$ | $ | $ | |||||||||
| Underwriting discount |
$ | $ | $ | |||||||||
| Proceeds, before expenses, to us. |
$ | $ | $ | |||||||||
| Proceeds, before expenses, to the selling stockholders |
$ | $ | $ | |||||||||
The expenses of the offering, not including the underwriting discount, are estimated at $4,000,000 and are payable by us and the selling stockholders. We have agreed with the underwriters to pay expenses, reasonable fees and disbursements of counsel to the underwriters relating to the review and qualification of this offering by the Financial Industry Regulatory Authority, Inc. in an aggregate amount not to exceed $10,000.
The selling stockholders may be deemed to be underwriters within the meaning of the Securities Act.
Overallotment Option
The selling stockholders have granted an option to the underwriters to purchase up to additional shares at the public offering price, less the underwriting discount. The underwriters may exercise this option for 30 days from the date of this prospectus solely to cover any overallotments. If the underwriters exercise this option, each will be obligated, subject to conditions contained in the purchase agreement, to purchase a number of additional shares proportionate to that underwriter’s initial amount reflected in the above table.
No Sales of Similar Securities
We, our executive officers, our directors and all of our stockholders have agreed not to sell or transfer any common stock or securities convertible into, exchangeable for, exercisable for, or repayable with common stock, for 180 days after the date of this prospectus without first obtaining the written consent of . Specifically, we and these other persons have agreed, with certain limited exceptions, not to directly or indirectly
| • | offer, pledge, sell or contract to sell any common stock, |
| • | sell any option or contract to purchase any common stock, |
| • | purchase any option or contract to sell any common stock, |
| • | grant any option, right or warrant for the sale of any common stock, |
| • | lend or otherwise dispose of or transfer any common stock, |
| • | request or demand that we file a registration statement related to the common stock, or |
| • | enter into any swap or other agreement that transfers, in whole or in part, the economic consequence of ownership of any common stock whether any such swap or transaction is to be settled by delivery of shares or other securities, in cash or otherwise. |
This lock-up provision applies to common stock and to securities convertible into or exchangeable or exercisable for or repayable with common stock. It also applies to common stock owned now or acquired later by the person executing the agreement or for which the person executing the agreement later acquires the power of disposition. In the event that either (x) during the last 17 days of the lock-up period referred to above, we issue an earnings release or material news or a material event relating to us occurs or (y) prior to the expiration of the lock-up period, we announce that we will release earnings results or become aware that material news or a material event will occur during the 16-day period beginning on the last day of the lock-up period, the restrictions described above shall continue to apply until the expiration of the 18-day period beginning on the issuance of the earnings release or the occurrence of the material news or material event.
117
Table of Contents
New York Stock Exchange
We expect the shares to be approved for listing on the NYSE under the symbol “RYI.” In order to meet the requirements for listing on that exchange, the underwriters have undertaken to sell a minimum number of shares to a minimum number of beneficial owners as required by that exchange.
Before this offering, there has been no public market for our common stock. The initial public offering price will be determined through negotiations among us, the selling stockholders and the representative. In addition to prevailing market conditions, the factors to be considered in determining the initial public offering price are
| • | the valuation multiples of publicly traded companies that the representative believes to be comparable to us, |
| • | our financial information, |
| • | the history of, and the prospects for, our company and the industry in which we compete, |
| • | an assessment of our management, its past and present operations, and the prospects for, and timing of, our future revenues, |
| • | the present state of our development, and |
| • | the above factors in relation to market values and various valuation measures of other companies engaged in activities similar to ours. |
An active trading market for the shares may not develop. It is also possible that after the offering the shares will not trade in the public market at or above the initial public offering price.
The underwriters do not expect to sell more than 5% of the shares in the aggregate to accounts over which they exercise discretionary authority.
Price Stabilization, Short Positions and Penalty Bids
Until the distribution of the shares is completed, SEC rules may limit underwriters and selling group members from bidding for and purchasing our common stock. However, the representative may engage in transactions that stabilize the price of the common stock, such as bids or purchases to peg, fix or maintain that price.
In connection with the offering, the underwriters may purchase and sell our common stock in the open market. These transactions may include short sales, purchases on the open market to cover positions created by short sales and stabilizing transactions. Short sales involve the sale by the underwriters of a greater number of shares than they are required to purchase in the offering. “Covered” short sales are sales made in an amount not greater than the underwriters’ overallotment option described above. The underwriters may close out any covered short position by either exercising their overallotment option or purchasing shares in the open market. In determining the source of shares to close out the covered short position, the underwriters will consider, among other things, the price of shares available for purchase in the open market as compared to the price at which they may purchase shares through the overallotment option. “Naked” short sales are sales in excess of the overallotment option. The underwriters must close out any naked short position by purchasing shares in the open market. A naked short position is more likely to be created if the underwriters are concerned that there may be downward pressure on the price of our common stock in the open market after pricing that could adversely affect investors who purchase in the offering. Stabilizing transactions consist of various bids for or purchases of shares of common stock made by the underwriters in the open market prior to the completion of the offering.
The underwriters may also impose a penalty bid. This occurs when a particular underwriter repays to the underwriters a portion of the underwriting discount received by it because the representative has repurchased shares sold by or for the account of such underwriter in stabilizing or short covering transactions.
118
Table of Contents
Similar to other purchase transactions, the underwriters’ purchases to cover the syndicate short sales may have the effect of raising or maintaining the market price of our common stock or preventing or retarding a decline in the market price of our common stock. As a result, the price of our common stock may be higher than the price that might otherwise exist in the open market. The underwriters may conduct these transactions on the NYSE, in the over-the-counter market or otherwise.
Neither we nor any of the underwriters make any representation or prediction as to the direction or magnitude of any effect that the transactions described above may have on the price of our common stock. In addition, neither we nor any of the underwriters make any representation that the representative will engage in these transactions or that these transactions, once commenced, will not be discontinued without notice.
Directed Share Program
At our request, the underwriters have reserved up to 5% of the shares of common stock for sale at the initial public offering price to persons who are employees, officers, directors and other parties associated with us through a directed share program. The number of shares of common stock available for sale to the general public will be reduced by the number of directed shares purchased by participants in the program. Any directed shares not purchased will be offered by the underwriters to the general public on the same basis as all other shares of common stock offered. We have agreed to indemnify the underwriters against certain liabilities and expenses, including liabilities under the Securities Act, in connection with the sales of the directed shares. Individuals who purchase shares in excess of $1,000,000 in the directed share program will be subject to a 25-day lock-up period, except that any of our executive officers or directors or any selling stockholders who purchase shares in the directed share program will remain subject to the 180-day lock-up period from the date of this prospectus, as described above.
Electronic Offer, Sale and Distribution of Shares
In connection with the offering, certain of the underwriters or securities dealers may distribute prospectuses by electronic means, such as e-mail, Internet sites or through other online services maintained by one or more of the underwriters and/or securities dealers participating in this offering, or by their affiliates. In those cases, prospective investors may view offering terms online and, depending upon the particular underwriter or securities dealer, prospective investors may be allowed to place orders online. The underwriters may agree with us to allocate a specific number of units for sale to online brokerage account holders. Any such allocation for online distributions will be made by the representative on the same basis as other allocations. Other than the prospectus in electronic format, the information on any underwriter’s or securities dealer’s web site and any information contained in any other web site maintained by an underwriter or securities dealer is not part of the prospectus or the registration statement of which this prospectus forms a part, has not been approved and/or endorsed by us or any underwriter or securities dealer in its capacity as underwriter or securities dealer and should not be relied upon by investors.
Other Relationships
Some of the underwriters and their affiliates have engaged in, and may in the future engage in, investment banking and other commercial dealings in the ordinary course of business with us or our affiliates. They have received, or may in the future receive, customary fees and commissions for these transactions. Merrill Lynch, Pierce, Fenner & Smith Incorporated and Wells Fargo Securities, LLC acted as lead arrangers and bookrunners under the Ryerson Credit Facility, Bank of America, N.A., an affiliate of Merrill Lynch, Pierce, Fenner & Smith Incorporated is acting as administrative agent and Canadian agent under the Ryerson Credit Facility, BMO Harris Bank, N.A., an affiliate of BMO Capital Markets Corp., Deutsche Bank Securities Inc. and Wells Fargo Capital Finance, LLC and Wells Fargo Foothill Canada ULC, each an affiliate of Wells Fargo Securities, LLC, acted as documentation agents under the Ryerson Credit Facility, JPMorgan Chase Bank, N.A., an affiliate of J.P. Morgan Securities LLC and Wells Fargo Capital Finance, LLC acted as syndication agents under the Ryerson Credit
119
Table of Contents
Facility, Bank of America, N.A. and Wells Fargo Capital Finance, LLC are acting as collateral agents under the Ryerson Credit Facility and, in each case, have received and/or will receive customary fees in connection therewith. Merrill Lynch, Pierce, Fenner & Smith Incorporated, J.P. Morgan Securities LLC, BMO Capital Markets Corp., Jefferies LLC, Wells Fargo Securities, LLC, KeyBanc Capital Markets Inc. and Macquarie Capital (USA) Inc. acted as initial purchasers of the 2017 Notes and 2018 Notes and received customary fees in connection therewith. Certain of the underwriters and/or their affiliates are lenders under the Ryerson Credit Facility, all or a portion of which shall be repaid using the proceeds of this offering, and certain affiliates of the underwriters may hold 2017 Notes or 2018 Notes that will be redeemed using the proceeds of this offering. As such, certain of the underwriters and/or their affiliates may receive a portion of the proceeds of this offering.
Notice To Prospective Investors In The European Economic Area
In relation to each member state of the European Economic Area (each, a “Relevant Member State”), including each Relevant Member State that has implemented the 2010 PD Amending Directive with regard to persons to whom an offer of securities is addressed and the denomination per unit of the offer of securities (each, an “Early Implementing Member State”), with effect from and including the date on which the Prospectus Directive is implemented in that Relevant Member State (the “Relevant Implementation Date”), no offer of shares will be made to the public in that Relevant Member State (other than offers (the “Permitted Public Offers”) where a prospectus will be published in relation to the shares that has been approved by the competent authority in a Relevant Member State or, where appropriate, approved in another Relevant Member State and notified to the competent authority in that Relevant Member State, all in accordance with the Prospectus Directive), except that with effect from and including that Relevant Implementation Date, offers of shares may be made to the public in that Relevant Member State at any time:
| A. | to any legal entity which is a qualified investor as defined in the Prospectus Directive; |
| (a) | (in the case of Relevant Member States that have not implemented the 2010 PD Amending Directive), legal entities which are authorized or regulated to operate in the financial markets or, if not so authorized or regulated, whose corporate purpose is solely to invest in securities, or any legal entity which has two or more of (1) an average of at least 250 employees during the last financial year; (2) a total balance sheet of more than €43,000,000 and (3) an annual turnover of more than €50,000,000, as shown in its last annual or consolidated accounts; and |
| (b) | (in the case of Relevant Member States that have implemented the 2010 PD Amending Directive), persons or entities that are described in points (1) to (4) of Section I of Annex II to Directive 2004/39/EC, and those who are treated on request as professional clients in accordance with Annex II to Directive 2004/39/EC, or recognized as eligible counterparties in accordance with Article 24 of Directive 2004/39/EC unless they have requested that they be treated as non-professional clients; or |
| B. | to fewer than 100 or, if the Relevant Member State has implemented the relevant provision of the 2010 PD Amending Directive, 150, natural or legal persons (other than qualified investors as defined in the Prospectus Directive), as permitted under the Prospectus Directive, subject to obtaining the prior consent of the representative[s]; or |
| C. | in any other circumstances falling within Article 3(2) of the Prospectus Directive, |
provided that no such offer of shares shall require the Company or the representative[s] to publish a prospectus pursuant to Article 3 of the Prospectus Directive or supplement a prospectus pursuant to Article 16 of the Prospectus Directive.
Each person in a Relevant Member State (other than a Relevant Member State where there is a Permitted Public Offer) who initially acquires any shares or to whom any offer is made will be deemed to have represented, acknowledged and agreed that (A) it is a “qualified investor” within the meaning of the law in that Relevant
120
Table of Contents
Member State implementing Article 2(1)(e) of the Prospectus Directive, and (B) in the case of any shares acquired by it as a financial intermediary, as that term is used in Article 3(2) of the Prospectus Directive, the shares acquired by it in the offering have not been acquired on behalf of, nor have they been acquired with a view to their offer or resale to, persons in any Relevant Member State other than “qualified investors” as defined in the Prospectus Directive, or in circumstances in which the prior consent of the Subscribers has been given to the offer or resale. In the case of any shares being offered to a financial intermediary as that term is used in Article 3(2) of the Prospectus Directive, each such financial intermediary will be deemed to have represented, acknowledged and agreed that the shares acquired by it in the offer have not been acquired on a non-discretionary basis on behalf of, nor have they been acquired with a view to their offer or resale to, persons in circumstances which may give rise to an offer of any shares to the public other than their offer or resale in a Relevant Member State to qualified investors as so defined or in circumstances in which the prior consent of the representative has been obtained to each such proposed offer or resale.
The Company, the representative and their affiliates will rely upon the truth and accuracy of the foregoing representation, acknowledgement and agreement.
For the purpose of the above provisions, the expression “an offer to the public” in relation to any shares in any Relevant Member State means the communication in any form and by any means of sufficient information on the terms of the offer of any shares to be offered so as to enable an investor to decide to purchase any shares, as the same may be varied in the Relevant Member State by any measure implementing the Prospectus Directive in the Relevant Member State and the expression “Prospectus Directive” means Directive 2003/71 EC (and amendments thereto, including the 2010 PD Amending Directive, in the case of Early Implementing Member States) and includes any relevant implementing measure in each Relevant Member State and the expression “2010 PD Amending Directive” means Directive 2010/73/EU.
Notice to Prospective Investors in the United Kingdom
In the United Kingdom, this document is being distributed only to, and is directed only at, and any offer subsequently made may only be directed at persons who are “qualified investors” (as defined in the Prospectus Directive) (i) who have professional experience in matters relating to investments falling within Article 19 (5) of the Financial Services and Markets Act 2000 (Financial Promotion) Order 2005, as amended (the “Order”) and/or (ii) who are high net worth companies (or persons to whom it may otherwise be lawfully communicated) falling within Article 49(2)(a) to (d) of the Order (all such persons together being referred to as “relevant persons”). This document must not be acted on or relied on in the United Kingdom by persons who are not relevant persons. In the United Kingdom, any investment or investment activity to which this document relates is only available to, and will be engaged in with, relevant persons.
Notice to Prospective Investors in Switzerland
The shares may not be publicly offered in Switzerland and will not be listed on the SIX Swiss Exchange (“SIX”) or on any other stock exchange or regulated trading facility in Switzerland. This document has been prepared without regard to the disclosure standards for issuance prospectuses under art. 652a or art. 1156 of the Swiss Code of Obligations or the disclosure standards for listing prospectuses under art. 27 ff. of the SIX Listing Rules or the listing rules of any other stock exchange or regulated trading facility in Switzerland. Neither this document nor any other offering or marketing material relating to the shares or the offering may be publicly distributed or otherwise made publicly available in Switzerland.
Neither this document nor any other offering or marketing material relating to the offering, the Company, the shares have been or will be filed with or approved by any Swiss regulatory authority. In particular, this document will not be filed with, and the offer of shares will not be supervised by, the Swiss Financial Market Supervisory Authority FINMA (FINMA), and the offer of shares has not been and will not be authorized under the Swiss Federal Act on Collective Investment Schemes (“CISA”). The investor protection afforded to acquirers of interests in collective investment schemes under the CISA does not extend to acquirers of shares.
121
Table of Contents
Notice to Prospective Investors in Australia
This prospectus is not a formal disclosure document and has not been, nor will be, lodged with the Australian Securities and Investments Commission. It does not purport to contain all information that an investor or their professional advisers would expect to find in a prospectus or other disclosure document (as defined in the Corporations Act 2001 (Australia)) for the purposes of Part 6D.2 of the Corporations Act 2001 (Australia) or in a product disclosure statement for the purposes of Part 7.9 of the Corporations Act 2001 (Australia), in either case, in relation to the securities.
The securities are not being offered in Australia to “retail clients” as defined in sections 761G and 761GA of the Corporations Act 2001 (Australia). This offering is being made in Australia solely to “wholesale clients” for the purposes of section 761G of the Corporations Act 2001 (Australia) and, as such, no prospectus, product disclosure statement or other disclosure document in relation to the securities has been, or will be, prepared.
This prospectus does not constitute an offer in Australia other than to wholesale clients. By submitting an application for our securities, you represent and warrant to us that you are a wholesale client for the purposes of section 761G of the Corporations Act 2001 (Australia). If any recipient of this prospectus is not a wholesale client, no offer of, or invitation to apply for, our securities shall be deemed to be made to such recipient and no applications for our securities will be accepted from such recipient. Any offer to a recipient in Australia, and any agreement arising from acceptance of such offer, is personal and may only be accepted by the recipient. In addition, by applying for our securities you undertake to us that, for a period of 12 months from the date of issue of the securities, you will not transfer any interest in the securities to any person in Australia other than to a wholesale client.
Notice to Prospective Investors in Hong Kong
Our securities may not be offered or sold in Hong Kong, by means of this prospectus or any document other than (i) to “professional investors” within the meaning of the Securities and Futures Ordinance (Cap.571, Laws of Hong Kong) and any rules made thereunder, or (ii) in circumstances which do not constitute an offer to the public within the meaning of the Companies Ordinance (Cap.32, Laws of Hong Kong), or (iii) in other circumstances which do not result in the document being a “prospectus” within the meaning of the Companies Ordinance (Cap.32, Laws of Hong Kong). No advertisement, invitation or document relating to our securities may be issued or may be in the possession of any person for the purpose of issue (in each case whether in Hong Kong or elsewhere) which is directed at, or the contents of which are likely to be accessed or read by, the public in Hong Kong (except if permitted to do so under the securities laws of Hong Kong) other than with respect to the securities which are or are intended to be disposed of only to persons outside Hong Kong or only to “professional investors” within the meaning of the Securities and Futures Ordinance (Cap. 571, Laws of Hong Kong) and any rules made thereunder.
Notice to Prospective Investors in Japan
Our securities have not been and will not be registered under the Financial Instruments and Exchange Law of Japan (the Financial Instruments and Exchange Law) and our securities will not be offered or sold, directly or indirectly, in Japan, or to, or for the benefit of, any resident of Japan (which term as used herein means any person resident in Japan, including any corporation or other entity organized under the laws of Japan), or to others for re-offering or resale, directly or indirectly, in Japan, or to a resident of Japan, except pursuant to an exemption from the registration requirements of, and otherwise in compliance with, the Financial Instruments and Exchange Law and any other applicable laws, regulations and ministerial guidelines of Japan.
Notice to Prospective Investors in the Singapore
This document has not been registered as a prospectus with the Monetary Authority of Singapore and in Singapore, the offer and sale of our securities is made pursuant to exemptions provided in sections 274 and 275 of the Securities and Futures Act, Chapter 289 of Singapore (“SFA”). Accordingly, this prospectus and any other
122
Table of Contents
document or material in connection with the offer or sale, or invitation for subscription or purchase, of our securities may not be circulated or distributed, nor may our securities be offered or sold, or be made the subject of an invitation for subscription or purchase, whether directly or indirectly, to persons in Singapore other than (i) to an institutional investor as defined in Section 4A of the SFA pursuant to Section 274 of the SFA, (ii) to a relevant person as defined in section 275(2) of the SFA pursuant to Section 275(1) of the SFA, or any person pursuant to Section 275(1A) of the SFA, and in accordance with the conditions specified in Section 275 of the SFA or (iii) otherwise pursuant to, and in accordance with the conditions of, any other applicable provision of the SFA, in each case subject to compliance with the conditions (if any) set forth in the SFA. Moreover, this document is not a prospectus as defined in the SFA. Accordingly, statutory liability under the SFA in relation to the content of prospectuses would not apply. Prospective investors in Singapore should consider carefully whether an investment in our securities is suitable for them.
Where our securities are subscribed or purchased under Section 275 of the SFA by a relevant person which is:
| (a) | by a corporation (which is not an accredited investor as defined in Section 4A of the SFA) the sole business of which is to hold investments and the entire share capital of which is owned by one or more individuals, each of whom is an accredited investor; or |
| (b) | for a trust (where the trustee is not an accredited investor) whose sole purpose is to hold investments and each beneficiary of the trust is an individual who is an accredited investor, |
shares of that corporation or the beneficiaries’ rights and interest (howsoever described) in that trust shall not be transferable for six months after that corporation or that trust has acquired the shares under Section 275 of the SFA, except:
(1) to an institutional investor (for corporations under Section 274 of the SFA) or to a relevant person defined in Section 275(2) of the SFA, or any person pursuant to an offer that is made on terms that such shares of that corporation or such rights and interest in that trust are acquired at a consideration of not less than S$200,000 (or its equivalent in a foreign currency) for each transaction, whether such amount is to be paid for in cash or by exchange of securities or other assets, and further for corporations, in accordance with the conditions, specified in Section 275 of the SFA;
(2) where no consideration is given for the transfer; or
(3) where the transfer is by operation of law.
In addition, investors in Singapore should note that the securities acquired by them are subject to resale and transfer restrictions specified under Section 276 of the SFA, and they, therefore, should seek their own legal advice before effecting any resale or transfer of their securities.
Notice to Prospective Investors in the Dubai International Financial Centre
This prospectus supplement relates to an Exempt Offer in accordance with the Offered Securities Rules of the Dubai Financial Services Authority (“DFSA”). This prospectus supplement is intended for distribution only to persons of a type specified in the Offered Securities Rules of the DFSA. It must not be delivered to, or relied on by, any other person. The DFSA has no responsibility for reviewing or verifying any documents in connection with Exempt Offers. The DFSA has not approved this prospectus supplement nor taken steps to verify the information set forth herein and has no responsibility for the prospectus supplement. The shares to which this prospectus supplement relates may be illiquid and/or subject to restrictions on their resale. Prospective purchasers of the shares offered should conduct their own due diligence on the shares. If you do not understand the contents of this prospectus supplement you should consult an authorized financial advisor.
123
Table of Contents
Our counsel, Willkie Farr & Gallagher LLP, New York, New York, will issue an opinion regarding the validity of our common stock offered by this prospectus. Certain legal matters in connection with this offering will be passed upon for the underwriters by Cahill Gordon & Reindel LLP, New York, New York.
The consolidated financial statements and schedules of Ryerson Holding as of December 31, 2012 and 2011 and for the years ended December 31, 2012, 2011 and 2010 included in this prospectus and registration statement have been audited by Ernst & Young LLP, our independent registered public accounting firm, as set forth in their report thereon appearing elsewhere herein, and have been included in reliance upon their report given on their authority as experts in accounting and auditing.
WHERE YOU CAN FIND MORE INFORMATION
We have filed with the SEC a registration statement on Form S-1 under the Securities Act relating to the shares of our common stock being offered by this prospectus. This prospectus, which constitutes part of that registration statement, does not contain all of the information set forth in the registration statement or the exhibits and schedules which are part of the registration statement. For further information about us and the common stock offered, see the registration statement and the exhibits and schedules thereto. Statements contained in this prospectus regarding the contents of any contract or any other document to which reference is made are not necessarily complete, and, in each instance where a copy of a contract or other document has been filed as an exhibit to the registration statement, reference is made to the copy so filed, each of those statements being qualified in all respects by the reference.
A copy of the registration statement, the exhibits and schedules thereto and any other document we file may be inspected without charge at the public reference facilities maintained by the SEC in 100 F Street, N.E., Washington, D.C. 20549 and copies of all or any part of the registration statement may be obtained from this office upon the payment of the fees prescribed by the SEC. The public may obtain information on the operation of the public reference facilities in Washington, D.C. by calling the SEC at 1-800-SEC-0330. Our filings with the SEC are available to the public from the SEC’s website at www.sec.gov.
Upon the completion of this offering, we will be subject to the information and periodic reporting requirements of the Exchange Act applicable to a company with securities registered pursuant to Section 12 of the Exchange Act. In accordance therewith, we will file proxy statements and other information with the SEC. All documents filed with the SEC are available for inspection and copying at the public reference room and website of the SEC referred to above. Ryerson Inc. maintains a website at www.ryerson.com. You may access our reports, proxy statements and other information free of charge at this website as soon as reasonably practicable after such material is electronically filed with, or furnished to, the SEC. The information on such website is not incorporated by reference and is not a part of this prospectus.
124
Table of Contents
Index to Consolidated Financial Statements
F-1
Table of Contents
REPORT OF INDEPENDENT REGISTERED PUBLIC ACCOUNTING FIRM
The Board of Directors and Stockholders of Ryerson Holding Corporation
We have audited the accompanying consolidated balance sheets of Ryerson Holding Corporation and Subsidiary Companies as of December 31, 2012 and 2011, and the related consolidated statements of operations and comprehensive income, stockholders’ equity, and cash flows for each of the three years in the period ended December 31, 2012. Our audits also included the financial statement schedules listed in the index to the consolidated financial statements. These financial statements are the responsibility of the Company’s management. Our responsibility is to express an opinion on these financial statements and schedules based on our audits.
We conducted our audits in accordance with the standards of the Public Company Accounting Oversight Board (United States). Those standards require that we plan and perform the audit to obtain reasonable assurance about whether the financial statements are free of material misstatement. We were not engaged to perform an audit of the Company’s internal control over financial reporting. Our audits included consideration of internal control over financial reporting as a basis for designing audit procedures that are appropriate in the circumstances, but not for the purpose of expressing an opinion on the effectiveness of the Company’s internal control over financial reporting. Accordingly, we express no such opinion. An audit also includes examining, on a test basis, evidence supporting the amounts and disclosures in the financial statements, assessing the accounting principles used and significant estimates made by management, and evaluating the overall financial statement presentation. We believe that our audits provide a reasonable basis for our opinion.
In our opinion, the financial statements referred to above present fairly, in all material respects, the consolidated financial position of Ryerson Holding Corporation and Subsidiary Companies at December 31, 2012 and 2011, and the consolidated results of its operations and its cash flows for each of the three years in the period ended December 31, 2012, in conformity with U.S. generally accepted accounting principles. Also, in our opinion, the related financial statement schedules, when considered in relation to the basic financial statements taken as a whole, present fairly, in all material respects, the information set forth therein.
Ernst & Young LLP
Chicago, Illinois
March 19, 2013 (except for Note 18 and Note 19 as to which the date is , 2013)
The foregoing report is in the form that will be signed upon completion of the termination of the corporate advisory services agreement and the completion of the for 1.00 split of the common stock of Ryerson Holding Corporation as described in Note 19 to the consolidated financial statements.
/s/ Ernst & Young LLP
Chicago, Illinois
December 3, 2013
F-2
Table of Contents
RYERSON HOLDING CORPORATION AND SUBSIDIARY COMPANIES
CONSOLIDATED STATEMENTS OF OPERATIONS
(In millions)
| Year Ended December 31 | ||||||||||||
| 2012 | 2011 | 2010 | ||||||||||
| Net sales |
$ | 4,024.7 | $ | 4,729.8 | $ | 3,895.5 | ||||||
| Cost of materials sold |
3,315.1 | 4,071.0 | 3,355.7 | |||||||||
|
|
|
|
|
|
|
|||||||
| Gross profit |
709.6 | 658.8 | 539.8 | |||||||||
| Warehousing, delivery, selling, general and administrative |
508.9 | 539.7 | 506.9 | |||||||||
| Restructuring and other charges |
1.1 | 11.1 | 12.0 | |||||||||
| Gain on insurance settlement |
— | — | (2.6 | ) | ||||||||
| Impairment charges on fixed assets and goodwill |
1.0 | 9.3 | 1.4 | |||||||||
| Pension and other postretirement benefits curtailment (gain) loss |
(1.7 | ) | — | 2.0 | ||||||||
|
|
|
|
|
|
|
|||||||
| Operating profit |
200.3 | 98.7 | 20.1 | |||||||||
| Other expense: |
||||||||||||
| Other income and (expense), net |
(33.5 | ) | 4.6 | (3.2 | ) | |||||||
| Interest and other expense on debt |
(126.5 | ) | (123.1 | ) | (107.5 | ) | ||||||
|
|
|
|
|
|
|
|||||||
| Income (loss) before income taxes |
40.3 | (19.8 | ) | (90.6 | ) | |||||||
| Provision (benefit) for income taxes |
(5.5 | ) | (11.0 | ) | 13.1 | |||||||
|
|
|
|
|
|
|
|||||||
| Net income (loss) |
45.8 | (8.8 | ) | (103.7 | ) | |||||||
| Less: Net income (loss) attributable to noncontrolling interest |
(1.3 | ) | (0.7 | ) | 0.3 | |||||||
|
|
|
|
|
|
|
|||||||
| Net income (loss) attributable to Ryerson Holding Corporation |
$ | 47.1 | $ | (8.1 | ) | $ | (104.0 | ) | ||||
|
|
|
|
|
|
|
|||||||
| Basic and diluted income (loss) per share |
$ | 9.41 | $ | (1.62 | ) | $ | (20.80 | ) | ||||
|
|
|
|
|
|
|
|||||||
See Notes to Consolidated Financial Statements.
F-3
Table of Contents
RYERSON HOLDING CORPORATION AND SUBSIDIARY COMPANIES
CONSOLIDATED STATEMENTS OF COMPREHENSIVE INCOME
(In millions)
| Year
Ended December 31, |
||||||||||||
| 2012 | 2011 | 2010 | ||||||||||
| Net income (loss) |
$ | 45.8 | $ | (8.8 | ) | $ | (103.7 | ) | ||||
| Other comprehensive income (loss), before tax: |
||||||||||||
| Foreign currency translation adjustments |
3.9 | (1.3 | ) | 11.1 | ||||||||
| Unrealized gain (loss) on available-for-sale investment |
7.7 | (9.8 | ) | 5.4 | ||||||||
| Changes in defined benefit pension and other post-retirement benefit plans |
(51.5 | ) | (66.7 | ) | (19.0 | ) | ||||||
|
|
|
|
|
|
|
|||||||
| Other comprehensive loss |
(39.9 | ) | (77.8 | ) | (2.5 | ) | ||||||
| Total comprehensive income (loss), before tax |
5.9 | (86.6 | ) | (106.2 | ) | |||||||
| Income tax benefit related to items of other comprehensive income |
(2.1 | ) | (1.5 | ) | (0.7 | ) | ||||||
|
|
|
|
|
|
|
|||||||
| Comprehensive income (loss), after tax |
8.0 | (85.1 | ) | (105.5 | ) | |||||||
| Less: comprehensive income (loss) attributable to the noncontrolling interest |
(1.7 | ) | (0.5 | ) | 0.4 | |||||||
|
|
|
|
|
|
|
|||||||
| Comprehensive income (loss) attributable to Ryerson Holding Corporation |
$ | 9.7 | $ | (84.6 | ) | $ | (105.9 | ) | ||||
|
|
|
|
|
|
|
|||||||
See Notes to Consolidated Financial Statements.
F-4
Table of Contents
RYERSON HOLDING CORPORATION AND SUBSIDIARY COMPANIES
CONSOLIDATED STATEMENTS OF CASH FLOWS
(In millions)
| Year Ended December 31, | ||||||||||||
| 2012 | 2011 | 2010 | ||||||||||
| Operating Activities: |
||||||||||||
| Net income (loss) |
$ | 45.8 | $ | (8.8 | ) | $ | (103.7 | ) | ||||
|
|
|
|
|
|
|
|||||||
| Adjustments to reconcile net income (loss) to net cash provided by (used in) operating activities: |
||||||||||||
| Depreciation and amortization |
47.0 | 43.0 | 38.4 | |||||||||
| Deferred income taxes |
(9.2 | ) | (11.6 | ) | 58.8 | |||||||
| Provision for allowances, claims and doubtful accounts |
1.7 | 3.4 | 3.0 | |||||||||
| Restructuring and other charges |
1.1 | 11.1 | 12.0 | |||||||||
| Noncash interest expense related to debt discount amortization |
39.0 | 41.5 | 30.9 | |||||||||
| Impairment charges on fixed assets and goodwill |
1.0 | 9.3 | 1.4 | |||||||||
| Gain on bargain purchase |
— | (5.8 | ) | — | ||||||||
| Pension and other postretirement benefits curtailment (gain) loss |
(1.7 | ) | — | 2.0 | ||||||||
| Loss on retirement of debt |
32.8 | 0.2 | — | |||||||||
| Other items |
2.8 | 1.2 | (0.3 | ) | ||||||||
| Change in operating assets and liabilities, net of effects of acquisitions: |
||||||||||||
| Receivables |
120.8 | (1.7 | ) | (137.5 | ) | |||||||
| Inventories |
(5.8 | ) | 92.9 | (170.9 | ) | |||||||
| Other assets |
9.8 | 10.9 | 10.1 | |||||||||
| Accounts payable |
(38.3 | ) | (71.7 | ) | 102.3 | |||||||
| Accrued liabilities |
(8.4 | ) | (14.7 | ) | (2.3 | ) | ||||||
| Accrued taxes payable/receivable |
(2.4 | ) | 1.9 | (6.0 | ) | |||||||
| Deferred employee benefit costs |
(49.5 | ) | (46.6 | ) | (36.9 | ) | ||||||
|
|
|
|
|
|
|
|||||||
| Net adjustments |
140.7 | 63.3 | (95.0 | ) | ||||||||
|
|
|
|
|
|
|
|||||||
| Net cash provided by (used in) operating activities |
186.5 | 54.5 | (198.7 | ) | ||||||||
|
|
|
|
|
|
|
|||||||
| Investing Activities: |
||||||||||||
| Acquisitions, net of cash acquired |
(5.1 | ) | (95.2 | ) | (12.0 | ) | ||||||
| Decrease in restricted cash |
1.4 | 16.7 | 3.9 | |||||||||
| Capital expenditures |
(40.8 | ) | (47.0 | ) | (27.0 | ) | ||||||
| Investment in joint venture |
(2.9 | ) | — | — | ||||||||
| Increase in cash due to consolidation of joint venture |
3.0 | — | — | |||||||||
| Proceeds from sales of property, plant and equipment |
11.6 | 11.3 | 5.5 | |||||||||
| Other investments |
(2.5 | ) | (0.8 | ) | (14.8 | ) | ||||||
|
|
|
|
|
|
|
|||||||
| Net cash used in investing activities |
(35.3 | ) | (115.0 | ) | (44.4 | ) | ||||||
|
|
|
|
|
|
|
|||||||
| Financing Activities: |
||||||||||||
| Long-term debt issued |
900.0 | — | 220.2 | |||||||||
| Long-term debt retired |
(829.5 | ) | — | — | ||||||||
| Repayment of debt |
— | (11.8 | ) | (10.6 | ) | |||||||
| Proceeds from credit facility borrowings |
— | — | 180.0 | |||||||||
| Repayment of credit facility borrowings |
— | — | (180.0 | ) | ||||||||
| Net proceeds/(repayments) of short-term borrowings |
(149.0 | ) | 68.5 | 206.0 | ||||||||
| Long-term debt issuance costs |
(18.1 | ) | — | (5.8 | ) | |||||||
| Credit facility issuance costs |
— | (15.8 | ) | — | ||||||||
| Purchase of subsidiary shares from noncontrolling interest |
— | — | (17.5 | ) | ||||||||
| Net increase (decrease) in book overdrafts |
(11.8 | ) | 17.0 | 6.6 | ||||||||
| Distributions made to parent |
(35.0 | ) | — | (213.8 | ) | |||||||
|
|
|
|
|
|
|
|||||||
| Net cash provided by (used in) financing activities |
(143.4 | ) | 57.9 | 185.1 | ||||||||
|
|
|
|
|
|
|
|||||||
| Net increase (decrease) in cash and cash equivalents |
7.8 | (2.6 | ) | (58.0 | ) | |||||||
| Effect of exchange rate changes on cash and cash equivalents |
1.7 | 1.7 | 5.6 | |||||||||
|
|
|
|
|
|
|
|||||||
| Net change in cash and cash equivalents |
9.5 | (0.9 | ) | (52.4 | ) | |||||||
| Cash and cash equivalents—beginning of period |
61.7 | 62.6 | 115.0 | |||||||||
|
|
|
|
|
|
|
|||||||
| Cash and cash equivalents—end of period |
$ | 71.2 | $ | 61.7 | $ | 62.6 | ||||||
|
|
|
|
|
|
|
|||||||
| Supplemental Disclosures |
||||||||||||
| Cash paid (received) during the period for: |
||||||||||||
| Interest paid to third parties |
$ | 67.6 | $ | 71.5 | $ | 66.1 | ||||||
| Income taxes, net |
5.2 | (3.1 | ) | (46.8 | ) | |||||||
See Notes to Consolidated Financial Statements.
F-5
Table of Contents
RYERSON HOLDING CORPORATION AND SUBSIDIARY COMPANIES
(In millions, except shares)
| At December 31, | ||||||||
| 2012 | 2011 | |||||||
| Assets |
||||||||
| Current assets: |
||||||||
| Cash and cash equivalents |
$ | 71.2 | $ | 61.7 | ||||
| Restricted cash (Note 3) |
3.9 | 5.3 | ||||||
| Receivables less provision for allowances, claims and doubtful accounts of $7.1 in 2012 and $7.7 in 2011 |
394.1 | 513.9 | ||||||
| Inventories (Note 4) |
741.5 | 732.4 | ||||||
| Prepaid expenses and other assets |
42.4 | 41.0 | ||||||
|
|
|
|
|
|||||
| Total current assets |
1,253.1 | 1,354.3 | ||||||
| Property, plant and equipment, net of accumulated depreciation (Note 5) |
472.3 | 479.7 | ||||||
| Deferred income taxes (Note 17) |
41.0 | 37.2 | ||||||
| Other intangible assets (Note 6) |
57.4 | 62.2 | ||||||
| Goodwill (Note 7) |
96.6 | 96.3 | ||||||
| Deferred charges and other assets |
33.7 | 28.7 | ||||||
|
|
|
|
|
|||||
| Total assets |
$ | 1,954.1 | $ | 2,058.4 | ||||
|
|
|
|
|
|||||
| Liabilities |
||||||||
| Current liabilities: |
||||||||
| Accounts payable |
$ | 196.3 | $ | 245.1 | ||||
| Accrued liabilities: |
||||||||
| Salaries, wages and commissions |
32.1 | 40.2 | ||||||
| Deferred income taxes (Note 17) |
123.5 | 132.5 | ||||||
| Interest on debt |
21.2 | 10.3 | ||||||
| Other accrued liabilities |
33.8 | 52.4 | ||||||
| Short-term debt (Note 9) |
35.3 | 52.0 | ||||||
| Current portion of deferred employee benefits |
14.2 | 15.2 | ||||||
|
|
|
|
|
|||||
| Total current liabilities |
456.4 | 547.7 | ||||||
| Long-term debt (Note 9) |
1,270.1 | 1,264.2 | ||||||
| Deferred employee benefits (Note 10) |
504.4 | 502.9 | ||||||
| Taxes and other credits |
15.4 | 11.2 | ||||||
|
|
|
|
|
|||||
| Total liabilities |
2,246.3 | 2,326.0 | ||||||
| Commitments and contingencies (Note 11) |
||||||||
| Redeemable noncontrolling interest (Note 2) |
1.7 | — | ||||||
| Equity |
||||||||
| Ryerson Holding Corporation stockholders’ equity (deficit): |
||||||||
| Common stock, $0.01 par value; 10,000,000 shares authorized; 5,000,000 shares issued at 2012 and 2011 |
— | — | ||||||
| Capital in excess of par value |
189.9 | 224.9 | ||||||
| Accumulated deficit |
(234.4 | ) | (281.5 | ) | ||||
| Accumulated other comprehensive loss |
(252.1 | ) | (214.7 | ) | ||||
|
|
|
|
|
|||||
| Total Ryerson Holding Corporation stockholders’ equity (deficit) |
(296.6 | ) | (271.3 | ) | ||||
| Noncontrolling interest |
2.7 | 3.7 | ||||||
|
|
|
|
|
|||||
| Total equity (deficit) |
(293.9 | ) | (267.6 | ) | ||||
|
|
|
|
|
|||||
| Total liabilities and equity |
$ | 1,954.1 | $ | 2,058.4 | ||||
|
|
|
|
|
|||||
See Notes to Consolidated Financial Statements.
F-6
Table of Contents
RYERSON HOLDING CORPORATION AND SUBSIDIARY COMPANIES
CONSOLIDATED STATEMENTS OF STOCKHOLDERS’ EQUITY (DEFICIT)
(In millions, except shares in thousands)
| Ryerson Holding Corporation Stockholders | ||||||||||||||||||||||||||||||||||||||||
| Accumulated Other Comprehensive Income (Loss) |
||||||||||||||||||||||||||||||||||||||||
| Common Stock |
Capital in Excess of Par Value |
Accumulated Deficit |
Foreign Currency Translation |
Benefit Plan Liabilities |
Unrealized Gain (Loss) on Available- For-Sale Investments |
Non-controlling Interest |
Total Equity |
Redeemable Non- controlling Interest |
||||||||||||||||||||||||||||||||
| Shares | Dollars | Dollars | Dollars | Dollars | Dollars | Dollars | Dollars | Dollars | Dollars | |||||||||||||||||||||||||||||||
| (In millions, except shares in thousands) | ||||||||||||||||||||||||||||||||||||||||
| Balance at January 1, 2010 |
5,000 | $ | — | $ | 443.5 | $ | (169.4 | ) | $ | (17.6 | ) | $ | (118.7 | ) | $ | — | $ | 16.5 | $ | 154.3 | $ | — | ||||||||||||||||||
| Net income (loss) |
— | — | — | (104.0 | ) | — | — | — | 0.3 | (103.7 | ) | — | ||||||||||||||||||||||||||||
| Foreign currency translation |
— | — | — | — | 11.0 | — | — | 0.1 | 11.1 | — | ||||||||||||||||||||||||||||||
| Distributions to parent |
— | — | (213.8 | ) | — | — | — | — | — | (213.8 | ) | — | ||||||||||||||||||||||||||||
| Purchase of subsidiary shares from noncontrolling interest |
— | — | (4.8 | ) | — | — | — | — | (12.7 | ) | (17.5 | ) | — | |||||||||||||||||||||||||||
| Changes in defined benefit pension and other post-retirement benefit plans (net of tax benefit of $0.7) |
— | — | — | — | — | (18.3 | ) | — | — | (18.3 | ) | — | ||||||||||||||||||||||||||||
| Unrealized gain on available-for-sale investment |
— | — | — | — | — | — | 5.4 | — | 5.4 | — | ||||||||||||||||||||||||||||||
|
|
|
|
|
|
|
|
|
|
|
|
|
|
|
|
|
|
|
|
|
|||||||||||||||||||||
| Balance at December 31, 2010 |
5,000 | $ | — | $ | 224.9 | $ | (273.4 | ) | $ | (6.6 | ) | $ | (137.0 | ) | $ | 5.4 | $ | 4.2 | $ | (182.5 | ) | $ | — | |||||||||||||||||
| Net loss |
— | — | — | (8.1 | ) | — | — | — | (0.7 | ) | (8.8 | ) | — | |||||||||||||||||||||||||||
| Foreign currency translation |
— | — | — | — | (1.5 | ) | — | — | 0.2 | (1.3 | ) | — | ||||||||||||||||||||||||||||
| Changes in defined benefit pension and other post-retirement benefit plans (net of tax benefit of $1.5) |
— | — | — | — | — | (65.2 | ) | — | — | (65.2 | ) | — | ||||||||||||||||||||||||||||
| Unrealized loss on available-for-sale investment |
— | — | — | — | — | — | (9.8 | ) | — | (9.8 | ) | — | ||||||||||||||||||||||||||||
|
|
|
|
|
|
|
|
|
|
|
|
|
|
|
|
|
|
|
|
|
|||||||||||||||||||||
| Balance at December 31, 2011 |
5,000 | $ | — | $ | 224.9 | $ | (281.5 | ) | $ | (8.1 | ) | $ | (202.2 | ) | $ | (4.4 | ) | $ | 3.7 | $ | (267.6 | ) | $ | — | ||||||||||||||||
| Net income (loss) |
— | — | — | 47.1 | — | — | — | (1.0 | ) | 46.1 | (0.3 | ) | ||||||||||||||||||||||||||||
| Foreign currency translation |
— | — | — | — | 4.3 | — | — | — | 4.3 | (0.4 | ) | |||||||||||||||||||||||||||||
| Distributions to parent |
— | — | (35.0 | ) | — | — | — | — | — | (35.0 | ) | — | ||||||||||||||||||||||||||||
| Changes in defined benefit pension and other post-retirement benefit plans (net of tax benefit of $2.1) |
— | — | — | — | — | (49.4 | ) | — | — | (49.4 | ) | — | ||||||||||||||||||||||||||||
| Unrealized gain on available-for-sale investment |
— | — | — | — | — | — | 7.7 | — | 7.7 | — | ||||||||||||||||||||||||||||||
| Fair value of noncontrolling interest associated with business acquired |
— | — | — | — | — | — | — | — | — | 2.4 | ||||||||||||||||||||||||||||||
|
|
|
|
|
|
|
|
|
|
|
|
|
|
|
|
|
|
|
|
|
|||||||||||||||||||||
| Balance at December 31, 2012 |
5,000 | $ | — | $ | 189.9 | $ | (234.4 | ) | $ | (3.8 | ) | $ | (251.6 | ) | $ | 3.3 | $ | 2.7 | $ | (293.9 | ) | $ | 1.7 | |||||||||||||||||
|
|
|
|
|
|
|
|
|
|
|
|
|
|
|
|
|
|
|
|
|
|||||||||||||||||||||
See Notes to Consolidated Financial Statements.
F-7
Table of Contents
NOTES TO CONSOLIDATED FINANCIAL STATEMENTS
Note 1: Summary of Accounting and Financial Policies
Business Description and Basis of Presentation. Ryerson Holding Corporation (“Ryerson Holding”), a Delaware corporation, is the parent company of Ryerson Inc. (“Ryerson”), a Delaware corporation. Ryerson Holding is 99% owned by affiliates of Platinum Equity, LLC (“Platinum”).
On October 19, 2007, the merger (the “Platinum Acquisition”) of Rhombus Merger Corporation (“Merger Sub”), a Delaware corporation and a wholly-owned subsidiary of Ryerson Holding, with and into Ryerson, was consummated in accordance with the Agreement and Plan of Merger, dated July 24, 2007, by and among Ryerson, Ryerson Holding and Merger Sub (the “Merger Agreement”). Upon the closing of the Platinum Acquisition, Ryerson became a wholly-owned subsidiary of Ryerson Holding.
Ryerson conducts materials distribution operations in the United States through its wholly-owned direct subsidiary Joseph T. Ryerson & Son, Inc. (“JT Ryerson”), a Delaware corporation, in Canada through its indirect wholly-owned subsidiary Ryerson Canada, Inc., a Canadian corporation (“Ryerson Canada”) and in Mexico through its indirect wholly-owned subsidiary Ryerson Metals de Mexico, S. de R.L. de C.V., a Mexican corporation (“Ryerson Mexico”). In addition to our North American operations, we conduct materials distribution operations in China through Ryerson China Limited (“Ryerson China”), formerly named VSC-Ryerson China Limited, a company in which we have a 100% ownership percentage subsequent to the purchase on July 12, 2010 of the remaining 20 percent interest previously owned by Van Shung Chong Holdings Limited (“VSC”) (see Note 2) and in Brazil through Açofran Aços e Metais Ltda (“Açofran”), a company in which we have had a 50% direct ownership percentage since February 17, 2012. Unless the context indicates otherwise, Ryerson Holding, Ryerson, JT Ryerson, Ryerson Canada, Ryerson China, Ryerson Mexico and Açofran together with their subsidiaries, are collectively referred to herein as “Ryerson Holding,” “we,” “us,” “our,” or the “Company.”
Principles of Consolidation. The Company consolidates entities in which it owns or controls more than 50% of the voting shares. All significant intercompany balances and transactions have been eliminated in consolidation. Additionally, variable interest entities that do not have sufficient equity investment to permit the entity to finance its activities without additional subordinated support from other parties or whose equity investors lack the characteristics of a controlling financial interest for which the Company is the primary beneficiary are included in the consolidated financial statements. There were no such variable entities that were required to be consolidated as of December 31, 2012 or 2011.
Business Segments. Financial Accounting Standards Board (“FASB”) Accounting Standards Codification (“ASC”) 280, “Segment Reporting” (“ASC 280”), establishes standards for reporting information on operating segments in interim and annual financial statements. Our Chief Executive Officer, together with the Operating Committee selected by our Board of Directors, serve as our Chief Operating Decision Maker (“CODM”). Our CODM reviews our financial information for purposes of making operational decisions and assessing financial performance. The CODM views our business globally as metals service centers. We have one operating and reportable segment, metal service centers, in accordance with the criteria set forth in ASC 280.
Use of Estimates. The preparation of financial statements in conformity with Generally Accepted Accounting Principles in the United States requires management to make estimates and assumptions that affect the amounts reported in the consolidated financial statements and related notes to the financial statements. Changes in such estimates may affect amounts reported in future periods.
Equity Investments. Investments in affiliates in which the Company’s ownership is 20% to 50% are accounted for by the equity method. Equity income is reported in “Cost of materials sold” in the Consolidated Statements of Operations. Equity income during the years ended December 31, 2012, 2011 and 2010 totaled $0.2 million, $0.1 million, and zero, respectively.
F-8
Table of Contents
Revenue Recognition. Revenue is recognized in accordance with FASB ASC 605, “Revenue Recognition.” Revenue is recognized upon delivery of product to customers. The timing of shipment is substantially the same as the timing of delivery to customers given the proximity of the Company’s distribution sites to its customers. Revenue is recorded net of returns, allowances, customer discounts and incentives. Sales taxes collected from customers and remitted to governmental authorities are accounted for on a net (excluded from revenues) basis.
Provision for allowances, claims and doubtful accounts. We perform ongoing credit evaluations of customers and set credit limits based upon review of the customers’ current credit information and payment history. The Company monitors customer payments and maintains a provision for estimated credit losses based on historical experience and specific customer collection issues that the Company has identified. Estimation of such losses requires adjusting historical loss experience for current economic conditions and judgments about the probable effects of economic conditions on certain customers. The Company cannot guarantee that the rate of future credit losses will be similar to past experience. Provisions for allowances and claims are based upon historical rates, expected trends and estimates of potential returns, allowances, customer discounts and incentives. The Company considers all available information when assessing the adequacy of the provision for allowances, claims and doubtful accounts.
Shipping and Handling Fees and Costs. Shipping and handling fees billed to customers are classified in “Net Sales” in our Consolidated Statement of Operations. Shipping and handling costs, primarily distribution costs, are classified in “Warehousing, delivery, selling, general and administrative” expenses in our Consolidated Statement of Operations. These costs totaled $87.3 million, $94.8 million and $82.1 million for the years ended December 31, 2012, 2011 and 2010, respectively.
Benefits for Retired Employees. The Company recognizes the funded status of its defined benefit pension and other postretirement plans in the Consolidated Balance Sheets, with changes in the funded status recognized through accumulated other comprehensive income (loss), net of tax, in the year in which the changes occur. The estimated cost of the Company’s defined benefit pension plan and its postretirement medical benefits are determined annually after considering information provided by consulting actuaries. Key factors used in developing estimates of these liabilities include assumptions related to discount rates, rates of return on investments, future compensation costs, healthcare cost trends, benefit payment patterns and other factors. The cost of these benefits for retirees is accrued during their term of employment. Pensions are funded primarily in accordance with the requirements of the Employee Retirement Income Security Act (“ERISA”) of 1974 and the Pension Protection Act of 2006 into a trust established for the Ryerson Pension Plan. Costs for retired employee medical benefits are funded when claims are submitted. Certain salaried employees are covered by a defined contribution plan, for which the cost is expensed in the period earned.
Cash Equivalents. Cash equivalents reflected in the financial statements are highly liquid, short-term investments with original maturities of three months or less that are an integral part of the Company’s cash management portfolio. Checks issued in excess of funds on deposit at the bank represent “book” overdrafts and are reclassified to accounts payable. Amounts reclassified totaled $37.5 million and $49.3 million at December 31, 2012 and 2011, respectively.
Inventory Valuation. Inventories are stated at the lower of cost or market value. We use the last-in, first-out (“LIFO”) method for valuing our domestic inventories. We use the weighted-average cost and the specific cost methods for valuing our foreign inventories.
F-9
Table of Contents
Property, Plant and Equipment. Property, plant and equipment, including land use rights, are depreciated for financial reporting purposes using the straight-line method over the estimated useful lives of the assets. The provision for depreciation in all periods presented is based on the following estimated useful lives of the assets:
| Land improvements |
20 years | |||
| Buildings |
45 years | |||
| Machinery and equipment |
15 years | |||
| Furniture and fixtures |
10 years | |||
| Transportation equipment |
6 years | |||
| Land use rights |
50 years |
Expenditures for normal repairs and maintenance are charged against income in the period incurred.
Goodwill. In accordance with FASB ASC 350, “Intangibles – Goodwill and Other” (“ASC 350”), goodwill is reviewed at least annually for impairment or whenever indicators of potential impairment exist. We test for impairment of goodwill by assessing various qualitative factors with respect to developments in our business and the overall economy and calculating the fair value of a reporting unit using the discounted cash flow method, as necessary. If we determine that it is more likely than not that the fair value of a reporting unit is less than the carrying value based on our qualitative assessment, we will proceed to the two-step goodwill impairment test. In step one, we compare the fair value of the reporting unit in which goodwill resides to its carrying value. If the carrying amount exceeds the fair value, the second step of the goodwill impairment test is performed to measure the amount of the impairment loss, if any. In the second step, the implied fair value of the goodwill is estimated as the fair value of the reporting unit used in the first step less the fair value of all other net tangible and intangible assets of the reporting unit. If the carrying amount of goodwill exceeds its implied fair value, an impairment loss is recognized in an amount equal to that excess, not to exceed the carrying amount of the goodwill. The fair value of the reporting units are estimated using an average of an income approach and a market approach as this combination is deemed to be the most indicative of fair value in an orderly transaction between market participants.
Long-lived Assets and Other Intangible Assets. Long-lived assets held and used by the Company are reviewed for impairment whenever events or changes in circumstances indicate that the carrying amount of an asset may not be recoverable. The Company estimates the future cash flows expected to result from the use of the asset and its eventual disposition. If the sum of the expected future cash flows (undiscounted and without interest charges) is less than the carrying amount of the asset, an impairment is recognized. Any related impairment loss is calculated based upon comparison of the fair value to the carrying value of the asset. Separate intangible assets that have finite useful lives are amortized over their useful lives. An impaired intangible asset would be written down to fair value, using the discounted cash flow method.
Deferred Financing Costs. Deferred financing costs associated with the issuance of debt are being amortized using the effective interest method over the life of the debt.
Income Taxes. Deferred tax assets or liabilities reflect temporary differences between amounts of assets and liabilities for financial and tax reporting. Such amounts are adjusted, as appropriate, to reflect changes in enacted tax rates expected to be in effect when the temporary differences reverse. A valuation allowance is established to offset any deferred tax assets if, based upon the available evidence, it is more likely than not that some or all of the deferred tax assets will not be realized. The determination of the amount of a valuation allowance to be provided on recorded deferred tax assets involves estimates regarding (1) the timing and amount of the reversal of taxable temporary differences, (2) expected future taxable income, (3) the impact of tax planning strategies and (4) the ability to carry back deferred tax assets to offset prior taxable income. In assessing the need for a valuation allowance, the Company considers all available positive and negative evidence, including past operating results, projections of future taxable income and the feasibility of ongoing tax planning strategies. The projections of future taxable income include a number of estimates and assumptions regarding volume, pricing, costs and industry cyclicality.
F-10
Table of Contents
Significant judgment is required in determining income tax provisions and in evaluating tax positions. In the normal course of business, the Company and its subsidiaries are examined by various federal, state and foreign tax authorities. The Company records the impact of a tax position, if that position is more likely than not to be sustained on audit, based on the technical merits of the position. The Company regularly assesses the potential outcomes of these examinations and any future examinations for the current or prior years in determining the adequacy of our provision for income taxes. The Company continually assesses the likelihood and amount of potential adjustments and adjusts the income tax provision, the current tax liability and deferred taxes in the period in which the facts that give rise to a revision become known.
The Company recognizes the benefit of tax positions when a benefit is more likely than not (i.e. greater than 50% likely) to be sustained on its technical merits. Recognized tax benefits are measured at the largest amount that is more likely than not to be sustained, based on cumulative probability, in final settlement of the position. The Company recognizes interest and penalties related to unrecognized tax benefits as a component of income tax expense.
Earnings Per Share Data. Basic earnings (loss) per share is computed by dividing net earnings (loss) available to common stockholders by the weighted average number of common shares outstanding for the period. Diluted earnings (loss) per share is computed by giving effect to all dilutive potential common shares that were outstanding during the period. Basic earnings (loss) per share excludes the dilutive effect of common stock equivalents such as stock options and warrants, while diluted earnings (loss) per share, assuming dilution, includes such dilutive effects. Subsequent to October 19, 2007, Ryerson Holding does not have any securities or other items that are convertible into common shares, therefore basic and fully diluted EPS are the same.
Foreign Currency. The Company translates assets and liabilities of its foreign subsidiaries, where the functional currency is the local currency, into U.S. dollars at the current rate of exchange on the last day of the reporting period. Revenues and expenses are translated at the average monthly exchange rates prevailing during the year.
For foreign currency transactions, the Company translates these amounts to the Company’s functional currency at the exchange rate effective on the invoice date. If the exchange rate changes between the time of purchase and the time actual payment is made, a foreign exchange transaction gain or loss results which is included in determining net income (loss) for the year. The Company recognized $1.5 million, $0.8 million and $2.7 million of exchange losses for the years ended December 31, 2012, 2011 and 2010, respectively. These amounts are primarily classified in “Other income and (expense), net” in our Consolidated Statements of Operations.
Recent Accounting Pronouncements
In May 2011, the FASB issued Accounting Standards Update (“ASU”) 2011-04, “Amendments to Achieve Common Fair Value Measurement and Disclosure Requirements in U.S. GAAP and IFRSs” (“ASU 2011-04”). ASU 2011-04 amends ASC 820, “Fair Value Measurements” (“ASC 820”), providing a consistent definition and measurement of fair value, as well as similar disclosure requirements between U.S. GAAP and International Financial Reporting Standards. ASU 2011-04 changes certain fair value measurement principles, clarifies the application of existing fair value measurement and expands the ASC 820 disclosure requirements, particularly for Level 3 fair value measurements. The revised guidance is effective for interim and annual periods beginning after December 15, 2011 and early application by public entities is prohibited. We adopted this guidance on January 1, 2012. The adoption did not have a material impact on our financial statements.
In June 2011, the FASB issued ASU 2011-05, “Comprehensive Income (ASC Topic 220): Presentation of Comprehensive Income” (“ASU 2011-05”). Under ASU 2011-05, entities are required to present total comprehensive income either in a single, continuous statement of comprehensive income or in two separate but consecutive statements. Under the single-statement approach, entities must include the components of net income, a total for net income, the components of other comprehensive income and a total for comprehensive income. Under the two-statement approach, entities must report an income statement and, immediately
F-11
Table of Contents
following, a statement of other comprehensive income. The amendments in ASU 2011-05 do not change the items that must be reported in other comprehensive income or when an item of other comprehensive income must be reclassified to net income. ASU 2011-05 should be applied retrospectively. The provisions for this pronouncement are effective for fiscal years, and interim periods within those years, beginning after December 15, 2011, with early adoption permitted. We have adopted this pronouncement for our fiscal year beginning January 1, 2012. The adoption did not have a material impact on our financial statements.
In September 2011, the FASB issued ASU 2011-08, “Intangibles—Goodwill and Other (Topic 350): Testing Goodwill for Impairment” (“ASU 2011-08”). ASU 2011-08 allows an entity to make an initial qualitative evaluation, based on the entity’s events and circumstances, to determine whether it is more likely than not that the fair value of a reporting unit is less than its carrying amount. The results of this qualitative assessment determine whether it is necessary to perform the currently required two-step impairment test. The new guidance also expands upon the examples of events and circumstances that an entity should consider between annual impairment tests in determining whether it is more likely than not that the fair value of a reporting unit is less than its carrying amount. The new guidance is effective for annual and interim goodwill impairment tests performed for fiscal years beginning after December 15, 2011 with early adoption permitted. We adopted this guidance prospectively on January 1, 2012. The adoption did not have a material impact on our financial statements.
In February 2013, the FASB issued ASU 2013-2, “Reporting of Amounts Reclassified Out of Accumulated Other Comprehensive Income.” This guidance requires an entity to present, either on the face of the financial statements or as a disclosure in the notes, significant amounts reclassified out of accumulated other comprehensive income by the respective line items of net income, but only if the amount reclassified is required under GAAP to be reclassified to net income in its entirety in the same reporting period. For other amounts that are not required under GAAP to be reclassified in their entirety to net income, the guidance requires an entity to cross-reference to other disclosures required under GAAP that provide additional detail about those amounts. This guidance is effective for our fiscal year beginning January 1, 2013. As this standard only impacts presentation and disclosure requirements, its adoption will not have a material impact on our financial statements.
Note 2: Acquisitions
Singer Steel Company
On March 14, 2011, the Company acquired all the issued and outstanding capital stock of Singer Steel Company (“Singer”). Singer is a full-service steel value-added processor with state-of-the-art processing equipment. We believe that Singer’s capabilities strongly enhance Ryerson’s offering in the Midwest and Northeast United States.
The fair value of the consideration totaled $23.6 million on the acquisition date, of which $20.0 million was paid on the date of acquisition and $3.6 million was paid in 2012.
F-12
Table of Contents
The following table summarizes the fair values of the assets acquired and liabilities assumed at the acquisition date. The Company used a third-party valuation firm to estimate the fair values of the property, plant and equipment and intangible assets. Inventory was valued by the Company using acquisition date fair values of the metals.
| At March 14, 2011 |
||||
| (In millions) | ||||
| Cash |
$ | 0.3 | ||
| Restricted cash |
6.5 | |||
| Accounts receivable |
7.3 | |||
| Inventory |
16.3 | |||
| Property, plant, and equipment |
8.2 | |||
| Intangible assets |
4.3 | |||
| Other assets |
0.2 | |||
|
|
|
|||
| Total identifiable assets acquired |
43.1 | |||
|
|
|
|||
| Current liabilities |
11.4 | |||
| Deferred tax liabilities |
2.3 | |||
|
|
|
|||
| Total liabilities assumed |
13.7 | |||
|
|
|
|||
| Net identifiable assets acquired |
29.4 | |||
| Bargain purchase |
(5.8 | ) | ||
|
|
|
|||
| Net assets acquired |
$ | 23.6 | ||
|
|
|
|||
The fair value of accounts receivables acquired was $7.3 million, with a gross amount of $7.8 million. The Company expected $0.5 million to be uncollectible.
Of the $4.3 million of acquired intangible assets, $2.2 million was assigned to customer relationships with a useful life of 7 years, $1.7 million was assigned to trademarks with a useful life of 5 years and $0.4 million was assigned to a license agreement with a useful life of 7 years.
The transaction resulted in a bargain purchase primarily due to the fair value of acquired intangible assets and higher inventory valuation related to rising metals prices. The gain is included in other income and (expense), net in the Statement of Operations. The Company has recognized $0.4 million in acquisition-related fees, which is included in warehousing, delivery, selling, general and administrative expenses.
Included in the 2011 financial results is $36.1 million of revenue and $9.4 million (includes the $5.8 million bargain purchase gain) of net income from Singer since the acquisition date.
Turret Steel
On December 9, 2011, the Company acquired all the issued and outstanding capital stock of Turret Steel Industries, Inc., Sunbelt-Turret Steel, Inc., Wilcox-Turret Cold Drawn, Inc., and Imperial Trucking Company, LLC (collectively, “Turret”). Turret is a premier distributor of Special Bar Quality Carbon and Alloy bar products. We believe that Turret’s product offerings strongly enhance Ryerson’s strategy of increasing its presence in long and fabricated products.
Ryerson acquired Turret for a cash purchase price of $78.8 million, plus assumption of approximately $6.5 million of debt on the acquisition date. A total of $1.5 million of the $78.8 million cash purchase price was held back and paid to the seller in June 2012. The terms of the agreement also include deferred cash consideration payouts, totaling a maximum of $36.0 million over a period of 5 years, which are contingent on the seller’s continued employment with Ryerson as well as the financial performance of Turret. The deferred cash consideration will be recognized as compensation expense and recorded as it is incurred over the five year period.
F-13
Table of Contents
The following table summarizes the fair values of the assets acquired and liabilities assumed at the acquisition date. The Company used a third-party valuation firm to estimate the fair values of the property, plant and equipment and intangible assets. Inventory was valued by the Company using acquisition date fair values of the metals.
| At December 9, 2011 |
||||
| (In millions) | ||||
| Cash |
$ | 1.8 | ||
| Accounts receivable |
12.0 | |||
| Inventory |
26.7 | |||
| Property, plant, and equipment |
2.9 | |||
| Intangible assets |
45.1 | |||
| Goodwill |
25.1 | |||
| Other assets |
1.2 | |||
|
|
|
|||
| Total identifiable assets acquired |
114.8 | |||
|
|
|
|||
| Current liabilities |
17.5 | |||
| Deferred tax liabilities |
18.5 | |||
|
|
|
|||
| Total liabilities assumed |
36.0 | |||
|
|
|
|||
| Net assets acquired |
$ | 78.8 | ||
|
|
|
|||
The fair value of accounts receivables acquired was $12.0 million, with a gross amount of $12.4 million. The Company expected $0.4 million to be uncollectible.
Of the $45.1 million of acquired intangible assets, $27.8 million was assigned to customer relationships with useful lives between 7 and 11 years, $17.0 million was assigned to trademarks with a useful life of 20 years and $0.3 million was assigned to a covenant not to compete with a useful life of 7 years. The Company recognized $25.1 million of goodwill, reflecting management’s expected synergies.
The Company has recognized $0.4 million in acquisition-related fees, which is included in warehousing, delivery, selling, general and administrative expenses.
Included in the 2011 financial results is $5.6 million of revenue and $17.0 million of net income, which includes $16.6 million of tax benefits, from Turret since the acquisition date.
The following unaudited pro forma information presents consolidated results of operations for the year ended December 31, 2012 and 2011 as if the acquisitions of Singer and Turret on March 14, 2011 and December 9, 2011, respectively, had occurred on January 1, 2011:
| Pro Forma | ||||||||
| Year Ended December 31, | ||||||||
| 2012 | 2011 | |||||||
| (In millions) | ||||||||
| Net sales |
$ | 4,024.7 | $ | 4,866.8 | ||||
| Net income (loss) attributable to Ryerson Holding Corporation |
47.1 | (23.1 | ) | |||||
The 2011 supplemental pro forma net income (loss) was adjusted to exclude the $5.8 million bargain purchase gain and $18.0 million of tax benefits realized in 2011 as they are nonrecurring items.
Açofran
On February 17, 2012, the Company acquired 50% of the issued and outstanding capital stock of Açofran, a long products distributor located in São Paulo, Brazil. The Company fully consolidates Açofran based on voting
F-14
Table of Contents
control. The Company is party to a put option arrangement with respect to the securities that represent the noncontrolling interest of Açofran. The put is exercisable by the minority shareholders outside of the Company’s control by requiring the Company to redeem the minority shareholders’ equity stake in the subsidiary at a put price based on earnings before interest, income tax, depreciation and amortization expense and net debt. The redeemable noncontrolling interest is classified as mezzanine equity and measured at the greater of estimated redemption value at the end of each reporting period or the historical cost basis of the noncontrolling interest adjusted for earnings and foreign currency allocations. The resulting increase or decrease in the estimated redemption amount is adjusted with a corresponding charge against retained earnings, or in the absence of retained earnings, additional paid-in-capital. The acquisition is not material to our consolidated financial statements.
Other Acquisitions
On January 26, 2010, the Company acquired, through its subsidiary JT Ryerson, all of the issued and outstanding capital stock of Texas Steel Processing, Inc. (“TSP”), a steel plate processor based in Houston, Texas. The acquisition is not material to our consolidated financial statements.
On August 4, 2010, the Company acquired, through its subsidiary JT Ryerson, all of the issued and outstanding capital stock of SFI-Gray Steel Inc. (“SFI”), a steel plate processor based in Houston, Texas. The acquisition is not material to our consolidated financial statements.
On July 12, 2010, we acquired VSC’s remaining 20 percent ownership in Ryerson China for $17.5 million. As a result, Ryerson China is now an indirect wholly-owned subsidiary of Ryerson Holding. The acquisition is not material to our consolidated financial statements.
The table below summarizes the effects of the changes in the Company’s ownership interest in Ryerson China on the equity attributable to Ryerson Holding stockholders for the year ended December 31, 2010:
| Net Loss Attributable to Ryerson Holding and Transfers to the Noncontrolling Interest |
Year Ended December 31, 2010 |
|||
| Net loss attributable to Ryerson Holding Corporation |
$ | (104.0 | ) | |
| Transfers to the noncontrolling interest |
||||
| Decrease in Ryerson Holding’s Capital in Excess of Par Value |
(4.8 | ) | ||
|
|
|
|||
| Change in equity from net loss attributable to Ryerson Holding Corporation and transfers to noncontrolling interest |
$ | (108.8 | ) | |
|
|
|
|||
Note 3: Restricted Cash
As part of one of our note indentures, proceeds from the sale of property, plant, and equipment are deposited in a restricted cash account. Cash can be withdrawn from this restricted account upon meeting certain requirements. The balance in this account was zero and $0.9 million at December 31, 2012 and 2011, respectively. In addition, Ryerson China has a restricted cash balance of $0.1 million and $0.3 million as of December 31, 2012 and 2011, respectively, which is primarily related to letters of credit that can be presented for product material purchases. We also have cash restricted for purposes of covering letters of credit that can be presented for potential insurance claims, which totaled $3.8 million and $4.1 million as of December 31, 2012 and 2011, respectively.
Note 4: Inventories
Inventories were classified at December 31, 2012 and 2011 as follows:
| At December 31, | ||||||||
| 2012 | 2011 | |||||||
| (In millions) | ||||||||
| In process and finished products |
$ | 741.5 | $ | 732.4 | ||||
F-15
Table of Contents
If current cost had been used to value inventories, such inventories would have been $34 million lower and $29 million higher than reported at December 31, 2012 and 2011, respectively. Approximately 88% of inventories are accounted for under the LIFO method at December 31, 2012 and 2011. Non-LIFO inventories consist primarily of inventory at our foreign facilities using the weighted-average cost and the specific cost methods. Substantially all of our inventories consist of finished products.
The Company has consignment inventory at certain customer locations, which totaled $13.1 million and $15.9 million at December 31, 2012 and 2011, respectively.
Note 5: Property, Plant and Equipment
Property, plant and equipment consisted of the following at December 31, 2012 and 2011:
| At December 31, | ||||||||
| 2012 | 2011 | |||||||
| (In millions) | ||||||||
| Land and land improvements |
$ | 98.3 | $ | 100.5 | ||||
| Buildings and leasehold improvements |
197.1 | 189.1 | ||||||
| Machinery, equipment and other |
334.5 | 305.9 | ||||||
| Construction in progress |
7.0 | 15.6 | ||||||
|
|
|
|
|
|||||
| Total |
636.9 | 611.1 | ||||||
| Less: Accumulated depreciation |
(164.6 | ) | (131.4 | ) | ||||
|
|
|
|
|
|||||
| Net property, plant and equipment |
$ | 472.3 | $ | 479.7 | ||||
|
|
|
|
|
|||||
The Company recorded $1.0 million, $7.8 million, and $1.4 million of impairment charges in 2012, 2011 and 2010, respectively, related to fixed assets. The impairment charge recorded in 2012 and 2011 related to certain assets held for sale in order to recognize the assets at their fair value less cost to sell in accordance with FASB ASC 360-10-35-43, “Property, Plant and Equipment—Other Presentation Matters.” The fair values of each property were determined based on appraisals obtained from a third party, pending sales contracts or recent listing agreements with third party brokerage firms. The Company had $3.6 million and $10.0 million of assets held for sale, classified within “Other current assets” as of December 31, 2012 and 2011, respectively.
Note 6: Intangible Assets
The following summarizes the components of intangible assets at December 31, 2012 and 2011:
| At December 31, 2012 | At December 31, 2011 | |||||||||||||||||||||||
| Gross Carrying Amount |
Accumulated Amortization |
Net | Gross Carrying Amount |
Accumulated Amortization |
Net | |||||||||||||||||||
| Amortized intangible assets |
(In millions) | |||||||||||||||||||||||
| Customer relationships |
$ | 47.0 | $ | (9.6 | ) | $ | 37.4 | $ | 46.1 | $ | (5.7 | ) | $ | 40.4 | ||||||||||
| Developed technology / product know-how |
1.9 | (0.9 | ) | 1.0 | 1.9 | (0.5 | ) | 1.4 | ||||||||||||||||
| Non-compete agreements |
1.4 | (0.6 | ) | 0.8 | 1.4 | (0.3 | ) | 1.1 | ||||||||||||||||
| Trademarks |
19.8 | (1.9 | ) | 17.9 | 19.5 | (0.5 | ) | 19.0 | ||||||||||||||||
| Licenses |
0.4 | (0.1 | ) | 0.3 | 0.4 | (0.1 | ) | 0.3 | ||||||||||||||||
|
|
|
|
|
|
|
|
|
|
|
|
|
|||||||||||||
| Total intangible assets |
$ | 70.5 | $ | (13.1 | ) | $ | 57.4 | $ | 69.3 | $ | (7.1 | ) | $ | 62.2 | ||||||||||
|
|
|
|
|
|
|
|
|
|
|
|
|
|||||||||||||
Amortization expense related to intangible assets for the years ended December 31, 2012, 2011 and 2010 was $6.0 million, $2.7 million, and $1.7 million, respectively.
F-16
Table of Contents
Intangible assets are amortized over a period between 2 and 20 years. Estimated amortization expense related to intangible assets at December 31, 2012, for each of the years in the five year period ending December 31, 2017 and thereafter is as follows:
| Estimated Amortization Expense |
||||
| (In millions) | ||||
| For the year ended December 31, 2013 |
$ | 6.1 | ||
| For the year ended December 31, 2014 |
6.0 | |||
| For the year ended December 31, 2015 |
5.6 | |||
| For the year ended December 31, 2016 |
4.8 | |||
| For the year ended December 31, 2017 |
4.6 | |||
| For the years ended thereafter |
30.3 | |||
Note 7: Goodwill
The following is a summary of changes in the carrying amount of goodwill for the years ended December 31, 2012 and 2011:
| Carrying Amount |
||||
| (In millions) | ||||
| Balance at January 1, 2011 |
$ | 73.3 | ||
| Acquisitions and adjustments to purchase price |
24.7 | |||
| Impairment charge |
(1.5 | ) | ||
| Changes due to foreign currency translation |
(0.2 | ) | ||
|
|
|
|||
| Balance at December 31, 2011 |
$ | 96.3 | ||
| Acquisitions |
0.2 | |||
| Changes due to foreign currency translation |
0.1 | |||
|
|
|
|||
| Balance at December 31, 2012 |
$ | 96.6 | ||
|
|
|
|||
In 2011, the Company recognized $25.1 million of goodwill related to the Turret acquisition, of which, $7.9 million is deductible for income tax purposes. The Company made purchase price adjustments of $0.4 million during the year ended December 31, 2011.
In 2012, the Company recognized $0.2 million of goodwill related to the Acofran acquisition, which is not deductible for income tax purposes.
As a result of our 2011 annual goodwill impairment test, the Company concluded that the carrying value of one of its reporting units exceeded its fair value. As required by the second step of the impairment test, the Company performed an allocation of the fair value to all the assets and liabilities of the reporting unit, including identifiable intangible assets, based on their fair values, to determine the implied fair value of goodwill. Accordingly, the Company recorded a goodwill impairment charge of $1.5 million in 2011 for the difference between the carrying value of the goodwill in the reporting unit and its implied fair value. The impairment resulted from a combination of factors, including the global economic downturn, a decline in margins for the reporting unit, which led to reductions in the Company’s projected operating results and estimated future cash flows related to the reporting unit in future periods The fair values of the Company’s other reporting units exceeded their estimated carrying values and therefore goodwill in those reporting units was not impaired. The fair values of the reporting units were estimated using an average of a market approach and an income approach as this combination is deemed to be the most indicative of our fair value in an orderly transaction between market participants and is consistent with the methodology used for the goodwill impairment test in the prior year.
F-17
Table of Contents
Based on our October 1, 2012 annual goodwill impairment test, we have determined there was no impairment in 2012.
Note 8: Restructuring and Other Charges
The following summarizes restructuring accrual activity for the years ended December 31, 2012, 2011 and 2010:
| Employee Related Costs |
Tenancy and Other Costs |
Total Restructuring Costs |
||||||||||
| (In millions) | ||||||||||||
| Balance at January 1, 2010 |
$ | 0.4 | $ | 0.5 | $ | 0.9 | ||||||
| Restructuring charges |
12.5 | — | 12.5 | |||||||||
| Cash payments |
(0.6 | ) | (0.4 | ) | (1.0 | ) | ||||||
| Adjustments for pension and other post-retirement termination non-cash charges |
(12.1 | ) | — | (12.1 | ) | |||||||
| Reclassifications |
(0.1 | ) | 0.1 | — | ||||||||
|
|
|
|
|
|
|
|||||||
| Balance at December 31, 2010 |
$ | 0.1 | $ | 0.2 | $ | 0.3 | ||||||
| Restructuring charges |
11.1 | — | 11.1 | |||||||||
| Cash payments |
(5.3 | ) | (0.2 | ) | (5.5 | ) | ||||||
| Adjustments for pension and other post-retirement termination non-cash charges |
(1.4 | ) | — | (1.4 | ) | |||||||
|
|
|
|
|
|
|
|||||||
| Balance at December 31, 2011 |
$ | 4.5 | $ | — | $ | 4.5 | ||||||
| Restructuring charges |
1.3 | 0.2 | 1.5 | |||||||||
| Reduction to reserve |
(0.4 | ) | — | (0.4 | ) | |||||||
| Cash payments |
(4.4 | ) | (0.2 | ) | (4.6 | ) | ||||||
|
|
|
|
|
|
|
|||||||
| Balance at December 31, 2012 |
$ | 1.0 | $ | — | $ | 1.0 | ||||||
|
|
|
|
|
|
|
|||||||
2012
In 2012, the Company recorded a charge of $1.3 million related to the closure of one of its facilities. The charge consists of employee-related costs, primarily severance for 42 employees. In the fourth quarter of 2012, the Company paid $0.3 million in employee costs related to this facility closure. The remaining $1.0 million balance is expected to be paid in 2013. In the first quarter of 2013, as part of this facility closure, the Company expects to record tenancy-related costs of approximately $2 million.
During 2012, the Company paid $4.0 million in employee costs and $0.2 million in tenancy costs related to its October 2011 reorganization plan. The Company also recorded a $0.4 million reduction to this reorganization reserve for employee-related costs and recorded a charge of $0.2 million related to tenancy costs. The $0.2 million net credit reduced the reserve for the October 2011 reorganization to zero and was credited to restructuring and other charges in the Consolidated Statements of Operations.
In 2012, the Company paid the remaining $0.1 million of employee costs related to the facility closed in the fourth quarter of 2010.
2011
In October 2011, the Company implemented a reorganization plan that reduced headcount by 292 employees resulting in a restructuring charge of $9.8 million recorded in the fourth quarter. The Company reduced headcount in a continued effort to decentralize functions to its regions as well as to execute
F-18
Table of Contents
management’s strategy of focusing on long and fabricated product sales. The charge consists of restructuring expenses of $8.4 million for employee-related costs, primarily severance, and additional non-cash pensions and other post-retirement benefit costs totaling $1.4 million. In the fourth quarter of 2011, the Company paid $4.0 million in employee costs related to this restructuring.
In 2011, the Company recorded an additional charge of $1.3 million related to the closure of one of its facilities for which it had recorded a charge of $12.5 million in the fourth quarter of 2010. The charge consists of additional employee-related costs, primarily severance. In 2011, the Company paid $1.3 million in employee costs related to this facility closure.
During 2011, the Company paid the remaining $0.2 million of tenancy and other costs related to the exit plan liability recorded on October 19, 2007.
2010
During 2010, the Company paid $0.7 million related to the exit plan liability recorded on October 19, 2007.
In the fourth quarter of 2010, the Company recorded a $12.5 million charge related to the closure of one of its facilities. The charge consists of restructuring expenses of $0.4 million for employee-related costs, including severance for 66 employees, and additional non-cash pensions and other post-retirement benefits costs totaling $12.1 million. Included in the non-cash pension charge is a pension curtailment loss of $2.0 million. In the fourth quarter of 2010, the Company paid $0.3 million in employee costs related to this facility closure.
Other Charges
In the fourth quarter of 2010, the Company also recorded a charge of $1.5 million for costs related to the retirement of its former Chief Executive Officer, which is recorded within the “Restructuring and other charges” line of the Consolidated Statements of Operations.
Note 9: Debt
Long-term debt consisted of the following at December 31, 2012 and 2011:
| At December 31, | ||||||||
| 2012 | 2011 | |||||||
| (In millions) | ||||||||
| Ryerson Secured Credit Facility |
$ | 383.5 | $ | 520.0 | ||||
| 9% Senior Secured Notes due 2017 |
600.0 | — | ||||||
| 11 1/4% Senior Notes due 2018 |
300.0 | — | ||||||
| 12% Senior Secured Notes due 2015 |
— | 368.7 | ||||||
| Floating Rate Senior Secured Notes due 2014 |
— | 102.9 | ||||||
| 14 1/2% Senior Discount Notes due 2015 |
— | 483.0 | ||||||
| Foreign debt |
21.9 | 32.0 | ||||||
|
|
|
|
|
|||||
| Total debt |
1,305.4 | 1,506.6 | ||||||
| Less: |
||||||||
| Unamortized discount on Ryerson Holding Notes |
— | 190.4 | ||||||
| Short-term credit facility borrowings |
13.5 | 20.0 | ||||||
| Foreign debt |
21.8 | 32.0 | ||||||
|
|
|
|
|
|||||
| Total long-term debt |
$ | 1,270.1 | $ | 1,264.2 | ||||
|
|
|
|
|
|||||
F-19
Table of Contents
The principal payments required to be made on debt during the next five fiscal years are shown below:
| Amount | ||||
| (In millions) | ||||
| For the year ended December 31, 2013 |
$ | 21.8 | ||
| For the year ended December 31, 2014 |
0.1 | |||
| For the year ended December 31, 2015 |
— | |||
| For the year ended December 31, 2016 |
383.5 | |||
| For the year ended December 31, 2017 |
600.0 | |||
| For the years ended thereafter |
300.0 | |||
Ryerson Credit Facility
On March 14, 2011, Ryerson amended and restated its $1.35 billion revolving credit facility agreement (as amended, the “Ryerson Credit Facility”), which extends the maturity date to March 14, 2016. At December 31, 2012, Ryerson had $383.5 million of outstanding borrowings, $24 million of letters of credit issued and $293 million available under the $1.35 billion Ryerson Credit Facility compared to $520.0 million of outstanding borrowings, $29 million of letters of credit issued and $274 million available at December 31, 2011. Total credit availability is limited by the amount of eligible accounts receivable and inventory pledged as collateral under the agreement insofar as the Company is subject to a borrowing base comprised of the aggregate of these two amounts, less applicable reserves. Eligible accounts receivable, at any date of determination, are comprised of the aggregate value of all accounts directly created by a borrower in the ordinary course of business arising out of the sale of goods or the rendition of services, each of which has been invoiced, with such receivables adjusted to exclude various ineligible accounts, including, among other things, those to which a borrower does not have sole and absolute title and accounts arising out of a sale to an employee, officer, director, or affiliate of a borrower. The weighted average interest rate on the borrowings under the Ryerson Credit Facility was 2.6 percent and 2.4 percent at December 31, 2012 and 2011, respectively.
Amounts outstanding under the Ryerson Credit Facility bear interest at a rate determined by reference to the base rate (Bank of America’s prime rate) or a LIBOR rate or, for the Company’s Canadian subsidiary which is a borrower, a rate determined by reference to the Canadian base rate (Bank of America-Canada Branch’s “Base Rate” for loans in U.S. Dollars in Canada) or the BA rate (average annual rate applicable to Canadian Dollar bankers’ acceptances) or a LIBOR rate and the Canadian prime rate (Bank of America-Canada Branch’s “Prime Rate.”). The spread over the base rate and Canadian prime rate is between 0.75% and 1.50% and the spread over the LIBOR and for the bankers’ acceptances is between 1.75% and 2.50%, depending on the amount available to be borrowed. Overdue amounts and all amounts owed during the existence of a default bear interest at 2% above the rate otherwise applicable thereto. The Company also pays commitment fees on amounts not borrowed at a rate between 0.375% and 0.50% depending on the average borrowings as a percentage of the total $1.35 billion agreement during a rolling three month period.
Borrowings under the Ryerson Credit Facility are secured by first-priority liens on all of the inventory, accounts receivable, lockbox accounts and related assets of Ryerson, subsidiary borrowers and certain other U.S. subsidiaries of Ryerson that act as guarantors.
The Ryerson Credit Facility contains covenants that, among other things, restrict Ryerson with respect to the incurrence of debt, the creation of liens, transactions with affiliates, mergers and consolidations, sales of assets and acquisitions. The Ryerson Credit Facility also requires that, if availability under such facility declines to a certain level, Ryerson maintain a minimum fixed charge coverage ratio as of the end of each fiscal quarter.
The Ryerson Credit Facility contains events of default with respect to, among other things, default in the payment of principal when due or the payment of interest, fees and other amounts after a specified grace period, material misrepresentations, failure to perform certain specified covenants, certain bankruptcy events, the
F-20
Table of Contents
invalidity of certain security agreements or guarantees, material judgments and the occurrence of a change of control of Ryerson. If such an event of default occurs, the lenders under the Ryerson Credit Facility will be entitled to various remedies, including acceleration of amounts outstanding under the Ryerson Credit Facility and all other actions permitted to be taken by secured creditors.
The lenders under the Ryerson Credit Facility have the ability to reject a borrowing request if any event, circumstance or development has occurred that has had or could reasonably be expected to have a material adverse effect on Ryerson. If Ryerson or any significant subsidiaries of the other borrowers becomes insolvent or commences bankruptcy proceedings, all amounts borrowed under the Ryerson Credit Facility will become immediately due and payable.
Proceeds from borrowings under the Ryerson Credit Facility and repayments of borrowings thereunder that are reflected in the Consolidated Statements of Cash Flows represent borrowings under the Company’s revolving credit agreement with original maturities greater than three months. Net proceeds (repayments) under the Ryerson Credit Facility represent borrowings under the Ryerson Credit Facility with original maturities less than three months.
2017 and 2018 Notes
On October 10, 2012, Ryerson and its wholly owned subsidiary, Joseph T. Ryerson & Son, Inc., issued $600 million in aggregate principal amount of their 9% Senior Secured Notes due 2017 (the “2017 Notes”) and $300 million in aggregate principal amount of their 11 1/4% Senior Notes due 2018 (the “2018 Notes” and, together with the 2017 Notes, the “2017 and 2018 Notes”). The 2017 Notes bear interest at a rate of 9% per annum. The 2018 Notes bear interest at a rate of 11.25% per annum. The 2017 Notes are fully and unconditionally guaranteed on a senior secured basis and the 2018 Notes are fully and unconditionally guaranteed on a senior unsecured basis by all of our existing and future domestic subsidiaries that are co-borrowers or guarantee obligations under the Ryerson Credit Facility.
The 2017 Notes and related guarantees are secured by a first-priority lien on substantially all of our and our guarantors’ present and future assets located in the United States (other than receivables, inventory, related general intangibles, certain other assets and proceeds thereof), subject to certain exceptions and customary permitted liens. The 2017 Notes and related guarantees are secured on a second-priority basis by a lien on the assets that secure our obligations under the Ryerson Credit Facility. The 2018 Notes are not secured. The 2017 and 2018 Notes contain customary covenants that, among other things, limit, subject to certain exceptions, our ability, and the ability of our restricted subsidiaries, to incur additional indebtedness, pay dividends on our capital stock or repurchase our capital stock, make investments, sell assets, engage in acquisitions, mergers or consolidations or create liens or use assets as security in other transactions. Subject to certain exceptions, Ryerson may only pay dividends to Ryerson Holding to the extent of 50% of future net income, once prior losses are offset. As a result of these restrictions, the restricted net assets of consolidated subsidiaries exceed 25 percent of consolidated net assets as of December 31, 2012. Restricted net assets as of December 31, 2012 were $262.5 million. See Schedule I for condensed financial information of the parent company.
The 2017 Notes will become redeemable by the Company, in whole or in part, at any time on or after April 15, 2015 and the 2018 Notes will become redeemable, in whole or in part, at any time on or after October 15, 2015, in each case at specified redemption prices. The 2017 and 2018 Notes are redeemable prior to such dates at a redemption price equal to 100% of the principal amount, together with accrued and unpaid interest, if any, to the redemption date, plus a make-whole premium. If a change of control occurs, Ryerson must offer to purchase the 2017 and 2018 Notes at 101% of their principal amount, plus accrued and unpaid interest.
Pursuant to registration rights agreements relating to the 2017 and 2018 Notes, we agreed to file with the SEC by July 7, 2013, registration statements with respect to offers to exchange each of the 2017 and 2018 Notes for new issues of our debt securities registered under the Securities Act, with terms substantially identical to those of the 2017 and 2018 Notes and to consummate such exchange offers no later than October 5, 2013.
F-21
Table of Contents
The Company used the net proceeds from the 2017 and 2018 Notes (i) to repay in full the 14 1/2 Senior Discount Notes due 2015 (“Old Ryerson Holding Notes”), plus accrued and unpaid interest thereon up to, but not including, the repayment date, (ii) to repay in full the Company’s outstanding Floating Rate Senior Secured Notes due November 1, 2014 (“2014 Notes) and 12% Senior Secured Notes due November 1, 2015 (“2015 Notes”) (together with the 2014 Notes, the “Old Ryerson Notes”), plus accrued and unpaid interest thereon up to, but not including, the repayment date, (iii) to repay outstanding indebtedness under the Ryerson Credit Facility and (iv) to pay related fees, expenses and premiums.
Ryerson Holding Notes
As of November 1, 2012, all of the Old Ryerson Holding Notes were repurchased or redeemed and cancelled. The Company recorded a $15.6 million loss on the repurchase and cancellation of debt related to the Old Ryerson Holding Notes within other income and (expense), net on the Consolidated Statements of Operations.
2014 and 2015 Notes
As of November 1, 2012, all of the Old Ryerson Notes were repurchased or redeemed and cancelled. The Company recorded a $17.2 million loss on the repurchase and cancellation of debt related to the Old Ryerson Notes within other income and (expense), net on the Consolidated Statements of Operations.
During 2011, $7.5 million principal amount of the 2015 Notes were repurchased for $7.7 million and retired, resulting in the recognition of a $0.2 million loss within other income and (expense), net on the Consolidated Statements of Operations.
Foreign Debt
At December 31, 2012, Ryerson China’s total foreign borrowings were $21.4 million, which were owed to banks in Asia at a weighted average interest rate of 4.8% secured by inventory and property, plant and equipment. At December 31, 2012, Açofran’s total foreign borrowings were $0.5 million, which were owed to foreign banks at a weighted average interest rate of 11.2%. Of the total foreign borrowings of $32.0 million outstanding at December 31, 2011, $30.1 million was owed to banks in Asia at a weighted average interest rate of 6.2% secured by inventory and property, plant and equipment. Ryerson China also owed $1.9 million at December 31, 2011 to other parties at a weighted average interest rate of 0.9%.
Availability under the foreign credit lines was $21 million and $22 million at December 31, 2012 and 2011, respectively. Letters of credit issued by our foreign subsidiaries totaled $8 million and $11 million at December 31, 2012 and 2011, respectively.
Note 10: Employee Benefits
The Company accounts for its pension and postretirement plans in accordance with FASB ASC 715, “Compensation—Retirement Benefits” (“ASC 715”). In addition to requirements for an employer to recognize in its consolidated balance sheet an asset for a plan’s overfunded status or a liability for a plan’s underfunded status and to recognize changes in the funded status of a defined benefit postretirement plan in the year in which the changes occur, ASC 715 requires an employer to measure a plan’s assets and its obligations that determine its funded status as of the end of the employer’s fiscal year.
Prior to January 1, 1998, the Company’s non-contributory defined benefit pension plan covered certain employees, retirees and their beneficiaries. Benefits provided to participants of the plan were based on pay and years of service for salaried employees and years of service and a fixed rate or a rate determined by job grade for all wage employees, including employees under collective bargaining agreements.
F-22
Table of Contents
Effective January 1, 1998, the Company froze the benefits accrued under its defined benefit pension plan for certain salaried employees and instituted a defined contribution plan. Effective March 31, 2000, benefits for certain salaried employees of J. M. Tull Metals Company and AFCO Metals, subsidiaries that were merged into JT Ryerson, were similarly frozen, with the employees becoming participants in the Company’s defined contribution plan. Salaried employees who vested in their benefits accrued under the defined benefit plan at December 31, 1997 and March 31, 2000, are entitled to those benefits upon retirement. For the years ended December 31, 2012, 2011 and 2010, expense recognized for its defined contribution plans was $6.8 million, $7.0 million and $8.6 million, respectively.
In the fourth quarter of 2010, the Company announced the closure of one of its facilities, which significantly reduced the expected years of future service of active accruing participants in the Company’s defined benefit pension plan. As a result, the Company recorded a pension curtailment loss of $2.0 million in 2010.
In 2012, the Company amended the terms of one of our Canadian post-retirement medical and life insurance plans which effectively eliminated benefits to a group of employees unless these individuals agreed to retire by December 31, 2015. These actions meet the definition of a curtailment under FASB ASC 715-30-15 and resulted in a curtailment gain of $1.7 million for the year ended December 31, 2012.
The Company has other deferred employee benefit plans, including supplemental pension plans, the liability for which totaled $18.5 million and $16.0 million at December 31, 2012 and 2011, respectively.
Summary of Assumptions and Activity
The tables included below provide reconciliations of benefit obligations and fair value of plan assets of the Company plans as well as the funded status and components of net periodic benefit costs for each period related to each plan. The Company uses a December 31 measurement date to determine the pension and other postretirement benefit information. For the year 2010, the Company had an additional measurement date of November 18 for our U.S. pension plan due to the announced closure of one of its facilities as discussed above. The assumptions used to determine benefit obligations at the end of the periods and net periodic benefit costs for the Pension Benefits for U.S. plans were as follows:
| Year Ended December 31, 2012 |
Year Ended December 31, 2011 |
November 18 to December 31, 2010 |
January 1 to November 17, 2010 |
|||||||||||||
| Discount rate for calculating obligations |
4.00 | % | 4.90 | % | 5.35 | % | N/A | |||||||||
| Discount rate for calculating net periodic benefit cost |
4.90 | 5.35 | 5.40 | 5.80 | % | |||||||||||
| Expected rate of return on plan assets |
8.75 | 8.75 | 8.75 | 8.75 | ||||||||||||
| Rate of compensation increase |
3.00 | 3.00 | 3.00 | 4.00 | ||||||||||||
The expected rate of return on U.S. plan assets is 8.20% for 2013.
The assumptions used to determine benefit obligations at the end of the periods and net periodic benefit costs for the Other Postretirement Benefits, primarily health care, for U.S. plans were as follows:
| Year Ended December 31, | ||||||||||||
| 2012 | 2011 | 2010 | ||||||||||
| Discount rate for calculating obligations |
3.60 | % | 4.60 | % | 5.25 | % | ||||||
| Discount rate for calculating net periodic benefit cost |
4.60 | 5.25 | 5.70 | |||||||||
| Rate of compensation increase—benefit obligations |
3.00 | 3.00 | 3.00 | |||||||||
| Rate of compensation increase—net periodic benefit cost |
3.00 | 3.00 | 4.00 | |||||||||
F-23
Table of Contents
The assumptions used to determine benefit obligations at the end of the periods and net periodic benefit costs for the Pension Benefits for Canadian plans were as follows:
| Year Ended December 31, | ||||||||||||
| 2012 | 2011 | 2010 | ||||||||||
| Discount rate for calculating obligations |
4.20 | % | 4.75 | % | 5.25 | % | ||||||
| Discount rate for calculating net periodic benefit cost |
4.75 | 5.25 | 5.75 | |||||||||
| Expected rate of return on plan assets |
6.50 | 7.00 | 7.00 | |||||||||
| Rate of compensation increase |
3.50 | 3.50 | 3.50 | |||||||||
The expected rate of return on Canadian plan assets is 6.50% for 2013.
The assumptions used to determine benefit obligations at the end of the periods and net periodic benefit costs for the Other Postretirement Benefits, primarily healthcare, for Canadian plans were as follows:
| Year Ended December 31, | ||||||||||||
| 2012 | 2011 | 2010 | ||||||||||
| Discount rate for calculating obligations |
4.10 | % | 4.80 | % | 5.25 | % | ||||||
| Discount rate for calculating net periodic benefit cost |
4.80 | 5.25 | 5.75 | |||||||||
| Rate of compensation increase |
3.50 | 3.50 | 3.50 | |||||||||
| Year Ended December 31, | ||||||||||||||||
| Pension Benefits | Other Benefits | |||||||||||||||
| 2012 | 2011 | 2012 | 2011 | |||||||||||||
| (In millions) | ||||||||||||||||
| Change in Benefit Obligation |
||||||||||||||||
| Benefit obligation at beginning of year |
$ | 856 | $ | 815 | $ | 143 | $ | 176 | ||||||||
| Service cost |
3 | 3 | 1 | 1 | ||||||||||||
| Interest cost |
41 | 42 | 6 | 8 | ||||||||||||
| Plan amendments |
— | — | (11 | ) | (1 | ) | ||||||||||
| Actuarial (gain) loss |
81 | 47 | 6 | (29 | ) | |||||||||||
| Special termination benefits |
1 | 1 | — | 1 | ||||||||||||
| Effect of changes in exchange rates |
1 | (1 | ) | 1 | — | |||||||||||
| Curtailment gain |
— | — | (2 | ) | — | |||||||||||
| Benefits paid (net of participant contributions and Medicare subsidy) |
(53 | ) | (51 | ) | (14 | ) | (13 | ) | ||||||||
|
|
|
|
|
|
|
|
|
|||||||||
| Benefit obligation at end of year |
$ | 930 | $ | 856 | $ | 130 | $ | 143 | ||||||||
|
|
|
|
|
|
|
|
|
|||||||||
| Accumulated benefit obligation at end of year |
$ | 925 | $ | 852 | N/A | N/A | ||||||||||
|
|
|
|
|
|
|
|
|
|||||||||
| Change in Plan Assets |
||||||||||||||||
| Plan assets at fair value at beginning of year |
$ | 497 | $ | 509 | $ | — | $ | — | ||||||||
| Actual return (loss) on plan assets |
69 | (4 | ) | — | — | |||||||||||
| Employer contributions |
46 | 44 | 15 | 15 | ||||||||||||
| Effect of changes in exchange rates |
1 | (1 | ) | — | — | |||||||||||
| Benefits paid (net of participant contributions) |
(53 | ) | (51 | ) | (15 | ) | (15 | ) | ||||||||
|
|
|
|
|
|
|
|
|
|||||||||
| Plan assets at fair value at end of year |
$ | 560 | $ | 497 | $ | — | $ | — | ||||||||
|
|
|
|
|
|
|
|
|
|||||||||
| Reconciliation of Amount Recognized |
||||||||||||||||
| Funded status |
$ | (370 | ) | $ | (359 | ) | $ | (130 | ) | $ | (143 | ) | ||||
|
|
|
|
|
|
|
|
|
|||||||||
| Amounts recognized in balance sheet consist of: |
||||||||||||||||
| Current liabilities |
$ | — | $ | — | $ | (13 | ) | $ | (14 | ) | ||||||
| Non-current liabilities |
(370 | ) | (359 | ) | (117 | ) | (129 | ) | ||||||||
|
|
|
|
|
|
|
|
|
|||||||||
| Net benefit liability at the end of the year |
$ | (370 | ) | $ | (359 | ) | $ | (130 | ) | $ | (143 | ) | ||||
|
|
|
|
|
|
|
|
|
|||||||||
F-24
Table of Contents
Canadian benefit obligations represented $60 million and $55 million of the Company’s total Pension Benefits obligations at December 31, 2012 and 2011, respectively. Canadian plan assets represented $48 million and $46 million of the Company’s total plan assets at fair value at December 31, 2012 and 2011, respectively. In addition, Canadian benefit obligations represented $16 million and $18 million of the Company’s total Other Benefits obligation at December 31, 2012 and 2011, respectively.
Amounts recognized in accumulated other comprehensive income (loss) at December 31, 2012 and 2011 consist of the following:
| At December 31, | ||||||||||||||||
| Pension Benefits | Other Benefits | |||||||||||||||
| 2012 | 2011 | 2012 | 2011 | |||||||||||||
| (In millions) | ||||||||||||||||
| Amounts recognized in accumulated other comprehensive income (loss), pre–tax, consists of |
||||||||||||||||
| Net actuarial (gain) loss |
$ | 403 | $ | 355 | $ | (73 | ) | $ | (87 | ) | ||||||
| Prior service cost (credit) |
1 | 2 | (12 | ) | (1 | ) | ||||||||||
|
|
|
|
|
|
|
|
|
|||||||||
| Total |
$ | 404 | $ | 357 | $ | (85 | ) | $ | (88 | ) | ||||||
|
|
|
|
|
|
|
|
|
|||||||||
Net actuarial losses of $13.8 million and prior service costs of $0.2 million for pension benefits and net actuarial gains of $7.3 million and prior service credits of $1.6 million for other postretirement benefits are expected to be amortized from accumulated other comprehensive income (loss) into net periodic benefit cost over the next fiscal year.
Amounts recognized in other comprehensive income (loss) for the years ended December 31, 2012 and 2011 consist of the following:
| Year Ended December 31, | ||||||||||||||||
| Pension Benefits | Other Benefits | |||||||||||||||
| 2012 | 2011 | 2012 | 2011 | |||||||||||||
| (In millions) | ||||||||||||||||
| Amounts recognized in other comprehensive income (loss), pre–tax, consists of |
||||||||||||||||
| Net actuarial loss (gain) |
$ | 58 | $ | 98 | $ | 6 | $ | (29 | ) | |||||||
| Amortization of net actuarial loss (gain) |
(11 | ) | (6 | ) | 8 | 5 | ||||||||||
| Prior service credit |
— | — | (11 | ) | (1 | ) | ||||||||||
|
|
|
|
|
|
|
|
|
|||||||||
| Total recognized in other comprehensive income (loss) |
$ | 47 | $ | 92 | $ | 3 | $ | (25 | ) | |||||||
|
|
|
|
|
|
|
|
|
|||||||||
For measurement purposes for U.S. plans at December 31, 2012, the annual rate of increase in the per capita cost of covered health care benefits for participants under 65 was 7 percent, grading down to 5 percent in 2020, the level at which it is expected to remain. At December 31, 2012 the rate for participants over 65 was 6.5 percent, grading down to 5 percent in 2018, plus a risk adjustment of 0.6 percent grading down to zero percent in 2062, the level at which it is expected to remain. For measurement purposes for U.S. plans at December 31, 2011, the annual rate of increase in the per capita cost of covered health care benefits was 8.0 percent for all participants, grading down to 5 percent in 2017, the level at which it is expected to remain. For measurement purposes for U.S. plans at December 31, 2010, the annual rate of increase in the per capita cost of covered health care benefits was 8.5 percent for all participants, grading down to 5 percent in 2017, the level at which it is expected to remain.
For measurement purposes for Canadian plans at December 31, 2012, the annual rate of increase in the per capita cost of covered health care benefits was 8 percent per annum, grading down to 4.5 percent in 2033, the level at which it is expected to remain. For measurement purposes for Canadian plans at December 31, 2011, the
F-25
Table of Contents
annual rate of increase in the per capita cost of covered health care benefits was 12 percent per annum, grading down to 5 percent in 2023, the level at which it is expected to remain. For measurement purposes for Canadian plans at December 31, 2010, the annual rate of increase in the per capita cost of covered health care benefits was 12 percent per annum, grading down to 5 percent in 2023, the level at which it is expected to remain.
The components of the Company’s net periodic benefit cost for the years ended December 31, 2012, 2011 and 2010 are as follows:
| Year Ended December 31, | ||||||||||||||||||||||||
| Pension Benefits | Other Benefits | |||||||||||||||||||||||
| 2012 | 2011 | 2010 | 2012 | 2011 | 2010 | |||||||||||||||||||
| (In millions) | ||||||||||||||||||||||||
| Components of net periodic benefit cost |
||||||||||||||||||||||||
| Service cost |
$ | 3 | $ | 3 | $ | 3 | $ | 1 | $ | 1 | $ | 1 | ||||||||||||
| Interest cost |
41 | 42 | 43 | 6 | 8 | 10 | ||||||||||||||||||
| Expected return on assets |
(45 | ) | (47 | ) | (46 | ) | — | — | — | |||||||||||||||
| Recognized actuarial loss (gain) |
11 | 6 | 6 | (7 | ) | (4 | ) | (4 | ) | |||||||||||||||
| Special termination benefits |
— | 1 | 7 | — | 1 | 3 | ||||||||||||||||||
| Curtailment loss (gain) |
— | — | 2 | (2 | ) | — | — | |||||||||||||||||
|
|
|
|
|
|
|
|
|
|
|
|
|
|||||||||||||
| Net periodic benefit cost (credit) |
$ | 10 | $ | 5 | $ | 15 | $ | (2 | ) | $ | 6 | $ | 10 | |||||||||||
|
|
|
|
|
|
|
|
|
|
|
|
|
|||||||||||||
The assumed health care cost trend rate has an effect on the amounts reported for the health care plans. For purposes of determining net periodic benefit cost for U.S plans, the annual rate of increase in the per capita cost of covered health care benefits was 8 percent for all participants for the year ended December 31, 2012, grading down to 5 percent in 2017. For purposes of determining net periodic benefit cost for Canadian plans, the annual rate of increase in the per capita cost of covered health care benefits was 8 percent for the year ended December 31, 2012, grading down to 4.5 percent in 2033. A one-percentage-point change in the assumed health care cost trend rate would have the following effects:
| 1% increase | 1% decrease | |||||||
| (In millions) | ||||||||
| Effect on service cost plus interest cost |
$ | 0.3 | $ | (0.2 | ) | |||
| Effect on postretirement benefit obligation |
4.5 | (3.6 | ) | |||||
Pension Trust Assets
The expected long-term rate of return on pension trust assets is 6.50% to 8.20% based on the historical investment returns of the trust, the forecasted returns of the asset classes and a survey of comparable pension plan sponsors.
The Company’s pension trust weighted-average asset allocations at December 31, 2012 and 2011, by asset category are as follows:
| Trust Assets at December 31, |
||||||||
| 2012 | 2011 | |||||||
| Equity securities |
64 | % | 62 | % | ||||
| Debt securities |
22 | 22 | ||||||
| Real Estate |
3 | 3 | ||||||
| Other |
11 | 13 | ||||||
|
|
|
|
|
|||||
| Total |
100.0 | % | 100.0 | % | ||||
|
|
|
|
|
|||||
F-26
Table of Contents
The Board of Directors of Ryerson has general supervisory authority over the Pension Trust Fund and approves the investment policies and plan asset target allocation. An internal management committee provides on-going oversight of plan assets in accordance with the approved policies and asset allocation ranges and has the authority to appoint and dismiss investment managers. The investment policy objectives are to maximize long-term return from a diversified pool of assets while minimizing the risk of large losses, and to maintain adequate liquidity to permit timely payment of all benefits. The policies include diversification requirements and restrictions on concentration in any one single issuer or asset class. The currently approved asset investment classes are cash; fixed income; domestic equities; international equities; real estate; private equities and hedge funds of funds. Company management allocates the plan assets among the approved investment classes and provides appropriate directions to the investment managers pursuant to such allocations. The approved target ranges and allocations as of the December 31, 2012 measurement date were as follows:
| Range | Target | |||||||
| Equity securities |
35-85 | % | 63 | % | ||||
| Debt securities |
10-30 | 21 | ||||||
| Real Estate |
0-10 | 9 | ||||||
| Other |
0-10 | 7 | ||||||
|
|
|
|||||||
| Total |
100 | % | ||||||
|
|
|
|||||||
The fair value of Ryerson’s pension plan assets at December 31, 2012 by asset category are as follows. See Note 16 for the definitions of Level 1, 2, and 3 fair value measurements.
| Fair Value Measurements at December 31, 2012 |
||||||||||||||||
| Asset Category |
Total | Level 1 | Level 2 | Level 3 | ||||||||||||
| (In millions) | ||||||||||||||||
| Cash and cash equivalents |
$ | 11.1 | $ | 11.1 | $ | — | $ | — | ||||||||
| Equity securities: |
||||||||||||||||
| US large cap |
121.0 | — | 121.0 | — | ||||||||||||
| US small/mid cap |
45.4 | — | 45.4 | — | ||||||||||||
| Canadian large cap |
6.4 | — | 6.4 | — | ||||||||||||
| Canadian small cap |
1.6 | — | 1.6 | — | ||||||||||||
| Other international companies |
183.1 | — | 183.1 | — | ||||||||||||
| Fixed income securities: |
||||||||||||||||
| Investment grade debt |
122.7 | — | 122.7 | — | ||||||||||||
| Other types of investments: |
||||||||||||||||
| Commodity funds |
1.5 | — | 1.5 | — | ||||||||||||
| Multi-strategy funds |
26.7 | — | — | 26.7 | ||||||||||||
| Private equity funds |
22.5 | — | — | 22.5 | ||||||||||||
| Real estate |
17.7 | — | 17.0 | 0.7 | ||||||||||||
|
|
|
|
|
|
|
|
|
|||||||||
| Total |
$ | 559.7 | $ | 11.1 | $ | 498.7 | $ | 49.9 | ||||||||
|
|
|
|
|
|
|
|
|
|||||||||
F-27
Table of Contents
The hierarchy classification for common collective trust plan assets in 2011 totaling $151.5 million has been adjusted from Level 1 to Level 2 due to our ownership at the fund level rather than at the individual security level. The fair value of Ryerson’s pension plan assets at December 31, 2011 by asset category are as follows:
| Fair Value Measurements at December 31, 2011 |
||||||||||||||||
| Asset Category |
Total | Level 1 | Level 2 | Level 3 | ||||||||||||
| (In millions) | ||||||||||||||||
| Cash and cash equivalents |
$ | 31.6 | $ | 31.6 | $ | — | $ | — | ||||||||
| Equity securities: |
||||||||||||||||
| US large cap |
138.9 | — | 138.9 | — | ||||||||||||
| US small/mid cap |
44.3 | — | 44.3 | — | ||||||||||||
| Canadian large cap |
12.0 | 12.0 | — | — | ||||||||||||
| Canadian small cap |
1.0 | 1.0 | — | — | ||||||||||||
| Other international companies |
112.0 | 13.4 | 98.6 | — | ||||||||||||
| Fixed income securities: |
||||||||||||||||
| Investment grade debt |
111.1 | 19.0 | 92.1 | — | ||||||||||||
| Other types of investments: |
||||||||||||||||
| Multi-strategy funds |
2.7 | — | — | 2.7 | ||||||||||||
| Private equity funds |
28.3 | — | — | 28.3 | ||||||||||||
| Real estate |
15.3 | — | 12.8 | 2.5 | ||||||||||||
|
|
|
|
|
|
|
|
|
|||||||||
| Total |
$ | 497.2 | $ | 77.0 | $ | 386.7 | $ | 33.5 | ||||||||
|
|
|
|
|
|
|
|
|
|||||||||
The pension assets classified as Level 2 investments in both 2012 and 2011 are part of common collective trust investments.
| Fair Value Measurements Using Significant Unobservable Inputs (Level 3) |
||||||||||||||||
| Multi- Strategy Hedge funds |
Private Equity Funds |
Real Estate | Total | |||||||||||||
| (In millions) | ||||||||||||||||
| Beginning balance at January 1, 2010 |
$ | 19.2 | $ | 29.8 | $ | 21.4 | $ | 70.4 | ||||||||
| Actual return on plan assets: |
||||||||||||||||
| Relating to assets still held at the reporting date |
0.2 | 2.4 | 0.7 | 3.3 | ||||||||||||
| Relating to assets sold during the period |
0.7 | 0.9 | 3.7 | 5.3 | ||||||||||||
| Purchases, sales, and settlements |
(14.1 | ) | (1.6 | ) | (22.0 | ) | (37.7 | ) | ||||||||
|
|
|
|
|
|
|
|
|
|||||||||
| Ending balance at December 31, 2010 |
$ | 6.0 | $ | 31.5 | $ | 3.8 | $ | 41.3 | ||||||||
| Actual return on plan assets: |
||||||||||||||||
| Relating to assets still held at the reporting date |
0.2 | 0.3 | 0.2 | 0.7 | ||||||||||||
| Relating to assets sold during the period |
— | 0.7 | (0.2 | ) | 0.5 | |||||||||||
| Purchases |
— | 1.4 | — | 1.4 | ||||||||||||
| Sales |
(3.5 | ) | (5.6 | ) | (1.3 | ) | (10.4 | ) | ||||||||
|
|
|
|
|
|
|
|
|
|||||||||
| Ending balance at December 31, 2011 |
$ | 2.7 | $ | 28.3 | $ | 2.5 | $ | 33.5 | ||||||||
| Actual return on plan assets: |
||||||||||||||||
| Relating to assets still held at the reporting date |
1.7 | 0.5 | (0.3 | ) | 1.9 | |||||||||||
| Relating to assets sold during the period |
(0.5 | ) | 2.4 | 0.8 | 2.7 | |||||||||||
| Purchases |
25.0 | 0.5 | — | 25.5 | ||||||||||||
| Sales |
(2.2 | ) | (9.2 | ) | (2.3 | ) | (13.7 | ) | ||||||||
|
|
|
|
|
|
|
|
|
|||||||||
| Ending balance at December 31, 2012 |
$ | 26.7 | $ | 22.5 | $ | 0.7 | $ | 49.9 | ||||||||
|
|
|
|
|
|
|
|
|
|||||||||
F-28
Table of Contents
Securities listed on one or more national securities exchanges are valued at their last reported sales price on the date of valuation. If no sale occurred on the valuation date, the security is valued at the mean of the last “bid” and “ask” prices on the valuation date.
Corporate and government bonds which are not listed or admitted to trading on any securities exchanges are valued at the average mean of the last bid and ask prices on the valuation date based on quotations supplied by recognized quotation services or by reputable broker dealers.
The non-publicly traded securities, other securities or instruments for which reliable market quotations are not available are valued at each investment manager’s discretion. Valuations will depend on facts and circumstances known as of the valuation date and application of certain valuation methods.
Contributions
The Company contributed $45.9 million, $43.9 million, and $46.6 million for the years ended December 31, 2012, 2011 and 2010, respectively, to improve the funded status of the plans. The Company anticipates that it will have a minimum required pension contribution funding of approximately $48 million in 2013.
Estimated Future Benefit Payments
| Pension Benefits |
Other Benefits |
|||||||
| (In millions) | ||||||||
| 2013 |
$ | 55.6 | $ | 13.3 | ||||
| 2014 |
56.0 | 12.4 | ||||||
| 2015 |
56.4 | 11.9 | ||||||
| 2016 |
56.9 | 11.3 | ||||||
| 2017 |
57.2 | 10.6 | ||||||
| 2018-2022 |
289.8 | 43.1 | ||||||
Multiemployer Pension and Other Postretirement Plans
Ryerson participates in two multiemployer pension plans covering 73 employees at 5 locations. Total contributions to the plans were $0.5 million, $0.4 million, and $0.4 million for the years ended December 31, 2012, 2011, and 2010, respectively. Ryerson’s contributions represent less than 5% of the total contributions to the plans. Ryerson maintains positive employee relations at all locations. During 2012, the Company exited and reentered the pension plan at one of the covered locations in an effort to reduce the overall pension liability. The transaction resulted in a withdrawal liability of $0.6 million as of December 31, 2012 which will be paid over a period of 25 years. The Company’s participation in these plans is not material to our financial statements.
Note 11: Commitments and Contingencies
Lease Obligations & Other
The Company leases buildings and equipment under noncancellable operating leases expiring in various years through 2025. Future minimum rental commitments are estimated to total $133.2 million, including approximately $26.6 million in 2013, $21.6 million in 2014, $18.9 million in 2015, $16.4 million in 2016, $12.7 million in 2017 and $37.0 million thereafter.
Rental expense under operating leases totaled $32.6 million, $30.5 million, and $25.6 million for the years ended December 31, 2012, 2011 and 2010, respectively.
To fulfill contractual requirements for certain customers in 2012, the Company has entered into certain fixed-price noncancellable contractual obligations. These purchase obligations which will all be paid in 2013 aggregated to $32.9 million at December 31, 2012.
F-29
Table of Contents
Concentrations of Various Risks
The Company’s financial instruments consist of cash and cash equivalents, accounts receivable, available-for-sale investments, derivative instruments, accounts payable, and notes payable. In the case of cash, accounts receivable and accounts payable, the carrying amount on the balance sheet approximates the fair values due to the short-term nature of these instruments. The available-for-sale investments in common stock are adjusted to fair value each period with unrealized gains and losses recorded within accumulated other comprehensive income. The derivative instruments are marked to market each period. The fair value of notes payable is disclosed in Note 16.
The Company’s financial instruments that are exposed to concentrations of credit risk consist primarily of derivative financial instruments and trade accounts receivable. Our derivative financial instruments are contracts placed with major financial institutions. Credit is generally extended to customers based upon an evaluation of each customer’s financial condition, with terms consistent in the industry and no collateral required. Concentrations of credit risk with respect to trade accounts receivable are limited due to the large number of customers and their dispersion across geographic areas.
The Company has signed supply agreements with certain vendors which may obligate the Company to make cash deposits based on the spot price of aluminum at the end of each month. These cash deposits offset amounts payable to the vendor when inventory is received. We made no cash deposits for the year ended December 31, 2012. We have no exposure as of December 31, 2012.
Approximately 14% of our total labor force is covered by collective bargaining agreements. There are collective bargaining agreements that will expire in fiscal 2013, which cover less than 1% of our total labor force. We believe that our overall relationship with our employees is good.
Litigation
From time to time, we are named as a defendant in legal actions incidental to our ordinary course of business. We do not believe that the resolution of these claims will have a material adverse effect on our financial position, results of operations or cash flows. We maintain liability insurance coverage to assist in protecting our assets from losses arising from or related to activities associated with business operations.
On December 27, 2011, Nancy Hoffman, Mark Hoffman, and Karen Hoffman (collectively, the “plaintiffs”) filed a sixth amended complaint in the Circuit Court of Cook County, Illinois naming JT Ryerson and three other entities as defendants (collectively, the “defendants”) in a lawsuit (Nancy Hoffman, et.al. v. Dorlan Crane, et.al.). That complaint asserted negligence and loss of consortium counts against the defendants for personal injuries allegedly suffered by plaintiffs resulting from a motor vehicle accident. On February 10, 2012, a jury returned a verdict against the defendants and awarded damages totaling $27.7 million for which the defendants are purportedly jointly and severally liable. On August 28, 2012, our post-trial motion was denied. On September 24, 2012, we filed our Notice of Appeal to the Appellate Court of Illinois, First Judicial District. Any potential loss ranges from zero to $27.7 million plus interest. We believe that any loss will be covered by insurance. At this time, the Company cannot predict the likely outcome of this matter.
In October 2011, the United States Environmental Protection Agency named us as one of more than 100 businesses that may be a potentially responsible party for the Portland Harbor Superfund Site, (“Portland Harbor”). We do not currently have sufficient information available to us to determine the total cost of any required investigation or remediation of the Portland Harbor site. Management cannot predict the ultimate outcome of this matter or estimate a range of potential loss at this time.
During the year ended December 31, 2010, the Company received $2.6 million related to the settlement of an insurance claim. Based on a 2003 agreement between Ispat International N.V. and Ispat Inland, Inc.
F-30
Table of Contents
(collectively, “Ispat”) and Ryerson, Ryerson assigned its environmental insurance policy issued by Kemper Environmental Ltd (“Kemper”) to Ispat and Ispat agreed to use commercially reasonable efforts to pursue certain claims against Kemper. Ryerson received a letter from ArcelorMittal, the successor in interest by merger to Ispat, in 2010 stating it had reached a settlement with Kemper Environmental Ltd. relating to a 2005 claim and that Ryerson would receive $2.6 million as its agreed upon share of the settlement. The Company received the $2.6 million in 2010 and in accordance with ASC 450-30, the Company recognized the gain upon its realization.
There are various claims and pending actions against the Company. The amount of liability, if any, for those claims and actions at December 31, 2012 is not determinable but, in the opinion of management, such liability, if any, will not have a material adverse effect on the Company’s financial position, results of operations or cash flows.
Note 12: Related Parties
The Company pays an affiliate of Platinum an annual monitoring fee of up to $5.0 million pursuant to a corporate advisory services agreement. The monitoring fee was $5.0 million for the years ended December 31, 2012, 2011 and 2010.
We declared and made a distribution of $35.0 million and $213.8 million to our stockholders in December 2012 and January 2010, respectively.
Note 13: Sales by Product
The Company derives substantially all of its sales from the distribution of metals. The following table shows the Company’s percentage of sales by major product line:
| Year Ended December 31, | ||||||||||||
| Product Line |
2012 | 2011 | 2010 | |||||||||
| (Percentage of Sales) | ||||||||||||
| Carbon Steel Flat |
25 | % | 27 | % | 29 | % | ||||||
| Carbon Steel Plate |
13 | 11 | 8 | |||||||||
| Carbon Steel Long |
15 | 10 | 9 | |||||||||
| Stainless Steel Flat |
15 | 18 | 21 | |||||||||
| Stainless Steel Plate |
4 | 4 | 4 | |||||||||
| Stainless Steel Long |
4 | 4 | 3 | |||||||||
| Aluminum Flat |
14 | 15 | 15 | |||||||||
| Aluminum Plate |
3 | 3 | 3 | |||||||||
| Aluminum Long |
4 | 4 | 4 | |||||||||
| Other |
3 | 4 | 4 | |||||||||
|
|
|
|
|
|
|
|||||||
| Total |
100 | % | 100 | % | 100 | % | ||||||
|
|
|
|
|
|
|
|||||||
No customer accounted for more than 2 percent of Company sales for the years ended December 31, 2012, 2011 and 2010. The top ten customers accounted for less than 10 percent of its sales for the year ended December 31, 2012. A significant majority of the Company’s sales are attributable to its U.S. operations and a significant majority of its long-lived assets are located in the United States. The only operations attributed to foreign countries relate to the Company’s subsidiaries in Canada, China, Mexico and Brazil, which in aggregate comprised 13 percent of the Company’s sales during the year ended December 31, 2012 and 14 percent during the years ended December 31, 2011 and 2010; Canadian, Chinese, Mexican and Brazilian assets were 16 percent, 15 percent and 15 percent of total Company assets at December 31, 2012, 2011 and 2010, respectively.
F-31
Table of Contents
Note 14: Other Matters
Equity Investment
Automated Laser Fabrication Co., LLC. In 2011, the Company invested $0.8 million in Automated Laser Fabrication Co., LLC (“ALF”) for a 38 percent equity interest. ALF is a steel processing company located in Streetsboro, Ohio. The Company accounts for this investment under the equity method of accounting. The Company’s investment in this joint venture is not considered material to the Company’s consolidated financial position or results of operations.
Note 15: Compensation Plan
Participation Plan
In 2009, Ryerson Holding adopted the 2009 Participation Plan (as amended and restated, the “Plan”). The purpose of the Plan is to provide incentive compensation to key employees of the Company by granting performance units. The value of the performance units is related to the appreciation in the value of the Company from and after the date of grant and the performance units vest over a period specified in the applicable award agreement, which typically vest over 44 months. The Plan may be altered, amended or terminated by the Company at any time. All performance units will terminate upon termination of the Plan or expiration on February 15, 2014. Participants in the Plan may be entitled to receive compensation for their vested units if certain performance-based “qualifying events” occur during the participant’s employment with the Company or during a short period following the participant’s death.
There are two “qualifying events” defined in the Plan: (1) A “qualifying sale event” in which there is a sale of some or all of the stock of Ryerson Holding then held by Ryerson Holding’s principal stockholders and (2) A “qualifying distribution” in which Ryerson Holding pays a cash dividend to its principal stockholders. Upon the occurrence of a Qualifying Event, participants with vested units may receive an amount equal to the difference between: (i) the value (as defined by the Plan) of the units on the date of the qualifying event, and (ii) the value of the units assigned on the date of grant. No amounts are due to participants until the total cash dividends and net proceeds from the sale of common stock to Ryerson Holding’s principal stockholder exceeds $875 million. Upon termination, with or without cause, units are forfeited, except in the case of death, as described in the Plan. As of December 31, 2012, 87,500,000 units have been authorized and granted, 50,312,500 units have been forfeited and 37,187,500 units have vested as of the date hereof. The Company is accounting for this Plan in accordance with FASB ASC 718, “Compensation—Stock Compensation” (“ASC 718”). Since the occurrence of future “qualifying events” is not determinable or estimable, no liability or expense has been recognized to date. The fair value of the performance units are based upon cash dividends to and net proceeds from sales of common stock of Ryerson Holding by its principal stockholders through the end of each period that have occurred or are probable. The fair value of the performance units on their grant date in 2009 and at December 31, 2012, 2011 and 2010, which included cash distributions of $35.0 million in 2012, $213.8 million in 2010 and $56.5 million in 2009, was zero.
Note 16: Derivatives and Fair Value Measurements
Derivatives
The Company is exposed to certain risks relating to its ongoing business operations. The primary risks managed by using derivative instruments are interest rate risk, foreign currency risk, and commodity price risk. Interest rate swaps are entered into to manage interest rate risk associated with the Company’s floating-rate borrowings. We use foreign currency exchange contracts to hedge our Canadian subsidiaries’ variability in cash flows from the forecasted payment of currencies other than the functional currency. From time to time, we may enter into fixed price sales contracts with our customers for certain of our inventory components. We may enter into metal commodity futures and options contracts periodically to reduce volatility in the price of metals. We may also enter into natural gas price swaps to manage the price risk of forecasted purchases of natural gas. The Company currently does not account for its derivative contracts as hedges but rather marks them to market with a
F-32
Table of Contents
corresponding offset to current earnings. The Company regularly reviews the creditworthiness of its derivative counterparties and does not expect to incur a significant loss from the failure of any counterparties to perform under any agreements.
The following table summarizes the location and fair value amount of our derivative instruments reported in our consolidated balance sheet as of December 31, 2012 and 2011:
| Asset Derivatives |
Liability Derivatives |
|||||||||||||||||||||||
| December 31, 2012 |
December 31, 2011 |
December 31, 2012 |
December 31, 2011 | |||||||||||||||||||||
| Balance |
Fair Value | Balance |
Fair Value | Balance |
Fair Value | Balance Sheet Location |
Fair Value | |||||||||||||||||
| (In millions) | ||||||||||||||||||||||||
| Derivatives not designated as hedging instruments under ASC 815 |
||||||||||||||||||||||||
| Foreign exchange contracts |
— | — | — | — | Other accrued liabilities | — | Other accrued liabilities |
$ | 0.1 | |||||||||||||||
| Commodity contracts |
Prepaid expenses and other current assets | $ | 0.2 | Prepaid expenses and other current assets | $ | 0.1 | Other accrued liabilities | — | Other accrued liabilities |
1.0 | ||||||||||||||
|
|
|
|
|
|
|
|
|
|||||||||||||||||
| Total derivatives |
$ | 0.2 | $ | 0.1 | $ | — | $ | 1.1 | ||||||||||||||||
|
|
|
|
|
|
|
|
|
|||||||||||||||||
As of December 31, 2012 and 2011, the Company’s foreign currency exchange contracts had a U.S. dollar notional amount of $0.7 million and $4.9 million, respectively. As of December 31, 2012 and 2011, the Company had 182 tons and 276 tons, respectively, of nickel futures or option contracts related to forecasted purchases. As of December 31, 2012 and 2011, the Company had 1,300 tons and 5,780 tons, respectively, of hot roll steel coil option contracts related to forecasted purchases. The Company has aluminum price swaps related to forecasted purchases, which had a notional amount of 80 tons and 1,210 tons as of December 31, 2012 and 2011, respectively.
The following table summarizes the location and amount of gains and losses reported in our consolidated statement of operations for the years ended December 31, 2012, 2011 and 2010:
| Derivatives not designated as hedging instruments under ASC 815 |
Location of Gain/(Loss) Recognized in Income on Derivative |
Amount of Gain/(Loss) Recognized in Income on Derivatives |
||||||||||||
| Year Ended December 31, | ||||||||||||||
| 2012 | 2011 | 2010 | ||||||||||||
| (In millions) | ||||||||||||||
| Interest rate contracts |
Interest and other expense on debt | $ | — | $ | — | $ | (1.1 | ) | ||||||
| Foreign exchange contracts |
Other income and (expense), net | 0.1 | 0.2 | (0.3 | ) | |||||||||
| Commodity contracts |
Cost of materials sold | 1.3 | (1.9 | ) | (0.3 | ) | ||||||||
| Natural gas commodity contracts |
Warehousing, delivery, selling, general and administrative | — | (0.1 | ) | (0.1 | ) | ||||||||
|
|
|
|
|
|
|
|||||||||
| Total |
$ | 1.4 | $ | (1.8 | ) | $ | (1.8 | ) | ||||||
|
|
|
|
|
|
|
|||||||||
F-33
Table of Contents
Fair Value Measurements
As required by ASC 820-10-65-1, the Company adopted the nonrecurring fair value measurement disclosures for nonfinancial assets and liabilities. To increase consistency and comparability in fair value measurements, ASC 820 establishes a fair value hierarchy that prioritizes the inputs to valuation techniques used to measure fair value into three levels as follows:
| 1. | Level 1—quoted prices (unadjusted) in active markets for identical assets or liabilities that the Company has the ability to access as of the reporting date. |
| 2. | Level 2—inputs other than quoted prices included within Level 1 that are directly observable for the asset or liability or indirectly observable through corroboration with observable market data. |
| 3. | Level 3—unobservable inputs, such as internally-developed pricing models for the asset or liability due to little or no market activity for the asset or liability. |
The following table presents assets and liabilities measured and recorded at fair value on our Consolidated Balance Sheets on a recurring basis and their level within the fair value hierarchy as of December 31, 2012:
| At December 31, 2012 | ||||||||||||
| Level 1 |
Level 2 |
Level 3 |
||||||||||
| (In millions) | ||||||||||||
| Assets |
||||||||||||
| Cash equivalents: |
||||||||||||
| Commercial paper |
$ | 28.3 | — | — | ||||||||
|
|
|
|
|
|
|
|||||||
| Prepaid and other current assets: |
||||||||||||
| Common stock – available-for-sale investment |
$ | 20.7 | $ | — | $ | — | ||||||
|
|
|
|
|
|
|
|||||||
| Mark-to-market derivatives: |
||||||||||||
| Commodity contracts |
$ | — | $ | 0.2 | $ | — | ||||||
|
|
|
|
|
|
|
|||||||
The following table presents assets and liabilities measured and recorded at fair value on our Consolidated Balance Sheets on a recurring basis and their level within the fair value hierarchy as of December 31, 2011:
| At December 31, 2011 | ||||||||||||
| Level 1 | Level 2 | Level 3 | ||||||||||
| (In millions) | ||||||||||||
| Assets |
||||||||||||
| Cash equivalents: |
||||||||||||
| Commercial paper |
13.1 | — | — | |||||||||
| Money market mutual fund |
2.8 | — | — | |||||||||
|
|
|
|
|
|
|
|||||||
| Total cash equivalents |
$ | 15.9 | $ | — | $ | — | ||||||
|
|
|
|
|
|
|
|||||||
| Prepaid and other current assets: |
||||||||||||
| Common stock—available-for-sale investment |
$ | 10.4 | $ | — | $ | — | ||||||
|
|
|
|
|
|
|
|||||||
| Mark-to-market derivatives: |
||||||||||||
| Commodity contracts |
$ | — | $ | 0.1 | $ | — | ||||||
|
|
|
|
|
|
|
|||||||
| Liabilities |
||||||||||||
| Mark-to-market derivatives: |
||||||||||||
| Foreign exchange contracts |
— | 0.1 | — | |||||||||
| Commodity contracts |
— | 1.0 | — | |||||||||
|
|
|
|
|
|
|
|||||||
| Total liability derivatives |
$ | — | $ | 1.1 | $ | — | ||||||
|
|
|
|
|
|
|
|||||||
F-34
Table of Contents
The fair value of each derivative contract is determined using Level 2 inputs and the market approach valuation technique, as described in ASC 820. The Company has various commodity derivatives to lock in nickel prices for varying time periods. The fair value of these derivatives is determined based on the spot price each individual contract was purchased at and compared with the one-month daily average actual spot price on the London Metals Exchange for nickel on the valuation date. The Company also has commodity derivatives to lock in hot roll coil and aluminum prices for varying time periods. The fair value of these derivatives is determined based on the spot price each individual contract was purchased at and compared with the one-month daily average actual spot price on the New York Mercantile Exchange for the commodity on the valuation date. In addition, the Company has numerous foreign exchange contracts to hedge our Canadian subsidiaries’ variability in cash flows from the forecasted payment of currencies other than the functional currency, the Canadian dollar. The Company defines the fair value of foreign exchange contracts as the amount of the difference between the contracted and current market value at the end of the period. The Company estimates the current market value of foreign exchange contracts by obtaining month-end market quotes of foreign exchange rates and forward rates for contracts with similar terms. The Company uses the exchange rates provided by Reuters. Each contract term varies in the number of months, but on average is between 3 to 12 months in length.
The following table presents assets and liabilities measured and recorded at fair value on our Consolidated Balance Sheets on a non-recurring basis and their level within the fair value hierarchy as of December 31, 2012:
| At December 31, 2012 | ||||||||||||
| Level 1 | Level 2 | Level 3 | ||||||||||
| (In millions) | ||||||||||||
| Assets |
||||||||||||
| Other current assets—assets held for sale (Note 5) |
$ | — | $ | 3.6 | $ | — | ||||||
The following table presents assets and liabilities measured and recorded at fair value on our Consolidated Balance Sheets on a non-recurring basis and their level within the fair value hierarchy as of December 31, 2011:
| At December 31, 2011 | ||||||||||||
| Level 1 | Level 2 | Level 3 | ||||||||||
| (In millions) | ||||||||||||
| Assets |
||||||||||||
| Other current assets—assets held for sale (Note 5) |
$ | — | $ | 10.0 | $ | — | ||||||
The carrying and estimated fair values of the Company’s financial instruments at December 31, 2012 and 2011 were as follows:
| At December 31, 2012 | At December 31, 2011 | |||||||||||||||
| Carrying Amount |
Fair Value | Carrying Amount |
Fair Value | |||||||||||||
| (In millions) | ||||||||||||||||
| Cash and cash equivalents |
$ | 71.2 | $ | 71.2 | $ | 61.7 | $ | 61.7 | ||||||||
| Restricted Cash |
3.9 | 3.9 | 5.3 | 5.3 | ||||||||||||
| Receivables less provision for allowances, claims and doubtful accounts |
394.1 | 394.1 | 513.9 | 513.9 | ||||||||||||
| Accounts payable |
196.3 | 196.3 | 245.1 | 245.1 | ||||||||||||
| Long-term debt, including current portion |
1,305.4 | 1,296.4 | 1,316.2 | 1,225.7 | ||||||||||||
The estimated fair value of the Company’s cash and cash equivalents, receivables less provision for allowances, claims and doubtful accounts and accounts payable approximate their carrying amounts due to the short-term nature of these financial instruments. The estimated fair value of the Company’s long-term debt and the current portions thereof is determined by using quoted market prices of Company debt securities (Level 2 inputs).
F-35
Table of Contents
Available-For-Sale Investments
The Company has classified investments made during 2010 and 2012 as available-for-sale at the time of their purchase. Investments classified as available-for-sale are recorded at fair value with the related unrealized gains and losses included in accumulated other comprehensive income. Management evaluates investments in an unrealized loss position on whether an other-than-temporary impairment has occurred on a periodic basis. Factors considered by management in assessing whether an other-than-temporary impairment has occurred include: the nature of the investment; whether the decline in fair value is attributable to specific adverse conditions affecting the investment; the financial condition of the investee; the severity and the duration of the impairment; and whether we intend to sell the investment or will be required to sell the investment before recovery of its amortized cost basis. When it is determined that an other-than-temporary impairment has occurred, the investment is written down to its market value at the end of the period in which it is determined that an other-than-temporary decline has occurred. As of December 31, 2012, the investment was in a gross unrealized gain position. Realized gains and losses are recorded within the statement of operations upon sale of the security and are based on specific identification.
The Company’s available-for-sale securities as of December 31, 2012 can be summarized as follows:
| At December 31, 2012 | ||||||||||||||||
| Cost | Gross Unrealized Gains |
Gross Unrealized Losses |
Fair Value | |||||||||||||
| (In millions) | ||||||||||||||||
| Common stock |
$ | 17.4 | $ | 3.3 | $ | — | $ | 20.7 | ||||||||
The Company’s available-for-sale security as of December 31, 2011 can be summarized as follows:
| At December 31, 2011 | ||||||||||||||||
| Cost | Gross Unrealized Gains |
Gross Unrealized Losses |
Fair Value | |||||||||||||
| (In millions) | ||||||||||||||||
| Common stock |
$ | 14.8 | $ | — | $ | (4.4 | ) | $ | 10.4 | |||||||
There is no maturity date for this investment and there have been no sales for the years ended December 31, 2012, 2011 and 2010.
Note 17: Income Taxes
The elements of the provision (benefit) for income taxes were as follows:
| Year Ended December 31, | ||||||||||||
| 2012 | 2011 | 2010 | ||||||||||
| (In millions) | ||||||||||||
| Income (loss) before income tax: |
||||||||||||
| U.S. |
$ | 47.5 | $ | (14.8 | ) | $ | (84.1 | ) | ||||
| Foreign |
(7.2 | ) | (5.0 | ) | (6.5 | ) | ||||||
|
|
|
|
|
|
|
|||||||
| $ | 40.3 | $ | (19.8 | ) | $ | (90.6 | ) | |||||
|
|
|
|
|
|
|
|||||||
| Current income taxes: |
||||||||||||
| Federal |
$ | — | $ | (5.3 | ) | $ | (46.6 | ) | ||||
| Foreign |
0.6 | 5.4 | 1.5 | |||||||||
| State |
3.1 | 0.5 | (0.6 | ) | ||||||||
|
|
|
|
|
|
|
|||||||
| 3.7 | 0.6 | (45.7 | ) | |||||||||
| Deferred income taxes |
(9.2 | ) | (11.6 | ) | 58.8 | |||||||
|
|
|
|
|
|
|
|||||||
| Total tax provision (benefit) |
$ | (5.5 | ) | $ | (11.0 | ) | $ | 13.1 | ||||
|
|
|
|
|
|
|
|||||||
F-36
Table of Contents
Income taxes differ from the amounts computed by applying the federal tax rate as follows:
| Year Ended December 31, | ||||||||||||
| 2012 | 2011 | 2010 | ||||||||||
| (In millions) | ||||||||||||
| Federal income tax expense (benefit) computed at statutory tax rate of 35% |
$ | 14.1 | $ | (6.9 | ) | $ | (31.7 | ) | ||||
| Additional taxes or credits from: |
||||||||||||
| State and local income taxes, net of federal income tax effect |
3.0 | 2.0 | (0.4 | ) | ||||||||
| Non-deductible expenses and non-taxable income |
1.9 | (1.1 | ) | 0.7 | ||||||||
| Domestic production activities |
— | — | 2.1 | |||||||||
| Foreign income not includable in federal taxable income |
0.3 | 5.8 | 5.5 | |||||||||
| Effect of acquisition related elections and settlements (1) |
(7.1 | ) | — | — | ||||||||
| Valuation allowance changes (net) (2) |
(19.2 | ) | (11.7 | ) | 36.5 | |||||||
| All other, net |
1.5 | 0.9 | 0.4 | |||||||||
|
|
|
|
|
|
|
|||||||
| Total income tax provision (benefit) |
$ | (5.5 | ) | $ | (11.0 | ) | $ | 13.1 | ||||
|
|
|
|
|
|
|
|||||||
| (1) | Includes an $8.5 million deferred tax benefit related to a tax election corresponding with the acquisition of Turret, for which an offsetting valuation allowance was also recorded in 2012. |
| (2) | The 2012 change in valuation allowance includes a benefit from the use of U.S. federal and state net operating loss carryforwards totaling approximately $4 million. |
The components of the deferred income tax assets and liabilities arising under FASB ASC 740, “Income Taxes” (“ASC 740”) were as follows:
| At December 31, | ||||||||
| 2012 | 2011 | |||||||
| (In millions) | ||||||||
| Deferred tax assets: |
||||||||
| AMT tax credit carryforwards |
$ | 30 | $ | 30 | ||||
| Post-retirement benefits other than pensions |
49 | 54 | ||||||
| Federal and foreign net operating loss carryforwards |
64 | 64 | ||||||
| State net operating loss carryforwards |
12 | 12 | ||||||
| Pension liability |
143 | 139 | ||||||
| Other deductible temporary differences |
16 | 22 | ||||||
| Less: valuation allowances |
(147 | ) | (152 | ) | ||||
|
|
|
|
|
|||||
| $ | 167 | $ | 169 | |||||
|
|
|
|
|
|||||
| Deferred tax liabilities: |
||||||||
| Fixed asset basis difference |
$ | 109 | $ | 114 | ||||
| Inventory basis difference |
130 | 131 | ||||||
| Other intangibles |
11 | 19 | ||||||
|
|
|
|
|
|||||
| 250 | 264 | |||||||
|
|
|
|
|
|||||
| Net deferred tax liability |
$ | (83 | ) | $ | (95 | ) | ||
|
|
|
|
|
|||||
The Company recognized a total net tax benefit of $19.2 million related to 2012 changes in valuation allowance, including a $15.2 million tax benefit as a result of the release of valuation allowance related to certain state deferred tax assets recorded at one of its subsidiaries, JT Ryerson, at December 31, 2012. As described in Note 1, the Company assesses the need for a valuation allowance considering all available positive and negative evidence, including past operating results, projections of future taxable income and the feasibility of ongoing tax planning strategies. The fourth quarter of 2012 was the first quarter in which JT Ryerson had sustained an operating profit in both the preceding cumulative three fiscal year period and in each of its two preceding fiscal
F-37
Table of Contents
years, providing objective evidence of JT Ryerson’s ability to earn future profits. Combined with JT Ryerson’s projections of future income providing additional subjective evidence of JT Ryerson’s ability to earn future profits and management’s judgment, the Company determined that these deferred tax assets were more likely than not realizable and accordingly the valuation allowance was no longer required.
The Company will continue to maintain a valuation allowance on definite-lived U.S. federal and state (excluding JT Ryerson) deferred tax assets until such time as in management’s judgment, considering all available positive and negative evidence and consistent with its determinations regarding JT Ryerson described above, the Company determines that these deferred tax assets are more likely than not realizable.
The Company had available at December 31, 2012, federal AMT credit carryforwards of approximately $30 million, which may be used indefinitely to reduce regular federal income taxes.
The Company’s deferred tax assets also include $56 million related to U.S. federal net operating loss (“NOL”) carryforwards which expire in 18 years, $12 million related to state NOL carryforwards which expire generally in 3 to 15 years and $8 million related to foreign NOL carryforwards which expire in 1 to 5 years, available at December 31, 2012.
Earnings from the Company’s foreign subsidiaries are considered to be indefinitely reinvested and, accordingly, no provision for U.S. federal and state income taxes or foreign withholding tax has been made in our Consolidated Financial Statements related to the indefinitely reinvested earnings. At December 31, 2012, the Company had approximately $34 million of undistributed foreign earnings on which no U.S. tax expense has been recorded. A distribution of these non-U.S. earnings in the form of dividends or otherwise would subject the Company to both U.S. federal and state income taxes, as adjusted for tax credits and foreign withholding taxes. A determination of the amount of any unrecognized deferred income tax liability on the undistributed earnings is predominately dependent on the determination of the available tax credits. The ability to benefit from the tax credits is dependent on a number of currently unknown factors including the timing of future distributions, the mix of distributions and the amount of non-U.S. source income in future years. Modeling the many future potential scenarios is therefore not practical.
The Company’s foreign subsidiaries in Canada and China held approximately $51 million in cash and short term investments at the end of 2012 that, if repatriated, would cause the Company to accrue additional U.S. income taxes. The Company does not intend to repatriate these funds.
The Company accounts for uncertain income tax positions in accordance with ASC 740. A reconciliation of the beginning and ending amount of unrecognized tax benefits is as follows:
| Unrecognized Tax Benefits |
||||
| (In millions) | ||||
| Unrecognized tax benefits balance at January 1, 2010 |
$ | 5.0 | ||
| Gross increases—tax positions in current periods |
1.6 | |||
| Settlements and closing of statute of limitations |
(0.2 | ) | ||
|
|
|
|||
| Unrecognized tax benefits balance at December 31, 2010 |
$ | 6.4 | ||
| Gross increases—tax positions in current periods |
1.5 | |||
| Settlements and closing of statute of limitations |
(0.9 | ) | ||
|
|
|
|||
| Unrecognized tax benefits balance at December 31, 2011 |
$ | 7.0 | ||
| Gross increases—tax positions in current periods |
2.0 | |||
|
|
|
|||
| Unrecognized tax benefits balance at December 31, 2012 |
$ | 9.0 | ||
|
|
|
|||
F-38
Table of Contents
Ryerson and its subsidiaries are subject to U.S. federal income tax as well as income tax of multiple state and foreign jurisdictions. The Company has substantially concluded all U.S. federal income tax matters for years through 2009. Substantially all state and local income tax matters have been concluded through 2006. However, a change by a state in subsequent years would result in an insignificant change to the Company’s state tax liability. The Company has substantially concluded foreign income tax matters through 2006 for all significant foreign jurisdictions.
We recognize interest and penalties related to uncertain tax positions in income tax expense. As of December 31, 2012 and 2011, we had approximately $1.0 million and $0.7 million of accrued interest related to uncertain tax positions, respectively. Total amount of unrecognized tax benefits that would affect our effective tax rate if recognized is $9.0 million and $3.8 million as of December 31, 2012 and 2011, respectively. Although a larger portion of the unrecognized tax benefit may affect the effective tax rate, currently, the benefit would be in the form of a deferred tax asset fully offset by a valuation allowance.
Note 18: Earnings per Share
On July 16, 2007, Ryerson Holding was capitalized with 5,000,000 shares of common stock by Platinum Equity, LLC. All shares outstanding are common shares and have equal voting, liquidation and preference rights.
Basic earnings per share (“EPS”) attributable to Ryerson Holding’s common stock is determined based on earnings for the period divided by the weighted average number of common shares outstanding during the period. Diluted EPS attributable to Ryerson Holding’s common stock considers the effect of potential common shares, unless inclusion of the potential common shares would have an antidilutive effect. Subsequent to October 19, 2007, Ryerson Holding does not have any securities or other items that are convertible into common shares, therefore basic and fully diluted EPS are the same.
The following table sets forth the calculation of basic and diluted earnings (loss) per share:
| Year Ended December 31, | ||||||||||||
| Basic and diluted earnings (loss) per share |
2012 | 2011 | 2010 | |||||||||
| (In millions, except per share data) | ||||||||||||
| Net income (loss) available to common stockholders |
$ | 47.1 | $ | (8.1 | ) | $ | (104.0 | ) | ||||
|
|
|
|
|
|
|
|||||||
| Average shares of common stock outstanding |
5.0 | 5.0 | 5.0 | |||||||||
|
|
|
|
|
|
|
|||||||
| Basic and diluted earnings (loss) per share |
$ | 9.41 | $ | (1.62 | ) | $ | (20.80 | ) | ||||
|
|
|
|
|
|
|
|||||||
Note 19: Subsequent Events
JT Ryerson, one of our subsidiaries, is party to a corporate advisory services agreement with Platinum Advisors, an affiliate of Platinum, pursuant to which Platinum Advisors provides JT Ryerson certain business, management, administrative and financial advice. On , JT Ryerson’s Board of Directors approved the termination of this services agreement contingent on the closing of the initial public offering. As consideration for terminating the monitoring fee payable thereunder, JT Ryerson will pay Platinum Advisors $ million. The Company will recognize the termination fee within Warehousing, delivery, selling, general and administrative expense upon the closing of the initial public offering. The unaudited pro forma balance sheet presents the effect of funding the termination payment to the principal stockholder. The unaudited pro forma balance sheet is presented for informational purposes only in accordance with Staff Accounting Bulletin Topic 1.B.3.
Ryerson Holding and Platinum are party to an investor rights agreement and have agreed to enter into the Investor Rights Agreement upon the consummation of this offering that will provide for, among other things, demand, piggyback and Form S-3 registration rights and board nomination rights.
F-39
Table of Contents
The Investor Rights Agreement will provide that Platinum may make written demands of us to require us to register the shares of our common stock owned by Platinum; provided, however that we will not be obligated to effect more than two such demand registrations. In addition, Platinum will have piggyback registration rights entitling them to require us to register shares of our common stock owned by them in connection with any registration statements filed by us after the completion of this offering, subject to certain exceptions. Upon the closing of this offering, we have agreed to use commercially reasonable efforts to qualify for registration on Form S-3 for secondary sales. After we have qualified for the use of Form S-3, Platinum will, subject to certain exceptions, have the right to request an unlimited number of registrations on Form S-3. We will not be obligated to effect a registration unless certain pricing or timing conditions are first satisfied.
The Investor Rights Agreement provides that we will indemnify Platinum against losses suffered by it in connection with any untrue or alleged untrue statement of a material fact contained in any prospectus, offering circular, or other document delivered or made available to investors (or in any related registration statement or any amendment or supplement thereto) or any omission or alleged omission to state therein a material fact required to be stated therein or necessary to make the statement therein not misleading, except insofar as the same may be caused by or contained in any information furnished in writing to us by Platinum for use therein.
The Investor Rights Agreement will provide that for so long as Platinum collectively beneficially owns at least (i) 30% of the voting power of the outstanding capital stock of the Company, Platinum will have the right to nominate for election to the board of directors of the Company no fewer than that number of directors that would
constitute a majority of the number of directors if there were no vacancies on the board, (ii) at least 15% but less than 30% of the voting power of the outstanding capital stock of the Company, Platinum will have the right to nominate two directors and (iii) at least 5% but less than 15% of the voting power of the outstanding capital stock of the Company, Platinum will have the right to nominate one director. The agreement will also provide that if the size of the board of directors is increased or decreased at any time, Platinum’s nomination rights will be proportionately increased or decreased, respectively, rounded up to the nearest whole number, except that if the board of directors increases its size within 180 days of the date of the agreement, Platinum will have the right to designate director nominees to fill each newly created directorship.
The Investor Rights Agreement was negotiated among management and Platinum, and we believe the Investor Rights Agreement is on arm’s-length terms.
On , our Board of Directors approved a for 1.00 stock split of the Company’s common stock to be effected prior to the closing of this offering. Per share and share amounts presented herein have been adjusted for all periods presented to give retroactive effect to the for 1.00 stock split.
F-40
Table of Contents
SUPPLEMENTARY FINANCIAL DATA (UNAUDITED)
RYERSON HOLDING CORPORATION AND SUBSIDIARY COMPANIES
SUMMARY BY QUARTER
(In millions)
| Net Sales | Gross Profit |
Income (Loss) Before Income Taxes |
Net Income (Loss) |
Net Income (Loss) Attributable to Ryerson Holding Corporation |
Basic
and Diluted Earnings (Loss) per Common Share |
|||||||||||||||||||
| 2011 |
||||||||||||||||||||||||
| First Quarter (1) |
$ | 1,187.0 | $ | 156.7 | $ | (2.8 | ) | $ | (1.6 | ) | $ | (1.7 | ) | $ | (0.34 | ) | ||||||||
| Second Quarter (2) |
1,289.0 | 163.9 | (10.2 | ) | (18.0 | ) | (18.0 | ) | (3.60 | ) | ||||||||||||||
| Third Quarter (3) |
1,218.8 | 173.7 | 2.6 | (0.9 | ) | (0.9 | ) | (0.18 | ) | |||||||||||||||
| Fourth Quarter (4) |
1,035.0 | 164.5 | (9.4 | ) | 11.7 | 12.5 | 2.50 | |||||||||||||||||
|
|
|
|
|
|
|
|
|
|
|
|
|
|||||||||||||
| Year |
$ | 4,729.8 | $ | 658.8 | $ | (19.8 | ) | $ | (8.8 | ) | $ | (8.1 | ) | $ | (1.62 | ) | ||||||||
|
|
|
|
|
|
|
|
|
|
|
|
|
|||||||||||||
| 2012 |
||||||||||||||||||||||||
| First Quarter |
$ | 1,121.6 | $ | 190.8 | $ | 27.5 | $ | 24.9 | $ | 25.0 | $ | 4.99 | ||||||||||||
| Second Quarter (5) |
1,090.6 | 184.0 | 19.8 | 15.4 | 15.6 | 3.13 | ||||||||||||||||||
| Third Quarter |
962.2 | 180.5 | 18.6 | 16.0 | 16.4 | 3.29 | ||||||||||||||||||
| Fourth Quarter (6) |
850.3 | 154.3 | (25.6 | ) | (10.5 | ) | (9.9 | ) | (2.00 | ) | ||||||||||||||
|
|
|
|
|
|
|
|
|
|
|
|
|
|||||||||||||
| Year |
$ | 4,024.7 | $ | 709.6 | $ | 40.3 | $ | 45.8 | $ | 47.1 | $ | 9.41 | ||||||||||||
|
|
|
|
|
|
|
|
|
|
|
|
|
|||||||||||||
| (1) | Included in the first quarter 2011 results is a $5.8 million gain on bargain purchase related to our Singer acquisition and a $1.1 million write off of debt issuance costs associated with our prior credit facility upon entering into an amended revolving credit facility on March 14, 2011. |
| (2) | Included in the second quarter 2011 results is an impairment charge of $2.5 million related to certain assets held for sale to recognize the assets at their fair value less cost to sell. |
| (3) | Included in the third quarter 2011 results is an impairment charge of $2.2 million related to certain assets held for sale to recognize the assets at their fair value less cost to sell. |
| (4) | Included in the fourth quarter 2011 results is an impairment charge of $3.1 million related to certain assets held for sale to recognize the assets at their fair value less cost to sell and an impairment charge of $1.5 million related to goodwill. The fourth quarter also includes a $9.8 million restructuring charge related to a reorganization plan implemented to reduce headcount. The fourth quarter also included an income tax benefit of $21.1 million, primarily related to benefits relating to the purchase accounting impact of the Turret acquisition. |
| (5) | Included in the second quarter 2012 results is an impairment charge of $0.9 million related to certain assets held for sale to recognize the assets at their fair value less cost to sell. |
| (6) | Included in the fourth quarter 2012 results is an impairment charge of $0.1 million related to certain assets held for sale to recognize the assets at their fair value less cost to sell, $1.1 million restructuring charges primarily for employee-related costs resulting from a facility closure, a $32.8 million loss on the redemption of the Old Ryerson Notes and Ryerson Holding Notes, and a $1.7 million curtailment gain related to an amendment of a Canadian post-retirement medical and life insurance plan. The fourth quarter also included an income tax benefit of $15.2 million related to the release of valuation allowance associated with certain state deferred tax assets. |
F-41
Table of Contents
SCHEDULE I—CONDENSED FINANCIAL INFORMATION OF REGISTRANT
RYERSON HOLDING CORPORATION
(Parent Company Only)
STATEMENTS OF OPERATIONS
(In millions)
| Year ended December 31, | ||||||||||||
| 2012 | 2011 | 2010 | ||||||||||
| Administrative and other expenses |
$ | (1.0 | ) | $ | (0.1 | ) | $ | (1.5 | ) | |||
| Other income and (expense), net |
(15.6 | ) | — | — | ||||||||
| Interest and other expense on debt |
(40.1 | ) | (43.0 | ) | (32.3 | ) | ||||||
| Equity in income (loss) of subsidiaries |
103.8 | 35.0 | (70.8 | ) | ||||||||
|
|
|
|
|
|
|
|||||||
| Income (loss) before income taxes |
47.1 | (8.1 | ) | (104.6 | ) | |||||||
| Benefit for income taxes |
— | — | (0.6 | ) | ||||||||
|
|
|
|
|
|
|
|||||||
| Net income (loss) |
$ | 47.1 | $ | (8.1 | ) | $ | (104.0 | ) | ||||
|
|
|
|
|
|
|
|||||||
See Notes to Condensed Financial Statements.
F-42
Table of Contents
SCHEDULE I—CONDENSED FINANCIAL INFORMATION OF REGISTRANT
RYERSON HOLDING CORPORATION
(Parent Company Only)
STATEMENTS OF COMPREHENSIVE INCOME
(In millions)
| Year Ended December 31, | ||||||||||||
| 2012 | 2011 | 2010 | ||||||||||
| Net income (loss) |
$ | 47.1 | $ | (8.1 | ) | $ | (104.0 | ) | ||||
| Other comprehensive income (loss), before tax: |
||||||||||||
| Foreign currency translation adjustments |
4.3 | (1.5 | ) | 11.0 | ||||||||
| Unrealized gain (loss) on available-for-sale investment |
7.7 | (9.8 | ) | 5.4 | ||||||||
| Changes in defined benefit pension and other post-retirement benefit plans |
(51.5 | ) | (66.7 | ) | (19.0 | ) | ||||||
|
|
|
|
|
|
|
|||||||
| Other comprehensive loss |
(39.5 | ) | (78.0 | ) | (2.6 | ) | ||||||
| Total comprehensive income (loss), before tax |
7.6 | (86.1 | ) | (106.6 | ) | |||||||
| Income tax benefit related to items of other comprehensive income |
(2.1 | ) | (1.5 | ) | (0.7 | ) | ||||||
|
|
|
|
|
|
|
|||||||
| Comprehensive income (loss), after tax |
$ | 9.7 | $ | (84.6 | ) | $ | (105.9 | ) | ||||
|
|
|
|
|
|
|
|||||||
See Notes to Condensed Financial Statements.
F-43
Table of Contents
SCHEDULE I—CONDENSED FINANCIAL INFORMATION OF REGISTRANT
RYERSON HOLDING CORPORATION
(Parent Company Only)
STATEMENTS OF CASH FLOWS
(In millions)
| Year ended December 31, | ||||||||||||
| 2012 | 2011 | 2010 | ||||||||||
| Operating Activities: |
||||||||||||
| Net income (loss) |
$ | 47.1 | $ | (8.1 | ) | $ | (104.0 | ) | ||||
| Adjustments to reconcile net income (loss) to net |
||||||||||||
| cash provided by (used in) operating activities: |
||||||||||||
| Equity in (earnings) losses of subsidiaries |
(103.8 | ) | (35.0 | ) | 70.8 | |||||||
| Noncash interest expense related to debt discount amortization |
39.0 | 41.5 | 30.9 | |||||||||
| Loss on retirement of debt |
15.6 | — | — | |||||||||
| Decrease in receivables from subsidiaries |
0.6 | 0.7 | 3.5 | |||||||||
| Decrease in other assets |
1.0 | 0.9 | 2.0 | |||||||||
| Decrease in accounts payable |
— | — | (0.7 | ) | ||||||||
| Increase (decrease) in accrued liabilities |
0.5 | — | (2.8 | ) | ||||||||
|
|
|
|
|
|
|
|||||||
| Net adjustments |
(47.1 | ) | 8.1 | 103.7 | ||||||||
|
|
|
|
|
|
|
|||||||
| Net cash provided by (used in) operating activities |
— | — | (0.3 | ) | ||||||||
|
|
|
|
|
|
|
|||||||
| Investing Activities: |
||||||||||||
| Dividends received from subsidiaries |
379.9 | — | — | |||||||||
|
|
|
|
|
|
|
|||||||
| Net cash provided by investing activities |
379.9 | — | — | |||||||||
|
|
|
|
|
|
|
|||||||
| Financing activities: |
||||||||||||
| Long-term debt issued |
— | — | 220.2 | |||||||||
| Long-term debt retired |
(344.9 | ) | — | — | ||||||||
| Long-term debt issuance costs |
— | — | (5.8 | ) | ||||||||
| Distributions made |
(35.0 | ) | — | (213.8 | ) | |||||||
|
|
|
|
|
|
|
|||||||
| Net cash provided by (used in) financing activities |
(379.9 | ) | — | 0.6 | ||||||||
|
|
|
|
|
|
|
|||||||
| Net increase (decrease) in cash and cash equivalents |
— | — | 0.3 | |||||||||
| Cash and cash equivalents—beginning of period |
0.4 | 0.4 | 0.1 | |||||||||
|
|
|
|
|
|
|
|||||||
| Cash and cash equivalents—end of period |
$ | 0.4 | $ | 0.4 | $ | 0.4 | ||||||
|
|
|
|
|
|
|
|||||||
See Notes to Condensed Financial Statements.
F-44
Table of Contents
SCHEDULE I—CONDENSED FINANCIAL INFORMATION OF REGISTRANT
RYERSON HOLDING CORPORATION
(Parent Company Only)
BALANCE SHEETS
(In millions, except shares)
| At December 31, | ||||||||
| 2012 | 2011 | |||||||
| Assets |
||||||||
| Current assets: |
||||||||
| Cash and cash equivalents |
$ | 0.4 | $ | 0.4 | ||||
| Receivable from subsidiaries |
11.4 | 11.7 | ||||||
|
|
|
|
|
|||||
| Total current assets |
11.8 | 12.1 | ||||||
| Investment in subsidiaries |
— | 5.9 | ||||||
| Deferred charges and other assets |
— | 3.3 | ||||||
|
|
|
|
|
|||||
| Total assets |
$ | 11.8 | $ | 21.3 | ||||
|
|
|
|
|
|||||
| Liabilities |
||||||||
| Accrued liabilities |
$ | 0.5 | $ | — | ||||
|
|
|
|
|
|||||
| Total current liabilities |
0.5 | — | ||||||
| Long-term debt |
— | 292.6 | ||||||
| Dividends in excess of investment in subsidiaries |
307.9 | — | ||||||
|
|
|
|
|
|||||
| Total liabilities |
308.4 | 292.6 | ||||||
| Stockholders’ equity (deficit) |
||||||||
| Common stock, $0.01 par value; 10,000,000 shares authorized; 5,000,000 shares issued at 2012 and 2011 |
— | — | ||||||
| Capital in excess of par value |
189.9 | 224.9 | ||||||
| Accumulated deficit |
(234.4 | ) | (281.5 | ) | ||||
| Accumulated other comprehensive loss |
(252.1 | ) | (214.7 | ) | ||||
|
|
|
|
|
|||||
| Total stockholders’ equity (deficit) |
(296.6 | ) | (271.3 | ) | ||||
|
|
|
|
|
|||||
| Total liabilities and stockholders’ equity |
$ | 11.8 | $ | 21.3 | ||||
|
|
|
|
|
|||||
See Notes to Condensed Financial Statements.
F-45
Table of Contents
SCHEDULE I—CONDENSED FINANCIAL INFORMATION OF REGISTRANT
RYERSON HOLDING CORPORATION
(Parent Company Only)
NOTES TO FINANCIAL STATEMENTS
(In millions)
Note 1: Basis of presentation
In the parent company only financial statements, the Company’s investment in subsidiaries is stated at cost plus equity in undistributed earnings of subsidiaries since the date of acquisition. The Company’s share of net income of its unconsolidated subsidiaries is included in consolidated income using the equity method. The parent company only financial statements should be read in conjunction with the Company’s consolidated financial statements.
Note 2: Debt
As of November 1, 2012, all of the Ryerson Holding Notes were repurchased or redeemed and cancelled. The Company recorded a $15.6 million loss on the repurchase and cancellation of debt related to the Ryerson Holding Notes within other income and (expense), net on the Consolidated Statements of Operations.
Note 3: Guarantee
Ryerson Holding has guaranteed $35 million of loans made between three of its wholly-owned subsidiaries. These loans are payable on demand.
Note 4: Dividends from subsidiaries
Cash dividends paid to Ryerson Holding Corporation from the Company’s consolidated subsidiaries were $379.9 million for the year ended December 31, 2012. No cash dividends were paid for the years ended December 31, 2011 and 2010.
F-46
Table of Contents
RYERSON HOLDING CORPORATION AND SUBSIDIARY COMPANIES
SCHEDULE II—VALUATION AND QUALIFYING ACCOUNTS
For the Years Ended December 31, 2012, 2011 and 2010
(In millions)
| Provision for Allowances | ||||||||||||||||||||||||
| Balance at Beginning of Period |
Acquisition of Business |
Additions Charged (Credited) to Income |
Additions Charged to Other Comprehensive Income |
Deductions from Reserves |
Balance at End of Period |
|||||||||||||||||||
| Year ended December 31, 2012 |
||||||||||||||||||||||||
| Allowance for doubtful accounts |
$ | 7.7 | $ | — | $ | 1.7 | $ | — | $ | (2.3 | )(A) | $ | 7.1 | |||||||||||
| Valuation allowance—deferred tax assets |
151.7 | 1.2 | (B) | (19.2 | ) | 13.6 | — | 147.3 | ||||||||||||||||
| Year ended December 31, 2011 |
||||||||||||||||||||||||
| Allowance for doubtful accounts |
$ | 8.7 | $ | — | $ | 3.4 | $ | — | $ | (4.4 | )(A) | $ | 7.7 | |||||||||||
| Valuation allowance—deferred tax assets |
136.6 | — | (11.7 | ) | 26.8 | — | 151.7 | |||||||||||||||||
| Year ended December 31, 2010 |
||||||||||||||||||||||||
| Allowance for doubtful accounts |
$ | 10.5 | $ | — | $ | 3.0 | $ | — | $ | (4.8 | )(A) | $ | 8.7 | |||||||||||
| Valuation allowance—deferred tax assets |
98.8 | — | 36.5 | 4.4 | (3.1 | )(C) | 136.6 | |||||||||||||||||
NOTES:
| (A) | Bad debts written off during the year |
| (B) | Reserve of $1.2 million was acquired in acquisition of Açofran |
| (C) | Change in net deferred tax assets for which a valuation allowance was fully provided |
F-47
Table of Contents
RYERSON HOLDING CORPORATION AND SUBSIDIARY COMPANIES
Condensed Consolidated Statements of Comprehensive Income (Unaudited)
(In millions)
| Three Months Ended September 30, |
Nine Months Ended September 30, |
|||||||||||||||
| 2013 | 2012 | 2013 | 2012 | |||||||||||||
| Net sales |
$ | 859.8 | $ | 962.2 | $ | 2,657.8 | $ | 3,174.4 | ||||||||
| Cost of materials sold |
704.7 | 781.7 | 2,188.4 | 2,619.1 | ||||||||||||
|
|
|
|
|
|
|
|
|
|||||||||
| Gross profit |
155.1 | 180.5 | 469.4 | 555.3 | ||||||||||||
| Warehousing, delivery, selling, general and administrative |
120.2 | 126.9 | 363.2 | 389.9 | ||||||||||||
| Restructuring and other charges |
— | — | 2.1 | — | ||||||||||||
| Impairment charges on fixed assets and goodwill |
1.1 | — | 8.8 | 0.9 | ||||||||||||
|
|
|
|
|
|
|
|
|
|||||||||
| Operating profit |
33.8 | 53.6 | 95.3 | 164.5 | ||||||||||||
| Other income and (expense), net |
(1.1 | ) | (1.5 | ) | 2.1 | (1.0 | ) | |||||||||
| Interest and other expense on debt |
(27.1 | ) | (33.5 | ) | (83.3 | ) | (97.6 | ) | ||||||||
|
|
|
|
|
|
|
|
|
|||||||||
| Income before income taxes |
5.6 | 18.6 | 14.1 | 65.9 | ||||||||||||
| Provision for income taxes |
2.8 | 2.6 | 5.9 | 9.6 | ||||||||||||
|
|
|
|
|
|
|
|
|
|||||||||
| Net income |
2.8 | 16.0 | 8.2 | 56.3 | ||||||||||||
| Less: Net loss attributable to noncontrolling interest |
(0.2 | ) | (0.4 | ) | (0.9 | ) | (0.7 | ) | ||||||||
|
|
|
|
|
|
|
|
|
|||||||||
| Net income attributable to Ryerson Holding Corporation |
$ | 3.0 | $ | 16.4 | $ | 9.1 | $ | 57.0 | ||||||||
|
|
|
|
|
|
|
|
|
|||||||||
| Comprehensive income |
$ | 8.2 | $ | 27.1 | $ | 6.6 | $ | 68.7 | ||||||||
| Less: Comprehensive loss attributable to noncontrolling interest |
(0.4 | ) | (0.4 | ) | (1.1 | ) | (1.1 | ) | ||||||||
|
|
|
|
|
|
|
|
|
|||||||||
| Comprehensive income attributable to Ryerson Holding Corporation |
$ | 8.6 | $ | 27.5 | $ | 7.7 | $ | 69.8 | ||||||||
|
|
|
|
|
|
|
|
|
|||||||||
| Basic and diluted earnings per share |
$ | 0.59 | $ | 3.29 | $ | 1.82 | $ | 11.41 | ||||||||
|
|
|
|
|
|
|
|
|
|||||||||
See Notes to Condensed Consolidated Financial Statements.
F-48
Table of Contents
RYERSON HOLDING CORPORATION AND SUBSIDIARY COMPANIES
Condensed Consolidated Statements of Cash Flows (Unaudited)
(In millions)
| Nine Months Ended September 30, |
||||||||
| 2013 | 2012 | |||||||
| Operating activities: |
||||||||
| Net income |
$ | 8.2 | $ | 56.3 | ||||
|
|
|
|
|
|||||
| Adjustments to reconcile net income to net cash provided by operating activities: |
||||||||
| Depreciation and amortization |
34.7 | 34.6 | ||||||
| Deferred income taxes |
7.3 | 0.3 | ||||||
| Provision for allowances, claims and doubtful accounts |
(0.4 | ) | 0.6 | |||||
| Noncash interest expense related to debt discount amortization |
— | 37.7 | ||||||
| Impairment charges on fixed assets and goodwill |
8.8 | 0.9 | ||||||
| Restructuring and other charges |
2.1 | — | ||||||
| Other items |
0.6 | 1.8 | ||||||
| Change in operating assets and liabilities, net of the effects of acquisitions: |
||||||||
| Receivables |
(27.2 | ) | 32.3 | |||||
| Inventories |
36.5 | (43.2 | ) | |||||
| Other assets |
4.2 | 3.4 | ||||||
| Accounts payable |
36.4 | 1.9 | ||||||
| Accrued liabilities |
21.4 | (3.2 | ) | |||||
| Accrued taxes payable/receivable |
(0.8 | ) | 3.8 | |||||
| Deferred employee benefit costs |
(43.8 | ) | (41.1 | ) | ||||
|
|
|
|
|
|||||
| Net adjustments |
79.8 | 29.8 | ||||||
|
|
|
|
|
|||||
| Net cash provided by operating activities |
88.0 | 86.1 | ||||||
|
|
|
|
|
|||||
| Investing activities: |
||||||||
| Acquisitions, net of cash acquired |
— | (4.6 | ) | |||||
| (Increase)/decrease in restricted cash |
(0.7 | ) | 1.0 | |||||
| Capital expenditures |
(16.5 | ) | (32.0 | ) | ||||
| Investment in joint venture |
— | (2.9 | ) | |||||
| Increase in cash due to consolidation of joint venture |
— | 3.0 | ||||||
| Proceeds from sales of property, plant and equipment |
4.3 | 8.5 | ||||||
| Purchase of available-for-sale investment |
— | (2.5 | ) | |||||
|
|
|
|
|
|||||
| Net cash used in investing activities |
(12.9 | ) | (29.5 | ) | ||||
|
|
|
|
|
|||||
| Financing activities: |
||||||||
| Net repayments of credit facility borrowings |
(65.3 | ) | (96.1 | ) | ||||
| Long-term debt issuance costs |
(0.9 | ) | — | |||||
| Credit facility issuance costs |
(3.7 | ) | — | |||||
| Net increase in book overdrafts |
7.7 | 30.6 | ||||||
| Principal payments on capital lease obligation |
(0.3 | ) | — | |||||
|
|
|
|
|
|||||
| Net cash used in financing activities |
(62.5 | ) | (65.5 | ) | ||||
|
|
|
|
|
|||||
| Net increase (decrease) in cash and cash equivalents |
12.6 | (8.9 | ) | |||||
| Effect of exchange rate changes on cash and cash equivalents |
(2.7 | ) | 1.6 | |||||
|
|
|
|
|
|||||
| Net change in cash and cash equivalents |
9.9 | (7.3 | ) | |||||
| Cash and cash equivalents—beginning of period |
71.2 | 61.7 | ||||||
|
|
|
|
|
|||||
| Cash and cash equivalents—end of period |
$ | 81.1 | $ | 54.4 | ||||
|
|
|
|
|
|||||
| Supplemental disclosures: |
||||||||
| Cash paid during the period for: |
||||||||
| Interest paid to third parties |
$ | 56.4 | $ | 43.6 | ||||
| Income taxes, net |
0.8 | 4.6 | ||||||
| Noncash investing activities: |
||||||||
| Asset additions under capital leases |
$ | 0.7 | $ | — | ||||
See Notes to Condensed Consolidated Financial Statements.
F-49
Table of Contents
RYERSON HOLDING CORPORATION AND SUBSIDIARY COMPANIES
Condensed Consolidated Balance Sheets
(In millions, except shares)
| September 30, 2013 |
December 31, 2012 |
Unaudited Proforma at September 30, 2013 |
||||||||||
| (unaudited) | (unaudited) | |||||||||||
| Assets |
||||||||||||
| Current assets: |
||||||||||||
| Cash and cash equivalents |
$ | 81.1 | $ | 71.2 | $ | 81.1 | ||||||
| Restricted cash |
4.6 | 3.9 | 4.6 | |||||||||
| Receivables less provision for allowances, claims and doubtful accounts of $6.1 and $7.1, respectively |
420.2 | 394.1 | 420.2 | |||||||||
| Inventories |
702.8 | 741.5 | 702.8 | |||||||||
| Prepaid expenses and other current assets |
47.9 | 42.4 | 47.9 | |||||||||
|
|
|
|
|
|
|
|||||||
| Total current assets |
1,256.6 | 1,253.1 | 1,256.6 | |||||||||
| Property, plant, and equipment, at cost |
639.5 | 636.9 | 639.5 | |||||||||
| Less: Accumulated depreciation |
189.1 | 164.6 | 189.1 | |||||||||
|
|
|
|
|
|
|
|||||||
| Property, plant and equipment, net |
450.4 | 472.3 | 450.4 | |||||||||
| Deferred income taxes |
40.9 | 41.0 | 40.9 | |||||||||
| Other intangible assets |
52.7 | 57.4 | 52.7 | |||||||||
| Goodwill |
89.5 | 96.6 | 89.5 | |||||||||
| Deferred charges and other assets |
32.4 | 33.7 | 32.4 | |||||||||
|
|
|
|
|
|
|
|||||||
| Total assets |
$ | 1,922.5 | $ | 1,954.1 | $ | 1,922.5 | ||||||
|
|
|
|
|
|
|
|||||||
| Liabilities |
||||||||||||
| Current liabilities: |
||||||||||||
| Accounts payable |
$ | 240.0 | $ | 196.3 | $ | 240.0 | ||||||
| Salaries, wages and commissions |
33.9 | 32.1 | 33.9 | |||||||||
| Deferred income taxes |
131.4 | 123.5 | 131.4 | |||||||||
| Other accrued liabilities |
76.7 | 55.0 | 76.7 | |||||||||
| Short-term debt |
21.6 | 35.3 | 21.6 | |||||||||
| Current portion of deferred employee benefits |
14.1 | 14.2 | 14.1 | |||||||||
|
|
|
|
|
|
|
|||||||
| Total current liabilities |
517.7 | 456.4 | 517.7 | |||||||||
| Long-term debt |
1,218.5 | 1,270.1 | ||||||||||
| Deferred employee benefits |
455.8 | 504.4 | 455.8 | |||||||||
| Taxes and other credits |
16.1 | 15.4 | 16.1 | |||||||||
|
|
|
|
|
|
|
|||||||
| Total liabilities |
2,208.1 | 2,246.3 | ||||||||||
| Commitments and contingencies |
||||||||||||
| Redeemable noncontrolling interest |
1.3 | 1.7 | 1.3 | |||||||||
| Equity |
||||||||||||
| Ryerson Holding Corporation stockholders’ equity (deficit): |
||||||||||||
| Common stock, $0.01 par value; 10,000,000 shares authorized; 5,000,000 shares issued at 2013 and 2012 |
— | — | — | |||||||||
| Capital in excess of par value |
189.9 | 189.9 | 189.9 | |||||||||
| Accumulated deficit |
(225.3 | ) | (234.4 | ) | ||||||||
| Accumulated other comprehensive loss |
(253.5 | ) | (252.1 | ) | (253.5 | ) | ||||||
|
|
|
|
|
|
|
|||||||
| Total Ryerson Holding Corporation stockholders’ equity (deficit) |
(288.9 | ) | (296.6 | ) | ||||||||
| Noncontrolling interest |
2.0 | 2.7 | 2.0 | |||||||||
|
|
|
|
|
|
|
|||||||
| Total equity (deficit) |
(286.9 | ) | (293.9 | ) | ||||||||
|
|
|
|
|
|
|
|||||||
| Total liabilities and equity |
$ | 1,922.5 | $ | 1,954.1 | $ | 1,922.5 | ||||||
|
|
|
|
|
|
|
|||||||
See Notes to Condensed Consolidated Financial Statements.
F-50
Table of Contents
RYERSON HOLDING CORPORATION AND SUBSIDIARY COMPANIES
Notes to Condensed Consolidated Financial Statements (Unaudited)
NOTE 1: FINANCIAL STATEMENTS
Ryerson Holding Corporation (“Ryerson Holding”), a Delaware corporation, is the parent company of Ryerson Inc. (“Ryerson”). Ryerson Holding is 99% owned by affiliates of Platinum Equity, LLC (“Platinum”).
Ryerson conducts materials distribution operations in the United States through its wholly-owned direct subsidiary Joseph T. Ryerson & Son, Inc. (“JT Ryerson”), in Canada through its indirect wholly-owned subsidiary Ryerson Canada, Inc., a Canadian corporation (“Ryerson Canada”) and in Mexico through its indirect wholly-owned subsidiary Ryerson Metals de Mexico, S. de R.L. de C.V., a Mexican corporation (“Ryerson Mexico”). In addition to our North American operations, we conduct materials distribution operations in China through Ryerson China Limited (“Ryerson China”), a company in which we have a 100% ownership percentage and in Brazil through Açofran Aços e Metais Ltda (“Açofran”), a company in which we have a 50% direct ownership percentage since February 17, 2012. Unless the context indicates otherwise, Ryerson Holding, Ryerson, JT Ryerson, Ryerson Canada, Ryerson China, Ryerson Mexico and Açofran together with their subsidiaries, are collectively referred to herein as “we,” “us,” “our,” or the “Company.”
The following table shows our percentage of sales by major product lines for the three and nine months ended September 30, 2013 and 2012, respectively:
| Three Months Ended September 30, |
Nine Months Ended September 30, |
|||||||||||||||
| Product Line |
2013 | 2012 | 2013 | 2012 | ||||||||||||
| Carbon Steel Flat |
26 | % | 26 | % | 26 | % | 25 | % | ||||||||
| Carbon Steel Plate |
11 | 13 | 11 | 13 | ||||||||||||
| Carbon Steel Long |
15 | 14 | 15 | 15 | ||||||||||||
| Stainless Steel Flat |
16 | 15 | 16 | 15 | ||||||||||||
| Stainless Steel Plate |
4 | 4 | 4 | 4 | ||||||||||||
| Stainless Steel Long |
3 | 4 | 3 | 3 | ||||||||||||
| Aluminum Flat |
15 | 14 | 15 | 14 | ||||||||||||
| Aluminum Plate |
3 | 3 | 3 | 4 | ||||||||||||
| Aluminum Long |
4 | 4 | 4 | 4 | ||||||||||||
| Other |
3 | 3 | 3 | 3 | ||||||||||||
|
|
|
|
|
|
|
|
|
|||||||||
| Total |
100 | % | 100 | % | 100 | % | 100 | % | ||||||||
|
|
|
|
|
|
|
|
|
|||||||||
Results of operations for any interim period are not necessarily indicative of results of any other periods or for the year. The financial statements as of September 30, 2013 and for the three-month and nine-month periods ended September 30, 2013 and 2012 are unaudited, but in the opinion of management include all adjustments, consisting of normal recurring adjustments, necessary for a fair presentation of results for such periods. The year-end condensed consolidated balance sheet data contained in this report was derived from audited financial statements, but does not include all disclosures required by accounting principles generally accepted in the United States of America. These financial statements should be read in conjunction with the financial statements and related notes contained in the Company’s Annual Report for the year ended December 31, 2012.
NOTE 2: RECENT ACCOUNTING PRONOUNCEMENTS
In February 2013, the Financial Accounting Standards Board (“FASB”) issued Accounting Standards Update (“ASU”) 2013-2, “Reporting of Amounts Reclassified Out of Accumulated Other Comprehensive Income.” This guidance requires an entity to present, either on the face of the financial statements or as a disclosure in the notes, significant amounts reclassified out of accumulated other comprehensive income by the
F-51
Table of Contents
respective line items of net income, but only if the amount reclassified is required under GAAP to be reclassified to net income in its entirety in the same reporting period. For other amounts that are not required under GAAP to be reclassified in their entirety to net income, the guidance requires an entity to cross-reference to other disclosures required under GAAP that provide additional detail about those amounts. This guidance is effective for our fiscal year beginning January 1, 2013. We adopted this guidance for our fiscal year beginning January 1, 2013. The adoption did not have a material impact on our financial statements.
In July 2013, the FASB issued ASU 2013-11 “Presentation of an Unrecognized Tax Benefit When a Net Operating Loss Carryforward, a Similar Tax Loss, or a Tax Credit Carryforward Exists.” ASU 2013 -11 was issued to promote consistency among financial statement issuers and amends Accounting Standards Codification (“ASC”) 740, “Income Taxes,” to provide clarification of the financial statement presentation of an unrecognized tax benefit when a net operating loss carryforward, a similar tax loss, or a tax credit carryforward exists. According to ASU 2013-11, an unrecognized tax benefit or a portion of an unrecognized tax benefit should be presented in the financial statements as a reduction of a deferred tax asset for a net operating loss carryforward, a similar tax loss, or a tax credit carryforward, with certain exceptions. The revised guidance is effective for interim and annual periods beginning after December 15, 2013 with early adoption permitted. We will adopt this guidance on January 1, 2014. We do not expect the adoption to have a material impact on our financial statements.
NOTE 3: INVENTORIES
The Company primarily uses the last-in, first-out (LIFO) method of valuing inventory. Interim LIFO calculations are based on actual inventory levels.
Inventories, at stated LIFO value, were classified at September 30, 2013 and December 31, 2012 as follows:
| September 30, 2013 |
December 31, 2012 |
|||||||
| (In millions) | ||||||||
| In process and finished products |
$ | 702.8 | $ | 741.5 | ||||
If current cost had been used to value inventories, such inventories would have been $61 million and $34 million lower than reported at September 30, 2013 and December 31, 2012, respectively. Approximately 90% and 88% of inventories are accounted for under the LIFO method at September 30, 2013 and December 31, 2012, respectively. Non-LIFO inventories consist primarily of inventory at our foreign facilities using the weighted-average cost and the specific cost methods. Substantially all of our inventories consist of finished products.
The Company has consignment inventory at certain customer locations, which totaled $12.4 million and $11.3 million at September 30, 2013 and December 31, 2012, respectively.
NOTE 4: GOODWILL AND OTHER INTANGIBLE ASSETS
Goodwill, which represents the excess of cost over the fair value of net assets acquired, amounted to $89.5 million at September 30, 2013. Pursuant to ASC 350, “Intangibles—Goodwill and Other,” we review the recoverability of goodwill annually as of October 1 or whenever significant events or changes occur which might impair the recovery of recorded amounts. We performed an interim impairment test of goodwill as of June 30, 2013 for one reporting unit as a result of its financial performance for the first half of 2013 compared to its forecasted results. In the first step, the fair value of the reporting unit was compared to the carrying value. The fair value of the reporting unit was estimated using an average of a market approach and income approach as this combination is deemed to be the most indicative of our fair value in an orderly transaction between market participants and is consistent with the methodology used for the goodwill impairment test in the prior quarter. Based on this evaluation, it was determined that the fair value of the reporting unit was less than the carrying
F-52
Table of Contents
value. As required by ASC 350, the Company then performed an allocation of the fair value to all the assets and liabilities of the reporting unit, including identifiable intangible assets, based on their fair values, to determine the implied fair value of goodwill. Accordingly, the Company recorded a goodwill impairment charge of $6.8 million in the second quarter of 2013 for the difference between the carrying value of the goodwill in the reporting unit and its implied fair value. The remaining goodwill balance for this reporting unit is zero.
Other intangible assets with finite useful lives continue to be amortized over their useful lives. We review the recoverability of our long-lived assets whenever events or changes in circumstances indicate the carrying amount of such assets may not be recoverable.
NOTE 5: ACQUISITIONS
Açofran
On February 17, 2012, the Company acquired 50% of the issued and outstanding capital stock of Açofran, a long products distributor located in São Paulo, Brazil. The Company fully consolidates Açofran based on voting control. The Company is party to a put option arrangement with respect to the securities that represent the noncontrolling interest of Açofran. The put is exercisable by the minority shareholders outside of the Company’s control by requiring the Company to redeem the minority shareholders’ equity stake in the subsidiary at a put price based on earnings before interest, income tax, depreciation and amortization expense and net debt. The redeemable noncontrolling interest is classified as mezzanine equity and measured at the greater of estimated redemption value at the end of each reporting period or the historical cost basis of the noncontrolling interest adjusted for earnings and foreign currency allocations. The resulting increase or decrease in the estimated redemption amount is adjusted with a corresponding charge against retained earnings, or in the absence of retained earnings, additional paid-in-capital. The acquisition is not material to our consolidated financial statements.
NOTE 6: LONG-TERM DEBT
Long-term debt consisted of the following at September 30, 2013 and December 31, 2012:
| September 30, 2013 |
December 31, 2012 |
|||||||
| (In millions) | ||||||||
| Ryerson Secured Credit Facility |
$ | 318.5 | $ | 383.5 | ||||
| 9% Senior Secured Notes due 2017 |
600.0 | 600.0 | ||||||
| 11 1/4% Senior Notes due 2018 |
300.0 | 300.0 | ||||||
| Foreign debt |
21.6 | 21.9 | ||||||
|
|
|
|
|
|||||
| Total debt |
1,240.1 | 1,305.4 | ||||||
| Less: |
||||||||
| Short-term credit facility borrowings |
— | 13.5 | ||||||
| Short-term foreign debt |
21.6 | 21.8 | ||||||
|
|
|
|
|
|||||
| Total long-term debt |
$ | 1,218.5 | $ | 1,270.1 | ||||
|
|
|
|
|
|||||
Ryerson Credit Facility
On April 3, 2013, Ryerson amended and restated its $1.35 billion revolving credit facility agreement (as amended and restated, the “Ryerson Credit Facility”) to, among other things, extend the maturity date to the earlier of (a) April 3, 2018 and (b) August 16, 2017 (60 days prior to the scheduled maturity date of the 9% Senior Secured Notes due October 15, 2017 (“2017 Notes”)), if the 2017 Notes are then outstanding. At September 30, 2013, Ryerson had $318.5 million of outstanding borrowings, $24 million of letters of credit issued and $291 million available under the $1.35 billion Ryerson Credit Facility compared to $383.5 million of outstanding
F-53
Table of Contents
borrowings, $24 million of letters of credit issued and $293 million available at December 31, 2012. Total credit availability is limited by the amount of eligible accounts receivable and inventory pledged as collateral under the agreement insofar as Ryerson is subject to a borrowing base comprised of the aggregate of these two amounts, less applicable reserves. Eligible accounts receivable, at any date of determination, are comprised of the aggregate value of all accounts directly created by a borrower in the ordinary course of business arising out of the sale of goods or the rendition of services, each of which has been invoiced, with such receivables adjusted to exclude various ineligible accounts, including, among other things, those to which a borrower does not have sole and absolute title and accounts arising out of a sale to an employee, officer, director, or affiliate of a borrower. Eligible inventory, at any date of determination, is comprised of the aggregate value of all inventory owned by a borrower, with such inventory adjusted to exclude various ineligible inventory, including, among other things, any inventory that is classified as “supplies” or is unsaleable in the ordinary course of business and 50% of the value of any inventory that (i) has not been sold or processed within a 180 day period and (ii) is calculated to have more than 365 days of supply based upon the immediately preceding 6 months consumption. The weighted average interest rate on the borrowings under the Ryerson Credit Facility was 1.9 percent and 2.6 percent at September 30, 2013 and December 31, 2012, respectively.
The total $1.35 billion revolving credit facility has an allocation of $1.215 billion to Ryerson’s subsidiaries in the United States and an allocation of $135 million to Ryerson Canada. Amounts outstanding under the U.S. facility bear interest at a rate determined by reference to the base rate (Bank of America’s prime rate) or a LIBOR rate or, for the Canadian facility a rate determined by reference to the Canadian base rate (Bank of America-Canada Branch’s “Base Rate” for loans in U.S. Dollars in Canada) or the BA rate (average annual rate applicable to Canadian Dollar bankers’ acceptances) or a LIBOR rate and the Canadian prime rate (Bank of America-Canada Branch’s “Prime Rate.”). The spread over the base rate and Canadian prime rate is between 0.50% and 1.00% and the spread over the LIBOR and for the bankers’ acceptances is between 1.50% and 2.00%, depending on the amount available to be borrowed. Until December 31, 2013, the spread will be fixed at 0.75% over the base rate and Canadian prime rate and 1.75% over the LIBOR rate and bankers acceptance rate. Overdue amounts and all amounts owed during the existence of a default bear interest at 2% above the rate otherwise applicable thereto. The Company also pays commitment fees on amounts not borrowed at a rate between 0.25% and 0.375% depending on the average borrowings as a percentage of the total $1.35 billion agreement during a rolling three month period.
Borrowings under the Ryerson Credit Facility are secured by (i) in the case of the U.S. facility, first-priority liens on all of the inventory, accounts receivable, lockbox accounts (excluding any proceeds therein of collateral securing the 2017 and 2018 Notes on a first priority lien basis) and related U.S. assets of Ryerson, the U.S. subsidiary borrowers and certain other U.S. subsidiaries of Ryerson that act as guarantors, and (ii) in the case of the Canadian facility, the assets securing the U.S. Facility and also first priority liens on all of the inventory, accounts receivable, lockbox accounts and related assets of Ryerson’s Canadian subsidiary borrower and its Canadian subsidiaries that act as guarantors thereof.
The Ryerson Credit Facility contains covenants that, among other things, restrict Ryerson and its subsidiaries with respect to the incurrence of debt, the creation of liens, transactions with affiliates, mergers and consolidations, sales of assets and acquisitions. The Ryerson Credit Facility also requires that, if availability under such facility falls below a certain level, the Company maintain a minimum fixed charge coverage ratio as of the end of each calendar month.
The Ryerson Credit Facility contains events of default with respect to, among other things, default in the payment of principal when due or the payment of interest, fees and other amounts due thereunder after a specified grace period, material misrepresentations, failure to perform certain specified covenants, certain bankruptcy events, the invalidity of certain security agreements or guarantees, material judgments and the occurrence of a change of control of Ryerson. If such an event of default occurs, the lenders under the Ryerson Credit Facility will be entitled to various remedies, including acceleration of amounts outstanding under the Ryerson Credit Facility and all other actions permitted to be taken by secured creditors.
F-54
Table of Contents
The lenders under the Ryerson Credit Facility have the ability to reject a borrowing request if any event, circumstance or development has occurred that has had or could reasonably be expected to have a material adverse effect on Ryerson. If Ryerson or any significant subsidiaries of the other borrowers becomes insolvent or commences bankruptcy proceedings, all amounts borrowed under the Ryerson Credit Facility will become immediately due and payable.
Proceeds from borrowings under the Ryerson Credit Facility and repayments of borrowings thereunder that are reflected in the Consolidated Statements of Cash Flows represent borrowings under the Company’s revolving credit agreement with original maturities greater than three months. Net proceeds (repayments) under the Ryerson Credit Facility represent borrowings under the Ryerson Credit Facility with original maturities less than three months.
2017 and 2018 Notes
On October 10, 2012, Ryerson and its wholly owned subsidiary, Joseph T. Ryerson & Son, Inc., issued $600 million in aggregate principal amount of the 2017 Notes and $300 million in aggregate principal amount of the 11 1/4% Senior Notes due 2018 (the “2018 Notes” and, together with the 2017 Notes, the “2017 and 2018 Notes”). The 2017 Notes bear interest at a rate of 9% per annum. The 2018 Notes bear interest at a rate of 11.25% per annum. The 2017 Notes are fully and unconditionally guaranteed on a senior secured basis and the 2018 Notes are fully and unconditionally guaranteed on a senior unsecured basis by all of our existing and future domestic subsidiaries that are co-borrowers or guarantee obligations under the Ryerson Credit Facility.
The 2017 Notes and related guarantees are secured by a first-priority lien on substantially all of our and our guarantors’ present and future assets located in the United States (other than receivables, inventory, related general intangibles, certain other assets and proceeds thereof), subject to certain exceptions and customary permitted liens. The 2017 Notes and related guarantees are secured on a second-priority basis by a lien on the assets that secure our obligations under the Ryerson Credit Facility. The 2018 Notes are not secured. The 2017 and 2018 Notes contain customary covenants that, among other things, limit, subject to certain exceptions, our ability, and the ability of our restricted subsidiaries, to incur additional indebtedness, pay dividends on our capital stock or repurchase our capital stock, make investments, sell assets, engage in acquisitions, mergers or consolidations or create liens or use assets as security in other transactions. Subject to certain exceptions, Ryerson may only pay dividends to Ryerson Holding to the extent of 50% of future net income, once prior losses are offset.
The 2017 Notes will become redeemable by the Company, in whole or in part, at any time on or after April 15, 2015 and the 2018 Notes will become redeemable, in whole or in part, at any time on or after October 15, 2015, in each case at specified redemption prices. The 2017 and 2018 Notes are redeemable prior to such dates at a redemption price equal to 100% of the principal amount, together with accrued and unpaid interest, if any, to the redemption date, plus a make-whole premium. If a change of control occurs, Ryerson must offer to purchase the 2017 and 2018 Notes at 101% of their principal amount, plus accrued and unpaid interest.
Pursuant to registration rights agreements relating to the 2017 and 2018 Notes, we agreed to file with the SEC by July 7, 2013, registration statements with respect to offers to exchange each of the 2017 and 2018 Notes for new issues of our debt securities registered under the Securities Act, with terms substantially identical to those of the 2017 and 2018 Notes and to consummate such exchange offers no later than October 5, 2013. Ryerson completed the exchange offer on September 10, 2013. As a result of completing the exchange offer, Ryerson satisfied its obligation under the registration rights agreements covering each of the 2017 and 2018 Notes.
Foreign Debt
At September 30, 2013, Ryerson China’s total foreign borrowings were $21.6 million, which were owed to banks in Asia at a weighted average interest rate of 4.2% and secured by inventory and property, plant and
F-55
Table of Contents
equipment. At December 31, 2012, Ryerson China’s total foreign borrowings were $21.4 million, which were owed to banks in Asia at a weighted average interest rate of 4.8% and secured by inventory and property, plant and equipment. At September 30, 2013, Açofran had no foreign borrowings. At December 31, 2012, Açofran’s total foreign borrowings were $0.5 million, which were owed to foreign banks at a weighted average interest rate of 11.2%.
Availability under the foreign credit lines was $28 million and $21 million at September 30, 2013 and December 31, 2012, respectively. Letters of credit issued by our foreign subsidiaries totaled $9 million and $8 million at September 30, 2013 and December 31, 2012, respectively.
NOTE 7: EMPLOYEE BENEFITS
The following table summarizes the components of net periodic benefit cost for the three and nine month periods ended September 30, 2013 and 2012 for the Ryerson pension plans and postretirement benefits other than pension:
| Three Months Ended September 30, | ||||||||||||||||
| Pension Benefits | Other Benefits | |||||||||||||||
| 2013 | 2012 | 2013 | 2012 | |||||||||||||
| (In millions) | ||||||||||||||||
| Components of net periodic benefit cost |
||||||||||||||||
| Service cost |
$ | 1 | $ | 1 | $ | — | $ | 1 | ||||||||
| Interest cost |
9 | 11 | 1 | 1 | ||||||||||||
| Expected return on assets |
(11 | ) | (12 | ) | — | — | ||||||||||
| Recognized actuarial net (gain) loss |
3 | 3 | (2 | ) | (2 | ) | ||||||||||
|
|
|
|
|
|
|
|
|
|||||||||
| Net periodic benefit cost (credit) |
$ | 2 | $ | 3 | $ | (1 | ) | $ | — | |||||||
|
|
|
|
|
|
|
|
|
|||||||||
| Nine Months Ended September 30, | ||||||||||||||||
| Pension Benefits | Other Benefits | |||||||||||||||
| 2013 | 2012 | 2013 | 2012 | |||||||||||||
| (In millions) | ||||||||||||||||
| Components of net periodic benefit cost |
||||||||||||||||
| Service cost |
$ | 2 | $ | 2 | $ | — | $ | 1 | ||||||||
| Interest cost |
27 | 31 | 3 | 5 | ||||||||||||
| Expected return on assets |
(33 | ) | (34 | ) | — | — | ||||||||||
| Prior service credit |
— | — | (1 | ) | — | |||||||||||
| Recognized actuarial net (gain) loss |
10 | 9 | (5 | ) | (6 | ) | ||||||||||
|
|
|
|
|
|
|
|
|
|||||||||
| Net periodic benefit cost (credit) |
$ | 6 | $ | 8 | $ | (3 | ) | $ | — | |||||||
|
|
|
|
|
|
|
|
|
|||||||||
Contributions
The Company has contributed $37.3 million to the pension plan fund through the nine months ended September 30, 2013 and anticipates that it will have a minimum required pension contribution funding of approximately $11 million for the remaining three months of 2013.
NOTE 8: COMMITMENTS AND CONTINGENCIES
From time to time, we are named as a defendant in legal actions incidental to our ordinary course of business. We do not believe that the resolution of these claims will have a material adverse effect on our financial position, results of operations or cash flows. We maintain liability insurance coverage to assist in protecting our assets from losses arising from or related to activities associated with business operations.
F-56
Table of Contents
On December 27, 2011, Nancy Hoffman, Mark Hoffman, and Karen Hoffman (collectively, the “plaintiffs”) filed a sixth amended complaint in the Circuit Court of Cook County, Illinois naming JT Ryerson and three other entities as defendants (collectively, the “defendants”) in a lawsuit (Nancy Hoffman, et.al. v. Dorlan Crane, et.al.). That complaint asserted negligence and loss of consortium counts against the defendants for personal injuries allegedly suffered by plaintiffs resulting from a motor vehicle accident. On February 10, 2012, a jury returned a verdict against the defendants and awarded damages totaling $27.7 million for which the defendants are purportedly jointly and severally liable. On August 28, 2012, our post-trial motion was denied. On September 24, 2012, we filed our Notice of Appeal to the Appellate Court of Illinois, First Judicial District. Any potential loss ranges from zero to $27.7 million plus interest. We believe that any loss will be covered by insurance. At this time, the Company cannot predict the likely outcome of this matter.
In October 2011, the United States Environmental Protection Agency named us as one of more than 100 businesses that may be a potentially responsible party for the Portland Harbor Superfund Site (“Portland Harbor”). We do not currently have sufficient information available to us to determine the total cost of any required investigation or remediation of the Portland Harbor site. Management cannot predict the ultimate outcome of this matter or estimate a range of potential loss at this time.
NOTE 9: DERIVATIVES AND FAIR VALUE MEASUREMENTS
Derivatives
The Company is exposed to certain risks relating to its ongoing business operations. The primary risks managed by using derivative instruments are interest rate risk, foreign currency risk, and commodity price risk. Interest rate swaps are entered into to manage interest rate risk associated with the Company’s floating-rate borrowings. We use foreign currency exchange contracts to hedge our Canadian subsidiaries’ variability in cash flows from the forecasted payment of currencies other than the functional currency. From time to time, we may enter into fixed price sales contracts with our customers for certain of our inventory components. We may enter into metal commodity futures and options contracts periodically to reduce volatility in the price of metals. We may also enter into natural gas price swaps to manage the price risk of forecasted purchases of natural gas. The Company currently does not account for its derivative contracts as hedges but rather marks them to market with a corresponding offset to current earnings. The Company regularly reviews the creditworthiness of its derivative counterparties and does not expect to incur a significant loss from the failure of any counterparties to perform under any agreements.
The following table summarizes the location and fair value amount of our derivative instruments reported in our Consolidated Balance Sheets as of September 30, 2013 and December 31, 2012:
| Asset Derivatives | Liability Derivatives | |||||||||||||||||||||||
| September 30, 2013 | December 31, 2012 | September 30, 2013 | December 31, 2012 | |||||||||||||||||||||
| Balance Sheet Location |
Fair Value | Balance Sheet Location |
Fair Value | Balance Sheet Location |
Fair Value | Balance Sheet Location |
Fair Value | |||||||||||||||||
| (In millions) | ||||||||||||||||||||||||
| Derivatives not designated as hedging instruments under ASC 815 |
||||||||||||||||||||||||
| Commodity contracts |
Prepaid expenses and other current assets |
$ | — | Prepaid expenses and other current assets |
$ | 0.2 | Other accrued liabilities |
$ | 0.3 | Other accrued liabilities |
$ | — | ||||||||||||
|
|
|
|
|
|
|
|
|
|||||||||||||||||
| Total derivatives |
$ | — | $ | 0.2 | $ | 0.3 | $ | — | ||||||||||||||||
|
|
|
|
|
|
|
|
|
|||||||||||||||||
F-57
Table of Contents
As of September 30, 2013 and December 31, 2012, the Company’s foreign currency exchange contracts had a U.S. dollar notional amount of $1.7 million and $0.7 million, respectively. As of September 30, 2013 and December 31, 2012, the Company had 173 tons and 182 tons, respectively, of nickel futures or option contracts related to forecasted purchases. The Company had 1,300 tons of hot roll steel coil option contracts related to forecasted purchases as of September 30, 2013 and December 31, 2012. The Company has aluminum price swaps related to forecasted purchases, which had a notional amount of 50 tons and 80 tons as of September 30, 2013 and December 31, 2012, respectively.
The following table summarizes the location and amount of gains and losses reported in our Consolidated Statements of Comprehensive Income for the three and nine months ended September 30, 2013 and 2012:
| Derivatives not designated as hedging instruments under ASC 815 |
Location of Gain/(Loss) Recognized in Income on Derivatives |
Amount of
Gain/(Loss) Recognized in Income on Derivatives |
||||||||||||||||
| Three Months
Ended September 30, |
Nine Months
Ended September 30, |
|||||||||||||||||
| 2013 | 2012 | 2013 | 2012 | |||||||||||||||
| (In millions) | ||||||||||||||||||
| Foreign exchange contracts |
Other income and (expense), net |
$ | — | $ | (0.1 | ) | $ | — | $ | — | ||||||||
| Metal commodity contracts |
Cost of materials sold |
0.2 | 1.4 | (0.5 | ) | 1.3 | ||||||||||||
|
|
|
|
|
|
|
|
|
|||||||||||
| Total |
$ | 0.2 | $ | 1.3 | $ | (0.5 | ) | $ | 1.3 | |||||||||
|
|
|
|
|
|
|
|
|
|||||||||||
Fair Value Measurements
To increase consistency and comparability in fair value measurements, ASC 820 establishes a fair value hierarchy that prioritizes the inputs to valuation techniques used to measure fair value into three levels as follows:
| 1. | Level 1—quoted prices (unadjusted) in active markets for identical assets or liabilities that the Company has the ability to access as of the reporting date. |
| 2. | Level 2—inputs other than quoted prices included within Level 1 that are directly observable for the asset or liability or indirectly observable through corroboration with observable market data. |
| 3. | Level 3—unobservable inputs, such as internally-developed pricing models for the asset or liability due to little or no market activity for the asset or liability. |
The following table presents assets and liabilities measured and recorded at fair value on our Consolidated Balance Sheets on a recurring basis and their level within the fair value hierarchy as of September 30, 2013:
| At September 30, 2013 | ||||||||||||
| Level 1 | Level 2 | Level 3 | ||||||||||
| (In millions) | ||||||||||||
| Assets |
||||||||||||
| Cash equivalents: |
||||||||||||
| Commercial paper |
$ | 40.6 | $ | — | $ | — | ||||||
|
|
|
|
|
|
|
|||||||
| Prepaid and other current assets: |
||||||||||||
| Common stock—available-for-sale investment |
$ | 22.5 | $ | — | $ | — | ||||||
|
|
|
|
|
|
|
|||||||
| Liabilities |
||||||||||||
| Mark-to-market derivatives: |
||||||||||||
| Commodity contracts |
$ | — | $ | 0.3 | $ | — | ||||||
|
|
|
|
|
|
|
|||||||
F-58
Table of Contents
The following table presents assets and liabilities measured and recorded at fair value on our Consolidated Balance Sheets on a recurring basis and their level within the fair value hierarchy as of December 31, 2012:
| At December 31, 2012 | ||||||||||||
| Level 1 | Level 2 | Level 3 | ||||||||||
| (In millions) | ||||||||||||
| Assets |
||||||||||||
| Cash equivalents: |
||||||||||||
| Commercial paper |
$ | 28.3 | $ | — | $ | — | ||||||
|
|
|
|
|
|
|
|||||||
| Prepaid and other current assets: |
||||||||||||
| Common stock—available-for-sale investment |
$ | 20.7 | $ | — | $ | — | ||||||
|
|
|
|
|
|
|
|||||||
| Mark-to-market derivatives: |
||||||||||||
| Commodity contracts |
$ | — | $ | 0.2 | $ | — | ||||||
|
|
|
|
|
|
|
|||||||
The fair value of each derivative contract is determined using Level 2 inputs and the market approach valuation technique, as described in ASC 820. The Company has various commodity derivatives to lock in nickel prices for varying time periods. The fair value of these derivatives is determined based on the spot price each individual contract was purchased at and compared with the one-month daily average actual spot price on the London Metals Exchange for nickel on the valuation date. The Company also has commodity derivatives to lock in hot roll coil and aluminum prices for varying time periods. The fair value of these derivatives is determined based on the spot price each individual contract was purchased at and compared with the one-month daily average actual spot price on the New York Mercantile Exchange for the commodity on the valuation date. In addition, the Company has numerous foreign exchange contracts to hedge our Canadian subsidiaries’ variability in cash flows from the forecasted payment of currencies other than the functional currency, the Canadian dollar. The Company defines the fair value of foreign exchange contracts as the amount of the difference between the contracted and current market value at the end of the period. The Company estimates the current market value of foreign exchange contracts by obtaining month-end market quotes of foreign exchange rates and forward rates for contracts with similar terms. The Company uses the exchange rates provided by Reuters. Each contract term varies in the number of months, but on average is between 3 to 12 months in length.
The carrying and estimated fair values of the Company’s financial instruments at September 30, 2013 and December 31, 2012 were as follows:
| At September 30, 2013 | At December 31, 2012 | |||||||||||||||
| Carrying Amount |
Fair Value | Carrying Amount |
Fair Value | |||||||||||||
| (In millions) | ||||||||||||||||
| Cash and cash equivalents |
$ | 81.1 | $ | 81.1 | $ | 71.2 | $ | 71.2 | ||||||||
| Restricted cash |
4.6 | 4.6 | 3.9 | 3.9 | ||||||||||||
| Receivables less provision for allowances, claims and doubtful accounts |
420.2 | 420.2 | 394.1 | 394.1 | ||||||||||||
| Accounts payable |
240.0 | 240.0 | 196.3 | 196.3 | ||||||||||||
| Long-term debt, including current portion |
1,240.1 | 1,275.3 | 1,305.4 | 1,296.4 | ||||||||||||
The estimated fair value of the Company’s cash and cash equivalents, receivables less provision for allowances, claims and doubtful accounts and accounts payable approximate their carrying amounts due to the short-term nature of these financial instruments. The estimated fair value of the Company’s long-term debt and the current portions thereof is determined by using quoted market prices of Company debt securities (Level 2 inputs).
F-59
Table of Contents
Assets Held for Sale
The Company had $4.5 million and $3.6 million of assets held for sale, classified within “prepaid expenses and other current assets,” as of September 30, 2013 and December 31, 2012, respectively. The Company recorded $2.0 million and $0.9 million of impairment charges in the nine months ended September 30, 2013 and 2012, respectively, related to certain assets held for sale in order to recognize the assets at their fair value less cost to sell in accordance with ASC 360-10-35-43, “Property, Plant and Equipment—Other Presentation Matters.” The fair values less costs to sell of long-lived assets held for sale are assessed each reporting period that they remain classified as held for sale. Any increase or decrease in the held for sale long-lived asset’s fair value less cost to sell is reported as an adjustment to its carrying amount, except that the adjusted carrying amount cannot exceed the carrying amount of the long-lived asset at the time it was initially classified as held for sale. The fair values of each property were determined based on appraisals obtained from a third-party, pending sales contracts, or recent listing agreements with third-party brokerage firms.
The following table presents those assets that were measured and recorded at fair value on our Consolidated Balance Sheets on a non-recurring basis and their level within the fair value hierarchy at September 30, 2013:
| September 30, 2013 | ||||||||||||
| Level 1 | Level 2 | Level 3 | ||||||||||
| (In millions) | ||||||||||||
| Assets |
||||||||||||
| Prepaid expenses and other current assets—assets held for sale |
$ | — | $ | 4.5 | $ | — | ||||||
The following table presents those assets that were measured and recorded at fair value on our Consolidated Balance Sheets on a non-recurring basis and their level within the fair value hierarchy at December 31, 2012:
| At December 31, 2012 | ||||||||||||
| Level 1 | Level 2 | Level 3 | ||||||||||
| (In millions) | ||||||||||||
| Assets |
||||||||||||
| Prepaid expenses and other current assets—assets held for sale |
$ | — | $ | 3.6 | $ | — | ||||||
Available-For-Sale Investments
The Company has classified investments made during 2010 and 2012 as available-for-sale at the time of their purchase. Investments classified as available-for-sale are recorded at fair value with the related unrealized gains and losses included in accumulated other comprehensive income. Management evaluates investments in an unrealized loss position on whether an other-than-temporary impairment has occurred on a periodic basis. Factors considered by management in assessing whether an other-than-temporary impairment has occurred include: the nature of the investment; whether the decline in fair value is attributable to specific adverse conditions affecting the investment; the financial condition of the investee; the severity and the duration of the impairment; and whether we intend to sell the investment or will be required to sell the investment before recovery of its amortized cost basis. When it is determined that an other-than-temporary impairment has occurred, the investment is written down to its fair value at the end of the period in which it is determined that an other-than-temporary decline has occurred. As of September 30, 2013, the investment was in a gross unrealized gain position. Realized gains and losses are recorded within the statement of operations upon sale of the security and are based on specific identification.
The Company’s available-for-sale securities as of September 30, 2013 can be summarized as follows:
| At September 30, 2013 | ||||||||||||||||
| Cost | Gross Unrealized Gains |
Gross Unrealized Losses |
Fair Value | |||||||||||||
| (In millions) | ||||||||||||||||
| Common stock |
$ | 17.4 | $ | 5.1 | $ | — | $ | 22.5 | ||||||||
F-60
Table of Contents
The Company’s available-for-sale securities as of December 31, 2012 can be summarized as follows:
| At December 31, 2012 | ||||||||||||||||
| Cost | Gross Unrealized Gains |
Gross Unrealized Losses |
Fair Value | |||||||||||||
| (In millions) | ||||||||||||||||
| Common stock |
$ | 17.4 | $ | 3.3 | $ | — | $ | 20.7 | ||||||||
There is no maturity date for these investments and there have been no sales during the nine months ended September 30, 2013.
NOTE 10: STOCKHOLDERS’ EQUITY (DEFICIT), ACCUMULATED OTHER COMPREHENSIVE INCOME AND REDEEMABLE NONCONTROLLING INTEREST
The following table details changes in these accounts:
| Ryerson Holding Corporation Stockholders | Noncontrolling Interest |
Total Equity |
Redeemable Noncontrolling Interest |
|||||||||||||||||||||||||||||||||||||
| Capital in Excess of Par Value |
Accumulated Deficit |
Accumulated Other Comprehensive Income (Loss) |
||||||||||||||||||||||||||||||||||||||
| Common Stock |
Foreign Currency Translation |
Benefit Plan Liabilities |
Unrealized Gain on Available- For-Sale Investments |
|||||||||||||||||||||||||||||||||||||
| Shares | Dollars | Dollars | Dollars | Dollars | Dollars | Dollars | Dollars | Dollars | Dollars | |||||||||||||||||||||||||||||||
| (In millions, except shares in thousands) | ||||||||||||||||||||||||||||||||||||||||
| Balance at January 1, 2013 |
5,000 | $ | — | $ | 189.9 | $ | (234.4 | ) | $ | (3.8 | ) | $ | (251.6 | ) | $ | 3.3 | $ | 2.7 | $ | (293.9 | ) | $ | 1.7 | |||||||||||||||||
| Net income (loss) |
— | — | — | 9.1 | — | — | — | (0.8 | ) | 8.3 | (0.1 | ) | ||||||||||||||||||||||||||||
| Foreign currency translation |
— | — | — | — | (6.7 | ) | — | — | 0.1 | (6.6 | ) | (0.3 | ) | |||||||||||||||||||||||||||
| Changes in defined benefit pension and other post-retirement benefit plans (net of tax provision of $0.4) |
— | — | — | — | — | 3.5 | — | — | 3.5 | — | ||||||||||||||||||||||||||||||
| Unrealized gain on available-for-sale investment |
— | — | — | — | — | — | 1.8 | — | 1.8 | — | ||||||||||||||||||||||||||||||
|
|
|
|
|
|
|
|
|
|
|
|
|
|
|
|
|
|
|
|
|
|||||||||||||||||||||
| Balance at September 30, 2013 |
5,000 | $ | — | $ | 189.9 | $ | (225.3 | ) | $ | (10.5 | ) | $ | (248.1 | ) | $ | 5.1 | $ | 2.0 | $ | (286.9 | ) | $ | 1.3 | |||||||||||||||||
|
|
|
|
|
|
|
|
|
|
|
|
|
|
|
|
|
|
|
|
|
|||||||||||||||||||||
F-61
Table of Contents
The following table details the changes in accumulated other comprehensive income (loss) for the nine months ended September 30, 2013:
| Changes in Accumulated Other Comprehensive Income (Loss) by Component |
||||||||||||
| Foreign Currency Translation |
Benefit Plan Liabilities |
Unrealized Gain on Available- For-Sale Investments |
||||||||||
| (In millions) | ||||||||||||
| Balance at January 1, 2013 |
$ | (3.8 | ) | $ | (251.6 | ) | $ | 3.3 | ||||
| Other comprehensive income (loss) before reclassifications |
(6.7 | ) | — | 1.8 | ||||||||
| Amounts reclassified from accumulated other comprehensive income |
— | 3.5 | — | |||||||||
|
|
|
|
|
|
|
|||||||
| Net current-period other comprehensive income (loss) |
(6.7 | ) | 3.5 | 1.8 | ||||||||
|
|
|
|
|
|
|
|||||||
| Balance at September 30, 2013 |
$ | (10.5 | ) | $ | (248.1 | ) | $ | 5.1 | ||||
|
|
|
|
|
|
|
|||||||
The following table details the reclassifications out of accumulated other comprehensive income (loss) for the three and nine month periods ended September 30, 2013:
| Reclassifications Out of Accumulated Other Comprehensive Income (Loss) | ||||||||||
| Details about Accumulated Other Comprehensive |
Amount reclassified from Accumulated Other Comprehensive Income (Loss) |
Affected line item in the Condensed Consolidated Statements of Comprehensive Income | ||||||||
| Three Months Ended |
Nine Months Ended |
|||||||||
| September 30, 2013 | ||||||||||
| (In millions) | ||||||||||
| Amortization of defined benefit pension and other post-retirement benefit plan items |
||||||||||
| Actuarial gain |
$ | 1.6 | $ | 4.9 | Warehousing, delivery, selling, general and administrative | |||||
| Prior service credits |
(0.3 | ) | (1.0 | ) | Warehousing, delivery, selling, general and administrative | |||||
|
|
|
|
|
|||||||
| Total before tax |
1.3 | 3.9 | ||||||||
| Tax provision |
0.1 | 0.4 | ||||||||
|
|
|
|
|
|||||||
| Net of tax |
$ | 1.2 | $ | 3.5 | ||||||
|
|
|
|
|
|||||||
NOTE 11: RELATED PARTIES
JT Ryerson pays an affiliate of Platinum an annual monitoring fee of up to $5.0 million pursuant to a corporate advisory services agreement. The monitoring fee recorded in the first nine months of 2013 and 2012 was $3.8 million.
NOTE 12: INCOME TAXES
For the three months ended September 30, 2013, the Company recorded income tax expense from operations of $2.8 million compared to $2.6 million in the prior year. The $2.8 million tax expense in the third quarter of 2013 primarily represents foreign and U.S. state income tax expense for the period and adjustments related to our tax LIFO inventory method. Due to existing U.S. federal tax loss carry forwards and a valuation
F-62
Table of Contents
allowance on related deferred tax assets, no U.S. federal income tax expense on earnings was recorded in the quarter.
For the nine months ended September 30, 2013, the Company recorded income tax expense of $5.9 million compared to $9.6 million in the prior year. The $5.9 million tax expense in the first nine months of 2013 primarily represents foreign and U.S. state income tax expense for the period and adjustments related to our tax LIFO inventory method.
In accordance with FASB ASC 740, “Income Taxes,” the Company assesses the realizability of its deferred tax assets. The Company records a valuation allowance when, based upon the evaluation of all available evidence, it is more-likely-than-not that all or a portion of the deferred tax assets will not be realized. In making this determination, we analyze, among other things, our recent history of earnings, the nature and timing of reversing book-tax temporary differences, tax planning strategies and future income. After considering both the positive and negative evidence available, in the second quarter of 2009, the Company determined that it was more-likely-than-not that it would not realize a portion of its U.S. deferred tax assets. As a result, the Company established a valuation allowance against a portion of its U.S. deferred tax assets. The Company has maintained a valuation allowance against a portion of its U.S. deferred tax assets since that time. The valuation allowance is reviewed quarterly and will be maintained until sufficient positive evidence exists to support the reversal of some or all of the valuation allowance. The valuation allowance was $134.5 million and $147.3 million at September 30, 2013 and December 31, 2012, respectively.
NOTE 13: EARNINGS PER SHARE
On July 16, 2007, Ryerson Holding was capitalized with 5,000,000 shares of common stock by Platinum Equity, LLC. All shares outstanding are common shares and have equal voting, liquidation and preference rights.
Basic earnings per share (“EPS”) attributable to Ryerson Holding’s common stock is determined based on earnings for the period divided by the weighted average number of common shares outstanding during the period. Diluted EPS attributable to Ryerson Holding’s common stock considers the effect of potential common shares, unless inclusion of the potential common shares would have an antidilutive effect. Subsequent to October 19, 2007, Ryerson Holding does not have any securities or other items that are convertible into common shares, therefore basic and fully diluted EPS are the same.
The following table sets forth the calculation of basic and diluted earnings per share:
| Three Months Ended September 30, |
Nine Months Ended September 30, |
|||||||||||||||
| Basic and diluted earnings per share |
2013 | 2012 | 2013 | 2012 | ||||||||||||
| (In millions, except per share data) | ||||||||||||||||
| Net income available to common stockholders |
$ | 3.0 | $ | 16.4 | $ | 9.1 | $ | 57.0 | ||||||||
|
|
|
|
|
|
|
|
|
|||||||||
| Average shares of common stock outstanding |
5.0 | 5.0 | 5.0 | 5.0 | ||||||||||||
|
|
|
|
|
|
|
|
|
|||||||||
| Basic and diluted earnings per share |
$ | 0.59 | $ | 3.29 | $ | 1.82 | $ | 11.41 | ||||||||
|
|
|
|
|
|
|
|
|
|||||||||
NOTE 14: SUBSEQUENT EVENTS
JT Ryerson, one of our subsidiaries, is party to a corporate advisory services agreement with Platinum Advisors, an affiliate of Platinum, pursuant to which Platinum Advisors provides JT Ryerson certain business, management, administrative and financial advice. On , JT Ryerson’s Board of Directors approved the termination of this services agreement contingent on the closing of the initial public offering. As consideration for terminating the monitoring fee payable thereunder, JT Ryerson will pay Platinum Advisors $ million. The Company will recognize the termination fee within Warehousing, delivery, selling, general and administrative expense upon the closing of the initial public offering. The unaudited pro forma balance sheet
F-63
Table of Contents
presents the effect of funding the termination payment to the principal stockholder. The unaudited pro forma balance sheet is presented for informational purposes only in accordance with Staff Accounting Bulletin Topic 1.B.3.
Ryerson Holding and Platinum are party to an investor rights agreement and have agreed to enter into the Investor Rights Agreement upon the consummation of this offering that will provide for, among other things, demand, piggyback and Form S-3 registration rights and board nomination rights.
The Investor Rights Agreement will provide that Platinum may make written demands of us to require us to register the shares of our common stock owned by Platinum; provided, however that we will not be obligated to effect more than two such demand registrations. In addition, Platinum will have piggyback registration rights entitling them to require us to register shares of our common stock owned by them in connection with any registration statements filed by us after the completion of this offering, subject to certain exceptions. Upon the closing of this offering, we have agreed to use commercially reasonable efforts to qualify for registration on Form S-3 for secondary sales. After we have qualified for the use of Form S-3, Platinum will, subject to certain exceptions, have the right to request an unlimited number of registrations on Form S-3. We will not be obligated to effect a registration unless certain pricing or timing conditions are first satisfied.
The Investor Rights Agreement provides that we will indemnify Platinum against losses suffered by it in connection with any untrue or alleged untrue statement of a material fact contained in any prospectus, offering circular, or other document delivered or made available to investors (or in any related registration statement or any amendment or supplement thereto) or any omission or alleged omission to state therein a material fact required to be stated therein or necessary to make the statement therein not misleading, except insofar as the same may be caused by or contained in any information furnished in writing to us by Platinum for use therein.
The Investor Rights Agreement will provide that for so long as Platinum collectively beneficially owns at least (i) 30% of the voting power of the outstanding capital stock of the Company, Platinum will have the right to nominate for election to the board of directors of the Company no fewer than that number of directors that would
constitute a majority of the number of directors if there were no vacancies on the board, (ii) at least 15% but less than 30% of the voting power of the outstanding capital stock of the Company, Platinum will have the right to nominate two directors and (iii) at least 5% but less than 15% of the voting power of the outstanding capital stock of the Company, Platinum will have the right to nominate one director. The agreement will also provide that if the size of the board of directors is increased or decreased at any time, Platinum’s nomination rights will be proportionately increased or decreased, respectively, rounded up to the nearest whole number, except that if the board of directors increases its size within 180 days of the date of the agreement, Platinum will have the right to designate director nominees to fill each newly created directorship.
The Investor Rights Agreement was negotiated among management and Platinum, and we believe the Investor Rights Agreement is on arm’s-length terms.
On , our Board of Directors approved a for 1.00 stock split of the Company’s common stock to be effected prior to the closing of this offering. Per share and share amounts presented herein have been adjusted for all periods presented to give retroactive effect to the for 1.00 stock split.
F-64
Table of Contents
|
|
|


|

|

| ||
|
|
| |


|

|

|

| |||
Table of Contents
Until , 2013 (25 days after the date of this prospectus), all dealers that buy, sell or trade our common stock, whether or not participating in this offering, may be required to deliver a prospectus. This is in addition to the dealers’ obligation to deliver a prospectus when acting as underwriters and with respect to their unsold allotments or subscriptions.
Shares
Ryerson Holding Corporation
Common Stock
P R O S P E C T U S
BofA Merrill Lynch
Deutsche Bank Securities
BMO Capital Markets
J.P. Morgan
Jefferies
Wells Fargo Securities
KeyBanc Capital Markets
Citigroup
Macquarie Capital
, 2013
Table of Contents
PART II
INFORMATION NOT REQUIRED IN PROSPECTUS
| Item 13. | Other Expenses of Issuance and Distribution. |
The following table sets forth the costs and expenses, other than the underwriting discounts and commissions, payable by Ryerson Holding Corporation (“Ryerson Holding”) in connection with the sale of common stock being registered. All amounts shown are estimates, except the SEC registration fee, the FINRA filing fee and the NYSE application fee.
| Item |
Amount to be Paid | |||
| SEC Registration Fee |
$ | 56,548 | ||
| FINRA Filing Fee |
49,206 | |||
| NYSE Fee |
250,000 | |||
| Legal and Accounting Fees and Expenses |
2,350,000 | |||
| Printing Expenses |
310,000 | |||
| Transfer Agent and Registrar Fees |
3,500 | |||
| Directors’ and Officers’ Liability Insurance Premium |
900,000 | |||
| Miscellaneous |
80,746 | |||
|
|
|
|||
| Total |
$ | 4,000,000 | ||
|
|
|
|||
| Item 14. | Indemnification of Directors and Officers. |
Our amended and restated certificate of incorporation will limit our directors’ and officers’ liability to the fullest extent permitted under Delaware corporate law. Specifically, our directors and officers will not be liable to us or our stockholders for monetary damages for any breach of fiduciary duty by a director or officer, except for liability:
| • | for any breach of the director’s or officer’s duty of loyalty to us or our stockholders; |
| • | for acts or omissions not in good faith or which involve intentional misconduct or a knowing violation of law; |
| • | under Section 174 of the Delaware General Corporation Law; or |
| • | for any transaction from which a director or officer derives an improper personal benefit. |
If the Delaware General Corporation Law is amended to authorize corporate action further eliminating or limiting the personal liability of directors or officers, then the liability of our directors and officers shall be eliminated or limited to the fullest extent permitted by the Delaware General Corporation Law, as so amended.
The provision regarding indemnification of our directors and officers in our amended and restated certificate of incorporation will generally not limit liability under state or federal securities laws.
Delaware law and our amended and restated certificate of incorporation provide that we will, in certain situations, indemnify any person made or threatened to be made a party to a proceeding by reason of that person’s former or present official capacity with our company against judgments, penalties, fines, settlements and reasonable expenses including reasonable attorney’s fees. Any person is also entitled, subject to certain limitations, to payment or reimbursement of reasonable expenses in advance of the final disposition of the proceeding. In addition, certain employment agreements to which we are a party provide for the indemnification of our employees who are party thereto.
We also maintain a directors’ and officers’ insurance policy pursuant to which our directors and officers are insured against liability for actions taken in their capacities as directors and officers.
II-1
Table of Contents
| Item 15. | Recent Sales of Unregistered Securities. |
On January 29, 2010, Ryerson Holding completed an offering of $483 million aggregate principal amount at maturity of 14 1/2% Senior Discount Notes due 2015 to qualified institutional buyers in reliance on Rule 144A under the Securities Act of 1933, as amended. Banc of America Securities LLC and UBS Securities LLC were the Joint Book-Running Managers in connection with the sale of the notes. Ryerson Holding received net proceeds from the offering in the amount of approximately $215 million and the initial purchasers’ discount was 2.25% of the gross proceeds received by Ryerson Holding from the sale of the notes. Pursuant to a registration rights agreement, Ryerson Holding agreed to file with the SEC by October 26, 2010, a registration statement with respect to an offer to exchange each of the Ryerson Holding Notes for a new issue of Ryerson Holding’s debt securities registered under the Securities Act, with terms substantially identical to those of the Ryerson Holding Notes and to consummate an exchange offer no later than February 23, 2011. Ryerson Holding completed the exchange offer on December 7, 2010. As a result of completing the exchange offer, Ryerson Holding satisfied its obligations under the registration rights agreement covering the Ryerson Holding Notes.
On October 10, 2012 Ryerson Inc. and JT Ryerson (the “Co-issuers”) completed offerings of (i) $600 million aggregate principal amount at maturity of 9% senior secured notes due 2017 (the “2017 Notes”) and (ii) $300 million aggregate principal amount at maturity of 11.25% senior notes due 2018 (the “2018 Notes”) to qualified institutional buyers in reliance on Rule 144A under the Securities Act of 1933, as amended. Merrill Lynch, Pierce, Fenner & Smith Incorporated, J.P. Morgan Securities LLC, BMO Capital Markets Corp., Jefferies LLC, UBS Securities LLC and Wells Fargo Securities, LLC were the Joint Book-Running Managers in connection with the sale of the 2017 Notes and 2018 Notes. KeyBanc Capital Markets Inc., Macquarie Capital (USA) Inc., PNC Capital Markets LLC and Stephens Inc acted as co-managers in connection with the sale of the 2017 Notes and 2018 Notes. The Co-issuers received net proceeds from the offerings in the amount of $900 million. No initial purchasers’ discount was paid in connection with the issuance of the 2017 Notes and 2018 Notes.
Pursuant to registration rights agreements with respect to the 2017 Notes and 2018 Notes, the Co-issuers agreed to file with the SEC by July 7, 2013, a registration statement with respect to an offer to exchange each of the 2017 Notes and 2018 Notes for a new issue of debt securities registered under the Securities Act, with terms substantially identical to those of the 2017 Notes and 2018 Notes, respectively, and to consummate an exchange offer no later than October 5, 2013. As of the date of this registration statement, an exchange offer with respect to the 2017 Notes and 2018 Notes has not occurred.
| Item 16. | Exhibits and Financial Statement Schedules. |
| (a) | Exhibits |
See Exhibit Index attached to this registration statement, which is incorporated by reference herein.
| (b) | Financial Statement Schedules |
See the following attached Financial Statement Schedules:
(1) Schedule I—Condensed financial information of Ryerson Holding Corporation (F-44); and
(2) Schedule II—Valuation and qualifying accounts (page F-49)
All other schedules are omitted since the required information is not present or is not present in amounts sufficient to require submission of the schedules.
| Item 17. | Undertakings. |
(a) The undersigned registrant hereby undertakes to provide to the underwriters at the closing specified in the underwriting agreement certificates in such denominations and registered in such names as required by the underwriters to permit prompt delivery to each purchaser.
II-2
Table of Contents
(b) Insofar as indemnification for liabilities arising under the Securities Act of 1933 may be permitted to directors, officers and controlling persons of the registrant pursuant to our amended and restated certificate of incorporation or bylaws, or otherwise, the registrant has been advised that in the opinion of the Securities and Exchange Commission such indemnification is against public policy as expressed in the Securities Act and is, therefore, unenforceable. In the event that a claim for indemnification against such liabilities (other than the payment by the registrant of expenses incurred or paid by a director, officer or controlling person of the registrant in the successful defense of any action, suit or proceeding) is asserted by such director, officer or controlling person in connection with the securities being registered, the registrant will, unless in the opinion of its counsel the matter has been settled by controlling precedent, submit to a court of appropriate jurisdiction the question whether such indemnification by it is against public policy as expressed in the Securities Act and will be governed by the final adjudication of such issue.
(c) The undersigned registrant hereby undertakes that:
(1) For purposes of determining any liability under the Securities Act of 1933, the information omitted from the form of prospectus filed as part of this registration statement in reliance upon Rule 430A and contained in a form of prospectus filed by the registrant pursuant to Rule 424(b)(1) or (4) or 497(h) under the Securities Act shall be deemed to be part of this registration statement as of the time it was declared effective; and
(2) For the purpose of determining any liability under the Securities Act of 1933, each post-effective amendment that contains a form of prospectus shall be deemed to be a new registration statement relating to the securities offered therein, and the offering of such securities at that time shall be deemed to be the initial bona fide offering thereof.
II-3
Table of Contents
SIGNATURES
Pursuant to the requirements of the Securities Act of 1933, the registrant has duly caused this Amendment No. 17 to its Registration Statement on Form S-1 to be signed on its behalf by the undersigned, thereunto duly authorized, in the City of New York, in the State of New York, on this 4th day of December, 2013.
| RYERSON HOLDING CORPORATION | ||
| By: | /S/ EDWARD J. LEHNER | |
| Name: | Edward J. Lehner | |
| Title: | Executive Vice President and Chief Financial Officer | |
Pursuant to the requirements of the Securities Act of 1933, this Amendment No. 17 to its Registration Statement on Form S-1 has been signed by the following persons in the capacities and on the dates indicated.
| Signature |
Title |
Date | ||
| * Michael C. Arnold |
Chief Executive Officer and President |
December 4, 2013 | ||
| /S/ EDWARD J. LEHNER Edward J. Lehner |
Executive Vice President and Chief Financial Officer |
December 4, 2013 | ||
| * Erich S. Schnaufer |
Chief Accounting Officer (Principal Accounting Officer) |
December 4, 2013 | ||
| * Robert L. Archambault |
Director |
December 4, 2013 | ||
| * Eva M. Kalawski |
Director |
December 4, 2013 | ||
| * Jacob Kotzubei |
Director |
December 4, 2013 | ||
| * Mary Ann Sigler |
Director |
December 4, 2013 | ||
| *By: | /S/ EDWARD J. LEHNER Attorney-in-Fact |
|||||
II-4
Table of Contents
INDEX TO EXHIBITS
| Exhibit |
Exhibit Description | |
| 1.1 | Form of Purchase Agreement.†† | |
| 2.1 | Agreement and Plan of Merger, dated July 24, 2007, by and among Ryerson Holding Corporation (f/k/a Rhombus Holding Corporation), Rhombus Merger Corporation and Ryerson Inc.(a) | |
| 3.1 | Form of Amended and Restated Certificate of Incorporation of Ryerson Holding Corporation.†† | |
| 3.2 | Form of Amended and Restated Bylaws of Ryerson Holding Corporation.†† | |
| 4.1 | Form of Common Stock Certificate of Ryerson Holding Corporation.†† | |
| 4.2 | Amended and Restated Stockholders’ Agreement, dated as of March 31, 2009, by and among Rhombus Holding Corporation, Platinum Equity Capital Partners, L.P., Platinum Equity Capital Partners-A, L.P., Platinum Equity Capital Partners-PF, L.P., Platinum Equity Capital Partners II, L.P., Platinum Equity Capital Partners-A II, L.P., Platinum Equity Capital Partners-PF II, L.P., Platinum Rhombus Principals, LLC, and the stockholders party thereto.†† | |
| 4.3 | Amendment to Amended and Restated Stockholders’ Agreement, dated as of April 1, 2009, by and among Rhombus Holding Corporation, Platinum Equity Capital Partners, L.P., Platinum Equity Capital Partners-A, L.P., Platinum Equity Capital Partners-PF, L.P., Platinum Equity Capital Partners II, L.P., Platinum Equity Capital Partners-A II, L.P., Platinum Equity Capital Partners-PF II, L.P., Platinum Rhombus Principals, LLC, Moelis Capital Partners Opportunity Fund I, LP and Moelis Capital Partners Opportunity Fund I-A, LP.†† | |
| 4.4 | Form of Investor Rights Agreement, by and among Ryerson Holding Corporation, Platinum Equity Capital Partners, L.P., Platinum Equity Capital Partners-PF, L.P., Platinum Equity Capital Partners-A, L.P., Platinum Equity Capital Partners II, L.P., Platinum Equity Capital Partners-PF II, L.P., Platinum Equity Capital Partners-A II, L.P. and Platinum Rhombus Principals, LLC.†† | |
| 5.1 | Opinion of Willkie Farr & Gallagher LLP regarding the validity of the securities being registered.†† | |
| 10.1 | Credit Agreement, dated as of October 19, 2007, by and among Rhombus Merger Corporation, Joseph T. Ryerson & Son, Inc., Banc of America Securities LLC, as sole lead arranger and book manager, Ryerson Canada, Inc., as Canadian borrower, Wachovia Capital Finance Corporation (Central), as co-documentation agents, Wells Fargo Foothill, LLC, General Electric Capital Corporation, as co-syndication agents, ABN AMRO Bank N.V., Bank of America, N.A. (acting through its Canada branch), as Canadian agent, Bank of America, N.A., as administrative agent, and the lenders named therein.(a) | |
| 10.2 | Amendment No. 1, dated as of March 14, 2011, to the Credit Agreement, dated as of October 19, 2007, by and among Rhombus Merger Corporation, Joseph T. Ryerson & Son, Inc., Bank of America Securities LLC, as sole lead arranger and book manager, Ryerson Canada, Inc., as Canadian borrower, Wachovia Capital Finance Corporation (Central), as co-documentation agents, Wells Fargo Foothill, LLC, General Electric Capital Corporation, as co-syndication agents, ABN AMRO Bank N.V., Bank of America, N.A. (acting through its Canada branch), as Canadian agent, Bank of America, N.A., as administrative agent, and the lenders named therein.(c) | |
| 10.3 | Guarantee and Security Agreement, dated as of October 19, 2007, by and among Rhombus Merger Corporation, the pledgors and guarantors party thereto and Bank of America, N.A., as administrative agent.(a) | |
| 10.4 |
Intercreditor Agreement, dated as of October 19, 2007, by and among Bank of America, N.A., as ABL collateral agent and Wells Fargo Bank, National Association, as notes collateral agent.(a) | |
| 10.5 | General Security Agreement, dated October 19, 2007, by and between Ryerson Canada, Inc. and Bank of America, N.A., as Canadian Agent.(a) | |
Table of Contents
| Exhibit |
Exhibit Description | |
| 10.6 | Offer Letter Agreement, dated November 9, 2010, by and between Ryerson Inc. and Michael C. Arnold.(c) | |
| 10.7 | Indemnification Agreement, dated July 24, 2007, by and between Ryerson Inc. and Terence R. Rogers.(a) | |
| 10.8 | Ryerson Nonqualified Savings Plan.(b) | |
| 10.9 | Offer Letter Agreement, dated June 29, 2012, between Ryerson Inc. and Edward J. Lehner.(d) | |
| 10.10 | Rhombus Holding Corporation Amended and Restated 2009 Participation Plan.†† | |
| 10.11 | Ryerson Annual Incentive Plan (as amended through June 14, 2007).†† | |
| 10.12 | Ryerson Holding Corporation 2013 Stock Incentive Plan.†† | |
| 10.13 | Amendment No. 3, dated as of April 3, 2013, to the Credit Agreement, dated as of October 19, 2007, by and among Rhombus Merger Corporation, Joseph T. Ryerson & Son, Inc., Bank of America Securities LLC, as sole lead arranger and book manager, Ryerson Canada, Inc., as Canadian borrower, Wachovia Capital Finance Corporation (Central), as co-documentation agents, Wells Fargo Foothill, LLC, General Electric Capital Corporation, as co-syndication agents, ABN AMRO Bank N.V., Bank of America, N.A. (acting through its Canada branch), as Canadian agent, Bank of America, N.A., as administrative agent, and the lenders named therein.†† | |
| 10.14 | Amendment No. 2, dated as of September 25, 2012, to the Credit Agreement, dated as of October 19, 2007, by and among Rhombus Merger Corporation, Joseph T. Ryerson & Son, Inc., Bank of America Securities LLC, as sole lead arranger and book manager, Ryerson Canada, Inc., as Canadian borrower, Wachovia Capital Finance Corporation (Central), as co-documentation agents, Wells Fargo Foothill, LLC, General Electric Capital Corporation, as co-syndication agents, ABN AMRO Bank N.V., Bank of America, N.A. (acting through its Canada branch), as Canadian agent, Bank of America, N.A., as administrative agent, and the lenders named therein.†† | |
| 21.1 | List of Subsidiaries of Ryerson Holding Corporation.†† | |
| 23.1 | Consent of Ernst & Young LLP.* | |
| 23.2 | Consent of Willkie Farr & Gallagher LLP (included in Exhibit 5.1).†† | |
| 24.1 | Power of Attorney.†† | |
| 99.1 | Consent of Kirk K. Calhoun.†† | |
| * | Filed herewith. |
| †† | Previously filed. |
| (a) | Incorporated by reference to Ryerson Inc.’s Form S-4 filed on July 3, 2008 (File No. 333-152102). |
| (b) | Incorporated by reference to Ryerson Inc.’s Form S-4/A-2 filed on February 24, 2009 (File No. 333-152102). |
| (c) | Incorporated by reference to Ryerson Holding Corporation’s Annual Report on Form 10-K for the year ended December 31, 2010 filed on March 15, 2011 (File No. 001-34735). |
| (d) | Incorporated by reference to Ryerson Inc.’s Form 8-K filed on July 3, 2012 (File No. 001-09117). |