Attached files
| file | filename |
|---|---|
| EX-32.1 - EX-32.1 - QUALYS, INC. | d637477dex321.htm |
| EX-31.2 - EX-31.2 - QUALYS, INC. | d637477dex312.htm |
| EX-23.1 - EX-23.1 - QUALYS, INC. | d637477dex231.htm |
| EX-31.1 - EX-31.1 - QUALYS, INC. | d637477dex311.htm |
| EX-32.2 - EX-32.2 - QUALYS, INC. | d637477dex322.htm |
Table of Contents
UNITED STATES
SECURITIES AND EXCHANGE COMMISSION
Washington, D.C. 20549
FORM 10-K/A
(Amendment No. 1)
| x | Annual Report Pursuant to Section 13 or 15(d) of the Securities Exchange Act of 1934 |
For the Annual Period Ended December 31, 2012
or
| ¨ | Transition Report Pursuant to Section 13 or 15(d) of the Securities Exchange Act of 1934 |
For the transition period from to
Commission file number 001-35662
QUALYS, INC.
(Exact name of registrant as specified in its charter)
| Delaware | 77-0534145 | |
| (State or other jurisdiction of incorporation or organization) |
(I.R.S. Employer Identification Number) |
1600 Bridge Parkway, Redwood City, California 94065
(Address of principal executive offices, including zip code)
(650) 801-6100
(Registrant’s telephone number, including area code)
Securities registered pursuant to section 12(b) of the Act:
| Title of each class |
Name of each exchange on which registered | |
| Common stock, $0.001 par value per share | NASDAQ Stock Market |
Securities registered pursuant to section 12(g) of the Act: None
Indicate by check mark if the registrant is a well-known seasoned issuer, as defined in Rule 405 of the Securities Act. Yes ¨ No x
Indicate by check mark if the registrant is not required to file reports pursuant to Section 13 or Section 15(d) of the Act. Yes ¨ No x
Indicate by check mark whether the Registrant (1) has filed all reports required to be filed by Section 13 or 15(d) of the Securities Exchange Act of 1934 during the preceding 12 months (or for such shorter period that the Registrant was required to file such reports), and (2) has been subject to such filing requirements for the past 90 days. Yes x No ¨
Indicate by check mark whether the registrant has submitted electronically and posted on its corporate Web site, if any, every Interactive Data File required to be submitted and posted pursuant to Rule 405 of Regulation S-T during the preceding 12 months (or for such shorter period that the registrant was required to submit and post such files). Yes x No ¨
Indicate by check mark if disclosure of delinquent filers pursuant to Item 405 of Regulation S-K(§229.405 of this chapter) is not contained herein, and will not be contained, to the best of registrant’s knowledge, in definitive proxy or information statements incorporated by reference in Part III of this From 10-K or any amendment to this Form 10-K. x
Indicate by check mark whether the registrant is a large accelerated filer, an accelerated filer, a non-accelerated filer, or a smaller reporting company. See the definitions of “large accelerated filer,” “accelerated filer” and “smaller reporting company” in Rule 12b-2 of the Exchange Act. (Check one):
| Large accelerated filer | ¨ | Accelerated filer | ¨ | |||||
| Non-accelerated filer | x | (Do not check if a smaller reporting company) | Smaller reporting company | ¨ | ||||
Indicate by check mark whether the registrant is a shell company (as defined in Rule 12b-2 of the Exchange Act). Yes ¨ No x
The registrant’s common stock began trading on the NASDAQ Stock Market on September 28, 2012. As of December 31, 2012, the aggregate market value of voting shares of common stock held by non-affiliates of the registrant was $216.6 million based on the last reported sale price of the registrant’s common stock on December 31, 2012. Shares of common stock held by each executive officer and director and by each person who owns 5% or more of the outstanding common stock have been excluded in that such persons may be deemed to be affiliates. This determination of affiliate status is not necessarily a conclusive determination for other purposes.
The number of shares of the Registrant’s common stock outstanding as of February 28, 2013 was 31,547,650 shares.
DOCUMENTS INCORPORATED BY REFERENCE
Portions of the registrant’s Proxy Statement for its 2013 Annual Meeting of Stockholders are incorporated by reference in Part III of this Annual Report on Form 10-K where indicated. Such proxy statement will be filed with the Securities and Exchange Commission within 120 days of the registrant’s fiscal year ended December 31, 2012.
Table of Contents
Explanatory Note
Qualys, Inc. (“Qualys” or the “Company”) is filing this Amendment No. 1 on Form 10-K/A to its Annual Report on Form 10-K for the year ended December 31, 2012 (this “Amendment”) solely to amend the signature page to provide conformed signatures, which were inadvertently omitted from the original Form 10-K filed on March 5, 2013 (the “Original Form 10-K”). The original signature page was fully executed on March 5, 2013, and was in the Company’s possession at the time of the filing of the Original Form 10-K. In addition, the Company is including in this Amendment currently dated certifications from its Chief Executive Officer and Chief Financial Officer as required by Sections 302 and 906 of the Sarbanes-Oxley Act of 2002 as Exhibits 31.1 and 31.2 and Exhibits 32.1 and 32.2, respectively. The Company is also including in this Amendment a currently dated consent of the Company’s independent registered public accounting firm as Exhibit 23.1. Except as described above, this Amendment does not modify or update disclosures presented in the Original Form 10-K, nor does it reflect events occurring after the filing of the Original Form 10-K or modify or update those disclosures. Accordingly, this Amendment should be read in conjunction with the Original Form 10-K and the Company’s filings with the SEC subsequent to the filing of the Original Form 10-K.
Table of Contents
Qualys, Inc.
| Page | ||||||
| PART I | ||||||
| Item 1. | 3 | |||||
| Item 1A. | 13 | |||||
| Item 1B. | 36 | |||||
| Item 2. | 36 | |||||
| Item 3. | 36 | |||||
| Item 4. | 36 | |||||
| PART II | ||||||
| Item 5. | 37 | |||||
| Item 6. | 40 | |||||
| Item 7. | Management’s Discussion and Analysis of Financial Condition and Results of Operations |
44 | ||||
| Item 7A. | 61 | |||||
| Item 8. | 62 | |||||
| Item 9. | Changes in and Disagreements with Accountants on Accounting and Financial Disclosure |
92 | ||||
| Item 9A. | 92 | |||||
| Item 9B. | 92 | |||||
| PART III | ||||||
| Item 10. | 93 | |||||
| Item 11. | 93 | |||||
| Item 12. | Security Ownership of Certain Beneficial Owners and Management and Related Stockholder Matters |
93 | ||||
| Item 13. | Certain Relationships and Related Transactions, and Director Independence |
93 | ||||
| Item 14. | 93 | |||||
| PART IV | ||||||
| Item 15. | 94 | |||||
| Signatures | 95 | |||||
| Exhibit Index | 96 | |||||
-1-
Table of Contents
Forward-Looking Statements
In addition to historical information, this Annual Report on Form 10-K contains “forward-looking” statements within the meaning of the federal securities laws, which statements involve substantial risks and uncertainties. Forward-looking statements generally relate to future events or our future financial or operating performance. In some cases, it is possible to identify forward-looking statements because they contain words such as “anticipates,” “believes,” “contemplates,” “continue,” “could,” “estimates,” “expects,” “future,” “intends,” “likely,” “may,” “plans,” “potential,” “predicts,” “projects,” “seek,” “should,” “target” or “will,” or the negative of these words or other similar terms or expressions that concern our expectations, strategy, plans or intentions. Forward-looking statements contained in this Annual Report on 10-K include, but are not limited to, statements about:
| • | our financial performance, including our revenues, costs, expenditures, growth rates, operating expenses and ability to generate positive cash flow to attain and sustain profitability; |
| • | anticipated technology trends, such as the use of cloud solutions; |
| • | our ability to adapt to changing market conditions; |
| • | economic and financial conditions, including volatility in foreign exchange rates; |
| • | our ability to diversify our sources of revenues; |
| • | the effects of increased competition in our market; |
| • | our ability to effectively manage our growth; |
| • | our anticipated investments in sales and marketing and research and development; |
| • | maintaining and expanding our relationships with channel partners; |
| • | our ability to maintain, protect and enhance our brand and intellectual property; |
| • | costs associated with defending intellectual property infringement and other claims; |
| • | our ability to attract and retain qualified employees and key personnel; |
| • | our ability to successfully enter new markets and manage our international expansion; and |
| • | other factors discussed in this Annual Report on Form 10-K in the sections titled “Risk Factors,” “Management’s Discussion and Analysis of Financial Condition and Results of Operations” and “Business.” |
We have based the forward-looking statements contained in this Annual Report on Form 10-K primarily on our current expectations and projections about future events and trends that we believe may affect our business, financial condition, results of operations and prospects. The outcome of the events described in this forward-looking statements is subject to risks, uncertainties, assumptions, and other factors including those described in Part I, Item 1A (Risk Factors) of this Annual Report. Moreover, we operate in a very competitive and rapidly changing environment. New risks and uncertainties emerge from time to time, and it is not possible for us to predict all risks and uncertainties that could have an impact on the forward-looking statements used herein. We cannot provide assurance that the results, events, and circumstances reflected in the forward-looking statements will be achieved or occur, and actual results, events or circumstances could differ materially from those described in the forward-looking statements.
You should not rely on forward-looking statements as predictions of future events. Except as required by law, neither we nor any other person assumes responsibility for the accuracy and completeness of the forward-looking statements, and we undertake no obligation to update any forward-looking statements to reflect events or circumstances after the date of such statements.
-2-
Table of Contents
Qualys, the Qualys logo and QualysGuard, and other trademarks and service marks of Qualys appearing in this Annual Report on Form 10-K are the property of Qualys. This Annual Report on Form 10-K also contains trademarks and trade names of other businesses that are the property of their respective holders. We have omitted the ® and ™ designations, as applicable, for the trademarks used in this Annual Report on Form 10-K.
| Item 1. | Business |
Overview
We are a pioneer and leading provider of cloud security and compliance solutions that enable organizations to identify security risks to their IT infrastructures, help protect their IT systems and applications from ever-evolving cyber attacks and achieve compliance with internal policies and external regulations. Our cloud solutions address the growing security and compliance complexities and risks that are amplified by the dissolving boundaries between internal and external IT infrastructures and web environments, the rapid adoption of cloud computing and the proliferation of geographically dispersed IT assets. Our integrated suite of security and compliance solutions delivered on our QualysGuard Cloud Platform enable our customers to identify their IT assets, collect and analyze large amounts of IT security data, discover and prioritize vulnerabilities, recommend remediation actions and verify the implementation of such actions. Organizations use our integrated suite of solutions delivered on our QualysGuard Cloud Platform to cost-effectively obtain a unified view of their security and compliance posture across globally-distributed IT infrastructures.
IT infrastructures are more complex and globally-distributed today than ever before, as organizations of all sizes increasingly rely upon myriad interconnected information systems and related IT assets, such as servers, databases, web applications, routers, switches, desktops, laptops, other physical and virtual infrastructure, and numerous external networks and cloud services. In this environment, new and evolving technologies intended to improve organizations’ operations can also increase vulnerability to cyber attacks, which can expose sensitive data, damage IT and physical infrastructures, and result in serious financial or reputational consequences. In addition, the rapidly increasing amount of data and devices in IT environments makes it more difficult to identify and remediate vulnerabilities in a timely manner. The predominant approach to IT security has been to implement multiple disparate security products that can be costly and difficult to deploy, integrate and manage and may not adequately protect organizations. As a result, we believe there is a large and growing opportunity for comprehensive cloud security and compliance solutions.
We designed our QualysGuard Cloud Platform to transform the way organizations secure and protect their IT infrastructures and applications. Our cloud platform offers an integrated suite of solutions that automates the lifecycle of asset discovery, security assessments, and compliance management for an organization’s IT infrastructure and assets, whether they reside inside the organization, on their network perimeter or in the cloud. Since inception, our solutions have been designed to be delivered through the cloud and to be easily and rapidly deployed on a global scale across a broad range of industries, enabling faster implementation and lower total cost of ownership than traditional on-premise enterprise software products. Our customers, ranging from some of the largest organizations to small businesses, are all served from our globally-distributed cloud platform, enabling us to rapidly deliver new solutions, enhancements and security updates.
We were founded and incorporated in December 1999 with a vision of transforming the way organizations secure and protect their IT infrastructure and applications and initially launched our first cloud solution, QualysGuard Vulnerability Management, in 2000. This solution has provided the substantial majority of our revenues to date, representing 87%, 90% and 92% of total revenues in 2012, 2011 and 2010, respectively. As this solution gained acceptance, we introduced new solutions to help customers manage increasing IT security and compliance requirements. In 2006, we added our PCI Compliance solution, and in 2008, we added our Policy Compliance solution. In 2009, we broadened the scope of our cloud services by adding Web Application Scanning. We continued our
-3-
Table of Contents
expansion in 2010, launching Malware Detection Service and Qualys SECURE Seal for automated protection of websites. On September 28, 2012, our common stock commenced trading on the NASDAQ Stock Market under the trading symbol “QLYS,” and on October 3, 2012 we closed our initial public offering.
We provide our solutions through a software-as-a-service model, primarily with renewable annual subscriptions. These subscriptions require customers to pay a fee in order to access our cloud solutions. We invoice our customers for the entire subscription amount at the start of the subscription term, and the invoiced amounts are treated as deferred revenues and are recognized ratably over the term of each subscription. Historically, we have experienced significant revenue growth from existing customers as they renew and purchase additional subscriptions. Revenues from customers existing at or prior to December 31, 2011 grew $7.8 million to $84.0 million during 2012. We expect this trend to continue.
Our QualysGuard Cloud Platform is currently used by over 6,150 organizations in more than 100 countries, including a majority of each of the Forbes Global 100 and Fortune 100. Our revenues increased from $65.4 million in 2010 to $76.2 million in 2011, and reached $91.4 million in 2012. We generated net income of $0.8 million in 2010, $2.0 million in 2011, and $2.3 million in 2012. Total assets as of December 31, 2012 and 2011 were $170.3 million and $68.8 million, respectively.
Our Growth Strategy
We intend to leverage our innovation and extensive expertise to strengthen our leadership position as a trusted provider of cloud security and compliance solutions. The key elements of our growth strategy are:
| • | Continue to innovate and enhance our cloud platform and suite of solutions. We intend to continue to make significant investments in research and development to extend our cloud platform’s functionality by developing new security solutions and further enhancing our existing suite of solutions. In 2012, we introduced several new solutions on our platform, including our Web Application Scanning and Zero-Day Risk Analyzer, and have additional solutions under development. |
| • | Expand the use of our suite of solutions by our large and diverse customer base. With more than 6,150 customers across many industries and geographies, we believe we have a significant opportunity to sell additional solutions to our customers and expand their use of our suite of solutions. Since the majority of our customers initially deploy only one of our solutions and in select parts of their IT infrastructures, our existing customers serve as a strong source of new sales. In this regard, we have significantly expanded our sales execution and marketing functions to increase adoption of our newly developed solutions among our existing customers. |
| • | Drive new customer growth. We are pursuing new customers by targeting key accounts and expanding our sales and marketing organization and network of channel partners. We will continue to seek to make significant investments to encourage organizations to replace their existing security products with our cloud solutions. |
| • | Broaden our global reach. We intend to expand our relationships with key security consulting organizations, managed security service providers and value added resellers to accelerate the adoption of our cloud platform. We seek to strengthen existing relationships as well as establish new relationships to increase the distribution and market awareness of our cloud platform and target new geographic regions. |
| • | Selectively pursue technology acquisitions to bolster our capabilities and leadership position. We may explore acquisitions that are complementary to and can expand the functionality of our cloud platform. We may also seek to acquire technology teams to supplement our own team and increase the breadth of our cloud security and compliance solutions. |
-4-
Table of Contents
Our Platform
Our QualysGuard Cloud Platform consists of a suite of IT security and compliance solutions that leverage our shared and extensible core services and our highly scalable multi-tenant cloud infrastructure.
Our suite of solutions provides security intelligence by automating the life cycle of IT asset discovery, security assessment and compliance management. Our core services layer provides a set of advanced shared technologies that are leveraged by our suite of security and compliance solutions, which we refer to as our Core Services.
Built on our cloud platform infrastructure, our Core Services provide an integrated framework with proprietary functionalities that act as building blocks to enable efficient and scalable delivery of our customer-facing cloud solutions. Our cloud platform’s infrastructure includes integrated services that deliver a highly automated and scalable scanning infrastructure capable of scanning IT systems and web applications, inside and outside corporate firewalls.
The Core Services and infrastructure layers of our cloud platform deliver benefits to our entire suite of security and compliance solutions, including:
| • | Dynamic and interactive user interfaces with configurable report templates to present scan data with a wide range of presentation options to match a customer’s needs; |
| • | Fast searching of several extensive QualysGuard data sets, including scan results, asset data, scan profiles, users and vulnerabilities; |
| • | Asset management technology for hierarchical asset categorization via dynamic tagging and role-based customer access management; and |
| • | Distributed scanning platform for global cloud-based environments. |
We also provide open application program interfaces, or APIs, and other developer tools that allow third parties to embed our technology into their solutions and build applications on our cloud platform.
QualysGuard Cloud Suite
Our suite of solutions, which we refer to as the QualysGuard Cloud Suite, currently includes six solutions: Vulnerability Management, Web Application Scanning, Malware Detection Service, Policy Compliance, PCI Compliance and Qualys SECURE Seal. This integrated set of cloud solutions enables organizations to:
| • | Discover and catalogue information assets inside the organization, on the perimeter, or in the cloud; |
| • | Manage assets on an ongoing basis to establish a trusted repository for IT system configurations and to maintain hierarchical relationships between them; |
| • | Design policies to establish a secure and compliant IT infrastructure and automate ongoing security and compliance assessments of IT systems and applications in accordance with best practices; |
| • | Proactively identify and help fix vulnerabilities to mitigate security risks and achieve compliance; |
| • | Monitor and measure security and compliance through a unified user interface; and |
| • | Distribute security and compliance reports tailored to differing customer needs, including management personnel, auditors and security professionals. |
-5-
Table of Contents
Our customers can subscribe to one or more of our security and compliance solutions based on their initial needs and expand their subscriptions over time to new areas within their organization or to additional QualysGuard solutions. We offer two editions of our QualysGuard Cloud Suite, the Enterprise edition for large and medium-sized enterprises and the Express edition for small and medium-sized businesses. QualysGuard Cloud Suite solutions are described below.
QualysGuard Vulnerability Management
QualysGuard Vulnerability Management, or QualysGuard VM, is an industry leading and award-winning solution that automates network auditing and vulnerability management across an organization, including network discovery and mapping, asset management, vulnerability reporting, and remediation tracking. Driven by our comprehensive KnowledgeBase of known vulnerabilities, QualysGuard VM enables cost-effective protection against vulnerabilities without substantial resource deployment.
QualysGuard Policy Compliance
QualysGuard Policy Compliance, or QualysGuard PC, allows customers to analyze and collect configuration and access control information from their networked devices and web applications and automatically maps this information to internal policies and external regulations in order to document compliance. QualysGuard PC is fully automated and helps reduce customers’ cost of compliance without requiring the use of software agents.
QualysGuard PCI Compliance
QualysGuard PCI Compliance, or QualysGuard PCI, provides organizations that store cardholder data a cost-effective and highly automated solution to verify and document compliance with PCI DSS. QualysGuard PCI allows merchants to complete the annual PCI Self-Assessment Questionnaire, or SAQ, to perform vulnerability scanning for quarterly PCI audits and to meet the demands of PCI for web application security.
QualysGuard Web Application Scanning
QualysGuard Web Application Scanning, or QualysGuard WAS, uses the scalability of our cloud platform to allow customers to discover, catalog and scan a large number of web applications. QualysGuard WAS scans and analyzes custom web applications and identifies vulnerabilities that threaten underlying databases or bypass access controls. These web applications are often the main attack vectors for cyber attackers.
QualysGuard Malware Detection Service
QualysGuard Malware Detection Service, or QualysGuard MDS, provides organizations with the ability to scan, identify and remove malware infections from their websites. QualysGuard MDS utilizes behavioral and static analysis to provide malware detection to organizations. It provides periodic scanning to monitor websites and delivers email alerts to notify customers of infections.
QualysGuard Web Application Firewall
QualysGuard Web Application Firewall, or QualysGuard WAF, currently in beta testing, delivers enterprise-grade web application security without the costs, footprint, and complexity associated with appliance-based web application firewall solutions. It is designed to protect web applications from attack vectors by enhancing default web application configurations and virtual patching. QualysGuard WAF can improve website performance by reducing page load times and optimizing bandwidth.
-6-
Table of Contents
Qualys SECURE Seal
QualysGuard SECURE Seal helps organizations demonstrate to their online customers that they maintain a proactive security program. This solution includes scanning for the presence of malware, network and web application vulnerabilities and for SSL certificate validation. Websites that regularly perform these security scans with no critical security issues detected can display a QualysGuard SECURE Seal on their website to demonstrate to visitors that they are proactively securing their websites.
QualysGuard Core Services
Our Core Services enable integrated workflows, management and real-time analysis and reporting across all of our IT security and compliance solutions. Our Core Services include:
| • | Asset Tagging and Management. Enables customers to easily identify, categorize and manage large numbers of assets in highly dynamic IT environments and automates the process of inventory management and hierarchical organization of IT assets. |
| • | Reporting and Dashboards. A highly configurable reporting engine that provides customers with reports and dashboards based on their roles and access privileges. |
| • | Questionnaires and Collaboration. A configurable workflow engine that enables customers to easily build questionnaires and capture existing business processes and workflows to evaluate controls and gather evidence to validate and document compliance. |
| • | Remediation and Workflow. An integrated workflow engine that allows customers to automatically generate helpdesk tickets for remediation and to manage compliance exceptions based on customer-defined policies, enabling subsequent review, commentary, tracking and escalation. This engine automatically distributes remediation tasks to IT administrators upon scan completion, tracks remediation progress and closes open tickets once patches are applied and remediation is verified in subsequent scans. |
| • | Big Data Correlation and Analytics Engine. Provides capabilities for indexing, searching and correlating large amounts of security and compliance data with other security incidents and third-party security intelligence data. Embedded workflows enable customers to quickly assess risk and access information for remediation, incident analysis and forensic investigations. |
| • | Alerts and Notifications. Creates email notifications to alert customers of new vulnerabilities, malware infections, scan completion, open trouble tickets and system updates. |
QualysGuard Cloud Infrastructure
Our infrastructure layer, which we refer to as our Infrastructure, includes the data, data processing capabilities, software and hardware infrastructure and infrastructure management capabilities that provide the foundation for our cloud platform and allow us to automatically scale our Infrastructure and Core Services to scan millions of IPs. Each Infrastructure service is described below:
| • | Scalable Capacity. We have designed a modular and scalable infrastructure that leverages virtualization and cloud technologies. This allows our operations team to dynamically allocate additional capacity on-demand across our entire QualysGuard Cloud Platform to address the growth and scalability of our solutions. |
| • | Big Data Indexing and Storage. Built on top of our secure data storage model, this engine indexes petabytes of data and uses this information in real-time to execute tags or rules to dynamically update IT assets’ properties, which are used in various workflows for scanning, reporting and remediation. |
-7-
Table of Contents
| • | QualysGuard KnowledgeBase. QualysGuard relies on our comprehensive repository, which we refer to as our KnowledgeBase, of known vulnerabilities and compliance controls for a wide range of devices, technologies and applications that powers our security and compliance scanning technology. We update our KnowledgeBase daily with signatures for new vulnerabilities, control checks, validated fixes and improvements. |
| • | Managed Scanner Appliances. As part of our cloud platform, we host and operate a large number of globally distributed physical scanner appliances that our customers use to scan their externally facing systems and web applications. To scan internal IT assets, customers can also deploy our scanners, which are available on a subscription basis as physical appliances or downloadable virtual images, within their internal networks. Our scanner appliances self-update daily in a transparent manner using our automated and proprietary scan management technology. These scanner appliances allow us to scale our cloud platform to scan networked devices and web applications across organizations’ networks around the world. |
Our Customers
We market and sell our solutions to enterprises, government entities and to small and medium size businesses across a broad range of industries, including education, financial services, government, healthcare, insurance, manufacturing, media, retail, technology and utilities. As of December 31, 2012, we had over 6,150 customers in more than 100 countries, including a majority of each of the Forbes Global 100 and Fortune 100. In each of 2012, 2011 and 2010, no one customer accounted for more than 10% of our revenues. In 2012, 2011 and 2010, approximately 68%, 67% and 67%, respectively, of our revenues were derived from customers in the United States. We sell our solutions to enterprises and government entities primarily through our field sales force and to small and medium-sized businesses through our inside sales force. We generate a significant portion of sales through our channel partners, including managed service providers, value-added resellers and consulting firms in the United States and internationally.
Sales and Marketing
Sales
We market and sell our IT security and compliance solutions to customers directly through our sales teams as well as indirectly through our network of channel partners.
Our global sales force is organized into a field sales team, which focuses on enterprises, generally including organizations with more than 4,000 employees, and an inside sales team, which focuses on small to medium businesses, which generally include organizations with less than 4,000 employees. Both our field and inside sales teams are divided into three geographic regions, including the Americas; Europe, Middle East and Africa; and Asia-Pacific. We also further segment each of our sales teams into groups that focus on adding new customers or expanding relationships with existing customers.
Our channel partners maintain relationships with their customers throughout the territories in which they operate and provide their customers with services and third-party solutions to help meet those customers’ evolving security and compliance requirements. As such, these partners offer our IT security and compliance solutions in conjunction with one or more of their own products or services and act as a conduit through which we can connect with these prospective customers to offer our solutions. Our channel partners include security consulting organizations, managed service providers and resellers, such as Computacenter UK Ltd., Dell Inc., FishNet Security, Inc., Insight Technologies, Inc., Symantec Corporation and Verizon Communications Inc.
-8-
Table of Contents
For sales involving a channel partner, the channel partner engages with the prospective customer directly and involves our sales team as needed to assist in developing and closing an order. When a channel partner secures a sale, we sell the associated subscription to the channel partner who in turn resells the subscription to the customer, with the channel partner earning a fee based on the total value of the order. Once the order is completed, we provide these customers with direct access to our solutions and other associated back-office applications, enabling us to establish a direct relationship as part of ensuring customer satisfaction with our solutions. At the end of the subscription term, the channel partner engages with the customer to execute a renewal order, with our sales team providing assistance as required. In 2012, 2011 and 2010, 40%, 38% and 33%, respectively, of our revenues were generated by channel partners.
Marketing
Our marketing programs include a variety of online marketing, advertising, conferences, events, public relations activities and web-based seminar campaigns targeted at key decision makers within our prospective customers.
We have a number of marketing initiatives to build awareness and encourage customer adoption of our solutions. We offer free trials and services to allow prospective customers to experience the quality of our solutions, to learn in detail about the features and functionality of our cloud platform, and to quantify the potential benefits of our solutions.
Customer Support
We deliver 24x7x365 customer support from centers located in Redwood City, California; Durham, North Carolina; and Slough, United Kingdom. We recruit senior level technical personnel and trained subject matter experts who work closely with engineering and operations personnel to resolve issues quickly. Our security and compliance solutions can be deployed easily and are designed to be implemented and operated without the need for any professional services. Accordingly, we do not sell any professional services. However, we do offer various training programs as part of our subscriptions to all of our customers. We believe that our customer support helps ensure customer satisfaction and is critical to retaining and expanding our customer base. In addition, we leverage the insights drawn from our customers to further improve the functionality of our security and compliance solutions.
Research and Development and Operations
We devote significant resources to maintain, enhance and add new functionality to our QualysGuard Cloud Platform and the integrated suite of solutions that we offer. Our development organization consists of agile engineering teams with substantial security expertise in specific areas of our solutions. In addition to our development teams, we have also built a sophisticated research team focused on identifying threats and developing signatures for vulnerabilities and compliance checks so that we can provide our customers with daily updates and enable them to scan their assets for the latest threats. We conduct our research and development in the United States, Brazil, China, France, India, and United Kingdom, which gives us access to some of the best research and engineering talent in the world. Our focus remains to attract engineering talent as we continue to add new solutions and improve existing ones.
Our development team works closely with our customers and partners to gain valuable insights into their environments and gather feedback for threat research, product development and innovations. We typically release updates to our solutions, including enhancements and new features multiple times a year, and we measure the quality of our scan results on a frequent basis in an effort to maintain the highest level of scan accuracy.
-9-
Table of Contents
The modular architecture of our cloud platform enables our engineering teams to simultaneously work on different features, accelerating the delivery of new functionalities to customers. Our research and development team also works collaboratively with our technical support team to ensure customer satisfaction and with our sales team to accelerate the adoption of our solutions.
Research and development expenses were $20.2 million, $19.6 million and $15.8 million for 2012, 2011 and 2010, respectively.
Manufacturing Agreement
Our physical appliances are provided by SYNNEX Corporation, or SYNNEX, pursuant to a manufacturing services agreement dated March 1, 2011. Under this agreement, SYNNEX manufactures, assembles and tests our physical scanner appliances. This agreement has an initial term of one year, which is automatically renewed for additional one-year terms, unless terminated (i) at anytime upon the mutual written agreement of us and SYNNEX, (ii) by either party upon 90 days or more written notice, (iii) upon written notice, subject to applicable cure periods, if the other party has materially breached its obligations under the agreement or (iv) by either party upon the other party seeking an order for relief under the bankruptcy laws of the United States or similar laws of any other jurisdiction, a composition with or assignment for the benefit of creditors, or dissolution or liquidation.
Data Center Agreements
Our data center operations are provided by Savvis Communications Corporation, or Savvis, pursuant to a master services agreement dated June 22, 2010, and Interoute Communications Limited, or Interoute, pursuant to a master agreement dated March 31, 2008. Under these agreements, Savvis and Interoute provide us with data center space in various locations. The Savvis agreement had an initial term of 24 months; upon the completion of this initial term, services have automatically continued to renew for successive one month periods. The provision of renewed service for such successive one month periods may be terminated by either party upon the provision of upon written notice, subject to applicable cure periods if the other party has materially breached its obligations under the agreement. As of December 31, 2012, we are seeking to negotiate a 24 month renewal under the original master services agreement. The Interoute agreement has an initial term of three years, which is automatically renewed for additional one-year terms, unless terminated (i) immediately upon written notice, subject to applicable cure periods, if the other party has materially breached its obligations, or breached certain specific obligations under the agreement or (ii) by Interoute in the event that we engage in fraud, fail to make undisputed payments or violate certain Interoute policies.
Competition
The expanding capabilities of our security and compliance solutions have enabled us to address a growing array of opportunities in the cloud IT security and compliance market. We compete with a large and broad array of established and emerging vulnerability management vendors, compliance vendors and data security vendors in a highly fragmented and competitive environment.
We compete with large public companies, such as Hewlett-Packard Company, Imperva, Inc., International Business Machines Corporation, McAfee, Inc. (a subsidiary of Intel Corporation) and Symantec Corporation, as well as private security providers including Barracuda Networks, Inc., BeyondTrust Software, Inc., Lumension Security, Inc., nCircle Network Security, Inc., NetIQ Corporation, Rapid7 LLC, Tenable Network Security, Inc. and Trustwave Holdings, Inc. We also seek to replace IT security and compliance solutions that organizations have developed internally. As we continue to extend our cloud platform’s functionality by further developing security and compliance solutions, such as web application scanning and firewalls, we expect to face additional competition in these new markets.
-10-
Table of Contents
We believe that the principal competitive factors affecting the market for cloud security and compliance solutions include product functionality, breadth of offerings, flexibility of delivery models, ease of deployment and use, total cost of ownership, scalability and performance, customer support and extensibility of platform. We believe that our suite of solutions generally competes favorably with respect to these factors. However, many of our primary competitors have greater name recognition, longer operating histories, more established customer relationships, larger marketing budgets and significantly greater resources than we do.
Intellectual Property
We rely on a combination of trade secrets, copyrights, patents and trademarks, as well as contractual protections, to establish and protect our intellectual property rights and protect our proprietary technology. We have one issued patent, several pending U.S. patent applications and an inbound license to four U.S. patents, which was obtained in connection with our acquisition of Nemean. The inbound license remains in effect until the licensed patents are no longer enforceable, unless the applicable license agreement is first terminated by us or terminated by the licensor for a breach of the agreement or if we undergo certain bankruptcy events. The licenses are currently exclusive and will remain exclusive so long as we make an appropriately-timed written election and pay an annual fixed royalty for ten years thereafter. These exclusive licenses are subject to the licensor’s reservation of certain rights in the patents and subject to the U.S. government’s reserved rights in the technology. We have a number of registered and unregistered trademarks. We require our employees, consultants and other third parties to enter into confidentiality and proprietary rights agreements and control access to software, documentation and other proprietary information. We view our trade secrets and know-how as a significant component of our intellectual property assets, as we have spent years designing and developing our QualysGuard Cloud Platform, which we believe differentiates us from our competitors.
Despite our efforts to protect our proprietary technology and our intellectual property rights, unauthorized parties may attempt to copy or obtain and use our technology to develop products with the same functionality as our solution. Policing unauthorized use of our technology and intellectual property rights is difficult.
We expect that software and other solutions in our industry may be subject to third-party infringement claims as the number of competitors grows and the functionality of products in different industry segments overlaps. Any of these third parties might make a claim of infringement against us at any time.
Employees
As of December 31, 2012, we had 359 full-time employees, including 123 in research and development, 137 in sales and marketing, 58 in operations and customer support and 41 in general and administrative. As of December 31, 2012, we had 264 employees in the United States and 95 employees internationally. None of our U.S. employees are covered by collective bargaining agreements. Employees in certain European countries have the benefits of collective bargaining arrangements at the national level. We believe our employee relations are good and we have not experienced any work stoppages.
Available Information
Our principal executive offices are located at 1600 Bridge Parkway, Redwood City, California 94065. The telephone number of our principal executive offices is (650) 801-6100, and our main corporate website is www.qualys.com. Information contained on, or that can be accessed through, our website, does not constitute part of this Annual Report on Form 10-K and inclusion of our website address in this Annual Report on Form 10-K is an inactive textual reference only.
-11-
Table of Contents
We make available our Annual Reports on Form 10-K, Quarterly Reports on Form 10-Q, Current Reports on Form 8-K and amendments to those reports filed or furnished pursuant to Section 13(a) or Section 15(d) of the Securities Exchange Act of 1934, as amended, free of charge on our website, www.qualys.com as soon as reasonably practicable after they are electronically filed with or furnished to the Securities and Exchange Commission or SEC. Additionally, copies of materials filed by us with the SEC may be accessed at the SEC’s Public Reference Room at 100 F Street, N.E., Washington, D.C. 20549 or at the SEC’s website, www.sec.gov. For information about the SEC’s Public Reference Room, contact 1-800-SEC-0330.
-12-
Table of Contents
| Item 1A. | Risk Factors |
An investment in our common stock involves a high degree of risk. You should carefully consider the risks and uncertainties described below, and all other information contained in this Annual Report on Form 10-K, including our consolidated financial statements and the related notes, before making a decision to invest in our common stock. Our business, operating results, financial condition, or prospects could be materially and adversely affected by any of these risks and uncertainties. In that case, the trading price of our common stock could decline, and you might lose all or part or all of your investment. In addition, the risks and uncertainties discussed below are not the only ones we face. Our business, operating results, financial performance or prospects could also be harmed by risks and uncertainties not currently known to us or that we currently do not believe are material.
We have a limited history of profitability and may not achieve or maintain profitability in the future.
We have not been consistently profitable on a quarterly or annual basis. While we have experienced significant revenue growth over recent years, we may not be able to sustain or increase our growth or return to profitability in the future. Although we had net income for each of the three years ended December 31, 2012, 2011 and 2010, we had net losses in the fourth quarter of 2011 and in the first two quarters of 2012. The net losses were primarily due to increased sales and marketing activities during those quarters as we continued to expand our worldwide customer base as well as focus on the promotion of our new solutions. We plan to continue to invest in our infrastructure, new solutions, research and development and sales and marketing, and as a result, we cannot assure you that we will maintain profitability. In addition, as a public company, we incur significant accounting, legal and other expenses that we did not incur as a private company. As a result of these increased expenditures, we will have to generate and sustain increased revenues to achieve future profitability. We may incur losses in the future for a number of reasons, including without limitation, the other risks and uncertainties described in this Annual Report on Form 10-K. Additionally, we may encounter unforeseen operating expenses, difficulties, complications, delays and other unknown factors that may result in losses in future periods. If our revenue growth does not meet our expectations in future periods, our financial performance may be harmed and we may not again achieve or maintain profitability in the future.
If the market for cloud solutions for IT security and compliance does not evolve as we anticipate, our revenues may not grow and our operating results would be harmed.
Our success depends to a significant extent on the willingness of organizations to increase their use of cloud solutions for their IT security and compliance. However, the market for cloud solutions for IT security and compliance is at an early stage relative to on-premise solutions, and as such, it is difficult to predict important market trends, including the potential growth, if any, of the market for cloud security and compliance solutions. To date, some organizations have been reluctant to use cloud solutions because they have concerns regarding the risks associated with the reliability or security of the technology delivery model associated with these solutions. If other cloud service providers experience security incidents, loss of customer data, disruptions in service delivery or other problems, the market for cloud solutions as a whole, including our solutions, may be negatively impacted. Moreover, many organizations have invested substantial personnel and financial resources to integrate on-premise software into their businesses, and as a result may be reluctant or unwilling to migrate to a cloud solution. Organizations that use on-premise security products, such as network firewalls, security information and event management products or data loss prevention solutions, may also believe that these products sufficiently protect their IT infrastructure and deliver adequate security. Therefore, they may continue spending their IT security budgets on these products and may not adopt our security and compliance solutions in addition to or as a replacement for such products.
If the market for cloud solutions for IT security and compliance does not evolve in the way we anticipate or if customers do not recognize the benefits of our cloud solutions over traditional on-premise
-13-
Table of Contents
enterprise software products, and as a result we are unable to increase sales of subscriptions to our solutions, then our revenues may not grow or may decline, and our operating results would be harmed.
If we do not successfully anticipate market needs and opportunities or are unable to enhance our solutions and develop new solutions that meet those needs and opportunities on a timely basis, we may not be able to compete effectively and our business and financial condition may be harmed.
The IT security and compliance market is characterized by rapid technological advances, changes in customer requirements, frequent new product introductions and enhancements and evolving industry standards and regulatory mandates. We must also continually change and improve our solutions in response to changes in operating systems, application software, computer and communications hardware, networking software, data center architectures, programming tools and computer language technology.
We may not be able to anticipate future market needs and opportunities or develop enhancements or new solutions to meet such needs or opportunities in a timely manner or at all. The market for cloud solutions for IT security and compliance is relatively new, and it is uncertain whether our new solutions will gain market acceptance.
Our solution enhancements or new solutions could fail to attain sufficient market acceptance for many reasons, including:
| • | failure to timely meet market demand for product functionality; |
| • | inability to identify and provide intelligence regarding the attacks or techniques used by cyber attackers; |
| • | inability to interoperate effectively with the database technologies, file systems or web applications of our prospective customers; |
| • | defects, errors or failures; |
| • | delays in releasing our enhancements or new solutions; |
| • | negative publicity about their performance or effectiveness; |
| • | introduction or anticipated introduction of products by our competitors; |
| • | poor business conditions, causing customers to delay IT security and compliance purchases; |
| • | easing or changing of external regulations related to IT security and compliance; and |
| • | reluctance of customers to purchase cloud solutions for IT security and compliance. |
Furthermore, diversifying our solutions and expanding into new IT security and compliance markets will require significant investment and planning, require that our research and development and sales and marketing organizations develop expertise in these new markets, bring us more directly into competition with security and compliance providers that may be better established or have greater resources than we do, require additional investment of time and resources in the development and training of our channel partners and entail significant risk of failure.
If we fail to anticipate market requirements or fail to develop and introduce solution enhancements or new solutions to satisfy those requirements in a timely manner, such failure could substantially decrease or delay market acceptance and sales of our present and future solutions and cause us to lose existing customers or fail to gain new customers, which would significantly harm our business, financial condition and results of operations.
-14-
Table of Contents
If we fail to continue to effectively scale and adapt our platform to meet the performance and other requirements of our customers, our operating results and our business would be harmed.
Our future growth is dependent upon our ability to continue to meet the expanding needs of our customers as their use of our cloud platform grows. As these customers gain more experience with our solutions, the number of users and the number of locations where our solutions are being accessed may expand rapidly in the future. In order to ensure that we meet the performance and other requirements of our customers, we intend to continue to make significant investments to develop and implement new proprietary and third-party technologies at all levels of our cloud platform. These technologies, which include databases, applications and server optimizations, and network and hosting strategies, are often complex, new and unproven. We may not be successful in developing or implementing these technologies. To the extent that we do not effectively scale our platform to maintain performance as our customers expand their use of our platform, our operating results and our business may be harmed.
Our quarterly operating results may vary from period to period, which could result in our failure to meet expectations with respect to operating results and cause the trading price of our stock to decline.
Our operating results have historically varied from period to period, and we expect that they will continue to do so as a result of a number of factors, many of which are outside of our control, including:
| • | the level of demand for our solutions; |
| • | changes in customer renewals of our solutions; |
| • | the extent to which customers subscribe for additional solutions; |
| • | seasonal buying patterns of our customers; |
| • | the level of perceived threats to IT security; |
| • | security breaches, technical difficulties or interruptions with our service; |
| • | changes in the growth rate of the IT security and compliance market; |
| • | the timing and success of new product or service introductions by us or our competitors or any other changes in the competitive landscape of our industry, including consolidation among our competitors; |
| • | the introduction or adoption of new technologies that compete with our solutions; |
| • | decisions by potential customers to purchase IT security and compliance products or services from other vendors; |
| • | the amount and timing of operating costs and capital expenditures related to the operations and expansion of our business; |
| • | the timing of sales commissions relative to the recognition of revenues; |
| • | the announcement or adoption of new regulations and policy mandates or changes to existing regulations and policy mandates; |
| • | price competition; |
| • | insolvency or credit difficulties confronting our customers, affecting their ability to purchase or pay for our solutions; |
| • | changes in foreign currency exchange rates; |
| • | general economic conditions, both domestically and in the foreign markets in which we sell our solutions; and |
| • | future accounting pronouncements or changes in our accounting policies. |
-15-
Table of Contents
Each factor above or discussed elsewhere in this Annual Report on Form 10-K or the cumulative effect of some of these factors may result in fluctuations in our operating results. This variability and unpredictability could result in our failure to meet expectations with respect to operating results, or those of securities analysts or investors, for a particular period. In addition, a significant percentage of our operating expenses are fixed in nature and based on forecasted trends in revenues. Accordingly, in the event of shortfalls in revenues, we are generally unable to mitigate the negative impact on margins in the short term by reducing our operating expenses. If we fail to meet or exceed expectations for our operating results for these or any other reasons, the trading price of our common stock could fall and we could face costly lawsuits, including securities class action suits.
Adverse economic conditions or reduced IT spending may adversely impact our business.
Our business depends on the overall demand for IT and on the economic health of our current and prospective customers. In general, worldwide economic conditions remain unstable, and these conditions make it difficult for our customers, prospective customers and us to forecast and plan future business activities accurately, and they could cause our customers or prospective customers to reevaluate their decision to purchase our solutions. Weak global economic conditions, or a reduction in IT spending even if economic conditions improve, could adversely impact our business, financial condition and results of operations in a number of ways, including longer sales cycles, lower prices for our solutions, reduced bookings and lower or no growth.
Our business depends substantially on retaining our current customers, and any reduction in our customer renewals or revenues from such customers could harm our future operating results.
We offer our QualysGuard Cloud Platform and integrated suite of solutions pursuant to a software-as-a-service model, and our customers purchase subscriptions from us that are generally one year in length. Our customers have no obligation to renew their subscriptions after their subscription period expires, and they may not renew their subscriptions at the same or higher levels or at all. As a result, our ability to grow depends in part on customers renewing their existing subscriptions and purchasing additional subscriptions and solutions. Our customers may choose not to renew their subscriptions to our solutions or purchase additional solutions due to a number of factors, including their satisfaction or dissatisfaction with our solutions, the prices of our solutions, the prices of products or services offered by our competitors, reductions in our customers’ spending levels due to the macroeconomic environment or other factors. If our customers do not renew their subscriptions to our solutions, renew on less favorable terms, or do not purchase additional solutions or subscriptions, our revenues may grow more slowly than expected or decline and our results of operations may be harmed.
If we are unable to continue to attract new customers and grow our customer base, our growth could be slower than we expect and our business may be harmed.
We believe that our future growth depends in part upon increasing our customer base. Our ability to achieve significant growth in revenues in the future will depend, in large part, upon continually attracting new customers and obtaining subscription renewals to our solutions from those customers. If we fail to attract new customers our revenues may grow more slowly than expected and our business may be harmed.
Subscriptions to our QualysGuard Vulnerability Management solution generate most of our revenues, and if we are unable to continue to renew and grow subscriptions for this solution, our operating results would suffer.
We derived 87%, 90%, and 92% of our revenues from subscriptions to our QualysGuard Vulnerability Management solution for the years ended December 31, 2012, 2011 and 2010, respectively,
-16-
Table of Contents
and we expect to continue to derive a significant majority of our revenues from sales of subscriptions to this solution for the foreseeable future. As a result, the market demand for our QualysGuard Vulnerability Management solution is critical to our continued success. Demand for this solution is affected by a number of factors beyond our control, including continued market acceptance of our solution for existing and new use cases, the timing of development and release of new products or services by our competitors, technological change, and growth or contraction in our market. Our inability to renew or increase subscriptions for this solution or a decline in price of this solution would harm our business and operating results more seriously than if we derived significant revenues from a variety of solutions.
If we are unable to sell subscriptions to additional solutions, our future revenue growth may be harmed and our business may suffer.
We will need to increase the revenues that we derive from our current and future solutions other than QualysGuard Vulnerability Management for our business and revenues to grow as we expect. Revenues from our other solutions, including our Web Application Scanning, Policy Compliance, PCI Compliance, Malware Detection Service and Qualys SECURE Seal, have been relatively modest compared to revenues from our QualysGuard Vulnerability Management solution. Our future success depends in part on our ability to sell subscriptions to these additional solutions to existing and new customers. This may require more costly sales and marketing efforts and may not result in additional sales. If our efforts to sell subscriptions to additional solutions to existing and new customers are not successful, our business may suffer.
Our security and compliance solutions are primarily delivered from two data centers, and any disruption of service at these facilities would interrupt or delay our ability to deliver our solutions to our customers which could reduce our revenues and harm our operating results.
We currently host substantially all of our solutions from two third-party data centers, located in the United States and Switzerland. These facilities are vulnerable to damage or interruption from earthquakes, hurricanes, floods, fires, cybersecurity attacks, terrorist attacks, employee negligence, power losses, telecommunications failures and similar events. The facilities also could be subject to break-ins, sabotage, intentional acts of vandalism and other misconduct. The occurrence of a natural disaster, an act of terrorism or misconduct, a decision to close the facilities without adequate notice or other unanticipated problems could result in interruptions in our services.
Our data centers are not currently redundant and we cannot rapidly move customers from one data center to another, which may increase delays in the restoration of our service for our customers if an adverse event occurs. We intend to add additional data center facilities in 2013 to provide additional capacity for our cloud platform and enable disaster recovery. These additional facilities may not be operational in the anticipated time frame and we may incur unplanned expenses.
Additionally, our existing data center facilities providers have no obligations to renew their agreements with us on commercially reasonable terms, or at all. If we are unable to renew our agreements with the facilities providers on commercially reasonable terms or if in the future we add additional data center facility providers, we may experience costs or downtime in connection with the loss of an existing facility or the transfer to, or addition of, new data center facilities.
Any disruptions or other performance problems with our solutions could harm our reputation and business and may damage our customers’ businesses. Interruptions in our service delivery might reduce our revenues, cause us to issue credits to customers, subject us to potential liability and cause customers to terminate their subscriptions or not renew their subscriptions.
If we are unable to increase market awareness of our company and our new solutions, our revenues may not continue to grow, or may decline.
We have a limited operating history, particularly in certain markets and solution offerings, and we believe that we need to continue to develop market awareness in the IT security and compliance
-17-
Table of Contents
market. Market awareness of our capabilities and solutions is essential to our continued growth and success in all of our markets, particularly for the large enterprise, service provider and government markets. If our marketing programs are not successful in creating market awareness of our company and our full suite of solutions, our business, financial condition and results of operations may be adversely affected, and we may not be able to achieve our expected growth.
If our solutions fail to help our customers achieve and maintain compliance with regulations and industry standards, our revenues and operating results could be harmed.
We generate a portion of our revenues from solutions that help organizations achieve and maintain compliance with regulations and industry standards. For example, many of our customers subscribe to our security and compliance solutions to help them comply with the security standards developed and maintained by the Payment Card Industry Security Standards Council, or the PCI Council, which apply to companies that store cardholder data. Industry organizations like the PCI Council may significantly change their security standards with little or no notice, including changes that could make their standards more or less onerous for businesses. Governments may also adopt new laws or regulations, or make changes to existing laws or regulations, that could impact the demand for or value of our solutions.
If we are unable to adapt our solutions to changing regulatory standards in a timely manner, or if our solutions fail to assist with or expedite our customers’ compliance initiatives, our customers may lose confidence in our solutions and could switch to products offered by our competitors. In addition, if regulations and standards related to data security, vulnerability management and other IT security and compliance requirements are relaxed or the penalties for non-compliance are changed in a manner that makes them less onerous, our customers may view government and industry regulatory compliance as less critical to their businesses, and our customers may be less willing to purchase our solutions. In any of these cases, our revenues and operating results could be harmed.
If our solutions fail to detect vulnerabilities or incorrectly detect vulnerabilities, our brand and reputation could be harmed, which could have an adverse effect on our business and results of operations.
If our solutions fail to detect vulnerabilities in our customers’ IT infrastructures, or if our solutions fail to identify and respond to new and increasingly complex methods of attacks, our business and reputation may suffer. There is no guarantee that our solutions will detect all vulnerabilities. Additionally, our security and compliance solutions may falsely detect vulnerabilities or threats that do not actually exist. For example, some of our solutions rely on information on attack sources aggregated from third-party data providers who monitor global malicious activity originating from a variety of sources, including anonymous proxies, specific IP addresses, botnets and phishing sites. If the information from these data providers is inaccurate, the potential for false indications of security vulnerabilities increases. These false positives, while typical in the industry, may impair the perceived reliability of our solutions and may therefore adversely impact market acceptance of our solutions and could result in negative publicity, loss of customers and sales and increased costs to remedy any problem.
In addition, our solutions do not currently extend to cover mobile devices or personal devices that employees may bring into an organization. As such, our solutions would not identify or address vulnerabilities in mobile devices, such as mobile phones or tablets, or personal devices, and our customers’ IT infrastructures may be compromised by attacks that infiltrate their networks through such devices.
An actual or perceived security breach or theft of the sensitive data of one of our customers, regardless of whether the breach is attributable to the failure of our solutions, could adversely affect the market’s perception of our security solutions.
-18-
Table of Contents
Incorrect or improper implementation or use of our solutions could result in customer dissatisfaction and harm our business and reputation.
Our solutions are deployed in a wide variety of IT environments, including large-scale, complex infrastructures. If our customers are unable to implement our solutions successfully, customer perceptions of our platform may be impaired or our reputation and brand may suffer. Our customers have in the past inadvertently misused our solutions, which triggered downtime in their internal infrastructure until the problem was resolved. Any misuse of our solutions could result in customer dissatisfaction, impact the perceived reliability of our solutions, result in negative press coverage, negatively affect our reputation and harm our financial results.
As a security provider, our platform, website and internal systems may be subject to intentional disruption that could adversely impact our reputation and future sales.
Our operations involve providing IT security solutions to our customers, and as a result we could be a target of cyber attacks designed to impede the performance of our solutions, penetrate our network security or the security of our cloud platform or our internal systems, misappropriate proprietary information and/or cause interruptions to our services. If an actual or perceived breach of our network security occurs, it could adversely affect the market perception of our solutions, negatively affecting our reputation, and may expose us to the loss of information, litigation and possible liability. Such a security breach could also divert the efforts of our technical and management personnel. In addition, such a security breach could impair our ability to operate our business and provide solutions to our customers. If this happens, our reputation could be harmed, our revenues could decline and our business could suffer.
Undetected software errors or flaws in our cloud platform could harm our reputation or decrease market acceptance of our solutions, which would harm our operating results.
Our solutions may contain undetected errors or defects when first introduced or as new versions are released. We have experienced these errors or defects in the past in connection with new solutions and solution upgrades and we expect that these errors or defects will be found from time to time in the future in new or enhanced solutions after commercial release of these solutions. Since our customers use our solutions for security and compliance reasons, any errors, defects, disruptions in service or other performance problems with our solutions may damage our customers’ business and could hurt our reputation. If that occurs, we may incur significant costs, the attention of our key personnel could be diverted, our customers may delay or withhold payment to us or elect not to renew, or other significant customer relations problems may arise. We may also be subject to liability claims for damages related to errors or defects in our solutions. A material liability claim or other occurrence that harms our reputation or decreases market acceptance of our solutions may harm our business and operating results.
Our solutions could be used to collect and store personal information of our customers’ employees or customers, and therefore privacy concerns could result in additional cost and liability to us or inhibit sales of our solutions.
We collect the names and email addresses of our customers in connection with subscriptions to our solutions. Additionally, the data that our solutions collect to help secure and protect the IT infrastructure of our customers may include additional personal information of our customers’ employees and their customers. Personal privacy has become a significant issue in the United States and in many other countries where we offer our solutions. The regulatory framework for privacy issues worldwide is currently evolving and is likely to remain uncertain for the foreseeable future. Many federal, state and foreign government bodies and agencies have adopted or are considering adopting laws and regulations regarding the collection, use, disclosure and retention of personal information. In the United States, these include, for example, rules and regulations promulgated under the authority of
-19-
Table of Contents
the Federal Trade Commission, the Health Insurance Portability and Accountability Act of 1996, or HIPAA, the Gramm-Leach-Bliley Act, or GLB, and state breach notification laws. Internationally, virtually every jurisdiction in which we operate has established its own data security and privacy legal framework with which we or our customers must comply, including the Data Protection Directive established in the European Union and the Federal Data Protection Act passed in Germany.
In addition to laws and regulations, privacy advocacy and industry groups or other private parties may propose new and different privacy standards that either legally or contractually apply to us. Because the interpretation and application of privacy and data protection laws and privacy standards are still uncertain, it is possible that these laws or privacy standards may be interpreted and applied in a manner that is inconsistent with our existing data management practices or the features of our solutions. If so, in addition to the possibility of fines, lawsuits and other claims, we could be required to fundamentally change our business activities and practices or modify our solutions, which could have an adverse effect on our business. Any inability to adequately address privacy concerns, even if unfounded, or comply with applicable privacy or data protection laws, regulations and privacy standards, could result in additional cost and liability to us, damage our reputation, inhibit sales of subscriptions and harm our business.
Furthermore, the costs of compliance with, and other burdens imposed by, the laws, regulations, and privacy standards that are applicable to the businesses of our customers may limit the use and adoption of, and reduce the overall demand for, our solutions. Privacy concerns, whether valid or not valid, may inhibit market adoption of our solutions particularly in certain industries and foreign countries.
Disruptive technologies could gain wide adoption and supplant our cloud security and compliance solutions, thereby weakening our sales and harming our results of operations.
The introduction of products and services embodying new technologies could render our existing solutions obsolete or less attractive to customers. Our business could be harmed if new security and compliance technologies are widely adopted. We may not be able to successfully anticipate or adapt to changing technology or customer requirements on a timely basis, or at all. If we fail to keep up with technological changes or to convince our customers and potential customers of the value of our solutions even in light of new technologies, our business could be harmed and our revenues may decline.
We face competition in our markets, and we may lack sufficient financial or other resources to maintain or improve our competitive position.
We compete with a large range of established and emerging vulnerability management vendors, compliance vendors and data security vendors in a highly fragmented and competitive environment. We face significant competition for each of our solutions from companies with broad product suites and greater name recognition and resources than we have, as well as from small companies focused on specialized security solutions.
We compete with large public companies, such as Hewlett-Packard Company, Imperva, Inc., International Business Machines Corporation, McAfee, Inc. (a subsidiary of Intel Corporation), and Symantec Corporation, as well as private security providers including Barracuda Networks, Inc., BeyondTrust Software, Inc., Lumension Security, Inc., nCircle Network Security, Inc., NetIQ Corporation, Rapid7 LLC, Tenable Network Security, Inc. and Trustwave Holdings, Inc. We also seek to replace IT security and compliance solutions that organizations have developed internally. As we continue to extend our cloud platform’s functionality by further developing security and compliance solutions, such as web application scanning and firewalls, we expect to face additional competition in these new markets. Our competitors may also attempt to further expand their presence in the IT security and compliance market and compete more directly against one or more of our solutions.
-20-
Table of Contents
We believe that the principal competitive factors affecting our markets include product functionality, breadth of offerings, flexibility of delivery models, ease of deployment and use, total cost of ownership, scalability and performance, customer support and extensibility of platform. Many of our existing and potential competitors have competitive advantages, including:
| • | greater brand name recognition; |
| • | larger sales and marketing budgets and resources; |
| • | broader distribution networks and more established relationships with distributors and customers; |
| • | access to larger customer bases; |
| • | greater customer support resources; |
| • | greater resources to make acquisitions; |
| • | greater resources to develop and introduce products that compete with our solutions; |
| • | greater resources to meet relevant regulatory requirements; and |
| • | substantially greater financial, technical and other resources. |
As a result, our competitors may be able to respond more quickly and effectively than we can to new or changing opportunities, technologies, standards or customer requirements. With the introduction of new technologies, the evolution of our service and new market entrants, we expect competition to intensify in the future.
In addition, some of our larger competitors have substantially broader product offerings and can bundle competing products and services with other software offerings. As a result, customers may choose a bundled product offering from our competitors, even if individual products have more limited functionality than our solutions. These competitors may also offer their products at a lower price as part of this larger sale, which could increase pricing pressure on our solutions and cause the average sales price for our solutions to decline. These larger competitors are also often in a better position to withstand any significant reduction in capital spending, and will therefore not be as susceptible to economic downturns.
Furthermore, our current and potential competitors may establish cooperative relationships among themselves or with third parties that may further enhance their resources and product and services offerings in the markets we address. In addition, current or potential competitors may be acquired by third parties with greater available resources. As a result of such relationships and acquisitions, our current or potential competitors might be able to adapt more quickly to new technologies and customer needs, devote greater resources to the promotion or sale of their products and services, initiate or withstand substantial price competition, take advantage of other opportunities more readily or develop and expand their product and service offerings more quickly than we do. For all of these reasons, we may not be able to compete successfully against our current or future competitors.
Our business and operations have experienced rapid growth, and if we do not appropriately manage any future growth, or are unable to improve our systems and processes, our operating results may be negatively affected.
We have experienced rapid growth over the last several years. From 2010 to 2012, our revenues have grown from $65.4 million to $91.4 million, and our headcount increased from 232 employees at the beginning of 2010 to 359 employees at December 31, 2012. We rely on information technology systems to help manage critical functions such as order processing, revenue recognition and financial forecasts. To manage any future growth effectively we must continue to improve and expand our IT systems, financial infrastructure, and operating and administrative systems and controls, and continue
-21-
Table of Contents
to manage headcount, capital and processes in an efficient manner. We may not be able to successfully implement improvements to these systems and processes in a timely or efficient manner.
Our failure to improve our systems and processes, or their failure to operate in the intended manner, may result in our inability to manage the growth of our business and to accurately forecast our revenues, expenses and earnings, or to prevent certain losses. In addition, as we continue to grow, our productivity and the quality of our solutions may also be adversely affected if we do not integrate and train our new employees quickly and effectively. Any future growth would add complexity to our organization and require effective coordination across our organization. Failure to manage any future growth effectively could result in increased costs, harm our results of operations and lead to investors losing confidence in our internal systems and processes.
Forecasts of market growth may prove to be inaccurate, and even if the markets in which we compete achieve the forecasted growth, there can be no assurance that our business will grow at similar rates, or at all.
Growth forecasts relating to the expected growth in the market for IT security and compliance and other markets are subject to significant uncertainty and are based on assumptions and estimates which may prove to be inaccurate. Even if these markets experience the forecasted growth, we may not grow our business at similar rates, or at all. Our growth is subject to many factors, including our success in implementing our business strategy, which is subject to many risks and uncertainties. Accordingly, the forecasts of market growth included in this Annual Report on Form 10-K should not be taken as indicative of our future growth.
If we are unable to continue the expansion of our sales force, sales of our solutions and the growth of our business would be harmed.
We believe that our growth will depend, to a significant extent, on our success in recruiting and retaining a sufficient number of qualified sales personnel and their ability to obtain new customers, manage our existing customer base and expand the sales of our newer solutions. We plan to continue to expand our sales force and make significant investment in our sales and marketing activities. Our recent hires and planned hires may not become as productive as quickly as we would like, and we may be unable to hire or retain sufficient numbers of qualified individuals in the future in the markets where we do business. If we are unable to recruit and retain a sufficient number of productive sales personnel, sales of our solutions and the growth of our business may be harmed. Additionally, if our efforts do not result in increased revenues, our operating results could be negatively impacted due to the upfront operating expenses associated with expanding our sales force.
Our sales cycle can be long and unpredictable, and our sales efforts require considerable time and expense. As a result, revenues may vary from period to period, which may cause our operating results to fluctuate and could harm our business.
The timing of sales of subscriptions for our solutions is difficult to forecast because of the length and unpredictability of our sales cycle, particularly with large enterprises. We sell subscriptions to our security and compliance solutions primarily to IT departments that are managing a growing set of user and compliance demands, which has increased the complexity of customer requirements to be met and confirmed during the sales cycle and prolonged our sales cycle. Further, the length of time that potential customers devote to their testing and evaluation, contract negotiation and budgeting processes varies significantly, which has also made our sales cycle long and unpredictable. The length of the sales cycle for our solutions typically ranges from six to twelve months but can be more than eighteen months. In addition, we might devote substantial time and effort to a particular unsuccessful sales effort, and as a result we could lose other sales opportunities or incur expenses that are not offset by an increase in revenues, which could harm our business.
-22-
Table of Contents
We rely on third-party channel partners to generate a substantial amount of our revenues, and if we fail to expand and manage our distribution channels, our revenues could decline and our growth prospects could suffer.
Our success is significantly dependent upon establishing and maintaining relationships with a variety of channel partners and we anticipate that we will continue to depend on these partners in order to grow our business. For 2012, 2011 and 2010, we derived approximately 40%, 38% and 33%, respectively, of our revenues from sales of subscriptions for our solutions through channel partners, and the percentage of revenues derived from channel partners may increase in future periods. Additionally, one of our channel partners, Dell, Inc. accounted for 5%, 4% and 3% of our revenues for the years ended December 31, 2012, 2011 and 2010, respectively. Our agreements with our channel partners are generally non-exclusive and do not prohibit them from working with our competitors or offering competing solutions, and many of our channel partners have more established relationships with our competitors. If our channel partners choose to place greater emphasis on products of their own or those offered by our competitors, do not effectively market and sell our solutions, or fail to meet the needs of our customers, then our ability to grow our business and sell our solutions may be adversely affected. In addition, the loss of one or more of our larger channel partners, who may cease marketing our solutions with limited or no notice, and our possible inability to replace them, could adversely affect our sales. Moreover, our ability to expand our distribution channels depends in part on our ability to educate our channel partners about our solutions, which can be complex. Our failure to recruit additional channel partners, or any reduction or delay in their sales of our solutions or conflicts between channel sales and our direct sales and marketing activities may harm our results of operations. Even if we are successful, these relationships may not result in greater customer usage of our solutions or increased revenues.
We rely on software-as-a-service vendors to operate certain functions of our business and any failure of such vendors to provide services to us could adversely impact our business and operations.
We rely on software-as-a-service vendors to operate certain critical functions of our business, including financial management and human resource management. If these services become unavailable due to extended outages or interruptions or because they are no longer available on commercially reasonable terms or prices, our expenses could increase, our ability to manage our finances could be interrupted and our processes for managing sales of our solutions and supporting our customers could be impaired until equivalent services, if available, are identified, obtained and integrated, all of which could harm our business.
We use third-party software and data that may be difficult to replace or cause errors or failures of our solutions that could lead to lost customers or harm to our reputation and our operating results.
We license third-party software as well as security and compliance data from various third parties to deliver our solutions. In the future, this software or data may not be available to us on commercially reasonable terms, or at all. Any loss of the right to use any of this software or data could result in delays in the provisioning of our solutions until equivalent technology or data is either developed by us, or, if available, is identified, obtained and integrated, which could harm our business. In addition, any errors or defects in or failures of this third-party software could result in errors or defects in our solutions or cause our solutions to fail, which could harm our business and be costly to correct. Many of these providers attempt to impose limitations on their liability for such errors, defects or failures, and if enforceable, we may have additional liability to our customers or third-party providers that could harm our reputation and increase our operating costs.
We will need to maintain our relationships with third-party software and data providers, and to obtain software and data from such providers that does not contain any errors or defects. Any failure to do so could adversely impact our ability to deliver effective solutions to our customers and could harm our operating results.
-23-
Table of Contents
Our solutions contain third-party open source software components, and our failure to comply with the terms of the underlying open source software licenses could restrict our ability to sell our solutions.
Our solutions contain software licensed to us by third-parties under so-called “open source” licenses, including the GNU General Public License, or GPL, the GNU Lesser General Public License, or LGPL, the BSD License, the Apache License and others. From time to time, there have been claims against companies that distribute or use open source software in their products and services, asserting that such open source software infringes the claimants’ intellectual property rights. We could be subject to suits by parties claiming that what we believe to be licensed open source software infringes their intellectual property rights. Use and distribution of open source software may entail greater risks than use of third-party commercial software, as open source licensors generally do not provide warranties or other contractual protections regarding infringement claims or the quality of the code. In addition, certain open source licenses require that source code for software programs that are subject to the license be made available to the public and that any modifications or derivative works to such open source software continue to be licensed under the same terms. If we combine our proprietary software with open source software in certain ways, we could, in some circumstances, be required to release the source code of our proprietary software to the public. Disclosing the source code of our proprietary software could make it easier for cyber attackers and other third parties to discover vulnerabilities in or to defeat the protections of our solutions, which could result in our solutions failing to provide our customers with the security they expect from our services. This could harm our business and reputation. Disclosing our proprietary source code also could allow our competitors to create similar products with lower development effort and time and ultimately could result in a loss of sales for us. Any of these events could have a material adverse effect on our business, operating results and financial condition.
Although we monitor our use of open source software in an effort both to comply with the terms of the applicable open source licenses and to avoid subjecting our solutions to conditions we do not intend, the terms of many open source licenses have not been interpreted by U.S. courts, and there is a risk that these licenses could be construed in a way that could impose unanticipated conditions or restrictions on our ability to commercialize our solutions. In this event, we could be required to seek licenses from third parties to continue offering our solutions, to make our proprietary code generally available in source code form, to re-engineer our solutions or to discontinue the sale of our solutions if re-engineering could not be accomplished on a timely basis, any of which could adversely affect our business, operating results and financial condition.
Delays or interruptions in the manufacturing and delivery of our physical scanner appliances by our sole source manufacturer may harm our business.
Upon customer request, we provide physical or virtual scanner appliances on a subscription basis as an additional capability to the customer’s subscription for use during their subscription term. Our physical scanner appliances are built by a single manufacturer. Our reliance on a sole manufacturer involves several risks, including a potential inability to obtain an adequate supply of physical scanner appliances and limited control over pricing, quality and timely deployment of such scanner appliances. In addition, replacing this manufacturer may be difficult and could result in an inability or delay in deploying our solutions to customers that request physical scanner appliances as part of their subscriptions.
Furthermore, our manufacturer’s ability to timely manufacture and ship our physical scanner appliances depends on a variety of factors, such as the availability of hardware components, supply shortages or contractual restrictions. In the event of an interruption from this manufacturer, we may not be able to develop alternate or secondary sources in a timely manner. If we are unable to purchase physical scanner appliances in quantities sufficient to meet our requirements on a timely basis, we may not be able to effectively deploy our solutions to new customers that request physical scanner appliances, which could harm our business.
-24-
Table of Contents
A significant portion of our customers and channel partners are located outside of the United States, which subjects us to a number of risks associated with conducting international operations and if we are unable to successfully manage these risks, our business and operating results could be harmed.
We market and sell subscriptions to our solutions throughout the world and have personnel in many parts of the world. In addition, we have sales offices and research and development facilities outside the United States and we conduct, and expect to continue to conduct, a significant amount of our business with organizations that are located outside the United States, particularly in Europe and Asia. Therefore, we are subject to risks associated with having international sales and worldwide operations, including:
| • | foreign currency exchange fluctuations; |
| • | trade and foreign exchange restrictions; |
| • | economic or political instability in foreign markets; |
| • | greater difficulty in enforcing contracts, accounts receivable collection and longer collection periods; |
| • | changes in regulatory requirements; |
| • | difficulties and costs of staffing and managing foreign operations; |
| • | the uncertainty and limitation of protection for intellectual property rights in some countries; |
| • | costs of compliance with foreign laws and regulations and the risks and costs of non-compliance with such laws and regulations; |
| • | costs of complying with U.S. laws and regulations for foreign operations, including the Foreign Corrupt Practices Act, import and export control laws, tariffs, trade barriers, economic sanctions and other regulatory or contractual limitations on our ability to sell our solutions in certain foreign markets, and the risks and costs of non-compliance; |
| • | heightened risks of unfair or corrupt business practices in certain geographies and of improper or fraudulent sales arrangements that may impact financial results and result in restatements of, and irregularities in, financial statements; |
| • | the potential for political unrest, acts of terrorism, hostilities or war; |
| • | management communication and integration problems resulting from cultural differences and geographic dispersion; and |
| • | multiple and possibly overlapping tax structures. |
Our business, including the sales of subscriptions of our solutions, may be subject to foreign governmental regulations, which vary substantially from country to country and change from time to time. Failure to comply with these regulations could adversely affect our business. Further, in many foreign countries it is common for others to engage in business practices that are prohibited by our internal policies and procedures or U.S. regulations applicable to us. Although we have implemented policies and procedures designed to ensure compliance with these laws and policies, there can be no assurance that all of our employees, contractors, channel partners and agents have complied or will comply with these laws and policies. Violations of laws or key control policies by our employees, contractors, channel partners or agents could result in delays in revenue recognition, financial reporting misstatements, fines, penalties or the prohibition of the importation or exportation of our solutions and could have a material adverse effect on our business and results of operations. If we are unable to successfully manage the challenges of international operations, our business and operating results could be adversely affected.
-25-
Table of Contents
We are exposed to fluctuations in currency exchange rates, which could negatively affect our financial condition and results of operations.
Our reporting currency is the U.S. dollar and we generate a majority of our revenues in U.S. dollars. However, in 2012, we incurred approximately 21% of our expenses outside of the United States in foreign currencies, primarily Euros, principally with respect to salaries and related personnel expenses associated with our European operations. Additionally, in 2012, approximately 21% of our revenues were generated in foreign currencies. Accordingly, changes in exchange rates may have a material adverse effect on our business, operating results and financial condition. The exchange rate between the U.S. dollar and foreign currencies has fluctuated substantially in recent years and may continue to fluctuate substantially in the future. We expect that a majority of our revenues will continue to be generated in U.S. dollars for the foreseeable future and that a significant portion of our expenses, including personnel costs, as well as capital and operating expenditures, will continue to be denominated in Euros. The results of our operations may be adversely affected by foreign exchange fluctuations.
We use forward foreign exchange contracts to mitigate the effect of changes in foreign exchange rates on cash and accounts receivable balances denominated in certain foreign currencies. However, we may not be able to purchase derivative instruments that are adequate to insulate ourselves from foreign currency exchange risks. Additionally, our hedging activities may contribute to increased losses as a result of volatility in foreign currency markets.
Failure to protect our proprietary technology and intellectual property rights could substantially harm our business and operating results.
The success of our business depends in part on our ability to protect and enforce our trade secrets, trademarks, copyrights, patents and other intellectual property rights. We attempt to protect our intellectual property under copyright, trade secret, patent and trademark laws, and through a combination of confidentiality procedures, contractual provisions and other methods, all of which offer only limited protection.
We primarily rely on our unpatented proprietary technology and trade secrets. Despite our efforts to protect our proprietary technology and trade secrets, unauthorized parties may attempt to misappropriate, reverse engineer or otherwise obtain and use them. The contractual provisions that we enter into with employees, consultants, partners, vendors and customers may not prevent unauthorized use or disclosure of our proprietary technology or intellectual property rights and may not provide an adequate remedy in the event of unauthorized use or disclosure of our proprietary technology or intellectual property rights. Moreover, policing unauthorized use of our technologies, solutions and intellectual property is difficult, expensive and time-consuming, particularly in foreign countries where the laws may not be as protective of intellectual property rights as those in the United States and where mechanisms for enforcement of intellectual property rights may be weak. We may be unable to determine the extent of any unauthorized use or infringement of our solutions, technologies or intellectual property rights.
We have one issued patent and several pending U.S. patent applications, and may file additional patent applications in the future. Additionally, as of December 31, 2012, we had an exclusive license to four third-party patents. The process of obtaining patent protection is expensive and time-consuming, and we may not be able to prosecute all necessary or desirable patent applications at a reasonable cost or in a timely manner, if at all. We may choose not to seek patent protection for certain innovations and may choose not to pursue patent protection in certain jurisdictions. Furthermore, it is possible that our patent applications may not result in granted patents, that the scope of our issued patents will be limited or not provide the coverage originally sought, that our issued patents will not provide us with any competitive advantages, or that our patents and other intellectual property rights may be challenged by others or invalidated through administrative processes or litigation. In addition, issuance of a patent does not guarantee that we have an absolute right to practice the patented invention. As a result, we may not be able to obtain adequate patent protection or to enforce our issued patents effectively.
-26-
Table of Contents
From time to time, legal action by us may be necessary to enforce our patents and other intellectual property rights, to protect our trade secrets, to determine the validity and scope of the intellectual property rights of others or to defend against claims of infringement or invalidity. Such litigation could result in substantial costs and diversion of resources and could negatively affect our business, operating results and financial condition. If we are unable to protect our intellectual property rights, we may find ourselves at a competitive disadvantage to others who need not incur the additional expense, time and effort required to create the innovative solutions that have enabled us to be successful to date.
Assertions by third parties of infringement or other violations by us of their intellectual property rights could result in significant costs and harm our business and operating results.
Patent and other intellectual property disputes are common in our industry. Some companies, including some of our competitors, own large numbers of patents, copyrights and trademarks, which they may use to assert claims against us. Third parties may in the future assert claims of infringement, misappropriation or other violations of intellectual property rights against us. They may also assert such claims against our customers or channel partners whom we typically indemnify against claims that our solutions infringe, misappropriate or otherwise violate the intellectual property rights of third parties. As the numbers of products and competitors in our market increase and overlaps occur, claims of infringement, misappropriation and other violations of intellectual property rights may increase. Any claim of infringement, misappropriation or other violation of intellectual property rights by a third party, even those without merit, could cause us to incur substantial costs defending against the claim and could distract our management from our business.
The patent portfolios of our most significant competitors are larger than ours. This disparity may increase the risk that they may sue us for patent infringement and may limit our ability to counterclaim for patent infringement or settle through patent cross-licenses. In addition, future assertions of patent rights by third parties, and any resulting litigation, may involve patent holding companies or other adverse patent owners who have no relevant product revenues and against whom our own patents may therefore provide little or no deterrence or protection. There can be no assurance that we will not be found to infringe or otherwise violate any third-party intellectual property rights or to have done so in the past.
An adverse outcome of a dispute may require us to:
| • | pay substantial damages, including treble damages, if we are found to have willfully infringed a third party’s patents or copyrights; |
| • | cease making, licensing or using solutions that are alleged to infringe or misappropriate the intellectual property of others; |
| • | expend additional development resources to attempt to redesign our solutions or otherwise develop non-infringing technology, which may not be successful; |
| • | enter into potentially unfavorable royalty or license agreements in order to obtain the right to use necessary technologies or intellectual property rights; and |
| • | indemnify our partners and other third parties. |
In addition, royalty or licensing agreements, if required or desirable, may be unavailable on terms acceptable to us, or at all, and may require significant royalty payments and other expenditures. Some licenses may also be non-exclusive, and therefore our competitors may have access to the same technology licensed to us. Any of the foregoing events could seriously harm our business, financial condition and results of operations.
-27-
Table of Contents
If we are required to collect sales and use or other taxes on the solutions we sell, we may be subject to liability for past sales and our future sales may decrease.
Taxing jurisdictions, including state and local entities, have differing rules and regulations governing sales and use or other taxes, and these rules and regulations are subject to varying interpretations that may change over time. In particular, the applicability of sales taxes to our subscription services in various jurisdictions is unclear. We have recorded sales tax liabilities of $0.4 million on our consolidated balance sheet as of December 31, 2012 with respect to sales and use tax liabilities in various jurisdictions where we have not yet billed sales tax to our customers and where we believe we may have exposure. It is possible that we could face sales tax audits and that our liability for these taxes could exceed our estimates as tax authorities could still assert that we are obligated to collect additional amounts as taxes from our customers and remit those taxes to those authorities. We could also be subject to audits with respect to state and international jurisdictions for which we have not accrued tax liabilities. A successful assertion that we should be collecting additional sales or other taxes on our services in jurisdictions where we have not historically done so and do not accrue for sales taxes could result in substantial tax liabilities for past sales, discourage customers from purchasing our solutions or otherwise harm our business and operating results.
We are dependent on the continued services and performance of our senior management and other key employees, the loss of any of whom could adversely affect our business, operating results and financial condition.
Our future performance depends on the continued services and continuing contributions of our senior management, particularly Philippe F. Courtot, our Chairman, President and Chief Executive Officer, and other key employees to execute on our business plan and to identify and pursue new opportunities and product innovations. We do not maintain key-man insurance for Mr. Courtot or for any other member of our senior management team. From time to time, there may be changes in our senior management team resulting from the termination or departure of executives. Our senior management and key employees are generally employed on an at-will basis, which means that they could terminate their employment with us at any time. The loss of the services of our senior management, particularly Mr. Courtot, or other key employees for any reason could significantly delay or prevent the achievement of our development and strategic objectives and harm our business, financial condition and results of operations.
If we are unable to hire, retain and motivate qualified personnel, our business may suffer.
Our future success depends, in part, on our ability to continue to attract and retain highly skilled personnel. The loss of the services of any of our key personnel, the inability to attract or retain qualified personnel or delays in hiring required personnel, particularly in engineering and sales, may seriously harm our business, financial condition and results of operations. Any of our employees may terminate their employment at any time. Competition for highly skilled personnel is frequently intense, especially in the San Francisco Bay Area, one of the locations in which we have a substantial presence and need for highly-skilled personnel and we may not be able to compete for these employees.
For example, we are required under accounting principles generally accepted in the United States (“U.S. GAAP”) to recognize compensation expense in our operating results for employee stock-based compensation under our equity grant programs, which may negatively impact our operating results and may increase the pressure to limit stock-based compensation that we might otherwise offer to current or potential employees. In addition, to the extent we hire personnel from competitors, we may be subject to allegations that they have been improperly solicited or divulged proprietary or other confidential information.
Changes in laws or regulations related to the Internet may diminish the demand for our solutions and could have a negative impact on our business.
We deliver our solutions through the Internet. Federal, state or foreign government bodies or agencies have in the past adopted, and may in the future adopt, laws or regulations affecting data
-28-
Table of Contents
privacy and the use of the Internet. In addition, government agencies or private organizations may begin to impose taxes, fees or other charges for accessing the Internet or on commerce conducted via the Internet. These laws or charges could limit the viability of Internet-based solutions such as ours and reduce the demand for our solutions.
A portion of our revenues are generated by sales to government entities, which are subject to a number of challenges and risks.
Government entities have historically been particularly concerned about adopting cloud-based solutions for their operations, including security solutions, and increasing sales of subscriptions for our solutions to government entities may be more challenging than selling to commercial organizations. Selling to government entities can be highly competitive, expensive and time consuming, often requiring significant upfront time and expense without any assurance that we will win a sale. We have invested in the creation of a cloud offering certified under the Federal Information Security Management Act, or FISMA, for government usage but we cannot be sure that we will continue to sustain or renew this certification, that the government will continue to mandate such certification or that other government agencies or entities will use this cloud offering. Government demand and payment for our solutions may be impacted by public sector budgetary cycles and funding authorizations, with funding reductions or delays adversely affecting public sector demand for our solutions. Government entities may have contractual or other legal rights to terminate contracts with our channel partners for convenience or due to a default, and any such termination may adversely impact our future results of operations. Governments routinely investigate and audit government contractors’ administrative processes, and any unfavorable audit could result in the government refusing to continue buying our solutions, a reduction of revenues or fines or civil or criminal liability if the audit uncovers improper or illegal activities. Any such penalties could adversely impact our results of operations in a material way.
Governmental export or import controls could subject us to liability if we violate them or limit our ability to compete in foreign markets.
Our solutions are subject to U.S. export controls, and we incorporate encryption technology into certain of our solutions. These encryption solutions and the underlying technology may be exported only with the required export authorizations, including by license, a license exception or other appropriate government authorizations. U.S. export controls may require submission of an encryption registration, product classification and/or annual or semi-annual reports. Governmental regulation of encryption technology and regulation of imports or exports of encryption products, or our failure to obtain required import or export authorization for our solutions, when applicable, could harm our international sales and adversely affect our revenues. Compliance with applicable regulatory requirements regarding the export of our solutions, including with respect to new releases of our solutions, may create delays in the introduction of our solutions in international markets, prevent our customers with international operations from deploying our solutions throughout their globally-distributed systems or, in some cases, prevent the export of our solutions to some countries altogether. In addition, various countries regulate the import of our appliance-based solutions and have enacted laws that could limit our ability to distribute solutions or could limit our customers’ ability to implement our solutions in those countries. Any new export or import restrictions, new legislation or shifting approaches in the enforcement or scope of existing regulations, or in the countries, persons or technologies targeted by such regulations, could result in decreased use of our solutions by existing customers with international operations, declining adoption of our solutions by new customers with international operations and decreased revenues. If we fail to comply with export and import regulations, we may be fined or other penalties could be imposed, including a denial of certain export privileges.
-29-
Table of Contents
Our success in acquiring and integrating other businesses, products or technologies could impact our financial position.
In order to remain competitive, we have in the past and may in the future seek to acquire additional businesses, products or technologies. The environment for acquisitions in our industry is very competitive and acquisition candidate purchase prices will likely exceed what we would prefer to pay. Moreover, achieving the anticipated benefits of future acquisitions will depend in part upon whether we can integrate acquired operations, products and technology in a timely and cost-effective manner. The acquisition and integration process is complex, expensive and time consuming, and may cause an interruption of, or loss of momentum in, product development and sales activities and operations of both companies. We may not find suitable acquisition candidates, and acquisitions we complete may be unsuccessful. If we consummate a transaction, we may be unable to integrate and manage acquired products and businesses effectively or retain key personnel. If we are unable to effectively execute acquisitions, our business, financial condition and operating results could be adversely affected.
Our financial results are based in part on our estimates or judgments relating to our critical accounting policies. These estimates or judgments may prove to be incorrect, which could harm our operating results and result in a decline in our stock price.
The preparation of financial statements in conformity with U.S. GAAP requires management to make estimates and assumptions that affect the amounts reported in the consolidated financial statements and accompanying notes. We base our estimates on historical experience and on various other assumptions that we believe to be reasonable under the circumstances, as provided in the section titled “Part II, Item 7—Management’s Discussion and Analysis of Financial Condition and Results of Operations,” the results of which form the basis for making judgments about the carrying values of assets, liabilities, equity, revenues and expenses that are not readily apparent from other sources. Our operating results may be adversely affected if our assumptions change or if actual circumstances differ from those in our assumptions, which could cause our operating results to fall below the expectations of securities analysts and investors, resulting in a decline in our stock price. Significant assumptions and estimates used in preparing our consolidated financial statements include those related to revenue recognition, goodwill and intangibles, reserves, accounting for income taxes and stock-based compensation.
Changes in financial accounting standards may cause adverse and unexpected revenue fluctuations and impact our reported results of operations.
A change in accounting standards or practices could harm our operating results and may even affect our reporting of transactions completed before the change is effective. New accounting pronouncements and varying interpretations of accounting pronouncements have occurred and may occur in the future. Changes to existing rules or the questioning of current practices may harm our operating results or the way we conduct our business.
Because we expense commissions associated with sales of our solutions immediately upon receipt of a subscription order from a customer and generally recognize the revenues associated with such sale over the term of the agreement, our operating income in any period may not be indicative of our financial health and future performance.
We expense commissions paid to our sales personnel in the quarter in which the related order is received. In contrast, we generally recognize the revenues associated with a sale of our solutions ratably over the term of the subscription, which is typically one year. Although we believe increased sales is a positive indicator of the long-term health of our business, increased sales would increase our operating expenses and decrease net income in any particular period. Thus, we may report poor operating results due to higher sales commissions in a period in which we experience strong sales of our solutions.
-30-
Table of Contents
Alternatively, we may report better operating results due to the reduction of sales commissions in a period in which we experience a slowdown in sales. Therefore, you should not rely on our operating results during any one quarter as an indication of our financial health and future performance.
We recognize revenues from subscriptions over the term of the relevant service period, and therefore any decreases or increases in bookings are not immediately reflected in our operating results.
We recognize revenues from subscriptions over the term of the relevant service period, which is typically one year. As a result, most of our reported revenues in each quarter are derived from the recognition of deferred revenues relating to subscriptions entered into during previous quarters. Consequently, a shortfall in demand for our solutions in any period may not significantly reduce our revenues for that period, but could negatively affect revenues in future periods. Accordingly, the effect of significant downturns in bookings may not be fully reflected in our results of operations until future periods. We may be unable to adjust our costs and expenses to compensate for such a potential shortfall in revenues. Our subscription model also makes it difficult for us to rapidly increase our revenues through additional bookings in any period, as revenues are recognized ratably over the subscription period.
Changes in our provision for income taxes or adverse outcomes resulting from examination of our income tax returns could adversely affect our operating results.
We are subject to income taxes in the United States and various foreign jurisdictions, and our domestic and international tax liabilities are subject to the allocation of expenses in differing jurisdictions. Our tax rate is affected by changes in the mix of earnings and losses in countries with differing statutory tax rates, certain non-deductible expenses arising from the requirement to expense stock options and the valuation of deferred tax assets and liabilities, including our ability to utilize our federal net operating losses, which were $52.9 million as of December 31, 2012. Increases in our effective tax rate could harm our operating results.
Our business is subject to the risks of earthquakes, fire, power outages, floods and other catastrophic events, and to interruption by manmade problems such as terrorism.
A significant natural disaster, such as an earthquake, fire or a flood, or a significant power outage could have a material adverse impact on our business, operating results and financial condition. Our corporate headquarters and a significant portion of our operations are located in the San Francisco Bay Area, a region known for seismic activity. In addition, natural disasters could affect our business partners’ ability to perform services for us on a timely basis. In the event we or our business partners are hindered by any of the events discussed above, our ability to provide our solutions to customers could be delayed, resulting in our missing financial targets, such as revenues and net income, for a particular quarter. Further, if a natural disaster occurs in a region from which we derive a significant portion of our revenues, customers in that region may delay or forego subscriptions of our solutions, which may materially and adversely impact our results of operations for a particular period. In addition, acts of terrorism could cause disruptions in our business or the business of our business partners, customers or the economy as a whole. All of the aforementioned risks may be exacerbated if the disaster recovery plans for us and our suppliers prove to be inadequate. To the extent that any of the above results in delays of customer subscriptions or commercialization of our solutions, our business, financial condition and results of operations could be adversely affected.
If we fail to maintain an effective system of internal control over financial reporting, our ability to produce timely and accurate financial statements or comply with applicable regulations could be impaired.
As a public company, we are subject to the reporting requirements of the Securities Exchange Act of 1934, or the Exchange Act, the Sarbanes-Oxley Act, and the rules and regulations of the NASDAQ
-31-
Table of Contents
Stock Market. To comply with the requirements of being a public company, we may need to undertake various actions, such as implementing new internal controls and procedures and hiring accounting or internal audit staff.
During the quarter ended June 30, 2012, we identified a deficiency in our internal control over financial reporting and we determined that we should restate our consolidated financial statements as of December 31, 2010 and 2011 and for the year ended December 31, 2010 to correct an error in our 2010 provision for income taxes. The restatement related to the tax benefit resulting from a reduction of our liability for uncertain tax positions upon the lapse of the statute of limitations for the 2007 tax year of our French subsidiary. We did not release the liability at December 31, 2010 due to an error in the determination of when the statute of limitations would expire. Our review of the tax provision prepared by a third-party tax advisor was not effective in identifying the error in an appropriate timeframe. We concluded that this control deficiency was not a material weakness, but rather constituted a significant deficiency in our internal control over financial reporting. However, other control deficiencies which may rise to the level of a material weakness may be discovered in the future. In addition, our current controls and any new controls that we develop may become inadequate because of changes in conditions in our business. Any failure to develop or maintain effective controls, or any difficulties encountered in their implementation or improvement, could harm our operating results or cause us to fail to meet our reporting obligations and may result in additional restatements of our financial statements for prior periods. Any failure to implement and maintain effective internal control over financial reporting also could adversely affect the results of periodic management evaluations and annual independent registered public accounting firm attestation reports regarding the effectiveness of our internal control over financial reporting that we will be required to include in our periodic reports we will file with the SEC under Section 404 of the Sarbanes-Oxley Act. In the event that we are not able to demonstrate compliance with Section 404 of the Sarbanes-Oxley Act, that our internal control over financial reporting is perceived as inadequate or that we are unable to produce timely or accurate financial statements, investors may lose confidence in our operating results and our stock price could decline. In addition, if we are unable to continue to meet these requirements, we may not be able to remain listed on the NASDAQ Stock Market.
As a public company, we are required to comply with certain of these rules, which require management to certify financial and other information in this Annual Report on Form 10-K and other quarterly and annual reports and provide an annual management report on the effectiveness of our internal control over financial reporting commencing with our Annual Report on Form 10-K for the year ending December 31, 2013. Our independent registered public accounting firm is not required to formally attest to the effectiveness of our internal control over financial reporting until the later of our Annual Report on Form 10-K for the year ending December 31, 2013 or the first annual report required to be filed with the SEC following the date we are no longer an “emerging growth company” as defined in the JOBS Act. At such time, our independent registered public accounting firm may issue a report that is adverse in the event it is not satisfied with the level at which our controls are documented, designed or operating. Our remediation efforts may not enable us to avoid a material weakness in the future. We would remain an “emerging growth company” for up to five years, although, we will cease to be an “emerging growth company” upon the earliest of (i) the first fiscal year following the fifth anniversary of September 28, 2012, the date of our initial public offering, (ii) the first fiscal year after our annual gross revenues are $1 billion or more, (iii) the date on which we have, during the previous three-year period, issued more than $1 billion in non-convertible debt securities, or (iv) the date on which we are deemed to be a “large accelerated filer” as defined in the Exchange Act.
We have incurred and expect to continue to incur significant costs and have devoted and will continue to devote substantial management time as a result of operating as a public company, and these commitments will increase after we are no longer an “emerging growth company,” which could adversely affect our business and operating results.
As a public company, we have incurred and expect to continue to incur significant legal, accounting and other expenses. For example, we are required to comply with certain of the
-32-
Table of Contents
requirements of the Sarbanes-Oxley Act and the Dodd Frank Wall Street Reform and Consumer Protection Act, as well as rules and regulations implemented by the SEC and the NASDAQ Stock Market, including the establishment and maintenance of effective disclosure controls and procedures, internal control over financial reporting, and changes in corporate governance practices. Despite recent reform made possible by the JOBS Act, which allows us to take advantage of certain exemptions from various reporting requirements applicable to other public companies that are not “emerging growth companies,” compliance with these requirements increases our legal and financial compliance costs and makes some activities more time-consuming and costly compared to when we were a privately-held company. In addition, our management and other personnel must divert attention from operational and other business matters to devote substantial time to these public company requirements.
After we are no longer an “emerging growth company,” we expect to incur significant expenses and devote substantial management effort toward ensuring compliance with the requirements of Section 404(b) of the Sarbanes-Oxley Act, when applicable to us.
We cannot predict or estimate the amount of additional costs we may incur in the future as a result of being a public company or the timing of such costs. Being a public company also makes it more difficult and more expensive for us to obtain director and officer liability insurance, and we may be required to accept reduced policy limits and coverage or incur substantially higher costs to obtain the same or similar coverage for our officers and directors in the future. As a result, it may be more difficult for us to attract and retain qualified people to serve on our board of directors and our board committees or as executive officers.
We are an “emerging growth company” and we cannot be certain if the reduced disclosure requirements applicable to emerging growth companies makes our common stock less attractive to investors.
We are an “emerging growth company,” as defined in the JOBS Act, and, for so long as we remain an “emerging growth company,” we may choose to take advantage of certain exemptions from various reporting requirements that are applicable to other public companies that are not “emerging growth companies” including, but not limited to, the auditor attestation requirements of Section 404 of the Sarbanes-Oxley Act, reduced disclosure obligations regarding executive compensation in our periodic reports and proxy statements, and exemptions from the requirements of holding a nonbinding advisory vote on executive compensation and shareholder approval of any golden parachute payments not previously approved. We cannot assess if investors find our common stock less attractive for so long as we choose to rely on these exemptions. If some investors find our common stock less attractive as a result of our choice to reduce disclosure, there may be a less active trading market for our common stock and our trading price may be more volatile.
Market volatility may affect our stock price and the value of an investment in our common stock and could subject us to litigation.
The trading price of our common stock has been, and may continue to be, subject to significant fluctuations in response to a number of factors, most of which we cannot predict or control, including:
| • | announcements of new solutions, services or technologies, commercial relationships, acquisitions or other events by us or our competitors; |
| • | fluctuations in stock market prices and trading volumes of securities of similar companies; |
| • | general market conditions and overall fluctuations in U.S. equity markets; |
| • | variations in our operating results, or the operating results of our competitors; |
| • | changes in our financial guidance or securities analysts’ estimates of our financial performance; |
| • | changes in accounting principles; |
-33-
Table of Contents
| • | sales of large blocks of our common stock, including sales by our executive officers, directors and significant stockholders; |
| • | additions or departures of any of our key personnel; |
| • | announcements related to litigation; |
| • | changing legal or regulatory developments in the United States and other countries; and |
| • | discussion of us or our stock price by the financial press and in online investor communities. |
In addition, the stock market in general, and the stocks of technology companies such as ours in particular, have experienced substantial price and volume volatility that is often seemingly unrelated to the operating performance of particular companies. These broad market fluctuations may cause the trading price of our common stock to decline. In the past, securities class action litigation has often been brought against a company after a period of volatility in the trading price of its common stock. We may become involved in this type of litigation in the future. Any securities litigation claims brought against us could result in substantial expenses and the diversion of our management’s attention from our business.
An active trading market for our common stock may not be sustained.
Our common stock is listed on the NASDAQ Stock Market under the symbol “QLYS.” However, there can be no assurance that an active trading market for our common stock will be sustained. Accordingly, we cannot provide any assurance regarding the liquidity of any trading market or the ability of an investor to sell shares of our common stock when desired or the prices that may be obtained for such shares.
Concentration of ownership among our existing executive officers, directors and holders of 5% or more of our outstanding common stock may prevent new investors from influencing significant corporate decisions.
As of December 31, 2012, our executive officers, directors and holders of 5% or more of our outstanding common stock beneficially own, in the aggregate, a majority of our outstanding common stock. As a result, such persons, acting together, have the ability to control our management and affairs and substantially all matters submitted to our stockholders for approval, including the election and removal of directors and approval of any significant transaction. These persons also have the ability to control our management and business affairs. This concentration of ownership may have the effect of delaying, deferring or preventing a change in control, impeding a merger, consolidation, takeover or other business combination involving us, or discouraging a potential acquirer from making a tender offer or otherwise attempting to obtain control of our business, even if such a transaction would benefit other stockholders.
Future sales of shares by existing stockholders could cause our stock price to decline.
We commenced trading of our common stock on September 28, 2012 and on October 3, 2012, we closed our initial public offering, or the IPO, of 8,711,250 shares of common stock. The offering included 7,836,250 shares sold and issued by us and 875,000 shares sold by selling stockholders. As of December 31, 2012, we had 31,420,028 shares of common stock outstanding. The 8,711,250 shares sold in the IPO are freely tradable. The remaining outstanding common shares of 22,708,778 are subject to lock up agreements and may be sold upon expiration of the lock-up agreements in March 2013, subject to compliance with applicable law. In addition, as of December 31, 2012, we had outstanding options to purchase 6,513,508 shares of common stock that, if exercised, will result in these additional shares becoming available for sale upon expiration of the lock-up agreements. A large portion of these shares and options are held by a small number of persons and investment funds. Sales by these stockholders or optionholders of a substantial number of shares could significantly reduce the trading
-34-
Table of Contents
price of our common stock. Moreover, certain holders of shares of common stock have rights, subject to some conditions, to require us to file registration statements covering the shares they currently hold, or to include these shares in registration statements that we may file for ourselves or other stockholders.
An aggregate of 2,902,125 shares of our common stock is reserved for future issuance under our 2012 Equity Incentive Plan, which can be freely sold in the public market upon issuance, subject to lock-up agreements. If a large number of these shares are sold in the public market, the sales could reduce the trading price of our common stock.
If securities or industry analysts do not publish research or publish inaccurate or unfavorable research about our business, our stock price and trading volume could decline.
The trading market for our common stock depends in part on the research and reports that securities and industry analysts publish about us and our business. If we do not maintain adequate research coverage or if one or more of the analysts who covers us downgrades our stock or publishes inaccurate or unfavorable research about our business, our stock price would likely decline. If one or more of these analysts ceases coverage of our company or fails to publish reports on us regularly, demand for our stock could decrease, which could cause our stock price and trading volume to decline.
We do not intend to pay dividends on our common stock and therefore any returns will be limited to the value of our stock.
We have never declared or paid any cash dividend on our common stock. We currently anticipate that we will retain future earnings for the development, operation and expansion of our business and do not anticipate declaring or paying any cash dividends for the foreseeable future. Any return to stockholders will therefore be limited to the value of their stock.
Anti-takeover provisions in our charter documents and under Delaware law could make an acquisition of us, which may be beneficial to our stockholders, more difficult and may prevent attempts by our stockholders to replace or remove our current management.
Our amended and restated certificate of incorporation and amended and restated bylaws contain provisions that may delay or prevent an acquisition of us or a change in our management. These provisions include:
| • | authorizing “blank check” preferred stock, which could be issued by the board without stockholder approval and may contain voting, liquidation, dividend and other rights superior to our common stock, which would increase the number of outstanding shares and could thwart a takeover attempt; |
| • | a classified board of directors whose members can only be dismissed for cause; |
| • | the prohibition on actions by written consent of our stockholders; |
| • | the limitation on who may call a special meeting of stockholders; |
| • | the establishment of advance notice requirements for nominations for election to our board of directors or for proposing matters that can be acted upon at stockholder meetings; and |
| • | the requirement of at least two-thirds of the outstanding capital stock to amend any of the foregoing second through fifth provisions. |
In addition, because we are incorporated in Delaware, we are governed by the provisions of Section 203 of the Delaware General Corporation Law, which limits the ability of stockholders owning in excess of 15% of our outstanding voting stock to merge or combine with us. Although we believe these provisions collectively provide for an opportunity to obtain greater value for stockholders by
-35-
Table of Contents
requiring potential acquirers to negotiate with our board of directors, they would apply even if an offer rejected by our board were considered beneficial by some stockholders. In addition, these provisions may frustrate or prevent any attempts by our stockholders to replace or remove our current management by making it more difficult for stockholders to replace members of our board of directors, which is responsible for appointing the members of our management.
| Item 1B. | Unresolved Staff Comments |
None.
| Item 2. | Properties |
Our principal executive offices are located in Redwood City, California, where we occupy a 50,000 square-foot facility under a lease expiring on November 30, 2017. We have additional U.S. offices in Bellevue, Washington; Denver, Colorado; Durham, North Carolina; and Madison, Wisconsin. We also lease offices in Beijing, China; Courbevoie, France; Manila, Philippines; Munich, Germany; Pune, India; Ras al-Khaimah, United Arab Emirates; Slough, United Kingdom; and Tokyo, Japan. We believe our facilities are adequate for our current needs and for the foreseeable future.
We operate two principal data centers at third-party facilities in Santa Clara, California and Geneva, Switzerland.
| Item 3. | Legal Proceedings |
From time to time we may become involved in legal proceedings or be subject to claims arising in the ordinary course of our business. We are not presently a party to any legal proceedings that, if determined adversely to us, would individually or taken together have a material adverse effect on our business, operating results, financial condition or cash flows. Regardless of the outcome, litigation can have an adverse impact on us because of defense and settlement costs, diversion of management resources and other factors.
| Item 4. | Mine Safety Disclosures. |
Not Applicable.
-36-
Table of Contents
| Item 5. | Market for Registrant’s Common Equity, Related Stockholder Matters and Issuer Purchases of Equity Securities |
Market Information
Our common stock has been listed on the NASDAQ Stock Market under the trading symbol “QLYS” since September 28, 2012. Prior to that date, there was no public trading market for our common stock. Our IPO was priced at $12.00 per share on September 27, 2012. The following table sets forth the high and low per share sales prices for our common stock as reported on the NASDAQ Stock Market for the periods indicated:
| Low | High | |||||||
| Fiscal 2012: |
||||||||
| Fourth quarter |
$ | 11.07 | $ | 15.25 | ||||
| Third quarter (from September 28, 2012) |
$ | 12.00 | $ | 14.85 | ||||
Holders of Common Equity
As of February 28, 2013, there were approximately 501 holders of record of our common stock. Because many of our shares of common stock are held by brokers and other institutions on behalf of stockholders, we are unable to estimate the total number of stockholders represented by these record holders.
Dividend Policy
We have never declared or paid any cash dividends on our capital stock. We currently intend to retain any future earnings to fund business development and growth, and do not expect to pay any dividends in the foreseeable future. Any future determination to declare cash dividends will be made at the discretion of our board of directors, subject to applicable laws, and will depend on a number of factors, including our financial condition, results of operations, capital requirements, contractual restrictions, general business conditions and other factors that our board of directors may deem relevant.
Securities Authorized for Issuance under Equity Compensation Plans
The following table summarizes information about our equity compensation plans as of December 31, 2012. All outstanding awards relate to our common stock.
| Plan Category | (a) Number of Securities to be Issued Upon Exercise of Outstanding Options, Warrants and Rights |
(b) Weighted- Average Exercise Price of Outstanding Options, Warrants and Rights |
(c) Number of Securities Remaining Available for Future Issuance Under Equity Compensation Plans (Excluding Securities Reflected in Column (a)) |
|||||||||
| Equity compensation plans approved by security holders1 |
6,513,508 | $ | 4.39 | 2,902,125 | ||||||||
| 1 | Equity compensation plans approved by stockholders include the 2000 Equity Incentive Plan, as amended and the 2012 Equity Incentive Plan. Prior to our IPO, we issued securities under our 2000 Equity Incentive Plan, as amended. Following our IPO, we issued securities under our 2012 Equity Incentive Plan. |
-37-
Table of Contents
Stock Price Performance Graph
The following graph shows a comparison from September 28, 2012 (the date our common stock commenced trading on the NASDAQ Stock Market) through December 31, 2012 of the cumulative total return for an investment of $100 (and the reinvestment of dividends) in our common stock, the NASDAQ Global Select Market and the NASDAQ Computer. Such returns are based on historical results and are not intended to suggest future performance.
Comparison of Cumulative Total Return*
Among Qualys, Inc., NASDAQ Global Select Market Composite Index and NASDAQ
Computer Index
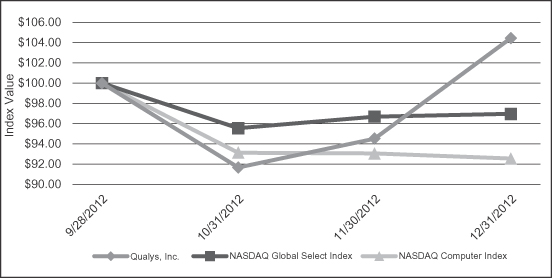
| * | $100 invested on 9/28/12 in stock or index, including reinvestment of dividends. Fiscal year ending December 31. |
| September 28, 2012 |
October 31, 2012 |
November 30, 2012 |
December 31, 2012 |
|||||||||||||
| Qualys Inc. |
$ | 100.00 | $ | 91.67 | $ | 94.49 | $ | 104.45 | ||||||||
| NASDAQ Global Select Market |
$ | 100.00 | $ | 95.55 | $ | 96.67 | $ | 96.97 | ||||||||
| NASDAQ Computer |
$ | 100.00 | $ | 93.12 | $ | 93.04 | $ | 92.56 | ||||||||
The information on the above Stock Price Performance Graph shall not be deemed to be “filed” for purposes of Section 18 of the Securities Exchange Act of 1934, as amended, or otherwise subject to the liabilities of that section or Sections 11 and 12(a)(2) of the Securities Act of 1933, as amended, and shall not be incorporated by reference into any registration statement or other document filed by us with the Securities and Exchange Commission, whether made before or after the date of this Annual Report on Form 10-K, regardless of any general incorporation language in such filing, except as shall be expressly set forth by specific reference in such filing.
Recent Sales of Unregistered Securities and Use of Proceeds
Use of Proceeds from Public Offering of Common Stock
The Form S-1 Registration Statement (Registration No. 333-182027) relating to our IPO was declared effective by the SEC on September 27, 2012 and the offering commenced on September 28, 2012. On October 3, 2012, we closed our IPO and received net proceeds of approximately $87.5 million after deducting underwriting discounts and commissions, and before deducting total expenses in connection with our IPO of approximately $2.9 million.
-38-
Table of Contents
We believe our existing cash and cash from operations will be sufficient to fund our operations for at least the next twelve months. We intend to use the net proceeds from the offering for capital expenditures, working capital and other general corporate purposes, which may include hiring additional personnel and investing in sales and marketing and research and development. In addition, we expect to spend approximately $12.0 million through December 31, 2013 for capital expenditures, primarily related to infrastructure to support the anticipated growth in our business. We may also use a portion of the net proceeds to acquire or invest in complementary businesses, technologies, or other assets. We have not entered into any agreements or commitments with respect to any acquisitions or investments at this time.
Pending these uses, we invested the net proceeds in highly liquid money market funds, fixed-income U.S. government agency securities and commercial paper.
Purchases of Equity Securities by the Issuer and Affiliated Purchasers
No shares of our common stock were repurchased during the fourth quarter of 2012.
-39-
Table of Contents
| Item 6. | Selected Consolidated Financial and Other Data |
The following selected consolidated financial and other data should be read in conjunction with “Item 7. Management’s Discussion and Analysis of Financial Condition and Results of Operations” and our consolidated financial statements, related notes and other financial information included elsewhere in this Annual Report on Form 10-K. Our historical results are not necessarily indicative of the results that may be expected in the future, and the results for the year ended December 31, 2012 are not necessarily indicative of operating results to be expected for any other period.
| Year Ended December 31, | ||||||||||||||||||||
| 2012 | 2011 | 2010 | 2009 | 2008 | ||||||||||||||||
| (in thousands, except per share data) | ||||||||||||||||||||
| Consolidated Statements of Operations Data: |
||||||||||||||||||||
| Revenues |
$ | 91,420 | $ | 76,212 | $ | 65,432 | $ | 57,425 | $ | 50,258 | ||||||||||
| Cost of revenues(1) |
18,404 | 13,247 | 11,204 | 10,692 | 9,540 | |||||||||||||||
|
|
|
|
|
|
|
|
|
|
|
|||||||||||
| Gross profit |
73,016 | 62,965 | 54,228 | 46,733 | 40,718 | |||||||||||||||
| Operating expenses: |
||||||||||||||||||||
| Research and development(1) |
20,195 | 19,633 | 15,780 | 13,377 | 11,705 | |||||||||||||||
| Sales and marketing(1) |
37,738 | 31,526 | 29,056 | 24,782 | 22,830 | |||||||||||||||
| General and administrative(1) |
12,079 | 8,900 | 8,183 | 7,455 | 6,670 | |||||||||||||||
|
|
|
|
|
|
|
|
|
|
|
|||||||||||
| Total operating expenses |
70,012 | 60,059 | 53,019 | 45,614 | 41,205 | |||||||||||||||
|
|
|
|
|
|
|
|
|
|
|
|||||||||||
| Income (loss) from operations |
3,004 | 2,906 | 1,209 | 1,119 | (487 | ) | ||||||||||||||
| Other income (expense), net: |
||||||||||||||||||||
| Interest expense |
(192 | ) | (204 | ) | (186 | ) | (180 | ) | (263 | ) | ||||||||||
| Interest income |
14 | 14 | 3 | 10 | 85 | |||||||||||||||
| Other income (expense), net |
(188 | ) | (346 | ) | (383 | ) | 130 | (176 | ) | |||||||||||
|
|
|
|
|
|
|
|
|
|
|
|||||||||||
| Total other income (expense), net |
(366 | ) | (536 | ) | (566 | ) | (40 | ) | (354 | ) | ||||||||||
|
|
|
|
|
|
|
|
|
|
|
|||||||||||
| Income (loss) before provision for (benefit from) income taxes |
2,638 | 2,370 | 643 | 1,079 | (841 | ) | ||||||||||||||
| Provision for (benefit from) income taxes |
358 | 416 | (204 | ) | 220 | 23 | ||||||||||||||
|
|
|
|
|
|
|
|
|
|
|
|||||||||||
| Net income (loss) |
$ | 2,280 | $ | 1,954 | $ | 847 | $ | 859 | $ | (864 | ) | |||||||||
|
|
|
|
|
|
|
|
|
|
|
|||||||||||
| Net income (loss) attributable to common stockholders |
$ | 1,076 | $ | 436 | $ | 179 | $ | 171 | $ | (864 | ) | |||||||||
|
|
|
|
|
|
|
|
|
|
|
|||||||||||
| Net income (loss) per share attributable to common stockholders:(2) |
||||||||||||||||||||
| Basic |
$ | 0.09 | $ | 0.09 | $ | 0.04 | $ | 0.04 | $ | (0.21 | ) | |||||||||
|
|
|
|
|
|
|
|
|
|
|
|||||||||||
| Diluted |
$ | 0.08 | $ | 0.08 | $ | 0.04 | $ | 0.04 | $ | (0.21 | ) | |||||||||
|
|
|
|
|
|
|
|
|
|
|
|||||||||||
| Weighted-average shares used in computing net income (loss) per share attributable to common stockholders: (2) |
||||||||||||||||||||
| Basic |
11,891 | 5,053 | 4,706 | 4,400 | 4,144 | |||||||||||||||
|
|
|
|
|
|
|
|
|
|
|
|||||||||||
| Diluted |
28,352 | 24,194 | 23,562 | 22,804 | 4,144 | |||||||||||||||
|
|
|
|
|
|
|
|
|
|
|
|||||||||||
-40-
Table of Contents
| As of December 31, | ||||||||||||||||||||
| 2012 | 2011 | 2010 | 2009 | 2008 | ||||||||||||||||
| (in thousands) | ||||||||||||||||||||
| Consolidated Balance Sheet Data: |
||||||||||||||||||||
| Cash, cash equivalents and short-term investments |
$ | 118,432 | $ | 24,548 | $ | 15,010 | $ | 9,949 | $ | 7,655 | ||||||||||
| Total assets |
170,318 | 68,789 | 44,360 | 34,244 | 27,932 | |||||||||||||||
| Deferred revenues, current |
56,497 | 46,717 | 37,811 | 33,266 | 29,019 | |||||||||||||||
| Deferred revenues, noncurrent |
8,616 | 4,713 | 1,734 | 1,864 | 1,090 | |||||||||||||||
| Convertible preferred stock |
— | 63,873 | 63,745 | 63,745 | 63,745 | |||||||||||||||
| Total stockholders’ equity (deficit) |
91,555 | (64,424 | ) | (69,401 | ) | (72,740 | ) | (74,310 | ) | |||||||||||
| (1) | Includes stock-based compensation as follows: |
| Year Ended December 31, | ||||||||||||||||||||
| 2012 | 2011 | 2010 | 2009 | 2008 | ||||||||||||||||
| (in thousands) | ||||||||||||||||||||
| Cost of revenues |
$ | 276 | $ | 143 | $ | 80 | $ | 47 | $ | 49 | ||||||||||
| Research and development |
672 | 499 | 359 | 315 | 227 | |||||||||||||||
| Sales and marketing |
1,074 | 578 | 467 | 284 | 218 | |||||||||||||||
| General and administrative |
1,430 | 927 | 964 | 474 | 309 | |||||||||||||||
|
|
|
|
|
|
|
|
|
|
|
|||||||||||
| Total stock-based compensation |
$ | 3,452 | $ | 2,147 | $ | 1,870 | $ | 1,120 | $ | 803 | ||||||||||
|
|
|
|
|
|
|
|
|
|
|
|||||||||||
| (2) | See Notes 1 and 12 to our consolidated financial statements included elsewhere in this Annual Report on Form 10-K for an explanation of the calculations of our basic and diluted income (loss) per share attributable to common stockholders. |
Other Financial Data (unaudited):
In addition to measures of financial performance presented in our consolidated financial statements, we monitor the key metrics set forth below to help us evaluate growth trends, establish budgets, measure the effectiveness of our sales and marketing efforts and assess operational efficiencies.
| Four Quarters Ended | ||||||||||||||||||||
| December 31, | ||||||||||||||||||||
| 2012 | 2011 | 2010 | 2009 | 2008 | ||||||||||||||||
| (in thousands) | ||||||||||||||||||||
| Four-Quarter Bookings |
$ | 101,200 | $ | 85,118 | $ | 69,977 | $ | 61,672 | $ | 53,765 | ||||||||||
| Year Ended December 31, | ||||||||||||||||||||
| 2012 | 2011 | 2010 | 2009 | 2008 | ||||||||||||||||
| (in thousands) | ||||||||||||||||||||
| Adjusted EBITDA |
$ | 13,797 | $ | 10,426 | $ | 7,648 | $ | 6,162 | $ | 3,677 | ||||||||||
Non-GAAP Financial Measures
Four-Quarter Bookings
We monitor Four-Quarter Bookings, a non-GAAP financial measure, which is calculated as revenues for the preceding four quarters plus the change in current deferred revenues for the same period. We believe this metric provides an additional tool for investors to use in assessing our business performance in a way that more fully reflects current business trends than reported revenues and reduces the variations in any particular quarter caused by customer subscription renewals. We believe
-41-
Table of Contents
Four-Quarter Bookings reflects the material sales trends for our business because it includes sales of subscriptions to new customers, as well as subscription renewals and upsells of additional subscriptions to existing customers. Since over 80% of our subscriptions are one year in length, we use current deferred revenues in this metric in order to focus on revenues to be generated over the next four quarters and to exclude the impact of multi-year subscriptions. Under our revenue recognition policy, we record subscription fees as deferred revenues and recognize revenues ratably over the subscription periods. For this reason, substantially all of our revenues for a period are typically generated from subscriptions commencing in prior periods. In addition, subscription renewals may vary during the year based on the date of our customers’ original subscriptions, customer requests to modify subscription periods, or other factors.
The following unaudited table presents the reconciliation of revenues to Four-Quarter Bookings for the four quarters ended December 31, 2012, 2011, 2010, 2009 and 2008.
| Four Quarters Ended | ||||||||||||||||||||
| December 31, | ||||||||||||||||||||
| 2012 | 2011 | 2010 | 2009 | 2008 | ||||||||||||||||
| (in thousands) | ||||||||||||||||||||
| Revenues |
$ | 91,420 | $ | 76,212 | $ | 65,432 | $ | 57,425 | $ | 50,258 | ||||||||||
| Deferred revenues, current |
||||||||||||||||||||
| Beginning of the Four-Quarter Period |
46,717 | 37,811 | 33,266 | 29,019 | 25,512 | |||||||||||||||
| Ending |
56,497 | 46,717 | 37,811 | 33,266 | 29,019 | |||||||||||||||
|
|
|
|
|
|
|
|
|
|
|
|||||||||||
| Net change |
9,780 | 8,906 | 4,545 | 4,247 | 3,507 | |||||||||||||||
|
|
|
|
|
|
|
|
|
|
|
|||||||||||
| Four-Quarter Bookings |
$ | 101,200 | $ | 85,118 | $ | 69,977 | $ | 61,672 | $ | 53,765 | ||||||||||
|
|
|
|
|
|
|
|
|
|
|
|||||||||||
Adjusted EBITDA
We monitor Adjusted EBITDA, a non-GAAP financial measure, to analyze our financial results and believe that it is useful to investors, as a supplement to U.S. GAAP measures, in evaluating our ongoing operational performance and enhancing an overall understanding of our past financial performance. We believe that Adjusted EBITDA helps illustrate underlying trends in our business that could otherwise be masked by the effect of the income or expenses that we exclude in Adjusted EBITDA. Furthermore, we use this measure to establish budgets and operational goals for managing our business and evaluating our performance. We also believe that Adjusted EBITDA provides an additional tool for investors to use in comparing our recurring core business operating results over multiple periods with other companies in our industry.
Adjusted EBITDA should not be considered in isolation from, or as a substitute for, financial information prepared in accordance with U.S. GAAP. We calculate Adjusted EBITDA as net income (loss) before (1) other (income) expense, net, which includes interest income, interest expense and other income and expense, (2) provision for (benefit from) income taxes, (3) depreciation and amortization of property and equipment, (4) amortization of intangible assets and (5) stock-based compensation.
-42-
Table of Contents
The following unaudited table presents the reconciliation of net income (loss) to Adjusted EBITDA for the years ended December 31, 2012, 2011, 2010, 2009 and 2008.
| Year Ended December 31, | ||||||||||||||||||||
| 2012 | 2011 | 2010 | 2009 | 2008 | ||||||||||||||||
| (in thousands) | ||||||||||||||||||||
| Net income (loss) |
$ | 2,280 | $ | 1,954 | $ | 847 | $ | 859 | $ | (864 | ) | |||||||||
| Other (income) expense, net |
366 | 536 | 566 | 40 | 354 | |||||||||||||||
| Provision for (benefit from) income taxes |
358 | 416 | (204 | ) | 220 | 23 | ||||||||||||||
| Depreciation and amortization of property and equipment |
6,895 | 4,939 | 4,400 | 3,868 | 3,317 | |||||||||||||||
| Amortization of intangible assets |
446 | 434 | 169 | 55 | 44 | |||||||||||||||
| Stock-based compensation |
3,452 | 2,147 | 1,870 | 1,120 | 803 | |||||||||||||||
|
|
|
|
|
|
|
|
|
|
|
|||||||||||
| Adjusted EBITDA |
$ | 13,797 | $ | 10,426 | $ | 7,648 | $ | 6,162 | $ | 3,677 | ||||||||||
|
|
|
|
|
|
|
|
|
|
|
|||||||||||
Limitations of Four-Quarter Bookings and Adjusted EBITDA
Four-Quarter Bookings and Adjusted EBITDA, non-GAAP financial measures, have limitations as analytical tools, and should not be considered in isolation from or as a substitute for the measures presented in accordance with U.S. GAAP. Some of these limitations are:
| • | Four-Quarter Bookings reflects the amount of revenues over a four-quarter period, plus the net change in the current portion of deferred revenues, while revenues are recognized ratably over the subscription periods; |
| • | Adjusted EBITDA does not reflect certain cash and non-cash charges that are recurring; |
| • | Adjusted EBITDA does not reflect income tax payments that reduce cash available to us; |
| • | Adjusted EBITDA excludes depreciation and amortization of property and equipment and, although these are non-cash charges, the assets being depreciated and amortized may have to be replaced in the future; and |
| • | Other companies, including companies in our industry, may calculate Four-Quarter Bookings or Adjusted EBITDA differently or not at all, which reduces their usefulness as a comparative measure. |
Because of these limitations, Four-Quarter Bookings and Adjusted EBITDA should be considered alongside other financial performance measures, including revenues, net income (loss) and our financial results presented in accordance with U.S. GAAP.
-43-
Table of Contents
| Item 7. | Management’s Discussion and Analysis of Financial Condition and Results of Operations |
You should read the following discussion in conjunction with the section titled “Selected Consolidated Financial and Other Data” and our consolidated financial statements and the related notes included elsewhere in this Annual Report on Form 10-K. In addition to historical information, this discussion contains forward-looking statements that involve risks and uncertainties that could cause our actual results to differ materially from our expectations, as discussed in “Forward-Looking Statements” in Part I of this Annual Report on Form 10-K. Factors that could cause such differences include, but are not limited to, those described in the section titled “Risk Factors” and elsewhere in this Annual Report on Form 10-K.
Overview
We are a pioneer and leading provider of cloud security and compliance solutions that enable organizations to identify security risks to their IT infrastructures, help protect their IT systems and applications from ever-evolving cyber attacks and achieve compliance with internal policies and external regulations. Our cloud solutions address the growing security and compliance complexities and risks that are amplified by the dissolving boundaries between internal and external IT infrastructures and web environments, the rapid adoption of cloud computing and the proliferation of geographically dispersed IT assets. Our integrated suite of security and compliance solutions delivered on our QualysGuard Cloud Platform enable our customers to identify their IT assets, collect and analyze large amounts of IT security data, discover and prioritize vulnerabilities, recommend remediation actions and verify the implementation of such actions. Organizations use our integrated suite of solutions delivered on our QualysGuard Cloud Platform to cost-effectively obtain a unified view of their security and compliance posture across globally-distributed IT infrastructures.
We were founded and incorporated in December 1999 with a vision of transforming the way organizations secure and protect their IT infrastructure and applications and initially launched our first cloud solution, QualysGuard Vulnerability Management, in 2000. This solution has provided the substantial majority of our revenues to date, representing 87%, 90% and 92% of total revenues in 2012, 2011 and 2010, respectively. As this solution gained acceptance, we introduced new solutions to help customers manage increasing IT security and compliance requirements. In 2006, we added our PCI Compliance solution, and in 2008, we added our Policy Compliance solution. In 2009, we broadened the scope of our cloud services by adding Web Application Scanning. We continued our expansion in 2010, launching Malware Detection Service and Qualys SECURE Seal for automated protection of websites.
We provide our solutions through a software-as-a-service model, primarily with renewable annual subscriptions. These subscriptions require customers to pay a fee in order to access our cloud solutions. We invoice our customers for the entire subscription amount at the start of the subscription term, and the invoiced amounts are treated as deferred revenues and are recognized ratably over the term of each subscription. Historically, we have experienced significant revenue growth from existing customers as they renew and purchase additional subscriptions. Revenues from customers existing at or prior to December 31, 2011 grew $7.8 million to $84.0 million during 2012. We expect this trend to continue.
We market and sell our solutions to enterprises, government entities and to small and medium size businesses across a broad range of industries, including education, financial services, government, healthcare, insurance, manufacturing, media, retail, technology and utilities. As of December 31, 2012, we had over 6,150 customers in more than 100 countries, including a majority of each of the Forbes Global 100 and Fortune 100. In 2012, 2011 and 2010, approximately 68%, 67% and 67%, respectively, of our revenues were derived from customers in the United States. We sell our solutions to enterprises and government entities primarily through our field sales force and to small and
-44-
Table of Contents
medium-sized businesses through our inside sales force. We generate a significant portion of sales through our channel partners, including managed service providers, value-added resellers and consulting firms in the United States and internationally.
We have had strong revenue growth over the past three years. Our revenues increased from $65.4 million in 2010 to $76.2 million in 2011, and reached $91.4 million in 2012, representing period-over-period increases of $10.8 million, and $15.2 million, or 16% and 20%, respectively. We generated net income of $0.8 million in 2010, $2.0 million in 2011, and $2.3 million in 2012.
On September 28, 2012, our common stock commenced trading on the NASDAQ Stock Market under the trading symbol “QLYS,” and on October 3, 2012 we closed our initial public offering. In our initial public offering, we sold and issued 7,836,250 shares and certain selling stockholders sold an additional 875,000 shares. The net proceeds to us from the offering were approximately $87.5 million, after deducting underwriting discounts and commissions, and before deducting total expenses in connection with this offering of $2.9 million.
Key Metrics
In addition to measures of financial performance presented in our consolidated financial statements, we monitor the key metrics set forth below to help us evaluate growth trends, establish budgets, measure the effectiveness of our sales and marketing efforts, and assess operational efficiencies.
Four-Quarter Bookings
We monitor Four-Quarter Bookings, a non-GAAP financial measure, which is calculated as revenues for the preceding four quarters plus the change in current deferred revenues for the same period. We believe this metric provides an additional tool for investors to use in assessing our business performance in a way that more fully reflects current business trends than reported revenues and reduces the variations in any particular quarter caused by customer subscription renewals. We believe Four-Quarter Bookings reflects the material sales trends for our business because it includes sales of subscriptions to new customers, as well as subscription renewals and upsells of additional subscriptions to existing customers. Since over 80% of our subscriptions are one year in length, we use current deferred revenues in this metric in order to focus on revenues to be generated over the next four quarters and to exclude the impact of multi-year subscriptions. Under our revenue recognition policy, we record subscription fees as deferred revenues and recognize revenues ratably over the subscription periods. For this reason, substantially all of our revenues for a period are typically generated from subscriptions commencing in prior periods. In addition, subscription renewals may vary during the year based on the date of our customers’ original subscriptions, customer requests to modify subscription periods or other factors. See the section titled “Selected Consolidated Financial and Other Data-Non-GAAP Financial Measures” for a reconciliation of revenues to Four-Quarter Bookings.
| Four Quarters Ended December 31, | ||||||||||||
| 2012 | 2011 | 2010 | ||||||||||
| (in thousands, except percentages) | ||||||||||||
| Four-Quarter Bookings |
$ | 101,200 | $ | 85,118 | $ | 69,977 | ||||||
| Percentage change from prior year period |
19 | % | 22 | % | 13 | % | ||||||
Adjusted EBITDA
We monitor Adjusted EBITDA, a non-GAAP financial measure, to analyze our financial results and believe that it is useful to investors, as a supplement to U.S. GAAP measures, in evaluating our ongoing operational performance and enhancing an overall understanding of our past financial performance. We believe that Adjusted EBITDA helps illustrate underlying trends in our business that
-45-
Table of Contents
could otherwise be masked by the effect of the income or expenses that we exclude in Adjusted EBITDA. Furthermore, we use this measure to establish budgets and operational goals for managing our business and evaluating our performance. We also believe that Adjusted EBITDA provides an additional tool for investors to use in comparing our recurring core business operating results over multiple periods with other companies in our industry. See the section titled “Selected Consolidated Financial and Other Data-Non-GAAP Financial Measures” for a reconciliation of net income to Adjusted EBITDA,
Adjusted EBITDA should not be considered in isolation from, or as a substitute for, financial information prepared in accordance with U.S. GAAP. We calculate Adjusted EBITDA as net income before (1) other (income) expense, net, which includes interest income, interest expense and other income and expense, (2) provision for income taxes, (3) depreciation and amortization of property and equipment, (4) amortization of intangible assets and (5) stock-based compensation.
| Year Ended December 31, | ||||||||||||
| 2012 | 2011 | 2010 | ||||||||||
| (in thousands) | ||||||||||||
| Adjusted EBITDA |
$ | 13,797 | $ | 10,426 | $ | 7,648 | ||||||
| Percentage of revenues |
15 | % | 14 | % | 12 | % | ||||||
Key Components of Results of Operations
Revenues
We derive revenues from the sale of subscriptions to our security and compliance solutions, which are delivered on our cloud platform. We generate the substantial majority of our revenues through the sale of subscriptions to our QualysGuard Vulnerability Management solution, and we also have a growing number of customers who have purchased our additional solutions. Subscriptions to our solutions allow customers to access our cloud security and compliance solutions through a unified, web-based interface. Customers generally enter into one year renewable subscriptions. The subscription fee entitles the customer to an unlimited number of scans for a specified number of networked devices or web applications and, if requested by a customer as part of their subscription, a specified number of physical or virtual scanner appliances. Our physical and virtual scanner appliances are requested by certain customers as part of their subscriptions in order to scan IT infrastructures within their firewalls and do not function without, and are not sold separately from, subscriptions for our solutions. Customers are required to return physical scanner appliances if they do not renew their subscriptions.
We typically invoice our customers for the entire subscription amount at the start of the subscription term. Invoiced amounts are reflected on our consolidated balance sheet as accounts receivable or as cash when collected, and as deferred revenues until earned and recognized ratably over the subscription period. Accordingly, deferred revenues represents the amount billed to customers that has not yet been earned or recognized as revenues, pursuant to subscriptions entered into in current and prior periods.
Cost of Revenues
Cost of revenues consists primarily of personnel expenses, comprised of salaries, benefits, performance-based compensation and stock-based compensation, for employees who operate our data centers and provide support services to our customers. Other expenses include depreciation of data center equipment and physical scanner appliances provided to certain customers as part of their subscriptions, expenses related to the use of third-party data centers, amortization of third-party technology licensing fees, fees paid to contractors who supplement or support our operations center personnel and overhead allocations. We expect to make significant capital investments to expand our data center operations, which will increase the cost of revenues in absolute dollars.
-46-
Table of Contents
Operating Expenses
Research and Development
Research and development expenses consist primarily of personnel expenses, comprised of salaries, benefits, performance-based compensation and stock-based compensation, for our research and development teams. Other expenses include third-party contractor fees, amortization of intangibles related to prior acquisitions and overhead allocations. All research and development costs are expensed as incurred. We expect to continue to devote substantial resources to research and development in an effort to continuously improve our existing solutions as well as develop new solutions and expect that research and development expenses will increase in absolute dollars.
Sales and Marketing
Sales and marketing expenses consist primarily of personnel expenses, comprised of salaries, benefits, sales commissions, performance-based compensation and stock-based compensation for our worldwide sales and marketing teams. Other expenses include marketing and promotional events, lead-generation marketing programs, public relations, travel and overhead allocations. All costs are expensed as incurred, including sales commissions. Sales commissions are expensed in the quarter in which the related order is received and are paid in the month subsequent to the end of that quarter, which results in increased expenses prior to the recognition of related revenues. Our new sales personnel are typically not immediately productive, and the resulting increase in sales and marketing expenses we incur when we add new personnel may not result in increased revenues if these new sales personnel fail to become productive. The timing of our hiring of sales personnel and the rate at which they generate incremental revenues may affect our future operating results. We expect that sales and marketing expenses will increase in absolute dollars.
General and Administrative
General and administrative expenses consist primarily of personnel expenses, comprised of salaries, benefits, performance-based compensation and stock-based compensation, for our executive, finance and accounting, legal, human resources and internal information technology support teams as well as professional services fees and overhead allocations. We anticipate that we will incur additional expenses for personnel and for professional services, including auditing and legal services, insurance and other corporate governance-related expenses, including compliance with Section 404 of the Sarbanes-Oxley Act, related to operating as a public company. We expect that general and administrative expenses will increase in absolute dollars, especially in the near term, as we continue to add personnel to support our growth and operate as a public company.
Other Income (Expense), Net
Our other income (expense), net consists primarily of interest expense associated with our capital leases and foreign exchange gains and losses, the majority of which result from fluctuations between the U.S. dollar and the Euro, British pound and Japanese yen.
Provision for Income Taxes
Our provision for income taxes consists primarily of corporate income taxes resulting from profits generated in foreign jurisdictions by wholly-owned subsidiaries, along with state income taxes payable in the United States. The provision for income taxes also includes changes to unrecognized tax benefits related to uncertain tax positions.
Income taxes are accounted for under the asset and liability method. Deferred tax assets and liabilities are recognized for the tax impact of timing differences between the financial statement carrying amounts of existing assets and liabilities and their respective tax bases and operating loss and
-47-
Table of Contents
tax credit carry-forwards. Deferred tax assets and liabilities are measured using statutory tax rates expected to apply to taxable income in the years in which those temporary differences are expected to be recovered or settled. The effect on deferred tax assets and liabilities of a change in tax rates is recognized in income in the period when the statutory rate change is enacted into law.
We maintain a valuation allowance on our U.S. federal and state net deferred tax assets. Our cash tax expense is impacted by each jurisdiction’s individual tax rates, laws on timing of recognition of income and deductions and availability of net operating losses and tax credits. Given the valuation allowance and sensitivity of current cash taxes to local rules, our effective tax rate could fluctuate significantly on a quarterly basis, to the extent earnings are lower than anticipated in countries that have lower statutory rates and higher than anticipated in countries that have higher statutory rates, and also due to changes in our earnings projections, by changes in the valuation of our deferred tax assets or liabilities, or by changes in tax laws, regulations, or accounting principles.
Results of Operations
The following tables set forth selected consolidated statements of income data for each of the periods presented.
| Year Ended December 31, | ||||||||||||
| 2012 | 2011 | 2010 | ||||||||||
| (in thousands) | ||||||||||||
| Consolidated Statements of Income Data: |
||||||||||||
| Revenues |
$ | 91,420 | $ | 76,212 | $ | 65,432 | ||||||
| Cost of revenues(1) |
18,404 | 13,247 | 11,204 | |||||||||
|
|
|
|
|
|
|
|||||||
| Gross profit |
73,016 | 62,965 | 54,228 | |||||||||
| Operating expenses: |
||||||||||||
| Research and development(1) |
20,195 | 19,633 | 15,780 | |||||||||
| Sales and marketing(1) |
37,738 | 31,526 | 29,056 | |||||||||
| General and administrative(1) |
12,079 | 8,900 | 8,183 | |||||||||
|
|
|
|
|
|
|
|||||||
| Total operating expenses |
70,012 | 60,059 | 53,019 | |||||||||
|
|
|
|
|
|
|
|||||||
| Income from operations |
3,004 | 2,906 | 1,209 | |||||||||
| Other income (expense), net |
(366 | ) | (536 | ) | (566 | ) | ||||||
|
|
|
|
|
|
|
|||||||
| Income before provision for income taxes |
2,638 | 2,370 | 643 | |||||||||
| Provision for (benefit from) income taxes |
358 | 416 | (204 | ) | ||||||||
|
|
|
|
|
|
|
|||||||
| Net income |
$ | 2,280 | $ | 1,954 | $ | 847 | ||||||
|
|
|
|
|
|
|
|||||||
| (1) | Includes stock-based compensation as follows: |
| Year Ended December 31, | ||||||||||||
| 2012 | 2011 | 2010 | ||||||||||
| (in thousands) | ||||||||||||
| Cost of revenues |
$ | 276 | $ | 143 | $ | 80 | ||||||
| Research and development |
672 | 499 | 359 | |||||||||
| Sales and marketing |
1,074 | 578 | 467 | |||||||||
| General and administrative |
1,430 | 927 | 964 | |||||||||
|
|
|
|
|
|
|
|||||||
| Total stock-based compensation |
$ | 3,452 | $ | 2,147 | $ | 1,870 | ||||||
|
|
|
|
|
|
|
|||||||
-48-
Table of Contents
The following table sets forth selected consolidated statements of income data for each of the periods presented as a percentage of revenues.
| Year Ended December 31, | ||||||||||||
| 2012 | 2011 | 2010 | ||||||||||
| Revenues |
100 | % | 100 | % | 100 | % | ||||||
| Cost of revenues |
20 | % | 17 | % | 17 | % | ||||||
|
|
|
|
|
|
|
|||||||
| Gross profit |
80 | % | 83 | % | 83 | % | ||||||
| Operating expenses: |
||||||||||||
| Research and development |
22 | % | 26 | % | 24 | % | ||||||
| Sales and marketing |
41 | % | 41 | % | 44 | % | ||||||
| General and administrative |
14 | % | 12 | % | 13 | % | ||||||
|
|
|
|
|
|
|
|||||||
| Total operating expenses |
77 | % | 79 | % | 81 | % | ||||||
|
|
|
|
|
|
|
|||||||
| Income from operations |
3 | % | 4 | % | 2 | % | ||||||
| Other income (expense), net |
0 | % | (1 | )% | (1 | )% | ||||||
|
|
|
|
|
|
|
|||||||
| Income before provision for income taxes |
3 | % | 3 | % | 1 | % | ||||||
| Provision for (benefit from) income taxes |
1 | % | 0 | % | 0 | % | ||||||
|
|
|
|
|
|
|
|||||||
| Net income |
2 | % | 3 | % | 1 | % | ||||||
|
|
|
|
|
|
|
|||||||
Comparison of Years Ended December 31, 2012 and 2011
Revenues
| Year Ended December 31, |
Change | |||||||||||||||
| 2012 | 2011 | $ | % | |||||||||||||
| (in thousands, except percentages) | ||||||||||||||||
| Revenues |
$ | 91,420 | $ | 76,212 | $ | 15,208 | 20 | % | ||||||||
Revenues increased $15.2 million in 2012 compared to 2011. Revenues from customers existing at or prior to December 31, 2011 grew $7.8 million to $84.0 million in 2012 due to increased subscriptions. Subscriptions from new customers added in 2012 contributed $7.4 million to the increase in revenues. Of the total increase of $15.2 million, $11.6 million was from customers in the United States and the remaining $3.6 million was from customers in foreign countries. The growth in revenues reflects increased demand for our solutions.
Cost of Revenues
| Year Ended December 31, |
Change | |||||||||||||||
| 2012 | 2011 | $ | % | |||||||||||||
| (in thousands, except percentages) | ||||||||||||||||
| Cost of revenues |
$ | 18,404 | $ | 13,247 | $ | 5,157 | 39 | % | ||||||||
| Percentage of revenues |
20 | % | 17 | % | ||||||||||||
| Gross profit percentage |
80 | % | 83 | % | ||||||||||||
Cost of revenues increased $5.2 million in 2012 compared to 2011, primarily due to $2.0 million of higher depreciation expenses related to additional data center equipment, third-party software and physical scanner appliances deployed to customers, increased personnel expenses of $1.5 million,
-49-
Table of Contents
principally driven by the addition of employees in our operations team, and increased third-party software maintenance expense of $1.0 million. The decrease in gross profit percentage reflects the impact of increased investments to expand our data center infrastructure and to add capacity to deploy new solutions on our cloud platform.
Research and Development Expenses
| Year Ended December 31, |
Change | |||||||||||||||
| 2012 | 2011 | $ | % | |||||||||||||
| (in thousands, except percentages) | ||||||||||||||||
| Research and development |
$ | 20,195 | $ | 19,633 | $ | 562 | 3 | % | ||||||||
| Percentage of revenues |
22 | % | 26 | % | ||||||||||||
Research and development expenses increased $0.6 million in 2012 compared to 2011, primarily due to an increase in personnel expenses of $0.6 million, principally driven by the addition of employees as we continue to invest in enhancing our platform and developing new solutions.
Sales and Marketing Expenses
| Year Ended December 31, |
Change | |||||||||||||||
| 2012 | 2011 | $ | % | |||||||||||||
| (in thousands, except percentages) | ||||||||||||||||
| Sales and marketing |
$ | 37,738 | $ | 31,526 | $ | 6,212 | 20 | % | ||||||||
| Percentage of revenues |
41 | % | 41 | % | ||||||||||||
Sales and marketing expenses increased $6.2 million in 2012 compared to 2011, primarily due to an increase in personnel expenses of $4.9 million, principally driven by the addition of employees as we continue to expand our domestic and international sales and marketing efforts, and higher sales commissions as a result of higher bookings, increased travel and related expense of $0.5 million and increased marketing program and event expenses of $0.3 million.
General and Administrative Expenses
| Year Ended December 31, |
Change | |||||||||||||||
| 2012 | 2011 | $ | % | |||||||||||||
| (in thousands, except percentages) | ||||||||||||||||
| General and administrative |
$ | 12,079 | $ | 8,900 | $ | 3,179 | 36 | % | ||||||||
| Percentage of revenues |
14 | % | 12 | % | ||||||||||||
General and administrative expenses increased $3.2 million in 2012 compared to 2011, primarily due to an increase in personnel expenses of $1.4 million, principally driven by the addition of employees to support the growth of our business, an increase in non-employee stock-based compensation of $0.3 million and an increase in professional services expenses of $0.7 million.
Other Income (Expense), Net
| Year Ended December 31, |
Change | |||||||||||||||
| 2012 | 2011 | $ | % | |||||||||||||
| (in thousands, except percentages) | ||||||||||||||||
| Other income (expense), net |
$ | (366 | ) | $ | (536 | ) | $ | 170 | (32 | )% | ||||||
| Percentage of revenues |
0 | % | 1 | % | ||||||||||||
Other income (expense), net decreased $0.2 million in 2012 compared to 2011, primarily due to lower foreign currency exchange losses in 2012 compared to 2011.
-50-
Table of Contents
Provision for Income Taxes
| Year Ended December 31, |
Change | |||||||||||||||
| 2012 | 2011 | $ | % | |||||||||||||
| (in thousands, except percentages) | ||||||||||||||||
| Provision for income taxes |
$ | 358 | $ | 416 | $ | (58 | ) | (14 | )% | |||||||
| Percentage of revenues |
1 | % | 0 | % | ||||||||||||
Provision for income taxes decreased $0.1 million in 2012 compared to 2011, primarily due to a reduction of the liability for uncertain tax positions of $0.1 million, primarily resulting from closure of tax years in foreign jurisdictions during 2012, partially offset by increases in foreign and state taxes.
Comparison of Years Ended December 31, 2011 and 2010
Revenues
| Year Ended December 31, |
Change | |||||||||||||||
| 2011 | 2010 | $ | % | |||||||||||||
| (in thousands, except percentages) | ||||||||||||||||
| Revenues |
$ | 76,212 | $ | 65,432 | $ | 10,780 | 16 | % | ||||||||
Revenues increased $10.8 million in 2011 compared to 2010. Revenues from customers existing at or prior to December 31, 2010 grew $5.8 million to $71.2 million in 2011 due to increased subscriptions. Subscriptions from new customers added in 2011 contributed $5.0 million to the increase in revenues. Of the total increase of $10.8 million, $7.4 million was from customers in the United States and the remaining $3.4 million was from customers in foreign countries. The growth in revenues reflects increased demand for our solutions.
Cost of Revenues
| Year Ended December 31, |
Change | |||||||||||||||
| 2011 | 2010 | $ | % | |||||||||||||
| (in thousands, except percentages) | ||||||||||||||||
| Cost of revenues |
$ | 13,247 | $ | 11,204 | $ | 2,043 | 18 | % | ||||||||
| Percentage of revenues |
17 | % | 17 | % | ||||||||||||
| Gross profit percentage |
83 | % | 83 | % | ||||||||||||
Cost of revenues increased $2.0 million in 2011 compared to 2010, primarily due to $1.4 million of increased personnel expenses, principally driven by the addition of employees in our operations team and customer support team, and $0.6 million of higher depreciation expenses, principally driven by additional data center equipment and third-party software.
Research and Development Expenses
| Year Ended December 31, |
Change | |||||||||||||||
| 2011 | 2010 | $ | % | |||||||||||||
| (in thousands, except percentages) | ||||||||||||||||
| Research and development |
$ | 19,633 | $ | 15,780 | $ | 3,853 | 24 | % | ||||||||
| Percentage of revenues |
26 | % | 24 | % | ||||||||||||
-51-
Table of Contents
Research and development expenses increased $3.9 million in 2011 compared to 2010, primarily due to increased personnel expenses of $3.0 million, principally driven by the addition of employees and higher performance-based compensation, as we continued to invest in enhancing our platform and solutions, and developing new solutions, increased travel expenses of $0.3 million, and increased amortization expenses of $0.3 million as a result of the addition of intangible assets acquired through our acquisition of Nemean Networks, LLC, or Nemean, in 2010.
Sales and Marketing Expenses
| Year Ended December 31, |
Change | |||||||||||||||
| 2011 | 2010 | $ | % | |||||||||||||
| (in thousands, except percentages) | ||||||||||||||||
| Sales and marketing |
$ | 31,526 | $ | 29,056 | $ | 2,470 | 9 | % | ||||||||
| Percentage of revenues |
41 | % | 44 | % | ||||||||||||
Sales and marketing expenses increased $2.5 million in 2011 compared to 2010, primarily due to increased personnel expenses of $1.5 million, principally driven by the addition of employees as we continued to expand our domestic and international sales and marketing efforts and higher sales commissions as a result of higher bookings, increased marketing program and event expenses of $0.5 million, and higher travel and related expenses of $0.3 million.
General and Administrative Expenses
| Year Ended December 31, |
Change | |||||||||||||||
| 2011 | 2010 | $ | % | |||||||||||||
| (in thousands, except percentages) | ||||||||||||||||
| General and administrative |
$ | 8,900 | $ | 8,183 | $ | 717 | 9 | % | ||||||||
| Percentage of revenues |
12 | % | 13 | % | ||||||||||||
General and administrative expenses increased $0.7 million in 2011 compared to 2010, primarily due to increased personnel expenses of $0.3 million, principally driven by higher performance-based compensation, and higher administrative expenses of $0.3 million, primarily for additions of office equipment and third-party fees to support our growth.
Other Income (Expense), Net
| Year Ended December 31, |
Change | |||||||||||||||
| 2011 | 2010 | $ | % | |||||||||||||
| (in thousands, except percentages) | ||||||||||||||||
| Other income (expense), net |
$ | (536 | ) | $ | (566 | ) | $ | 30 | 5 | % | ||||||
| Percentage of revenues |
1 | % | 1 | % | ||||||||||||
Other income (expense), net was consistent in 2011 compared to 2010.
Provision for (Benefit from) Income Taxes
| Year Ended December 31, |
Change | |||||||||||||||
| 2011 | 2010 | $ | % | |||||||||||||
| (in thousands, except percentages) | ||||||||||||||||
| Provision for (benefit from) income taxes |
$ | 416 | $ | (204 | ) | $ | 620 | NM | ||||||||
| Percentage of revenues |
0 | % | 0 | % | ||||||||||||
-52-
Table of Contents
Provision for (benefit from) income taxes increased $0.6 million in 2011 compared to 2010. Our benefit from income taxes in 2010 included a $0.4 million tax benefit resulting from a reduction of the liability for uncertain tax positions upon the lapse of the statute of limitations for the 2007 tax year of our French subsidiary in 2010. Our provision for income taxes in 2011 also increased compared to 2010 due to an increase in pre-tax income related to international operations and state taxes, as we utilized net operating losses to offset federal income taxes in the United States.
Liquidity and Capital Resources
Since our inception, we had financed our operations primarily through proceeds from the issuance of our preferred stock, including $23.2 million invested by Philippe F. Courtot, our Chairman, President and Chief Executive Officer, and cash flows from operations. On October 3, 2012, we closed our IPO and received net proceeds of approximately $87.5 million after deducting underwriting discounts and commissions, and before deducting total expenses in connection with our IPO of $2.9 million. At December 31, 2012, our principal source of liquidity was cash, cash equivalents and short-term investments of $118.4 million, including $1.4 million held outside of the United States by our foreign subsidiaries. We do not anticipate that we will need funds generated from foreign operations to fund our domestic operations. However, if we repatriate these funds, we could be subject to U.S. income taxes on such amounts, less previously paid foreign income taxes.
We have experienced positive cash flows from operations during the years ended December 31, 2012, 2011 and 2010. We believe our existing cash, cash equivalents, short-term investments, and cash from operations will be sufficient to fund our operations for at least the next twelve months. We expect to spend approximately $12.0 million through December 31, 2013 for capital expenditures, primarily related to infrastructure to support the anticipated growth in our business. Our future capital requirements will depend on many factors, including our rate of revenue growth, the expansion of our sales and marketing activities, the timing and extent of our spending on research and development efforts, international expansion and investment in data centers. We may also seek to invest in or acquire complementary businesses or technologies.
To the extent that existing cash, cash equivalents, short-term investments, and cash from operations are insufficient to fund our future activities, we may need to raise additional funding through debt and equity financing. Additional funds may not be available on favorable terms or at all.
Cash Flows
The following summary of cash flows for the periods indicated has been derived from our consolidated financial statements included elsewhere in this report:
| Year Ended December 31, | ||||||||||||
| 2012 | 2011 | 2010 | ||||||||||
| (in thousands) | ||||||||||||
| Cash provided by operating activities |
$ | 21,952 | $ | 17,190 | $ | 9,896 | ||||||
| Cash used in investing activities |
(94,784 | ) | (7,499 | ) | (4,261 | ) | ||||||
| Cash provided by (used in) financing activities |
83,202 | (10 | ) | (547 | ) | |||||||
| Effect of exchange rate changes on cash and cash equivalents |
(33 | ) | (143 | ) | (27 | ) | ||||||
|
|
|
|
|
|
|
|||||||
| Net increase in cash and cash equivalents |
$ | 10,337 | $ | 9,538 | $ | 5,061 | ||||||
|
|
|
|
|
|
|
|||||||
Cash Flows from Operating Activities
In 2012, operating activities provided $22.0 million in cash related to an increase of $13.7 million in deferred revenues, attributable to increased collections from customers and an increase in subscriptions exceeding one year and net income of $2.3 million, adjusted by non-cash items including
-53-
Table of Contents
depreciation and amortization of $7.3 million and stock-based compensation of $3.5 million. These sources of cash were partially offset by an increase of $4.0 million in accounts receivable due to the overall growth of our business and a decrease of $1.4 million in accounts payable and accrued liabilities due to the timing of payments.
In 2011, operating activities provided $17.2 million in cash as a result of net income of $2.0 million, adjusted by non-cash items, including depreciation and amortization of $5.4 million and stock-based compensation of $2.1 million. Working capital sources of cash were related to an increase of $11.9 million in deferred revenues, attributable to increased collections from customers and subscriptions exceeding one year, a $4.1 million increase in accounts payable and accrued liabilities primarily related to increased headcount and operations, and a $1.7 million increase in other non-current liabilities related to obligations for multi-year maintenance and support agreements for third-party licensed technology. These sources of cash were partially offset by an increase of $6.7 million in accounts receivable due to the overall growth of our business as new bookings outpaced collections of existing receivables and a $3.8 million increase in prepaid expenses and other assets related to long-term maintenance contracts on third-party licensed technology.
In 2010, operating activities provided $9.9 million in cash as a result of net income of $0.8 million, adjusted by non-cash items, including depreciation and amortization of $4.6 million and stock-based compensation of $1.9 million. Working capital sources of cash were related to an increase of $4.4 million in deferred revenues, attributable to increased collections from customers. These sources of cash were partially offset by an increase of $1.2 million in accounts receivable due to the overall growth of our business.
Cash Flows from Investing Activities
In 2012, we invested $83.5 million of our IPO proceeds in short-term investments. In 2012, 2011 and 2010, we used $11.2 million, $7.5 million and $1.5 million, respectively, of cash for capital expenditures, including computer hardware and software for our data centers to support our growth and development and to purchase physical scanner appliances provided to certain customers as part of their subscriptions. Additionally, in 2010, we used $2.8 million of cash for the acquisition of Nemean.
Cash Flows from Financing Activities
In 2012, cash provided by financing activities of $83.2 million was primarily attributable to proceeds of $84.5 million from our initial public offering, net of offering costs, and $2.1 million of proceeds from the exercise of stock options. These cash inflows were partially offset by repayments on our capital lease obligations of $2.4 million and payment of non-contingent consideration related to our Nemean acquisition of $1.0 million.
In 2011, cash used in financing activities of $10,000 was primarily attributable to repayments on our capital lease obligations of $1.5 million partially offset by $1.5 million of proceeds from the exercise of stock options and warrants.
In 2010, cash used in financing activities of $0.5 million was primarily attributable to repayments on our capital lease obligations of $1.1 million partially offset by $0.6 million of proceeds from the exercise of stock options.
Line of Credit
We had an equipment line of credit that was available for draws in 2010, 2011 and through its expiration in February 2012. The amount available under the line increased from $1.5 million to $3.3 million during that time period. At December 31, 2011, we had $0.9 million in outstanding borrowings under this line of credit, which are recorded in capital lease obligations in the consolidated balance sheet. The remaining amount available for borrowings at December 31, 2011 was $0.9 million. At December 31, 2012, we had no outstanding borrowings under this line of credit and we are not able to draw any further funds as the line has expired.
-54-
Table of Contents
Contractual Obligations
Our principal commitments consist of obligations under our outstanding leases for office space and third-party data centers, capital lease and third-party software maintenance obligations. The following table summarizes our contractual cash obligations, including future interest payments, at December 31, 2012 and the effect such obligations are expected to have on our liquidity and cash flows in future periods:
| Payment Due by Period | ||||||||||||||||||||
| Contractual Obligations |
Total | Less Than 1 Year |
1-3 Years |
3-5 Years |
More than 5 Years |
|||||||||||||||
| (in thousands) | ||||||||||||||||||||
| Operating lease obligations(1) |
$ | 9,552 | $ | 2,831 | $ | 3,821 | $ | 2,806 | $ | 94 | ||||||||||
| Capital lease obligations(2) |
2,028 | 1,213 | 815 | — | — | |||||||||||||||
| Maintenance obligations(3) |
1,595 | 911 | 684 | — | — | |||||||||||||||
|
|
|
|
|
|
|
|
|
|
|
|||||||||||
| Total |
$ | 13,175 | $ | 4,955 | $ | 5,320 | $ | 2,806 | $ | 94 | ||||||||||
|
|
|
|
|
|
|
|
|
|
|
|||||||||||
| (1) | Operating lease obligations represent our obligations to make payments under the lease agreements for our facilities, data centers and office equipment leases. |
| (2) | Capital lease obligations represent financing on computer software purchases. |
| (3) | Maintenance obligations relate to third-party software licenses. |
Off-Balance Sheet Arrangements
During the periods presented, we did not have, nor do we currently have, any relationships with unconsolidated entities or financial partnerships, such as entities often referred to as structured finance or special purpose entities.
Recent Accounting Pronouncements
See Note 1 to the consolidated financial statements in Part II, Item 8 of this Annual Report on Form10-K for a discussion of recent accounting pronouncements.
Critical Accounting Policies and Estimates
Our financial statements are prepared in accordance with U.S. GAAP. The preparation of these financial statements requires us to make estimates and assumptions that affect the reported amounts of assets, liabilities, revenues, expenses and related disclosures. On an ongoing basis, we evaluate our estimates and assumptions. Our actual results may differ from these estimates under different assumptions or conditions.
We believe that of our significant accounting policies, which are described in the notes to our consolidated financial statements, the following accounting policies involve the greatest degree of judgment and complexity and have the greatest potential impact on our consolidated financial statements. A critical accounting policy is one that is material to the presentation of our consolidated financial statements and requires us to make difficult, subjective or complex judgments for uncertain matters that could have a material effect on our financial condition and results of operations. Accordingly, these are the policies we believe are the most critical to aid in fully understanding and evaluating our financial condition and results of operations.
Revenue Recognition
We derive revenues from subscriptions that require customers to pay a fee in order to access our cloud solutions. The subscription fee entitles the customer to an unlimited number of scans for a
-55-
Table of Contents
specified number of networked devices or web applications and, if requested by a customer as part of their subscription, a specified number of physical or virtual scanner appliances. Our physical and virtual scanner appliances are requested by certain customers as part of their subscriptions in order to scan IT infrastructures within their firewalls and do not function without, and are not sold separately from, subscriptions for our solutions. Customers are required to return physical scanner appliances if they do not renew their subscriptions. In some limited cases, we also provide certain computer equipment used to extend our QualysGuard Cloud Platform into our customers’ private cloud environment. Customers generally enter into one year renewable annual subscriptions. We assess the ability to separate multiple deliverables in accordance with the relevant accounting literature.
We recognize revenues when all of the following conditions are met: (a) there is persuasive evidence of an arrangement; (b) the service has been provided to the customer; (c) the collection of the fees is reasonably assured; and (d) the amount of fees to be paid by the customer is fixed or determinable.
Subscriptions for unlimited scans and certain limited scan arrangements with firm expiration dates are recognized ratably over the period in which the services are performed, generally one year. We recognize revenues for certain other limited scan arrangements, where expiration dates can be extended, on an as-used basis. We recognize the subscription of physical scanner appliances and other computer equipment as revenues ratably over the period of the subscription, which is commensurate with the term of the related subscription. Because the customer’s access to our cloud solutions are delivered at the same time or within close proximity to the delivery of physical scanner appliances and the terms are commensurate for these services and equipment, we consider these elements as a single unit of accounting recognized ratably over the subscription term. Costs of shipping and handling charges associated with physical scanner appliances and other computer equipment are included in cost of revenues.
Deferred revenues consist of revenues billed or received that will be recognized in the future under subscriptions existing at the balance sheet date.
Goodwill and Intangibles
Goodwill represents the excess of the aggregate purchase price paid over the fair value of the net tangible and identifiable intangible assets acquired. Goodwill and other intangible assets are not amortized and are tested for impairment at least annually or whenever events or changes in circumstances indicate that the fair value is less than carrying value. We have determined that we operate in one reporting unit. We performed qualitative assessments for 2012 of our single reporting unit and of our intangible assets not subject to amortization. These assessments did not indicate that it is more likely than not that the reporting unit fair value or the intangible assets fair value is less than their carrying values, and concluded there was no impairment of goodwill or intangible assets not subject to amortization. The goodwill balance was $0.3 million and the balance of intangible assets not subject to amortization was $0.3 million as of December 31, 2012 and 2011. No impairment of goodwill or intangible assets not subject to amortization was recorded for 2012, 2011 or 2010.
Income Taxes
We are subject to taxes in the United States as well as other tax jurisdictions in which we conduct business. Earnings from our non-U.S. activities are subject to local income tax and may be subject to U.S. income tax.
Income taxes are accounted for under the asset and liability method. Deferred tax assets and liabilities are recognized for the tax impact of timing differences between the financial statement carrying amounts of existing assets and liabilities and their respective tax bases and operating loss and
-56-
Table of Contents
tax credit carry-forwards. Deferred tax assets and liabilities are measured using statutory tax rates and laws expected to apply to taxable income in the years in which those temporary differences are expected to reverse. The effect on deferred tax assets and liabilities of a change in tax rates is recognized in income in the period in which the statutory rate change is enacted in law.
As of December 31, 2012, we had recorded a valuation allowance on our net deferred tax assets. In assessing the recoverability of deferred tax assets, management considers whether it is more likely than not that some portion or all of the deferred tax assets will be realized. The realization of deferred tax assets is dependent upon generation of future taxable income during the periods in which temporary differences such as loss carry-forwards and tax credits become deductible. Management considers projected future taxable income and tax planning strategies in making this assessment and ensuring that the deferred tax asset valuation allowance is adjusted as appropriate. As of December 31, 2012, based on the accumulation of negative evidence, such as inconsistent quarterly earnings, including operating losses in the three months ended December 31, 2011, March 31, 2012 and June 30, 2012, continued heavy investment in research and development activities and in our infrastructure, and international expansion, management determined it was not more likely than not that the benefits of our deferred tax assets will be realized. If we determine in the future that we will be able to realize all or a portion of our net operating loss or tax credit carryforwards and other deferred tax assets, an adjustment to our net operating loss or tax credit carryforwards and other deferred tax assets would increase net income in the period in which we make such a determination.
We have assessed our income tax positions and recognized tax benefits for all years subject to examination, based upon evaluation of the facts, circumstances and information available at the end of each period. We recognize tax benefits from uncertain tax positions when it is more likely than not that the position will be sustained upon examination, including resolutions of any related appeals or litigation processes, based on the technical merits of the position. We record interest and penalties related to unrecognized tax benefits in our provision for income taxes.
Significant judgment is required in evaluating tax positions and determining the provision for income taxes. The objectives of accounting for income taxes are to recognize the amount of taxes payable or refundable for the current year and the deferred tax liabilities and assets for the future tax consequences of events that have been recognized in an entity’s financial statements or tax returns. Variations in the actual outcome of these future tax consequences could materially impact our financial position, results of operations or cash flows.
Stock-Based Compensation
We recognize compensation expense for our employee stock options over the requisite service period for awards of equity instruments based on the grant-date fair value of those awards ultimately expected to vest. Forfeitures are estimated on the date of grant and revised if actual or expected forfeiture activity differs materially from original estimates.
Determining the appropriate fair value model and calculating the fair value of stock-based payment awards requires the use of highly subjective assumptions, including the expected life of the stock-based payment awards and stock price volatility. The assumptions used in calculating the fair value of stock-based payment awards represent management’s best estimates, but the estimates involve inherent uncertainties and the application of management’s judgment. As a result, if factors change and we use different assumptions, our stock-based compensation expense could be materially different in the future.
We also record compensation representing the fair value of stock options granted to non-employees. Stock-based non-employee compensation is recognized over the vesting periods of the options. The value of options granted to non-employees is periodically remeasured as they vest over a performance period.
-57-
Table of Contents
Until the completion of our IPO on October 3, 2012, we were a private company and lacked company-specific historical and implied volatility information. Accordingly, we have estimated our expected volatility based on the historical volatility of our self-designated peer group consisting of publicly-held companies selected because of the similarity of their industry, business model and financial risk profile. The expected volatility of options granted has been determined using an average of the historical volatility measures of this peer group of companies for a period equal to the expected term of the option. We intend to continue to consistently apply this process using the same or similar entities until such time that sufficient information regarding the volatility of our share price becomes available or we determine that other companies should be added or are no longer suitable.
The expected term of options was estimated by analyzing the historical period from grant to settlement of the stock option. This analysis includes exercises and forfeitures, and also gives consideration to the expected holding period for those options that were still outstanding. The risk-free interest rate is based on a daily treasury yield curve rate that has a term consistent with the expected life of the stock option. We have not paid and do not anticipate paying cash dividends on our common stock, and therefore our expected dividend yield is assumed to be zero. We also estimate forfeitures at the time of grant and revise those estimates in subsequent periods if actual forfeitures differ from those estimates. We use historical data to estimate pre-vesting option forfeitures and record stock-based compensation expense only for those awards that are expected to vest. If our actual forfeiture rate is materially different from its estimate, the stock-based compensation expense could be significantly different from what we have recorded in the current period.
Pre-IPO Common Stock Valuations
We have historically granted stock options at exercise prices equal to the fair value as determined by our board of directors on the date of grant, with inputs from management. Because our common stock was not publicly traded prior to our IPO, our board of directors exercised significant judgment in determining the fair value of our common stock on the date of grant based on a number of objective and subjective factors. Factors considered by our board of directors included:
| • | contemporaneous independent valuations performed at periodic intervals by outside firms; |
| • | our results of operations, financial condition and future financial projections; |
| • | peer group trading multiples; |
| • | changes in the company since the last time the board of directors approved option grants and made a determination of fair value; |
| • | the illiquidity of shares of our common stock; and |
| • | our future prospects and opportunity for liquidity events such as an initial public offering and possible strategic merger or sale. |
Significant Factors, Assumptions and Methodologies Used in Determining the Fair Value of Common Stock
Prior to our IPO in September 2012, our valuation analysis was conducted under a probability-weighted expected return method, or PWERM, as prescribed by the AICPA Practice Aid, Valuation of Privately-Held-Company Equity Securities Issued as Compensation. The PWERM approach employs various market approach and income approach calculations depending upon the likelihood of various liquidation scenarios. For each of the various scenarios, an equity value is estimated and the rights and preferences for each shareholder class are considered to allocate the equity value to common shares. The common share value is then multiplied by a discount factor reflecting the calculated discount rate and the timing of the event. Lastly, the common share value is multiplied by an estimated probability for
-58-
Table of Contents
each scenario. The probability and timing of each scenario are based upon discussions between our board of directors and our management team. Under the PWERM, the value of our common stock is based on upon three possible future events for our company:
| • | Completion of an initial public offering; |
| • | Strategic merger or sale; and |
| • | Continuation as a private company. |
The market approach uses similar companies or transactions in the marketplace. We utilized the guideline publicly traded company method of the market approach for the initial public offering scenario and the guideline merged and acquired company method of the market approach for the strategic merger or sale scenario. We identified companies similar to our business and used this peer group of companies to develop relevant market multiples and ratios. We then applied these market multiples and ratios to our financial forecasts to create an indication of total equity value. The income approach, which we utilized to assess fair value of the common stock under the assumption we remained a private company, is an estimate of the present value of the future monetary benefits generated by an investment in that asset. Specifically, debt-free cash flows and the estimated terminal value are discounted at appropriate risk-adjusted discount rates to estimate the total invested capital value of the equity.
When considering which companies to include in our comparable peer companies, we focused on U.S. publicly traded companies in the IT security industry in which we operate and software-as-a-service companies with business models similar to ours. We considered a number of factors which required us to make judgments as to the comparability of these companies to ours, including business description, business size, revenue model, development stage and historical operating results. We then analyzed the business and financial profiles of the selected companies for similarities to us and, based on this assessment, we selected our comparable peer companies.
The selection of our comparable peer companies changed over time as we continued evaluating whether the selected companies remained comparable to us and considering recent initial public offerings and sale transactions. Based on these considerations, we believed the comparable peer companies were a representative group for purposes of performing contemporaneous valuations. However, there could be inherent differences that may impact comparability. Several of the comparable companies are larger than us in terms of total revenues and assets, and several have experienced net operating losses and have not yet generated net income.
Companies in the comparable peer group used for the initial public offering scenario were generally consistent with the peer group utilized to determine estimated volatility, subject to the following differences. The peer group of companies used to determine volatility was made up of a larger number of companies than that considered in our peer group for contemporaneous valuation purposes, primarily due to fewer common comparabilities to us. All but one company in our peer group used for contemporaneous valuation purposes were included in our peer group used to determine estimated volatility.
For all valuation periods presented, for the initial public offering scenario, we reviewed the forecasted twelve-month revenue and last twelve-month revenue multiples of comparable peer companies and selected an appropriate multiple based on our assessment of our comparability to these companies. We then applied the selected multiple to our forecasted twelve-month revenues and last twelve-month revenues and used an average of the two resulting values, which was weighted more heavily for the forecasted revenues, to determine our enterprise value under the initial public offering scenario.
For all valuation periods presented, for the merger or sale scenario, we reviewed the last twelve-month revenue and last twelve-month EBITDA multiples of comparable peer companies who were
-59-
Table of Contents
recently acquired and selected an appropriate multiple based on our assessment of our comparability to these companies. We then applied the selected multiple to our last twelve-month revenues and last twelve-month EBITDA and used an average of the two resulting values to determine our enterprise value under the merger or sale scenario.
We did not use comparable peer companies for any other estimates used in determining valuations. All other assumptions, such as the risk-adjusted discount rate, discount for lack of marketability, expected term and interest rate, were determined based on the analysis performed by us without reference to comparable peer companies.
Post-IPO Common Stock Valuations
Following our IPO, we established a policy of using the closing sales price per share as quoted on the NASDAQ Stock Market on the date of grant for purposes of determining the exercise price per share for our common stock options.
Fair Value Measurement
Fair value is defined as the price that would be received to sell an asset or paid to transfer a liability in an orderly transaction between market participants at the measurement date. For certain of our financial instruments, including cash and cash equivalents, short-term investments, accounts receivable, restricted cash, accounts payable, and other current liabilities, the carrying amounts approximate their fair value due to the relatively short maturity of these balances.
We measure and report our cash equivalents, short-term investments and a derivative forward currency contract at fair value in accordance with the provisions of the authoritative accounting guidance that addresses fair value measurements. This guidance establishes a hierarchy for inputs used in measuring fair value that maximizes the use of observable inputs and minimizes the use of unobservable inputs by requiring that the most observable inputs be used when available. The hierarchy is broken down into three levels based on the reliability of inputs as follows:
Level 1—Valuations based on quoted prices in active markets for identical assets or liabilities.
Level 2—Valuations based on other than quoted prices in active markets for identical assets and liabilities, quoted prices for identical or similar assets or liabilities in inactive markets, or other inputs that are observable or can be corroborated by observable market data for substantially the full term of the assets or liabilities.
Level 3—Valuations based on inputs that are generally unobservable and typically reflect management’s estimates of assumptions that market participants would use in pricing the asset or liability.
Our financial instruments consist of assets measured using Level 1 and 2 inputs. Level 1 assets include a highly liquid money market fund, which is valued using unadjusted quoted prices that are available in an active market for an identical asset. Level 2 assets include fixed-income U.S. government agency securities, commercial paper and derivative financial instruments consisting of forward currency contracts. The securities and commercial paper are valued using prices from independent pricing services based on quoted prices in active markets for similar instruments or on industry models using data inputs such as interest rates and prices that can be directly observed or corroborated in active markets. The foreign currency forward contracts are valued using observable inputs. See Note 2 to our consolidated financial statements included elsewhere in this Annual Report on Form 10-K for more information regarding the fair value measurement of our financial instruments.
-60-
Table of Contents
| Item 7A. | Quantitative and Qualitative Disclosures about Market Risk |
We have domestic and international operations and we are exposed to market risks in the ordinary course of our business. These risks primarily include interest rate, foreign exchange and inflation risks, as well as risks relating to changes in the general economic conditions in the countries where we conduct business. To reduce certain of these risks, we monitor the financial condition of our large customers and limit credit exposure by collecting subscription fees in advance.
Foreign Currency Risk
Our results of operations and cash flows have been and will continue to be subject to fluctuations because of changes in foreign currency exchange rates, particularly changes in exchange rates between the U.S. dollar and the Euro and British pound, the currencies of countries where we currently have our most significant international operations. A portion of our invoicing is denominated in the Euro, British pound and Japanese yen. Our expenses in international locations are generally denominated in the currencies of the countries in which our operations are located.
Beginning in December 2011, we began to use foreign exchange forward contracts to partially mitigate the impact of fluctuations in cash and accounts receivable balances denominated in Euros. We do not use these contracts for speculative or trading purposes, nor are they designated as hedges. These contracts typically have a maturity of one month, and we record gains and losses from these instruments in other income (expense), net.
Interest Rate Sensitivity
We have $118.4 million in cash, cash equivalents and short-term investments at December 31, 2012. Cash and cash equivalents include cash held in banks and highly liquid money market funds and commercial paper. Short-term investments consist of fixed-income U.S. government agency securities and commercial paper. All of these investments have maturities of less than one year from date of purchase.
The primary objective of our investment activities is the preservation of principal and supporting our liquidity requirements. We do not enter into investments for trading or speculative purposes. Our investments are subject to market risk due changes in interest rates, which may affect the interest income we earn and the fair market value of the investments. Due to the short-term nature of these investments, we do not believe that a 10% increase or decrease in interest rates would have a material impact. We therefore do not expect our operating results or cash flows to be materially affected by a sudden change in market interest rates.
-61-
Table of Contents
| Item 8. | Financial Statements and Supplementary Data |
Qualys, Inc.
INDEX TO CONSOLIDATED FINANCIAL STATEMENTS
Table of Contents
| Page | ||||
| 63 | ||||
| 64 | ||||
| 65 | ||||
| 66 | ||||
| 67 | ||||
| Consolidated Statements of Convertible Preferred Stock and Stockholders’ Equity (Deficit) |
68 | |||
| 69 | ||||
-62-
Table of Contents
Report of Independent Registered Public Accounting Firm
Board of Directors and Shareholders
Qualys, Inc.
We have audited the accompanying consolidated balance sheets of Qualys, Inc. (a Delaware corporation) and subsidiaries (the “Company”) as of December 31, 2012 and 2011, and the related consolidated statements of income, comprehensive income, cash flows and convertible preferred stock and stockholders’ equity (deficit) for each of the three years in the period ended December 31, 2012. Our audits of the basic consolidated financial statements included the financial statement schedule listed in the index appearing under Item 15(a)(2). These financial statements and financial statement schedule are the responsibility of the Company’s management. Our responsibility is to express an opinion on these financial statements and financial statement schedule based on our audits.
We conducted our audits in accordance with the standards of the Public Company Accounting Oversight Board (United States). Those standards require that we plan and perform the audit to obtain reasonable assurance about whether the financial statements are free of material misstatement. The Company is not required to have, nor were we engaged to perform an audit of its internal control over financial reporting. Our audits included consideration of internal control over financial reporting as a basis for designing audit procedures that are appropriate in the circumstances, but not for the purpose of expressing an opinion on the effectiveness of the Company’s internal control over financial reporting. Accordingly, we express no such opinion. An audit also includes examining, on a test basis, evidence supporting the amounts and disclosures in the financial statements, assessing the accounting principles used and significant estimates made by management, as well as evaluating the overall financial statement presentation. We believe that our audits provide a reasonable basis for our opinion.
In our opinion, the consolidated financial statements referred to above present fairly, in all material respects, the financial position of Qualys, Inc. and subsidiaries as of December 31, 2012 and 2011, and the results of their operations and their cash flows for each of the three years in the period ended December 31, 2012, in conformity with accounting principles generally accepted in the United States of America. Also, in our opinion, the related financial statement schedule, when considered in relation to the basic consolidated financial statements taken as a whole, presents fairly, in all material respects, the information set forth therein.
/s/ GRANT THORNTON LLP
San Francisco, California
March 5, 2013
-63-
Table of Contents
Qualys, Inc.
(in thousands, except share and per share data)
| December 31, | ||||||||
| 2012 | 2011 | |||||||
| Assets |
||||||||
| Current assets: |
||||||||
| Cash and cash equivalents |
$ | 34,885 | $ | 24,548 | ||||
| Short-term investments |
83,547 | — | ||||||
| Accounts receivable, net of allowance of $331 and $230 at December 31, 2012 and 2011, respectively |
24,545 | 20,750 | ||||||
| Prepaid expenses and other current assets |
4,377 | 3,774 | ||||||
|
|
|
|
|
|||||
| Total current assets |
147,354 | 49,072 | ||||||
| Restricted cash |
114 | 112 | ||||||
| Property and equipment, net |
18,148 | 13,861 | ||||||
| Intangible assets, net |
2,811 | 3,175 | ||||||
| Goodwill |
317 | 317 | ||||||
| Other noncurrent assets |
1,574 | 2,252 | ||||||
|
|
|
|
|
|||||
| Total assets |
$ | 170,318 | $ | 68,789 | ||||
|
|
|
|
|
|||||
| Liabilities, Convertible Preferred Stock and Stockholders’ Equity (Deficit) |
||||||||
| Current Liabilities : |
||||||||
| Accounts payable |
$ | 2,031 | $ | 2,254 | ||||
| Accrued liabilities |
7,803 | 8,468 | ||||||
| Deferred revenues, current |
56,497 | 46,717 | ||||||
| Capital lease obligations, current |
1,183 | 1,987 | ||||||
|
|
|
|
|
|||||
| Total current liabilities |
67,514 | 59,426 | ||||||
| Deferred revenues, noncurrent |
8,616 | 4,713 | ||||||
| Income taxes payable, noncurrent |
594 | 661 | ||||||
| Other noncurrent liabilities |
1,231 | 2,134 | ||||||
| Capital lease obligations, noncurrent |
808 | 2,406 | ||||||
|
|
|
|
|
|||||
| Total liabilities |
78,763 | 69,340 | ||||||
| Commitments and contingencies |
||||||||
| Convertible preferred stock: |
||||||||
| Series A convertible preferred stock: $0.001 par value; no shares authorized, issued and outstanding at December 31, 2012; 48,079,860 shares authorized, 4,766,543 shares issued and outstanding at December 31, 2011; aggregate liquidation preference—$0 and $28,774 at December 31, 2012 and 2011 |
— | 28,603 | ||||||
| Series B convertible preferred stock: $0.001 par value; no shares authorized, issued and outstanding at December 31, 2012; 110,314,114 shares authorized, 11,031,387 shares issued and outstanding at December 31, 2011; aggregate liquidation preference—$0 and $28,862 at December 31, 2012 and 2011 |
— | 28,568 | ||||||
| Series C convertible preferred stock: $0.001 par value; no shares authorized, issued and outstanding at December 31, 2012; 18,006,026 shares authorized, 1,799,328 shares issued and outstanding at December 31, 2011; aggregate liquidation preference—$0 and $6,631 at December 31, 2012 and 2011 |
— | 6,702 | ||||||
|
|
|
|
|
|||||
| Total convertible preferred stock |
— | 63,873 | ||||||
| Stockholders’ equity (deficit): |
||||||||
| Preferred stock: $0.001 par value; 20,000,000 shares authorized, no shares issued and outstanding at December 31, 2012; no shares authorized, issued and outstanding at December 31, 2011 |
— | — | ||||||
| Common stock, $0.001 par value; 1,000,000,000 shares authorized, 31,420,028 shares issued and outstanding at December 31, 2012; 299,900,000 shares authorized, 5,300,288 shares issued and outstanding at December 31, 2011 |
31 | 5 | ||||||
| Additional paid-in capital |
166,651 | 12,927 | ||||||
| Accumulated other comprehensive loss |
(1,035 | ) | (984 | ) | ||||
| Accumulated deficit |
(74,092 | ) | (76,372 | ) | ||||
|
|
|
|
|
|||||
| Total stockholders’ equity (deficit) |
91,555 | (64,424 | ) | |||||
|
|
|
|
|
|||||
| Total liabilities, convertible preferred stock and stockholders’ equity (deficit) |
$ | 170,318 | $ | 68,789 | ||||
|
|
|
|
|
|||||
See accompanying Notes to Consolidated Financial Statements
-64-
Table of Contents
Qualys, Inc.
CONSOLIDATED STATEMENTS OF INCOME
(in thousands, except per share data)
| Year Ended December 31, | ||||||||||||
| 2012 | 2011 | 2010 | ||||||||||
| Revenues |
$ | 91,420 | $ | 76,212 | $ | 65,432 | ||||||
| Cost of revenues |
18,404 | 13,247 | 11,204 | |||||||||
|
|
|
|
|
|
|
|||||||
| Gross profit |
73,016 | 62,965 | 54,228 | |||||||||
| Operating expenses: |
||||||||||||
| Research and development |
20,195 | 19,633 | 15,780 | |||||||||
| Sales and marketing |
37,738 | 31,526 | 29,056 | |||||||||
| General and administrative |
12,079 | 8,900 | 8,183 | |||||||||
|
|
|
|
|
|
|
|||||||
| Total operating expenses |
70,012 | 60,059 | 53,019 | |||||||||
|
|
|
|
|
|
|
|||||||
| Income from operations |
3,004 | 2,906 | 1,209 | |||||||||
| Other income (expense), net: |
||||||||||||
| Interest expense |
(192 | ) | (204 | ) | (186 | ) | ||||||
| Interest income |
14 | 14 | 3 | |||||||||
| Other income (expense), net |
(188 | ) | (346 | ) | (383 | ) | ||||||
|
|
|
|
|
|
|
|||||||
| Total other income (expense), net |
(366 | ) | (536 | ) | (566 | ) | ||||||
|
|
|
|
|
|
|
|||||||
| Income before provision for income taxes |
2,638 | 2,370 | 643 | |||||||||
| Provision for (benefit from) income taxes |
358 | 416 | (204 | ) | ||||||||
|
|
|
|
|
|
|
|||||||
| Net income |
$ | 2,280 | $ | 1,954 | $ | 847 | ||||||
|
|
|
|
|
|
|
|||||||
| Net income attributable to common stockholders |
$ | 1,076 | $ | 436 | $ | 179 | ||||||
|
|
|
|
|
|
|
|||||||
| Net income per share attributable to common stockholders: |
||||||||||||
| Basic |
$ | 0.09 | $ | 0.09 | $ | 0.04 | ||||||
|
|
|
|
|
|
|
|||||||
| Diluted |
$ | 0.08 | $ | 0.08 | $ | 0.04 | ||||||
|
|
|
|
|
|
|
|||||||
| Weighted average shares used in computing net income per share attributable to common stockholders: |
||||||||||||
| Basic |
11,891 | 5,053 | 4,706 | |||||||||
|
|
|
|
|
|
|
|||||||
| Diluted |
28,352 | 24,194 | 23,562 | |||||||||
|
|
|
|
|
|
|
|||||||
See accompanying Notes to Consolidated Financial Statements
-65-
Table of Contents
Qualys, Inc.
CONSOLIDATED STATEMENTS OF COMPREHENSIVE INCOME
(in thousands)
| Year Ended December 31, | ||||||||||||
| 2012 | 2011 | 2010 | ||||||||||
| Net income |
$ | 2,280 | $ | 1,954 | $ | 847 | ||||||
| Foreign currency translation gain (loss), net of zero tax |
(59 | ) | (166 | ) | (9 | ) | ||||||
| Change in unrealized gain (loss) on short-term investments, net of zero tax |
8 | — | — | |||||||||
|
|
|
|
|
|
|
|||||||
| Other comprehensive income (loss), net |
(51 | ) | (166 | ) | (9 | ) | ||||||
|
|
|
|
|
|
|
|||||||
| Comprehensive income |
$ | 2,229 | $ | 1,788 | $ | 838 | ||||||
|
|
|
|
|
|
|
|||||||
See accompanying Notes to Consolidated Financial Statements
-66-
Table of Contents
Qualys, Inc.
CONSOLIDATED STATEMENTS OF CASH FLOWS
(in thousands)
| Year Ended December 31, | ||||||||||||
| 2012 | 2011 | 2010 | ||||||||||
| (in thousands) | ||||||||||||
| Cash flows from operating activities: |
||||||||||||
| Net income |
$ | 2,280 | $ | 1,954 | $ | 847 | ||||||
| Adjustments to reconcile net income to net cash provided by operating activities: |
||||||||||||
| Depreciation and amortization expense |
7,341 | 5,373 | 4,569 | |||||||||
| Bad debt expense |
218 | 193 | 117 | |||||||||
| Loss on disposal of property and equipment |
10 | 1 | 13 | |||||||||
| Stock-based compensation |
3,452 | 2,147 | 1,870 | |||||||||
| Non-cash interest expense |
24 | 36 | 12 | |||||||||
| Amortization of premiums on short-term investments |
7 | — | — | |||||||||
| Changes in operating assets and liabilities: |
||||||||||||
| Accounts receivable |
(4,014 | ) | (6,651 | ) | (1,166 | ) | ||||||
| Prepaid expenses and other assets |
91 | (3,835 | ) | (112 | ) | |||||||
| Accounts payable |
(242 | ) | 1,248 | (82 | ) | |||||||
| Accrued liabilities |
(1,163 | ) | 2,817 | (182 | ) | |||||||
| Deferred revenues |
13,683 | 11,885 | 4,415 | |||||||||
| Income taxes payable |
181 | 333 | (488 | ) | ||||||||
| Other noncurrent liabilities |
84 | 1,689 | 83 | |||||||||
|
|
|
|
|
|
|
|||||||
| Net cash provided by operating activities |
21,952 | 17,190 | 9,896 | |||||||||
|
|
|
|
|
|
|
|||||||
| Cash flows from investing activities: |
||||||||||||
| Purchases of short-term investments |
(83,547 | ) | — | — | ||||||||
| Purchases of property and equipment |
(11,188 | ) | (7,499 | ) | (1,510 | ) | ||||||
| Purchases of intangible assets |
(49 | ) | — | — | ||||||||
| Acquisition of business, net |
— | — | (2,751 | ) | ||||||||
|
|
|
|
|
|
|
|||||||
| Net cash used in investing activities |
(94,784 | ) | (7,499 | ) | (4,261 | ) | ||||||
|
|
|
|
|
|
|
|||||||
| Cash flows from financing activities: |
||||||||||||
| Proceeds from initial public offering, net of offering costs |
84,534 | — | — | |||||||||
| Proceeds from exercise of stock options |
1,685 | 948 | 522 | |||||||||
| Proceeds from early exercise of stock options |
384 | 390 | 80 | |||||||||
| Proceeds from issuance of Series C Preferred Stock |
— | 128 | — | |||||||||
| Principal payments under capital lease obligations |
(2,401 | ) | (1,476 | ) | (1,149 | ) | ||||||
| Non-contingent payment related to acquisition |
(1,000 | ) | — | — | ||||||||
|
|
|
|
|
|
|
|||||||
| Net cash provided by (used in) financing activities |
83,202 | (10 | ) | (547 | ) | |||||||
|
|
|
|
|
|
|
|||||||
| Effect of exchange rate changes on cash and cash equivalents |
(33 | ) | (143 | ) | (27 | ) | ||||||
|
|
|
|
|
|
|
|||||||
| Net increase in cash and cash equivalents |
10,337 | 9,538 | 5,061 | |||||||||
| Cash and cash equivalents at beginning of period |
24,548 | 15,010 | 9,949 | |||||||||
|
|
|
|
|
|
|
|||||||
| Cash and cash equivalents at end of period |
$ | 34,885 | $ | 24,548 | $ | 15,010 | ||||||
|
|
|
|
|
|
|
|||||||
| Supplemental disclosures of cash flow information |
||||||||||||
| Cash paid for interest expense |
$ | 162 | $ | 128 | $ | 163 | ||||||
| Cash paid for income taxes, net of refunds |
299 | 108 | 303 | |||||||||
| Non-cash investing and financing activities |
||||||||||||
| Purchase of property and equipment under capital lease |
— | 3,100 | 2,467 | |||||||||
| Vesting of early exercised common stock options |
155 | 52 | 32 | |||||||||
| Conversion of convertible preferred stock to common stock |
63,873 | — | — | |||||||||
| Issuance of common stock for acquisition of business |
— | — | 77 | |||||||||
| Issuance of common stock for acquisition of license |
51 | — | — | |||||||||
See accompanying Notes to Consolidated Financial Statements
-67-
Table of Contents
Qualys, Inc.
CONSOLIDATED STATEMENTS OF CONVERTIBLE PREFERRED STOCK
AND STOCKHOLDERS’ EQUITY (DEFICIT)
(in thousands, except share data)
| Convertible Preferred Stock |
Common Stock | Additional Paid-In Capital |
Accumulated Other Comprehensive Loss |
Accumulated Deficit |
Total Stockholders’ Equity (Deficit) |
|||||||||||||||||||||||||||||
| Shares | Amount | Shares | Amount | |||||||||||||||||||||||||||||||
| (in thousands, except share data) | ||||||||||||||||||||||||||||||||||
| Balances at December 31, 2009 |
17,562,410 | $ | 63,745 | 4,652,675 | $ | 5 | $ | 7,237 | $ | (809 | ) | $ | (79,173 | ) | $ | (72,740 | ) | |||||||||||||||||
| Net income |
— | — | — | — | — | — | 847 | 847 | ||||||||||||||||||||||||||
| Foreign currency translation |
— | — | — | — | — | (9 | ) | — | (9 | ) | ||||||||||||||||||||||||
| Issuance of common stock upon exercise of stock options |
— | — | 317,802 | — | 522 | — | — | 522 | ||||||||||||||||||||||||||
| Vesting of early exercised common stock options |
— | — | — | — | 32 | — | — | 32 | ||||||||||||||||||||||||||
| Repurchase of unvested early exercised stock options |
— | — | (136,876 | ) | — | — | — | — | — | |||||||||||||||||||||||||
| Issuance of common stock in exchange for services |
— | — | 3,750 | — | 15 | — | — | 15 | ||||||||||||||||||||||||||
| Issuance of common stock for acquisition of business |
— | — | 25,000 | — | 77 | — | — | 77 | ||||||||||||||||||||||||||
| Stock-based compensation |
— | — | — | — | 1,855 | — | — | 1,855 | ||||||||||||||||||||||||||
|
|
|
|
|
|
|
|
|
|
|
|
|
|
|
|
|
|||||||||||||||||||
| Balances at December 31, 2010 |
17,562,410 | 63,745 | 4,862,351 | 5 | 9,738 | (818 | ) | (78,326 | ) | (69,401 | ) | |||||||||||||||||||||||
|
|
|
|
|
|
|
|
|
|
|
|
|
|
|
|
|
|||||||||||||||||||
| Net income |
— | — | — | — | — | — | 1,954 | 1,954 | ||||||||||||||||||||||||||
| Foreign currency translation |
— | — | — | — | — | (166 | ) | — | (166 | ) | ||||||||||||||||||||||||
| Issuance of Series C Preferred Stock upon exercise of warrants |
34,848 | 128 | — | — | — | — | — | — | ||||||||||||||||||||||||||
| Issuance of common stock upon exercise of stock options |
— | — | 432,687 | — | 948 | — | — | 948 | ||||||||||||||||||||||||||
| Vesting of early exercised common stock options |
— | — | — | — | 52 | — | — | 52 | ||||||||||||||||||||||||||
| Repurchase of unvested early exercised stock options |
— | — | (1,000 | ) | — | — | — | — | — | |||||||||||||||||||||||||
| Issuance of common stock in exchange for services |
— | — | 6,250 | — | 59 | — | — | 59 | ||||||||||||||||||||||||||
| Stock-based compensation |
— | — | — | — | 2,088 | — | — | 2,088 | ||||||||||||||||||||||||||
| Other adjustments |
— | — | — | — | 42 | — | — | 42 | ||||||||||||||||||||||||||
|
|
|
|
|
|
|
|
|
|
|
|
|
|
|
|
|
|||||||||||||||||||
| Balances at December 31, 2011 |
17,597,258 | 63,873 | 5,300,288 | 5 | 12,927 | (984 | ) | (76,372 | ) | (64,424 | ) | |||||||||||||||||||||||
|
|
|
|
|
|
|
|
|
|
|
|
|
|
|
|
|
|||||||||||||||||||
| Net income |
— | — | — | — | — | — | 2,280 | 2,280 | ||||||||||||||||||||||||||
| Foreign currency translation |
— | — | — | — | — | (59 | ) | — | (59 | ) | ||||||||||||||||||||||||
| Change in unrealized gain(loss) on short-term investments |
— | — | — | — | — | 8 | — | 8 | ||||||||||||||||||||||||||
| Issuance of common stock upon initial public offering, net of offering costs |
— | — | 7,836,250 | 8 | 84,526 | — | — | 84,534 | ||||||||||||||||||||||||||
| Conversion of preferred stock to common stock upon initial public offering |
(17,597,258 | ) | (63,873 | ) | 17,597,258 | 17 | 63,856 | — | — | 63,873 | ||||||||||||||||||||||||
| Issuance of common stock upon exercise of stock options |
— | — | 724,316 | 1 | 1,684 | — | — | 1,685 | ||||||||||||||||||||||||||
| Vesting of early exercised common stock options |
— | — | — | — | 155 | — | — | 155 | ||||||||||||||||||||||||||
| Repurchase of unvested early exercised stock options |
— | — | (60,126 | ) | — | — | — | — | — | |||||||||||||||||||||||||
| Issuance of common stock in exchange for services |
— | — | 15,945 | — | 45 | — | — | 45 | ||||||||||||||||||||||||||
| Issuance of common stock for acquisition of license |
— | — | 6,097 | — | 51 | — | — | 51 | ||||||||||||||||||||||||||
| Stock-based compensation |
— | — | — | — | 3,407 | — | — | 3,407 | ||||||||||||||||||||||||||
|
|
|
|
|
|
|
|
|
|
|
|
|
|
|
|
|
|||||||||||||||||||
| Balances at December 31, 2012 |
— | $ | — | 31,420,028 | $ | 31 | $ | 166,651 | $ | (1,035 | ) | $ | (74,092 | ) | $ | 91,555 | ||||||||||||||||||
|
|
|
|
|
|
|
|
|
|
|
|
|
|
|
|
|
|||||||||||||||||||
See accompanying Notes to Consolidated Financial Statements
-68-
Table of Contents
Qualys, Inc.
NOTES TO CONSOLIDATED FINANCIAL STATEMENTS
NOTE 1. The Company and Summary of Significant Accounting Policies
Description of Business
Qualys, Inc. (the “Company”) was incorporated in the state of Delaware on December 30, 1999. The Company is headquartered in Redwood City, California and has majority-owned subsidiaries throughout the world. The Company is a pioneer and leading provider of cloud security and compliance solutions that enable organizations to identify security risks to their IT infrastructures, help protect their IT systems and applications from ever-evolving cyber attacks and achieve compliance with internal policies and external regulations. The Company’s cloud solutions address the growing security and compliance complexities and risks that are amplified by the dissolving boundaries between internal and external IT infrastructures and web environments, the rapid adoption of cloud computing and the proliferation of geographically dispersed IT assets. Organizations can use the Company’s integrated suite of solutions delivered on its QualysGuard Cloud Platform to cost-effectively obtain a unified view of their security and compliance posture across globally-distributed IT infrastructures.
Initial Public Offering
On October 3, 2012, the Company closed its initial public offering (“IPO”) of 8,711,250 shares of common stock at an offering price of $12.00 per share. The offering included 7,836,250 shares sold and issued by the Company and 875,000 shares sold by selling stockholders. The shares sold in the offering included 1,136,250 shares sold by the Company pursuant to the underwriters’ full exercise of their over-allotment option. The net proceeds to the Company from the offering were approximately $87.5 million after deducting underwriting discounts and commissions, and before deducting total expenses in connection with this offering of $2.9 million. Immediately prior to the closing, all of the Company’s 17,597,258 outstanding shares of convertible preferred stock converted into an equivalent number of shares of common stock.
Basis of Presentation
The accompanying consolidated financial statements and footnotes have been prepared in accordance with accounting principles generally accepted in the United States (“U.S. GAAP”) and include all adjustments necessary for the fair presentation of the Company’s consolidated financial position, results of operations and cash flows for the periods presented. The accompanying consolidated financial statements include the accounts of the Company and its majority-owned subsidiaries. All significant intercompany transactions and balances have been eliminated.
Certain prior year amounts have been reclassified to conform to the current year presentation. These reclassifications did not change previously reported total assets, liabilities, convertible preferred stock, stockholders’ equity (deficit), income from operations or net income.
Use of Estimates
The preparation of the consolidated financial statements in conformity with U.S. GAAP requires management to make certain estimates and assumptions that affect the reported amounts of assets and liabilities and disclosure of contingent assets and liabilities at the date of the consolidated financial statements and the reported results of operations during the reporting period. The Company’s management regularly assesses these estimates, which primarily affect revenue recognition, the valuation of accounts receivable, goodwill and intangible assets, common stock, stock-based compensation and the valuation allowances associated with deferred tax assets. Actual results could differ from those estimates and such differences may be material to the accompanying consolidated financial statements.
-69-
Table of Contents
Convertible Preferred Stock
Prior to the completion of our IPO, a sale of all or substantially all of the Company’s assets or merger or consolidation of the Company with another entity was treated as a liquidation unless, following such transaction, the Company’s stockholders directly or indirectly owned, in the aggregate, more than 50% of the total voting power of the surviving or acquiring entity. These liquidation provisions and the extent of preferred stock holdings resulted in the convertible preferred stock having redemption features that were not solely in the control of the Company. Because a potential purchaser could have acquired a majority of the outstanding voting stock, triggering a redemption that was outside of the Company’s control, all shares of convertible preferred stock were presented outside of permanent equity in the accompanying consolidated balance sheet as of December 31, 2011.
On October 3, 2012, immediately prior to the closing of the Company’s IPO, all outstanding shares of convertible preferred stock converted into an equivalent number of shares of common stock. The related carrying value of the convertible preferred stock of $63.9 million was reclassified to common stock and additional paid-in capital at the time of the conversion.
Concentration of Credit Risk
The Company invests its cash, cash equivalents and short-term investments with major financial institutions. Cash balances with any one institution at times may be in excess of federally insured limits. Cash equivalents and short-term investments are invested in high-quality investment grade financial instruments and are diversified. The Company has not experienced any losses in such accounts and believes it is not exposed to any significant credit risk.
Credit risk with respect to accounts receivable is dispersed due to the large number of customers. In addition, the Company’s credit risk is mitigated by the relatively short collection period. Collateral is not required for accounts receivable. The Company maintains an allowance for potential credit losses based upon the expected collectability of accounts receivable. The Company writes off its receivables when collectability is deemed to be doubtful. As of December 31, 2012, no customer or channel partner accounted for more than 10% of the Company’s accounts receivable balance. One channel partner accounted for 13% of the Company’s accounts receivable balance as of December 31, 2011.
Cash, Cash Equivalents and Short-Term Investments
Cash and cash equivalents include cash held in banks and highly liquid money market funds and commercial paper, all with original maturities of three months or less when acquired. Short-term investments consist of fixed-income U.S. government agency securities and commercial paper, all with original maturities greater than three months and less than one year.
Cash is stated at cost, which approximates fair market value. Cash equivalents and short-term investments are classified as available-for-sale and are carried at fair value. Unrealized gains and losses in fair value are reported in other comprehensive income (loss) and are included in the consolidated statement of convertible preferred stock and stockholders’ equity (deficit). When the available-for-sale securities are sold, cost is based on the specific identification method, and the realized gains and losses are included in other income (expense) in the consolidated statements of income. Short-term investments are reviewed quarterly for impairment that is deemed to be other-than-temporary. An investment is considered other-than-temporarily impaired when its fair value is below its amortized cost and (1) there is an intent to sell the security, (2) it is “more likely than not” that the security will be sold before recovery of its amortized cost basis or (3) the present value of expected cash flows from the investment is not expected to recover the entire amortized cost basis. Declines in value that are considered to be other than temporary and adjustments to amortized cost for the amortization of premiums and the accretion of discounts are recorded in other income (expense). Interest and dividends are recorded in interest income as earned.
-70-
Table of Contents
Accounts Receivable
Accounts receivable are recorded at the invoiced amount and do not bear interest. The allowance for doubtful accounts represents the Company’s best estimate of the amount of probable credit losses and is determined based on a review of existing accounts receivable by aging category to identify significant customers or invoices with collectability issues. For those invoices not specifically reviewed, the reserve is calculated based on the age of the receivable.
Any change in the assumptions used in analyzing a specific account receivable may result in an additional provision for doubtful accounts being recognized in the period in which the change occurs. When the Company ultimately concludes that a receivable is uncollectible, the balance is written off against the allowance for doubtful accounts. Payments subsequently received on such receivables are credited back to the allowance for doubtful accounts.
Restricted Cash
Restricted cash includes amounts maintained with banks as security deposits for certain leased facilities and, accordingly, is classified as a non-current asset. It is stated at cost, which approximates fair market value.
Property and Equipment, net
Property and equipment are stated at cost less accumulated depreciation and amortization. Depreciation is computed using the straight-line method over the estimated useful lives of the assets, which range from three to five years. Leasehold improvements are amortized on a straight-line basis over the lesser of the estimated useful life of the asset or the lease term. Property under capital lease is amortized over the term of the respective lease or the estimated useful life of the asset, whichever is shorter.
The Company purchases physical scanner appliances and other computer equipment that are provided on a subscription basis. This equipment is recorded within property and equipment on the accompanying consolidated balance sheet, and the depreciation is recorded to cost of revenues over an estimated useful life of three years.
Upon retirement or disposal, the cost of assets and the related accumulated depreciation are removed from the accounts and any resulting gain or loss is reflected in the consolidated statements of operations. Repairs and maintenance that do not extend the life of an asset are expensed as incurred and major improvements are capitalized as property and equipment.
Impairment of Long-Lived Assets
The Company evaluates its long-lived assets, which consist of property and equipment, and intangible assets subject to amortization, for indicators of possible impairment when events or changes in circumstances indicate the carrying amount of an asset may not be recoverable. Impairment exists if the carrying amounts of such assets exceed the estimates of future undiscounted cash flows expected to be generated by such assets. Should an impairment exist, the impairment loss would be measured based on the excess carrying value of the asset over the asset’s estimated fair value. As of December 31, 2012 and 2011, the Company has not written down any of its long-lived assets as a result of impairment.
Goodwill and Intangible Assets
Goodwill represents the excess of the purchase price over the fair value of the net tangible and identifiable intangible assets acquired in a business combination and is not subject to amortization. Goodwill and other intangible assets with indefinite lives are not amortized, but tested for impairment
-71-
Table of Contents
annually or if certain circumstances indicate a possible impairment may exist. These tests are performed at the reporting unit level. The Company’s operations are organized as one reporting unit.
In testing for a potential impairment of goodwill, the Company first performs a qualitative assessment of its reporting unit to determine if it is more likely than not (a more than 50% likelihood) that the fair value of the reporting unit is less than its carrying amount. If the fair value is not considered to be less than the carrying amount, no further evaluation is necessary. The Company performed the annual qualitative assessment for the year ended December 31, 2012 and concluded there was no impairment of goodwill.
In testing for a potential impairment of intangible assets with indefinite lives that are not subject to amortization, the Company first performs a qualitative assessment to determine if it is more likely than not (a more than 50% likelihood) that the fair value of the indefinite-lived intangible assets is less than the carrying amount. If the fair value is not considered to be less than the carrying amount, no further evaluation is necessary. The Company performed the annual qualitative assessment for the year ended December 31, 2012 and concluded there was no impairment of the indefinite-lived intangible assets.
If the qualitative assessment indicates there is more than a 50% likelihood that the fair value is less than the carrying amount, the Company would perform a two-step test. In the first step, the carrying value of the reporting unit or intangible asset is compared to its estimated fair value. If the estimated fair value is less than the carrying value, then potential impairment exists. In the second step, for goodwill, the Company calculates the amount of any impairment by determining the implied fair value of goodwill using a hypothetical purchase price allocation, similar to that which would be applied if it were an acquisition and the purchase price was equivalent to fair value as calculated in the first step. Impairment is equivalent to any excess of goodwill carrying value over its implied fair value. For indefinite-lived intangible assets, the Company performs the currently prescribed quantitative impairment test by comparing the fair value of the indefinite-lived intangible asset with its carrying value.
Certain other intangible assets acquired are amortized over their estimated useful lives and tested for impairment if certain circumstances indicate an impairment may exist. The Company’s intangible assets are comprised primarily of existing technology, patent license, and non-competition agreements and are amortized over periods ranging from three to fourteen years on a straight-line basis.
Software Development Costs
The Company capitalizes qualifying software costs developed or obtained for internal use. These costs generally include internal costs, such as payroll and benefits of those employees directly associated with the development of the software. Total capitalized development costs are $0.3 million at December 31, 2012 and 2011. The capitalized development costs are recorded within other noncurrent assets and were fully amortized at December 31, 2012 and 2011.
Derivative Financial Instruments
Derivative financial instruments are utilized by the Company to reduce foreign currency exchange risks. The Company uses foreign currency forward contracts to mitigate the impact of foreign currency fluctuations of certain non-U.S. dollar denominated asset positions, primarily cash and accounts receivable. These contracts are recorded within prepaid expenses and other current assets in the consolidated balance sheets. Gains and losses resulting from currency exchange rate movements on these forward contracts are recognized in other income (expense) in the accompanying consolidated statements of income in the period in which the exchange rates change and offset the foreign currency gains and losses on the underlying exposure being hedged. The Company does not enter into financial instruments for trading or speculative purposes.
-72-
Table of Contents
At December 31, 2012, the Company had one outstanding forward contract with a notional amount of 10.7 million Euros, which expired on January 31, 2013. At December 31, 2011, the Company had one outstanding forward contract with a notional amount of 3.7 million Euros, which expired on January 31, 2012. These contracts were entered into at the end of each period, and thus the fair value of the contracts was $0 at December 31, 2012 and 2011. The Company began to use these forward contracts in December 2011. In 2012, the Company recorded a loss of $0.4 million from these contracts, which was partially offset by foreign currency transaction gains of $0.2 million for the year. There were no gains or losses from forward contracts in 2011. These derivatives were not designated as hedges.
Stock-Based Compensation
The Company recognizes stock-based compensation expense for its employee stock options over the requisite service period for awards of equity instruments based on the grant-date fair value of those awards expected to vest. Forfeitures are estimated on the date of grant and revised if actual or expected forfeiture activity differs materially from original estimates.
Option grants to non-employees are accounted for at the fair value of the equity instrument issued, as calculated using the Black-Scholes model. The stock-based compensation expense for non-employees is subject to periodic adjustments as the options vest, and the expense is recognized over the period in which services are received.
Revenue Recognition
The Company derives revenues from subscriptions that require customers to pay a fee in order to access the Company’s cloud solutions. Customers generally enter into one year renewable subscriptions. The subscription fee entitles the customer to an unlimited number of scans for a specified number of networked devices or web applications and, if requested by a customer as part of their subscription, a specified number of physical or virtual scanner appliances. The Company’s physical and virtual scanner appliances are requested by certain customers as part of their subscriptions in order to scan IT infrastructures within their firewalls and do not function without, and are not sold separately from, subscriptions for the Company’s solutions. Customers are required to return physical scanner appliances if they do not renew their subscriptions.
The Company recognizes revenues when all of the following conditions are met:
| • | There is persuasive evidence of an arrangement. |
| • | The service has been provided to the customer. |
| • | The collection of the fees is reasonably assured. |
| • | The amount of fees to be paid by the customer is fixed or determinable. |
Subscriptions are recognized ratably over the subscription period. The Company recognizes revenues from subscriptions that include physical scanner appliances and other computer equipment ratably over the period of the subscription. Because the customer’s access to the Company’s cloud solutions are delivered at the same time as or within close proximity to the delivery of physical scanner appliances and the terms are commensurate for these services and equipment, the Company considers these elements as a single unit of accounting recognized ratably over the subscription period.
Beginning on January 1, 2011, the Company adopted authoritative accounting guidance on multiple-element arrangements, using the prospective method for all arrangements entered into or materially modified from the date of adoption. As a result of implementing this authoritative guidance, the Company’s revenues for 2012 and 2011 were not materially different from what would have been recognized under the previous guidance for multiple-element arrangements.
-73-
Table of Contents
Deferred revenues consist of revenues billed or received that will be recognized in the future under subscriptions existing at the balance sheet date. The current portion of deferred revenues represents amounts that are expected to be recognized within one year of the balance sheet date.
Costs of shipping and handling charges incurred by the Company associated with physical scanner appliances and other computer equipment are included in cost of revenues.
Sales taxes and other taxes collected from customers to be remitted to government authorities are excluded from revenues.
Advertising Expenses
Advertising costs are expensed as incurred and include costs of advertising, trade show costs and promotional materials. The Company incurred advertising costs of $4.3 million, $4.1 million, and $3.8 million for 2012, 2011 and 2010, respectively.
Income Taxes
The Company uses the asset and liability method to account for income taxes. Under this method, deferred tax assets and liabilities are determined based on differences between the financial reporting and tax basis of assets and liabilities. Deferred tax assets and liabilities are measured using statutory tax rates and laws that will be in effect when the differences are expected to reverse. A valuation allowance is established, when necessary, to reduce deferred tax assets to the amount expected to be realized.
The Company operates in various tax jurisdictions and is subject to audit by various tax authorities. Tax positions are based upon their technical merits, relevant tax law and the specific facts and circumstances as of each reporting period. Changes in facts and circumstances could result in material changes to the amounts recorded for such tax positions. A tax position is only recognized in the financial statements if it is “more likely than not” to be sustained based solely on its technical merits as of the reporting date. The Company considers many factors when evaluating and estimating its tax positions and tax benefits, which may require periodic adjustments that could result in recognition of additional tax benefits or additional charges to the tax provision and may not accurately reflect the actual outcomes. The Company’s policy is to recognize interest and penalties relating to unrecognized tax benefits as a component of the provision for income taxes.
Other Comprehensive Income (Loss)
Other comprehensive income (loss) consists of foreign currency translation adjustments and unrealized gains (losses) on available-for-sale short-term investments, which are not included in the Company’s net income. Both of these items are reflected net of tax. Total comprehensive income includes net income and other comprehensive income (loss) and is included in the consolidated statements of comprehensive income.
Foreign Currency Translation and Transactions
The Company’s operations are conducted in various countries around the world and the financial statements of its foreign subsidiaries are reported in the applicable local foreign currencies (functional currencies). Financial information is translated from the applicable functional currency to the U.S. dollar, the reporting currency, for inclusion in the Company’s consolidated financial statements. Accordingly, the assets and liabilities of the Company’s foreign subsidiaries are translated using exchange rates in effect as of the balance sheet date, and income and expenses are translated at average exchange rates during the period. Resulting translation adjustments are included as a component of accumulated other comprehensive income (loss) in stockholders’ equity (deficit).
-74-
Table of Contents
Foreign currency transaction gains or losses are recognized in other income (expense). The Company recorded foreign currency transaction gains (losses) of $(0.2) million, $(0.3) million and $(0.4) million during 2012, 2011 and 2010, respectively.
Fair Value Measurement
Fair value is defined as the price that would be received to sell an asset or paid to transfer a liability in an orderly transaction between market participants at the measurement date. For certain of the Company’s financial instruments, including cash and cash equivalents, short-term investments, accounts receivable, restricted cash, accounts payable, and other current liabilities, the carrying amounts approximate their fair value due to the relatively short maturity of these balances.
The Company measures and reports its cash equivalents, short-term investments and a derivative forward currency contract at fair value in accordance with the provisions of the authoritative accounting guidance that addresses fair value measurements. This guidance establishes a hierarchy for inputs used in measuring fair value that maximizes the use of observable inputs and minimizes the use of unobservable inputs by requiring that the most observable inputs be used when available. The hierarchy is broken down into three levels based on the reliability of inputs as follows:
Level 1—Valuations based on quoted prices in active markets for identical assets or liabilities.
Level 2—Valuations based on other than quoted prices in active markets for identical assets and liabilities, quoted prices for identical or similar assets or liabilities in inactive markets, or other inputs that are observable or can be corroborated by observable market data for substantially the full term of the assets or liabilities.
Level 3—Valuations based on inputs that are generally unobservable and typically reflect management’s estimates of assumptions that market participants would use in pricing the asset or liability.
The Company’s financial instruments consist of assets measured using Level 1 and 2 inputs. Level 1 assets include a highly liquid money market fund, which is valued using unadjusted quoted prices that are available in an active market for an identical asset. Level 2 assets include fixed-income U.S. government agency securities, commercial paper and derivative financial instruments consisting of forward currency contracts. The securities and commercial paper are valued using prices from independent pricing services based on quoted prices in active markets for similar instruments or on industry models using data inputs such as interest rates and prices that can be directly observed or corroborated in active markets. The foreign currency forward contracts are valued using observable inputs. See Note 2 for more information regarding the fair value measurement of the Company’s financial instruments.
Net Income Per Share Attributable to Common Stockholders
The Company computes net income attributable to common stockholders using the two-class method required for participating securities. Convertible preferred stock and common stock subject to repurchase resulting from the early exercise of stock options are considered to be participating securities since they contain non-forfeitable rights to dividends or dividend equivalents in the event the Company declares a dividend for common stock. In accordance with the two-class method, earnings allocated to these participating securities are subtracted from net income after deducting preferred stock dividends, if any, to determine total undistributed earnings to be allocated to common stockholders. The holders of our convertible preferred stock do not have a contractual obligation to share in our net losses and such shares are excluded from the computation of basic earnings per share in periods of net loss.
-75-
Table of Contents
Basic net income per share attributable to common stockholders is computed by dividing net income attributable to common stockholders by the weighted-average number of common shares outstanding during the period. All participating securities are excluded from basic weighted average common shares outstanding. In computing diluted net income attributable to common stockholders, undistributed earnings are reallocated to reflect the potential impact of dilutive securities. Diluted net income per share is computed by dividing net income attributable to common stockholders by the weighted-average number of shares of common stock outstanding during the period, adjusted for the effects of potentially dilutive common shares, which comprise outstanding stock options, warrants, convertible preferred stock and contingently issuable shares related to an acquisition. The dilutive potential common shares are computed using the treasury stock method or the as-if converted method, as applicable. The effects of outstanding stock options, warrants, convertible preferred stock and contingently issuable shares related to an acquisition are excluded from the computation of diluted net income per common share in periods in which the effect would be antidilutive.
Recent Accounting Pronouncements
Under the Jumpstart Our Business Startups Act (the “JOBS Act”), the Company meets the definition of an “emerging growth company.” The Company has irrevocably elected to opt out of the extended transition period for complying with new or revised accounting standards pursuant to Section 107(b) of the JOBS Act. As a result, the Company will comply with new or revised accounting standards on the relevant dates on which adoption of such standards is required from non-emerging growth companies.
In June 2011, the FASB issued ASU 2011-05, Comprehensive Income (Topic 220): Presentation of Comprehensive Income. The new guidance eliminated the option to report other comprehensive income and its components in the statement of changes in stockholders’ equity. Instead, an entity is required to present either a continuous statement of net income and other comprehensive income or in two separate but consecutive statements. The Company adopted this new amended guidance during the year ended December 31, 2012. Adoption of this new amended guidance resulted only in changes to presentation of the financial statements.
In December 2011, the FASB issued ASU 2011-11, Balance Sheet (Topic 210): Disclosures about Offsetting Assets and Liabilities. This newly issued accounting standard requires an entity to disclose both gross and net information about instruments and transactions eligible for offset in the statement of financial position as well as instruments and transactions executed under a master netting or similar arrangement and was issued to enable users of financial statements to understand the effects or potential effects of those arrangements on its financial position. This ASU is required to be applied retrospectively and is effective for fiscal years, and interim periods within those years, beginning on or after January 1, 2013. As this accounting standard only requires enhanced disclosure, the adoption of this standard is not expected to have an impact the Company’s financial position or results of operations.
In July 2012, the FASB issued ASU 2012-02, Intangibles—Goodwill and Other (Topic 350)—Testing Indefinite-Lived Intangible Assets for Impairment. This standard allows entities to use a qualitative approach to test indefinite-lived intangible assets for impairment. ASU 2012-02 permits an entity to first perform a qualitative assessment to determine whether it is more likely than not (a more than 50% likelihood) that the fair value of an indefinite-lived intangible asset is less than its carrying amount. If the fair value is not considered to be less than the carrying amount, no further evaluation is necessary. If there is more than 50% likelihood the fair value is less than the carrying amount, it is necessary to perform the currently prescribed quantitative impairment test by comparing the fair value of the indefinite-lived intangible asset with its carrying value. ASU 2012-02 is effective for annual and interim impairment tests performed for fiscal years beginning after September 15, 2012 and earlier adoption is permitted. The Company adopted this standard for the annual qualitative assessment of indefinite-live intangible assets for the year ended December 31, 2012, which did not have a material impact on its consolidated financial statements.
-76-
Table of Contents
Reverse Stock Split
In September 2012, the Company’s board of directors and stockholders approved an amendment to the Company’s amended and restated certificate of incorporation effecting a one-for-ten reverse stock split of the Company’s issued and outstanding shares of common and convertible preferred stock. The par value of the common and convertible preferred stock was not adjusted as a result of the reverse stock split. All issued and outstanding common stock, convertible preferred stock, warrants for convertible preferred stock, options for common stock, contingently issuable shares of common stock and per share amounts contained in the Company’s consolidated financial statements have been retroactively adjusted to reflect this reverse stock split for all periods presented.
NOTE 2. Fair Value of Financial Instruments
The Company’s cash and cash equivalents, short-term investments, and restricted cash consist of the following:
| December 31, 2012 | ||||||||||||||||
| Amortized Cost | Unrealized Gains |
Unrealized Losses |
Fair Value | |||||||||||||
| (in thousands) | ||||||||||||||||
| Cash and cash equivalents: |
||||||||||||||||
| Cash |
$ | 23,419 | $ | — | $ | — | $ | 23,419 | ||||||||
| Money market funds |
170 | — | — | 170 | ||||||||||||
| Commercial paper |
11,294 | 2 | — | 11,296 | ||||||||||||
|
|
|
|
|
|
|
|
|
|||||||||
| Total |
34,883 | 2 | — | 34,885 | ||||||||||||
|
|
|
|
|
|
|
|
|
|||||||||
| Short-term investments: |
||||||||||||||||
| Commercial paper |
21,078 | 2 | — | 21,080 | ||||||||||||
| U.S. government agencies |
62,463 | 4 | — | 62,467 | ||||||||||||
|
|
|
|
|
|
|
|
|
|||||||||
| Total |
83,541 | 6 | — | 83,547 | ||||||||||||
| Restricted cash—cash |
114 | — | — | 114 | ||||||||||||
|
|
|
|
|
|
|
|
|
|||||||||
| Total |
$ | 118,538 | $ | 8 | $ | — | $ | 118,546 | ||||||||
|
|
|
|
|
|
|
|
|
|||||||||
| December 31, 2011 | ||||||||||||||||
| Amortized Cost | Unrealized Gains |
Unrealized Losses |
Fair Value |
|||||||||||||
| (in thousands) | ||||||||||||||||
| Cash and cash equivalents—cash |
$ | 24,548 | $ | — | $ | — | $ | 24,548 | ||||||||
| Restricted cash—cash |
112 | — | — | 112 | ||||||||||||
|
|
|
|
|
|
|
|
|
|||||||||
| Total |
$ | 24,660 | $ | — | $ | — | $ | 24,660 | ||||||||
|
|
|
|
|
|
|
|
|
|||||||||
The following table sets forth by level within the fair value hierarchy the fair value of the Company’s available-for-sale securities measured on a recurring basis:
| December 31, 2012 | ||||||||||||||||
| Level 1 | Level 2 | Level 3 | Fair Value | |||||||||||||
| (in thousands) | ||||||||||||||||
| Commercial paper |
$ | — | $ | 32,376 | $ | — | $ | 32,376 | ||||||||
| U.S. government agencies |
— | 62,467 | — | 62,467 | ||||||||||||
|
|
|
|
|
|
|
|
|
|||||||||
| Total |
$ | — | $ | 94,843 | $ | — | $ | 94,843 | ||||||||
|
|
|
|
|
|
|
|
|
|||||||||
-77-
Table of Contents
At December 31, 2012 and 2011, a derivative financial instrument, consisting of a foreign currency forward contract, was valued at $0 as the contract was entered into on the last day of the period. This instrument was valued using Level 2 inputs.
There were no transfers between Level 1, Level 2 or Level 3 of the fair value hierarchy, as determined at the end of each reporting period.
NOTE 3. Property and Equipment, Net
Property and equipment, which includes assets under capital lease, consists of the following:
| December 31, | ||||||||
| 2012 | 2011 | |||||||
| (in thousands) | ||||||||
| Computer equipment |
$ | 18,798 | $ | 12,483 | ||||
| Computer software |
6,327 | 5,720 | ||||||
| Furniture, fixtures and equipment |
1,545 | 1,330 | ||||||
| Scanner appliances |
16,470 | 13,394 | ||||||
| Leasehold improvements |
1,672 | 1,418 | ||||||
|
|
|
|
|
|||||
| Total property and equipment |
44,812 | 34,345 | ||||||
| Less: accumulated depreciation and amortization |
(26,664 | ) | (20,484 | ) | ||||
|
|
|
|
|
|||||
| Property and equipment, net |
$ | 18,148 | $ | 13,861 | ||||
|
|
|
|
|
|||||
Assets held under capital lease included in computer equipment and software at December 31, 2012 and 2011 totaled approximately $8.1 million. The related accumulated depreciation at December 31, 2012 and 2011 totaled $4.9 million and $3.3 million, respectively. The capital lease obligations are secured by the related equipment and software.
Physical scanner appliances and other computer equipment that are or will be subject to subscriptions by customers have a net carrying value of $5.5 million and $3.4 million at December 31, 2012 and 2011, respectively, including assets that have not been placed in service of $1.5 million and $0.2 million, respectively. Other fixed assets not placed in service at December 31, 2012 and 2011, included in computer equipment and leasehold improvements, relate to new information technology systems and tenant improvements of approximately $1.7 million and $0.5 million, respectively. Depreciation and amortization expense relating to property and equipment, including capitalized leases, was $6.9 million, $4.9 million and $4.4 million for 2012, 2011 and 2010, respectively.
NOTE 4. Business Combination
On August 31, 2010, the Company acquired Nemean Networks, LLC (“Nemean”), a company developing network security solutions for detection and awareness of external intrusions to computer networks. The Company acquired Nemean to provide additional solutions on its cloud platform. The consideration for this acquisition consisted of $3.7 million in cash and common stock, including a non-contingent payment of $1.0 million in cash and 6,250 shares of common stock, both of which occurred in September 2012. The non-contingent cash payment amount was recorded in current liabilities at December 31, 2011 at its net present value. The Company accounted for this transaction as a business combination.
NOTE 5. Goodwill and Intangible Assets, Net
Intangible assets consist primarily of existing technology, patent license and non-competition agreements acquired in business combinations. Acquired intangibles are amortized on a straight-line basis over the respective estimated useful lives of the assets.
-78-
Table of Contents
The carrying values of intangible assets are as follows (in thousands):
| December 31, | ||||||||||||||||||||||||||||
| 2012 | 2011 | |||||||||||||||||||||||||||
| Estimated Lives |
Cost | Accumulated Amortization |
Net Book Value |
Cost | Accumulated Amortization |
Net Book Value |
||||||||||||||||||||||
| Existing technology |
7 years | $ | 1,910 | $ | (637 | ) | $ | 1,273 | $ | 1,910 | $ | (364 | ) | $ | 1,546 | |||||||||||||
| Patent license |
14 years | 1,388 | (223 | ) | 1,165 | 1,339 | (127 | ) | 1,212 | |||||||||||||||||||
| Non-competition agreements and other |
3 years | 171 | (93 | ) | 78 | 171 | (49 | ) | 122 | |||||||||||||||||||
|
|
|
|
|
|
|
|
|
|
|
|
|
|||||||||||||||||
| Total intangibles subject to amortization |
$ | 3,469 | $ | (953 | ) | 2,516 | $ | 3,420 | $ | (540 | ) | 2,880 | ||||||||||||||||
|
|
|
|
|
|
|
|
|
|||||||||||||||||||||
| Intangible assets not subject to amortization |
295 | 295 | ||||||||||||||||||||||||||
|
|
|
|
|
|||||||||||||||||||||||||
| Total intangible assets, net |
$ | 2,811 | $ | 3,175 | ||||||||||||||||||||||||
|
|
|
|
|
|||||||||||||||||||||||||
Intangibles amortization expense was $0.4 million, $0.4 million and $0.1 million for 2012, 2011 and 2010, respectively.
As of December 31, 2012, the Company expects amortization expense in future periods to be as follows (in thousands):
| 2013 |
$ | 417 | ||
| 2014 |
392 | |||
| 2015 |
385 | |||
| 2016 |
372 | |||
| 2017 |
281 | |||
| 2018 and thereafter |
669 | |||
|
|
|
|||
| Total expected future amortization expense |
$ | 2,516 | ||
|
|
|
Goodwill, which is not subject to amortization, totaled $0.3 million as of December 31, 2012 and 2011.
NOTE 6. Commitments and Contingencies
Line of Credit
In March 2009, the Company entered into an equipment line of credit of $1.5 million. The line of credit allowed the Company to borrow to purchase specific equipment. Each advance was immediately amortizable and payable in 30 monthly installments, with the final maturity date to be no later than September 2012. Each advance was secured by the specific equipment and carried an interest rate of 9.0%. In March 2010, the Company amended its equipment line of credit. The amount available for draws at the time of the amendment was increased by $0.8 million and was available through February 2011. Each advance was immediately amortizable and payable in 30 monthly installments, with final maturity date to be no later than August 2013, and carried an interest rate of 7.5%. In December 2010,
-79-
Table of Contents
the Company completed a second amendment to its equipment line of credit. The amount available for draws at the time of the amendment was increased by an additional $1.0 million and was available through February 2012. Each advance is immediately amortizable and payable in 30 monthly installments, with the final maturity date to be no later than August 2014, and carries an interest rate of 6.5%. At December 31, 2011, the Company had $0.9 million in outstanding borrowings under this line of credit, which are recorded in capital lease obligations in the consolidated balance sheet. The remaining amount available for borrowings at December 31, 2011 was $0.9 million. At December 31, 2012, the Company had no outstanding borrowings under this line of credit and the Company was not able to draw any further funds as the line expired in February 2012.
Leases
The Company leases certain computer equipment and its corporate office and data center facilities under noncancelable operating leases for varying periods through 2019. The Company has also entered into capital lease obligations, with varying interest rates from 1.8% to 9.0%, a portion of which are secured by the related computer equipment and software as of December 31, 2012 and 2011.
In 2011, the Company entered into a $3.1 million financing arrangement for computer software, accounted for as a capital lease, with minimum quarterly payments scheduled through 2014. In connection with this transaction, the Company also has minimum obligations for related maintenance and support of $1.6 million and $2.6 million at December 31, 2012 and 2011, respectively. Such obligation for maintenance and support is recorded in current and other noncurrent liabilities in the consolidated balance sheets.
The following are the minimum annual lease payments due under these leases at December 31, 2012:
| Operating Leases |
Capital Leases |
|||||||
| (in thousands) | ||||||||
| 2013 |
$ | 2,831 | $ | 1,213 | ||||
| 2014 |
2,088 | 815 | ||||||
| 2015 |
1,733 | — | ||||||
| 2016 |
1,448 | — | ||||||
| 2017 |
1,358 | — | ||||||
| 2018 and thereafter |
94 | — | ||||||
|
|
|
|
|
|||||
| Total minimum lease payments |
$ | 9,552 | 2,028 | |||||
|
|
|
|||||||
| Less amount representing interest |
(37 | ) | ||||||
|
|
|
|||||||
| Present value of minimum payments |
1,991 | |||||||
| Less current portion |
(1,183 | ) | ||||||
|
|
|
|||||||
| Capital lease obligations, noncurrent |
$ | 808 | ||||||
|
|
|
|||||||
Rent expense was $4.3 million, $3.4 million and $3.3 million for 2012, 2011 and 2010, respectively. Although certain of the operating lease agreements provide for escalating rent payments over the terms of the leases, rent expense under these agreements is recognized on a straight-line basis. As of December 31, 2012 and 2011, the Company has accrued $0.4 million and $0.3 million, respectively, of deferred rent related to these agreements, which is reflected in other noncurrent liabilities in the accompanying consolidated balance sheets.
-80-
Table of Contents
Sales and Other Taxes
The Company’s software-as-a-service solutions are subject to sales and other taxes in certain jurisdictions where the Company does business. The Company bills sales and other taxes to customers and remits these to the respective government authorities. For those jurisdictions where the Company has not yet billed sales tax to its customers and believes it may have exposure, it has recorded a provision of $0.4 million and $0.3 million at December 31, 2012 and 2011, respectively, which is recorded within accrued liabilities in the consolidated balance sheets. However, taxing jurisdictions have differing rules and regulations, which are subject to varying interpretations that may change over time. Other than the liability that the Company has accrued in its consolidated balance sheets, the Company has been unable to assess the probability, or estimate the amount, of its sales tax exposure, if any. There are no pending reviews at December 31, 2012 of which the outcome is expected to result in sales and other taxes due in excess of accrued liabilities. Management does not anticipate that its sales tax exposure, if any, would have a material adverse effect on the financial position, results of operations or cash flows of the Company.
Indemnifications
The Company from time to time enters into certain types of contracts that contingently require it to indemnify various parties against claims from third parties. These contracts primarily relate to (i) the Company’s by-laws, under which it must indemnify directors and executive officers, and may indemnify other officers and employees, for liabilities arising out of their relationship, (ii) contracts under which the Company must indemnify directors and certain officers for liabilities arising out of their relationship, and (iii) contracts under which the Company may be required to indemnify customers or resellers from certain liabilities arising from potential infringement of intellectual property rights, as well as potential damages caused by limited product defects. To date, the Company has not incurred and has not recorded any liability in connection with such indemnifications.
The Company maintains director and officer insurance, which may cover certain liabilities arising from its obligation to indemnify its directors.
Contingencies
From time to time, the Company may have certain contingent liabilities that arise in the ordinary course of its business activities. The Company accrues a liability for such matters when it is probable a loss has been incurred and such loss can be reasonably estimated. At December 31, 2012, the Company has not recorded any material liabilities in accordance with accounting for contingencies.
NOTE 7. Stockholders’ Equity
Common Stock
The Company had reserved shares of common stock for future issuance as of December 31, 2012:
| Options outstanding under equity incentive plans |
||||
| 2000 Equity Incentive Plan (1) |
6,366,633 | |||
| 2012 Equity Incentive Plan (1) |
146,875 | |||
| Shares available for future grants under equity incentive plans |
||||
| 2012 Equity Incentive Plan (1) |
2,902,125 | |||
|
|
|
|||
| Total shares reserved for future issuance |
9,415,633 | |||
|
|
|
| (1) | See Note 8 for a description of these plans. |
-81-
Table of Contents
Convertible Preferred Stock
As of December 31, 2012, there are no authorized, issued or outstanding shares of convertible preferred stock. All outstanding shares were converted to common stock immediately prior to the closing of the IPO on October 3, 2012.
As of December 31, 2011, the Company was authorized to issue 176,400,000 shares of convertible preferred stock with a par value of $0.001 per share. The Company had designated 48,079,860 shares as Series A Preferred Stock, 110,314,114 shares as Series B Preferred Stock, and 18,006,026 shares as Series C Preferred Stock.
Preferred Stock
Effective October 3, 2012, the Company is authorized to issue 20,000,000 shares of undesignated preferred stock with a par value of $0.001 per share. Each series of preferred stock will have such rights and preferences including dividend rights, dividend rate, conversion rights, voting rights, rights and terms of redemption (including sinking fund provisions), redemption price, and liquidation preferences as determined by the Board. As of December 31, 2012, there are no issued or outstanding shares of preferred stock.
Warrants
In connection with the issuance of promissory notes in July 2005, the Company granted warrants to purchase 61,507 shares of Series C Preferred Stock at an exercise price of $3.66 per share. The warrants were sold to the note holders at a purchase price of $0.10 per share. In 2011, 30,754 shares of Series C Preferred Stock were purchased upon exercise of these warrants. No warrants are exercisable or outstanding as of December 31, 2012 and 2011.
Also in connection with the notes, in May 2006, the Company granted warrants to purchase shares 8,185 of Series C Preferred Stock at an exercise price of $3.76 per share. In 2011, 4,094 shares of Series C Preferred Stock were purchased upon exercise of these warrants. No warrants are exercisable or outstanding as of December 31, 2012 and 2011.
NOTE 8. Employee Stock and Benefit Plans
Employee Stock Plans
2012 Equity Incentive Plan
The 2012 Equity Incentive Plan (the “2012 Plan”) was adopted and approved in September 2012 and became effective on September 26, 2012. Under the 2012 Plan, the Company is authorized to grant to eligible participants incentive stock options (“ISOs”), nonstatutory stock options (“NSOs”), stock appreciation rights (“SARs”), restricted stock awards (“RSAs”), restricted stock units (“RSUs”), performance units and performance shares equivalent to up to 3,050,000 shares of common stock. The number of shares of common stock available for issuance under the 2012 Plan includes an annual increase on January 1 of each year starting on January 1, 2014 by an amount equal to the least of 3,050,000 shares; 5% of the outstanding shares of stock as of the last day of our immediately preceding fiscal year; or an amount determined by the board of directors. Options may be granted with an exercise price that is at least equal to the fair market value of the Company’s stock at the date of grant and are exercisable when vested. Options granted generally vest over a period of up to four years, with a maximum term of ten years. ISOs may only be granted to employees and any subsidiary corporations’ employees. All other awards may be granted to employees, directors and consultants and our subsidiary corporations’ employees and consultants. Options, SARs, RSAs, RSUs, performance units and performance awards may be granted with vesting terms as determined by the board of directors and expire no more than ten years after the date of grant or earlier if employment or service is terminated. As of December 31, 2012, 2,902,125 shares were available for grant under the 2012 Plan.
-82-
Table of Contents
2000 Equity Incentive Plan
Under the 2000 Equity Incentive Plan (the “2000 Plan”), the Company was authorized to grant to eligible participants either ISOs or NSOs. The ISOs were granted at a price per share not less than the fair market value at the date of grant. The NSOs were granted at a price per share not less than 85% of the fair market value at the date of grant. Options granted generally vest over a period of up to four years, with a maximum term of ten years. The 2000 Plan was terminated in connection with the closing of the IPO, and accordingly, no shares are currently available for issuance under the 2000 Plan. The 2000 Plan continues to govern outstanding awards granted thereunder.
Options granted under the 2000 Plan were immediately exercisable, and unvested shares are subject to repurchase by the Company. Upon termination of employment of an option holder, the Company has the right to repurchase at the original purchase price any issued but unvested common shares. At December 31, 2012 and 2011, there were 47,220 and 76,437 shares, respectively, that were subject to the Company’s right to repurchase. Shares repurchased by the Company are added to the pool of options available for future grant. The Company repurchased 60,126, 1,000 and 136,876 unvested common shares in 2012, 2011 and 2010, respectively. The amounts paid for these shares purchased under an early exercise of stock options are not reported as a component of stockholders’ equity (deficit) until those shares vest. The amounts received in exchange for these shares totaled $0.3 million and $0.4 million as of December 31, 2012 and 2011, respectively, have been recorded as an accrued liability in the accompanying consolidated balance sheets and will be reclassified to common stock and additional paid-in capital as the shares vest.
Stock-based employee compensation is included in the consolidated statements of income as follows:
| Year Ended December 31, | ||||||||||||
| 2012 | 2011 | 2010 | ||||||||||
| (in thousands) | ||||||||||||
| Cost of revenues |
$ | 272 | $ | 139 | $ | 77 | ||||||
| Research and development |
649 | 458 | 346 | |||||||||
| Sales and marketing |
993 | 579 | 460 | |||||||||
| General and administrative |
1,008 | 811 | 869 | |||||||||
|
|
|
|
|
|
|
|||||||
| Total stock-based employee compensation |
$ | 2,922 | $ | 1,987 | $ | 1,752 | ||||||
|
|
|
|
|
|
|
|||||||
Compensation cost is recognized on a straight-line basis over the service period. Forfeitures are estimated at the time of grant and revised, if necessary, in subsequent periods if actual forfeitures differ from those estimates.
As of December 31, 2012, the Company had $5.8 million of total unrecognized employee compensation cost related to nonvested awards that it expects to recognize over a weighted-average period of 2 years.
The fair value of each option granted to employees is estimated on the date of grant using the Black-Scholes option-pricing model based on the following assumptions:
| Year Ended December 31, | ||||||
| 2012 | 2011 | 2010 | ||||
| Expected term (in years) |
5.3 to 6.1 | 5.6 | 5.5 | |||
| Volatility |
52% to 53% | 55% | 57% to 58% | |||
| Risk-free interest rate |
0.6% to 0.9% | 0.9% to 2.3% | 1.1% to 2.3% | |||
| Dividend yield |
— | — | — | |||
-83-
Table of Contents
The expected term of the options is based on evaluations of historical and expected future employee exercise behavior. The risk-free interest rate is based on the U.S. Treasury rates at the date of grant with maturity dates approximately equal to the expected term at the grant date. Volatility is based on historical volatility of several public entities that are similar to the Company, as the Company does not have sufficient historical transactions in its own shares on which to base expected volatility. The Company has not historically issued any dividends and does not expect to in the future.
The Company records compensation representing the fair value of stock options granted to non-employees. Stock-based non-employee compensation was $0.5 million, $0.1 million and $0.1 million for 2012, 2011 and 2010, respectively. Non-employee stock-based compensation is recognized over the vesting periods of the options. The value of options granted to non-employees is remeasured as they vest over a performance period.
A summary of the Company’s stock option activity is as follows:
| Outstanding Shares |
Weighted Average Exercise Price |
Weighted Average Remaining Contractual Life (Years) |
Aggregate Intrinsic Value (in thousands) |
|||||||||||||
| Balance as of December 31, 2009 |
5,212,984 | $ | 2.56 | 6.6 | $ | 6,486 | ||||||||||
| Granted |
1,357,702 | 4.10 | ||||||||||||||
| Exercised |
(317,802 | ) | 1.89 | |||||||||||||
| Canceled |
(652,009 | ) | 3.51 | |||||||||||||
|
|
|
|||||||||||||||
| Balance as of December 31, 2010 |
5,600,875 | 2.86 | 6.4 | 6,964 | ||||||||||||
| Granted |
1,816,850 | 5.06 | ||||||||||||||
| Exercised |
(432,687 | ) | 3.09 | |||||||||||||
| Canceled |
(672,997 | ) | 3.89 | |||||||||||||
|
|
|
|||||||||||||||
| Balance as of December 31, 2011 |
6,312,041 | 3.36 | 6.9 | 16,012 | ||||||||||||
| Granted |
1,478,781 | 8.94 | ||||||||||||||
| Exercised |
(724,316 | ) | 2.86 | |||||||||||||
| Canceled |
(552,998 | ) | 6.79 | |||||||||||||
|
|
|
|||||||||||||||
| Balance as of December 31, 2012 |
6,513,508 | 4.39 | 6.6 | 67,711 | ||||||||||||
|
|
|
|||||||||||||||
| Vested and expected to vest—December 31, 2012 |
6,150,545 | 4.16 | 6.5 | 65,333 | ||||||||||||
| Exercisable—December 31, 2012 |
6,366,588 | 4.18 | 6.6 | 66,184 | ||||||||||||
-84-
Table of Contents
The following table summarizes the outstanding and vested stock options at December 31, 2012:
| Outstanding | Vested | |||||||||||||||||||
| Exercise Price |
Number of Shares |
Weighted Average Exercise Price Per Share |
Weighted Average Remaining Contractual Life (Years) |
Number of Shares |
Weighted Average Exercise Price Per Share |
|||||||||||||||
| $0.10 – $1.50 |
490,401 | $ | 1.32 | 3.3 | 490,401 | $ | 1.32 | |||||||||||||
| $1.60 – $1.90 |
945,782 | 1.90 | 4.1 | 945,782 | 1.90 | |||||||||||||||
| $2.00 – $2.80 |
836,955 | 2.64 | 5.0 | 828,156 | 2.64 | |||||||||||||||
| $2.90 – $3.80 |
1,183,268 | 3.80 | 6.9 | 620,391 | 3.80 | |||||||||||||||
| $3.90 – $4.40 |
1,044,238 | 4.21 | 7.5 | 663,582 | 4.17 | |||||||||||||||
| $4.50 – $6.90 |
1,025,646 | 5.56 | 8.1 | 353,989 | 5.35 | |||||||||||||||
| $7.00 – $13.60 |
987,218 | 9.51 | 9.2 | 48,440 | 8.59 | |||||||||||||||
|
|
|
|
|
|||||||||||||||||
| 6,513,508 | 4.39 | 6.6 | 3,950,741 | 3.05 | ||||||||||||||||
|
|
|
|
|
|||||||||||||||||
The weighted-average grant date fair value of the Company’s stock options granted during 2012, 2011 and 2010 was $4.27, $2.56 and $2.14, respectively. The aggregate grant date fair value of the Company’s stock options granted during 2012, 2011 and 2010 was $6.3 million, $4.7 million and $2.9 million, respectively.
The intrinsic value of options exercised was $4.0 million, $0.8 million and $0.7 million during 2012, 2011 and 2010, respectively. Intrinsic value of an option is the difference between the fair value of the Company’s common stock at the time of exercise and the exercise price paid.
Restricted Stock
The terms and conditions of RSAs, including vesting criteria and timing are set by the board of directors. The cost of RSAs is determined using the fair value of the Company’s common stock on the date of the grant. Compensation cost is recognized on a straight-line basis over the requisite service period of each grant adjusted for estimated forfeitures. Recipients of RSAs generally have voting and dividend rights without regard to vesting. The Company has the right to repurchase shares that do not vest.
During 2012, the Company granted 1,000 shares of restricted stock, which vested immediately and had no further restrictions or service period, and resulted in compensation expense of $14,000.
401(k) Plan
The Company’s 401(k) Plan (the “401(k) Plan”) was established in 2000 to provide retirement and incidental benefits for its employees. As allowed under section 401(k) of the Internal Revenue Code, the 401(k) Plan provides tax-deferred salary deductions for eligible employees. Contributions to the 401(k) Plan are limited to a maximum amount as set periodically by the Internal Revenue Service. To date, the Company has not made any contributions to the 401(k) Plan.
-85-
Table of Contents
NOTE 9. Other Income (Expense), Net
Other income (expense), net consists of the following:
| Year Ended December 31, | ||||||||||||
| 2012 | 2011 | 2010 | ||||||||||
| (in thousands) | ||||||||||||
| Foreign exchange gains (losses) |
$ | (179 | ) | $ | (338 | ) | $ | (372 | ) | |||
| Amortization of premiums on short-term investments |
(7 | ) | — | — | ||||||||
| Other income (expense) |
(2 | ) | (8 | ) | (11 | ) | ||||||
|
|
|
|
|
|
|
|||||||
| Other income (expense), net |
$ | (188 | ) | $ | (346 | ) | $ | (383 | ) | |||
|
|
|
|
|
|
|
|||||||
NOTE 10. Income Taxes
The Company’s geographical breakdown of income (loss) before provision for (benefit from) income taxes is as follows:
| Year Ended December 31, | ||||||||||||
| 2012 | 2011 | 2010 | ||||||||||
| (in thousands) | ||||||||||||
| Domestic |
$ | 1,656 | $ | 1,593 | $ | (21 | ) | |||||
| Foreign |
982 | 777 | 664 | |||||||||
|
|
|
|
|
|
|
|||||||
| Income before provision for income taxes |
$ | 2,638 | $ | 2,370 | $ | 643 | ||||||
|
|
|
|
|
|
|
|||||||
The provision for (benefit from) income taxes consists of the following:
| Year Ended December 31, | ||||||||||||
| 2012 | 2011 | 2010 | ||||||||||
| (in thousands) | ||||||||||||
| Current |
||||||||||||
| Federal |
$ | (18 | ) | $ | 45 | $ | (39 | ) | ||||
| State |
202 | 112 | 37 | |||||||||
| Foreign |
147 | 259 | (202 | ) | ||||||||
|
|
|
|
|
|
|
|||||||
| Total current provision (benefit) |
331 | 416 | (204 | ) | ||||||||
|
|
|
|
|
|
|
|||||||
| Deferred |
||||||||||||
| Federal |
$ | 27 | $ | — | $ | — | ||||||
| State |
— | — | — | |||||||||
| Foreign |
— | — | — | |||||||||
|
|
|
|
|
|
|
|||||||
| Total deferred provision (benefit) |
27 | — | — | |||||||||
|
|
|
|
|
|
|
|||||||
| Total provision for (benefit from) income taxes |
$ | 358 | $ | 416 | $ | (204 | ) | |||||
|
|
|
|
|
|
|
|||||||
-86-
Table of Contents
The reconciliation of the statutory federal income tax rate of 34.0% to the Company’s effective tax rate is as follows:
| Year Ended December 31, | ||||||||||||
| 2012 | 2011 | 2010 | ||||||||||
| Federal statutory rate |
34.0 | % | 34.0 | % | 34.0 | % | ||||||
| State taxes |
5.4 | 3.5 | 3.9 | |||||||||
| Stock-based compensation |
22.4 | 19.4 | 81.3 | |||||||||
| Foreign source income |
(4.1 | ) | 1.4 | (50.8 | ) | |||||||
| Change in valuation allowance |
(46.9 | ) | (44.0 | ) | (102.3 | ) | ||||||
| Other |
2.8 | 3.3 | 2.2 | |||||||||
|
|
|
|
|
|
|
|||||||
| Provision for (benefit from) income taxes |
13.6 | % | 17.6 | % | (31.7 | )% | ||||||
|
|
|
|
|
|
|
|||||||
Deferred income taxes reflect the tax effects of temporary differences between the carrying amounts of assets and liabilities for financial reporting purposes and the amounts used for income tax purposes. The components of the Company’s deferred tax assets and liabilities are as follows:
| December 31, | ||||||||
| 2012 | 2011 | |||||||
| (in thousands) | ||||||||
| Deferred tax assets |
||||||||
| Net operating loss carryforwards |
$ | 19,658 | $ | 22,584 | ||||
| Research and development credit carryforwards |
4,055 | 3,744 | ||||||
| Accrued liabilities |
535 | 409 | ||||||
| Deferred revenues |
3,085 | 1,670 | ||||||
| Deferred rent |
153 | 112 | ||||||
| Intangible assets |
385 | 198 | ||||||
| Stock-based compensation |
843 | 506 | ||||||
| Foreign |
4 | 30 | ||||||
| Other |
403 | 463 | ||||||
|
|
|
|
|
|||||
| Gross deferred tax assets |
29,121 | 29,716 | ||||||
| Valuation allowance |
(26,257 | ) | (26,766 | ) | ||||
|
|
|
|
|
|||||
| Net deferred tax assets |
2,864 | 2,950 | ||||||
| Deferred tax liabilities |
||||||||
| Fixed assets |
(2,854 | ) | (2,884 | ) | ||||
| Intangible assets |
(27 | ) | — | |||||
|
|
|
|
|
|||||
| Total deferred tax liabilities |
(2,881 | ) | (2,884 | ) | ||||
|
|
|
|
|
|||||
| Net deferred tax assets (liabilities) |
$ | (17 | ) | $ | 66 | |||
|
|
|
|
|
|||||
-87-
Table of Contents
Current and non-current deferred tax assets and liabilities included in the consolidated balance sheets are recorded as follows:
| December 31, | ||||||||
| 2012 | 2011 | |||||||
| (in thousands) | ||||||||
| Current deferred tax assets |
$ | 106 | $ | 69 | ||||
| Current deferred tax liabilities |
— | — | ||||||
| Noncurrent deferred tax assets |
— | — | ||||||
| Noncurrent deferred tax liabilities |
(123 | ) | (3 | ) | ||||
|
|
|
|
|
|||||
| Net deferred tax assets |
$ | (17 | ) | $ | 66 | |||
|
|
|
|
|
|||||
Realization of deferred tax assets is dependent upon future earnings, if any, the timing and amount of which are uncertain. As of December 31, 2012, we have provided a valuation allowance for our deferred tax assets that we believe are not more likely than not realizable. The valuation allowance decreased by $0.5 million for 2012 and decreased by $0.8 million for 2011.
At December 31, 2012, the Company had federal and state net operating loss carryforwards of approximately $52.9 million and $29.5 million, respectively, available to reduce federal and state taxable income. The Company’s federal net operating losses expire in the years 2021 to 2031, and its state net operating losses expire from 2013 to 2030. Utilization of the Company’s net operating loss carryforwards may be subject to a substantial annual limitation due to the ownership change limitations provided by the Internal Revenue Code and similar state provisions. Such an annual limitation could result in the expiration of the net operating loss carryforwards before utilization. As of December 31, 2012, the Company had federal and state research and development credits of $3.1 million and $3.8 million, respectively. Federal research and development credits expire in the years 2022 to 2031. State research and development credits do not expire.
U.S. income taxes were not provided on undistributed earnings from investments in non-U.S. subsidiaries as the Company intends to continue to reinvest the earnings of these foreign subsidiaries indefinitely. The Company’s share of undistributed earnings of foreign subsidiaries that could be subject to additional U.S. income tax if remitted was approximately $8.2 million and $7.5 million as of December 31, 2012 and 2011, respectively. Determination of the amount of unrecognized deferred tax liability for temporary differences related to investments in these non-U.S. subsidiaries that are essentially permanent in duration is not practicable.
The evaluation of a tax position is a two-step process. The first step requires the Company to determine whether it is more likely than not that a tax position will be sustained upon examination based on the technical merits of the position. The second step requires the Company to recognize in the financial statement each tax position that meets the more likely than not criteria, measured at the amount of benefit that has a greater than fifty percent likelihood of being realized.
-88-
Table of Contents
A reconciliation of the Company’s unrecognized tax benefits is as follows:
| Year Ended December 31, | ||||||||||||
| 2012 | 2011 | 2010 | ||||||||||
| (in thousands) | ||||||||||||
| Unrecognized tax benefits beginning balance |
$ | 2,792 | $ | 2,648 | $ | 4,495 | ||||||
| Gross increase for tax positions of prior years |
— | 87 | 71 | |||||||||
| Gross decrease for tax positions of prior years |
(46 | ) | (120 | ) | (1,792 | ) | ||||||
| Gross increase for tax positions of current year |
140 | 242 | 276 | |||||||||
| Settlements |
(106 | ) | — | — | ||||||||
| Lapse of statute of limitations |
(133 | ) | (65 | ) | (402 | ) | ||||||
|
|
|
|
|
|
|
|||||||
| Total unrecognized tax benefits |
$ | 2,647 | $ | 2,792 | $ | 2,648 | ||||||
|
|
|
|
|
|
|
|||||||
The unrecognized tax benefits, if recognized and in absence of full valuation allowance, would impact the income tax provision by $1.0 million, $1.2 million and $0.5 million as of December 31, 2012, 2011 and 2010, respectively.
The Company has elected to include interest and penalties as a component of income tax expense. The amounts were not material for 2012, 2011 and 2010.
The Company files income tax returns in the United States, including various state jurisdictions. The Company’s subsidiaries file tax returns in various foreign jurisdictions. The tax years 2007 to 2012 remain open to examination by the major taxing jurisdictions in which the Company is subject to tax, with the exception of France which remains open to examination for the 2011 and 2012 tax years only. As of December 31, 2012, the Company was not under examination by the Internal Revenue Service or any state tax jurisdictions.
On January 2, 2013, the American Taxpayer Relief Act of 2012 (H.R. 8) was signed into law which retroactively extends the federal research and development credit from January 1, 2012 through December 31, 2013.
NOTE 11. Segment Information and Information about Geographic Area
The Company operates in one segment. The Company’s chief operating decision maker (“CODM”) is the Chairman, President and Chief Executive Officer, who makes operating decisions, assesses performance and allocates resources on a consolidated basis. All of the Company’s principal operations and decision-making functions are located in the United States. Revenues by geographic area, based on the location of the customer, are as follows:
| Year Ended December 31, | ||||||||||||
| 2012 | 2011 | 2010 | ||||||||||
| (in thousands) | ||||||||||||
| United States |
$ | 62,616 | $ | 51,044 | $ | 43,669 | ||||||
| Other |
28,804 | 25,168 | 21,763 | |||||||||
|
|
|
|
|
|
|
|||||||
| Total revenues |
$ | 91,420 | $ | 76,212 | $ | 65,432 | ||||||
|
|
|
|
|
|
|
|||||||
As of December 31, 2012 and 2011, property and equipment locations outside the United States were not material.
-89-
Table of Contents
NOTE 12. Net Income Per Share Attributable to Common Stockholders
The computations for basic and diluted net income per share attributable to common stockholders are as follows:
| Year Ended December 31, | ||||||||||||
| 2012 | 2011 | 2010 | ||||||||||
| (in thousands, except per share data) | ||||||||||||
| Numerator: |
||||||||||||
| Net income |
$ | 2,280 | $ | 1,954 | $ | 847 | ||||||
| Net income attributable to participating securities |
(1,204 | ) | (1,518 | ) | (668 | ) | ||||||
|
|
|
|
|
|
|
|||||||
| Net income attributable to common stockholders—basic |
1,076 | 436 | 179 | |||||||||
| Undistributed earnings reallocated to participating securities |
1,201 | 1,516 | 666 | |||||||||
|
|
|
|
|
|
|
|||||||
| Net income attributable to common stockholders—diluted |
$ | 2,277 | $ | 1,952 | $ | 845 | ||||||
|
|
|
|
|
|
|
|||||||
| Denominator: |
||||||||||||
| Weighted-average shares used in computing net income per share attributable to common stockholders—basic |
11,891 | 5,053 | 4,706 | |||||||||
| Effect of potentially dilutive securities: |
||||||||||||
| Convertible preferred stock |
13,270 | 17,590 | 17,562 | |||||||||
| Common stock options |
3,187 | 1,537 | 1,282 | |||||||||
| Warrants |
— | 2 | 4 | |||||||||
| Contingently issuable shares related to an acquisition |
4 | 12 | 8 | |||||||||
|
|
|
|
|
|
|
|||||||
| Weighted-average shares used in computing net income per share attributable to common stockholders—diluted |
28,352 | 24,194 | 23,562 | |||||||||
|
|
|
|
|
|
|
|||||||
| Net income per share attributable to common stockholders |
||||||||||||
| Basic |
$ | 0.09 | $ | 0.09 | $ | 0.04 | ||||||
|
|
|
|
|
|
|
|||||||
| Diluted |
$ | 0.08 | $ | 0.08 | $ | 0.04 | ||||||
|
|
|
|
|
|
|
|||||||
Potentially dilutive securities not included in the calculation of diluted net income per share because doing so would be antidilutive are as follows:
| Year Ended December 31, | ||||||||||||
| 2012 | 2011 | 2010 | ||||||||||
| (in thousands) | ||||||||||||
| Common stock options |
772 | 2,758 | 1,948 | |||||||||
-90-
Table of Contents
NOTE 13. Quarterly Financial Information (Unaudited)
The following table sets forth our unaudited consolidated statements of income data for each of the quarters in the two-year period ended December 31, 2012. The unaudited quarterly consolidated statements of income data set forth below have been prepared on the same basis as the audited consolidated financial statements included elsewhere in this Annual Report on Form 10-K and, in the opinion of management, reflect all necessary adjustments, which consist only of normal recurring adjustments, necessary for a fair presentation of such data. Our historical results are not necessarily indicative of the results for the full year or any other period. This data should be read together with our consolidated financial statements and the related notes included elsewhere in this Annual Report on Form 10-K.
| Three Months Ended | ||||||||||||||||||||||||||||||||
| Mar. 31, 2011 |
Jun. 30, 2011 |
Sep. 30, 2011 |
Dec. 31, 2011 |
Mar. 31, 2012 |
Jun. 30, 2012 |
Sep. 30, 2012 |
Dec. 31, 2012 |
|||||||||||||||||||||||||
| (unaudited) | ||||||||||||||||||||||||||||||||
| (in thousands, except per share data) | ||||||||||||||||||||||||||||||||
| Revenues |
$ | 17,690 | $ | 18,495 | $ | 19,375 | $ | 20,652 | $ | 21,191 | $ | 22,190 | $ | 23,382 | $ | 24,657 | ||||||||||||||||
| Cost of revenues |
2,873 | 3,026 | 3,225 | 4,123 | 4,160 | 4,629 | 4,634 | 4,981 | ||||||||||||||||||||||||
|
|
|
|
|
|
|
|
|
|
|
|
|
|
|
|
|
|||||||||||||||||
| Gross profit |
14,817 | 15,469 | 16,150 | 16,529 | 17,031 | 17,561 | 18,748 | 19,676 | ||||||||||||||||||||||||
| Operating expenses: |
||||||||||||||||||||||||||||||||
| Research and development |
4,764 | 4,994 | 4,922 | 4,953 | 5,101 | 5,148 | 5,076 | 4,870 | ||||||||||||||||||||||||
| Sales and marketing |
7,002 | 7,310 | 7,985 | 9,229 | 9,246 | 9,784 | 8,797 | 9,911 | ||||||||||||||||||||||||
| General and administrative |
2,214 | 2,047 | 2,249 | 2,390 | 2,814 | 2,843 | 3,154 | 3,268 | ||||||||||||||||||||||||
|
|
|
|
|
|
|
|
|
|
|
|
|
|
|
|
|
|||||||||||||||||
| Total operating expenses |
13,980 | 14,351 | 15,156 | 16,572 | 17,161 | 17,775 | 17,027 | 18,049 | ||||||||||||||||||||||||
|
|
|
|
|
|
|
|
|
|
|
|
|
|
|
|
|
|||||||||||||||||
| Income (loss) from operations |
837 | 1,118 | 994 | (43 | ) | (130 | ) | (214 | ) | 1,721 | 1,627 | |||||||||||||||||||||
| Other income (expense), net(1) |
337 | 71 | (461 | ) | (483 | ) | (77 | ) | (141 | ) | 23 | (171 | ) | |||||||||||||||||||
|
|
|
|
|
|
|
|
|
|
|
|
|
|
|
|
|
|||||||||||||||||
| Income (loss) before provision for (benefit from) income taxes |
1,174 | 1,189 | 533 | (526 | ) | (207 | ) | (355 | ) | 1,744 | 1,456 | |||||||||||||||||||||
| Provision for (benefit from) income taxes(2) |
128 | 82 | 81 | 125 | 78 | (78 | ) | 77 | 281 | |||||||||||||||||||||||
|
|
|
|
|
|
|
|
|
|
|
|
|
|
|
|
|
|||||||||||||||||
| Net income (loss) |
$ | 1,046 | $ | 1,107 | $ | 452 | $ | (651 | ) | $ | (285 | ) | $ | (277 | ) | $ | 1,667 | $ | 1,175 | |||||||||||||
|
|
|
|
|
|
|
|
|
|
|
|
|
|
|
|
|
|||||||||||||||||
| Net income (loss) attributable to common stockholders |
$ | 227 | $ | 244 | $ | 102 | $ | (651 | ) | $ | (285 | ) | $ | (277 | ) | $ | 415 | $ | 1,159 | |||||||||||||
|
|
|
|
|
|
|
|
|
|
|
|
|
|
|
|
|
|||||||||||||||||
| Net income (loss) per share attributable to common stockholders: |
||||||||||||||||||||||||||||||||
| Basic |
$ | 0.05 | $ | 0.05 | $ | 0.02 | $ | (0.13 | ) | $ | (0.05 | ) | $ | (0.05 | ) | $ | 0.07 | $ | 0.04 | |||||||||||||
|
|
|
|
|
|
|
|
|
|
|
|
|
|
|
|
|
|||||||||||||||||
| Diluted |
$ | 0.04 | $ | 0.05 | $ | 0.02 | $ | (0.13 | ) | $ | (0.05 | ) | $ | (0.05 | ) | $ | 0.06 | $ | 0.03 | |||||||||||||
|
|
|
|
|
|
|
|
|
|
|
|
|
|
|
|
|
|||||||||||||||||
| (1) | Includes significant foreign currency exchange losses in the three months ended September 30, 2011 and December 31, 2011. |
| (2) | Includes a benefit from income taxes in the three months ended June 30, 2012 primarily resulting from reductions in the liability for uncertain tax positions due to the lapse of the statute of limitations or closure of tax years due to a completed audit of our French subsidiary. |
-91-
Table of Contents
| Item 9. | Changes In and Disagreements with Accountants on Accounting and Financial Disclosure |
None.
| Item 9A. | Controls and Procedures |
Evaluation of Disclosure Controls and Procedures
Our management, with the participation of our Chief Executive Officer and our Chief Financial Officer, evaluated the effectiveness of our disclosure controls and procedures as of December 31, 2012. The term “disclosure controls and procedures,” as defined in Rules 13a-15(e) and 15d-15(e) under the Exchange Act, means controls and other procedures of a company that are designed to ensure that information required to be disclosed by a company in the reports that it files or submits under the Exchange Act is recorded, processed, summarized and reported, within the time periods specified in the Securities and Exchange Commission’s rules and forms. Disclosure controls and procedures include, without limitation, controls and procedures designed to ensure that information required to be disclosed by a company in the reports that it files or submits under the Exchange Act is accumulated and communicated to the company’s management, including its principal executive and principal financial officers, as appropriate to allow timely decisions regarding required disclosure. Management recognizes that any controls and procedures, no matter how well designed and operated, can provide only reasonable assurance of achieving their objectives and management necessarily applies its judgment in evaluating the cost-benefit relationship of possible controls and procedures. Based on the evaluation of our disclosure controls and procedures as of December 31, 2012, our Chief Executive Officer and Chief Financial Officer concluded that, as of such date, our disclosure controls and procedures were effective at the reasonable assurance level.
Internal Control over Financial Reporting
This Annual Report on Form 10-K does not include a report of management’s assessment regarding internal control over financial reporting or an attestation report of our independent registered public accounting firm due to a transition period established by rules of the SEC for newly public companies. As of December 31, 2013, Section 404 of the Sarbanes-Oxley Act will require our management to provide a report on the effectiveness of our internal control over financial reporting. Our independent registered public accounting firm will not be required to formally attest to the effectiveness of our internal control over financial reporting until the later of Annual Report on Form 10-K for the year ending December 31, 2013 or the first annual report required to be filed with the SEC following the date we are no longer an “emerging growth company” as defined in the JOBS Act. We are in the process of performing the system and process documentation, evaluation and testing required for management to make this assessment and for its independent auditors to provide its attestation report. We have not completed this process or its assessment, and this process will require significant amounts of management time and resources. In the course of evaluation and testing, management may identify deficiencies that will need to be addressed and remediated.
Changes in Internal Control over Financial Reporting
There was no change in our internal control over financial reporting identified in connection with the evaluation required by Rule 13a-15(d) and 15d-15(d) of the Exchange Act that occurred during the fourth quarter ended December 31, 2012 that has materially affected, or is reasonably likely to materially affect, our internal control over financial reporting.
| Item 9B. | Other Information |
None.
-92-
Table of Contents
| Item 10. | Directors, Executive Officers and Corporate Governance |
Executive Officers and Directors
Except as set forth below, the information required by this item is incorporated by reference to our Proxy Statement for our 2013 Annual Meeting of Stockholders to be filed with the SEC within 120 days after the end of the fiscal year ended December 31, 2012.
Codes of Business Conduct and Ethics
Our board of directors has adopted a code of business conduct and ethics that applies to all of our employees, officers and directors, including our Chief Executive Officer, Chief Financial Officer and other executive and senior financial officers. The code of business conduct and ethics is available on our website. We expect that, to the extent required by law, any amendments to the code, or any waivers of its requirements, will be disclosed on our website. We intend to disclose any waiver to the provisions of the code of business conduct and ethics that applies specifically to directors or executive officers by filing such information on a Current Report on Form 8-K with the SEC, to the extent such filing is required by the NASDAQ Stock Market’s listing requirements; otherwise, we will disclose such waiver by posting such information on our website.
| Item 11. | Executive Compensation |
The information required by this item is incorporated by reference to our Proxy Statement for our 2013 Annual Meeting of Stockholders to be filed with the SEC within 120 days after the end of the fiscal year ended December 31, 2012.
| Item 12. | Security Ownership of Certain Beneficial Owners and Management and Related Stockholder Matters |
Security Ownership of Certain Beneficial Owners and Management
The information required by this item with respect to Item 403 of Regulation S-K regarding security ownership of certain beneficial owners and management is incorporated by reference to our Proxy Statement for our 2013 Annual Meeting of Stockholders to be filed with the SEC within 120 days after the end of the fiscal year ended December 31, 2012. For the information required by this item with respect to Item 201(d) of Regulation S-K regarding securities authorized for issuance under equity compensation plans, see “Item 5: Market for Registrant’s Common Equity, Related Stockholder Matters and Issuer Purchases of Equity Securities—Securities Authorized for Issuance under Equity Compensation Plans.”
| Item 13. | Certain Relationships and Related Transactions, and Director Independence |
The information required by this item is incorporated by reference to our Proxy Statement for our 2013 Annual Meeting of Stockholders to be filed with the SEC within 120 days after the end of the fiscal year ended December 31, 2012.
| Item 14. | Principal Accounting Fees and Services |
The information required by this item is incorporated by reference to our Proxy Statement for our 2013 Annual Meeting of Stockholders to be filed with the SEC within 120 days after the end of the fiscal year ended December 31, 2012.
-93-
Table of Contents
| Item 15. | Exhibits and Financial Statement Schedules |
(a)(1) Financial Statements – The financial statements filed as part of this Annual Report on Form 10-K are listed on the Index to Consolidated Financial Statements in Item 8.
(a)(2) Financial Statement Schedules
SCHEDULE II
SUPPLEMENTARY CONSOLIDATED FINANCIAL STATEMENT SCHEDULE
VALUATION AND QUALIFYING ACCOUNTS
(in thousands)
| Additions | ||||||||||||||||
| Balance at Beginning of Year |
Charged to Costs and Expenses |
Deductions and Other (1) |
Balance at End of Year |
|||||||||||||
| Allowance for Doubtful Accounts |
||||||||||||||||
| Year ended December 31, 2012 |
$ | 230 | $ | 218 | $ | (117 | ) | $ | 331 | |||||||
| Year ended December 31, 2011 |
$ | 138 | $ | 193 | $ | (101 | ) | $ | 230 | |||||||
| Year ended December 31, 2010 |
$ | 138 | $ | 117 | $ | (117 | ) | $ | 138 | |||||||
| (1) | Primarily represents write-offs of uncollectible accounts, net of recoveries. |
All other schedules have been omitted because they are not required, not applicable, or the required information is otherwise included.
| (b) | Exhibits |
The exhibits listed on the Exhibit Index (following the Signatures section of this report) are included, or incorporated by reference, in this Annual Report on Form 10-K.
-94-
Table of Contents
Pursuant to the requirements of Section 13 or 15(d) of the Securities Exchange Act of 1934, the registrant has duly caused this Annual Report on Form 10-K to be signed on its behalf by the undersigned, thereunto duly authorized, in the City of Redwood City, State of California on March 5, 2013.
| QUALYS, INC. | ||
| By: | /s/ PHILIPPE F. COURTOT | |
| Name: Philippe F. Courtot | ||
| Title: Chairman, President and Chief Executive Officer | ||
| (Principal Executive Officer) | ||
Pursuant to the requirements of the Securities Exchange Act of 1934, this report has been signed below by the following persons on behalf of the Registrant and in the capacities indicated:
| Signature |
Title |
Date | ||
| /s/ PHILIPPE F. COURTOT Philippe F. Courtot |
Chairman, President and Chief Executive Officer (Principal Executive Officer) | March 5, 2013 | ||
| /s/ DONALD C. McCAULEY Donald C. McCauley |
Chief Financial Officer (Principal Financial and Accounting Officer) |
March 5, 2013 | ||
| /s/ SANDRA E. BERGERON Sandra E. Bergeron |
Director | March 5, 2013 | ||
| /s/ DONALD R. DIXON Donald R. Dixon |
Director | March 5, 2013 | ||
| /s/ JEFFREY P. HANK Jeffrey P. Hank |
Director | March 5, 2013 | ||
| /s/ GENERAL PETER PACE General Peter Pace |
Director | March 5, 2013 | ||
| /s/ YVES B. SISTERON Yves B. Sisteron |
Director | March 5, 2013 | ||
| /s/ HOWARD A. SCHMIDT Howard A. Schmidt |
Director | March 5, 2013 | ||
-95-
Table of Contents
| Incorporated by Reference
|
||||||||||||
| Exhibit |
Description |
Filed |
Form |
File No. |
Exhibit No. | Filing Date | ||||||
| 3.1 |
Amended and Restated Certificate of Incorporation of Qualys, Inc. | S-1/A | 333-182027 | 3.3 | September 12, 2012 | |||||||
| 3.2 |
Amended and Restated Bylaws of Qualys, Inc. | S-1/A | 333-182027 | 3.5 | September 12, 2012 | |||||||
| 4.1 |
Form of common stock certificate. | S-1/A | 333-182027 | 4.1 | September 12, 2012 | |||||||
| 4.2 |
Amended and Restated Investor Rights Agreement, by and among Qualys, Inc. and the investors party thereto, dated July 12, 2005. | S-1 | 333-182027 | 4.2 | June 8, 2012 | |||||||
| 10.1* |
2000 Equity Incentive Plan, as amended, and the form of stock option agreement thereunder. | S-1 | 333-182027 | 10.1 | June 8, 2012 | |||||||
| 10.2* |
2012 Equity Incentive Plan and forms of agreements thereunder. | S-1/A | 333-182027 | 10.2 | September 12, 2012 | |||||||
| 10.3* |
Offer Letter, between Qualys, Inc. and Philippe F. Courtot, dated December 7, 2000. | S-1 | 333-182027 | 10.3 | June 8, 2012 | |||||||
| 10.4* |
Offer Letter, between Qualys, Inc. and Amer S. Deeba, dated September 4, 2001. | S-1 | 333-182027 | 10.4 | June 8, 2012 | |||||||
| 10.5* |
Offer Letter, between Qualys, Inc. and Sumedh S. Thakar, dated January 20, 2003. | S-1 | 333-182027 | 10.5 | June 8, 2012 | |||||||
| 10.6* |
Offer Letter, between Qualys, Inc. and Donald C. McCauley, dated February 7, 2006, as amended. | S-1 | 333-182027 | 10.6 | June 8, 2012 | |||||||
| 10.7* |
Offer Letter, between Qualys, Inc. and John N. Wilson, dated August 20, 2010. | S-1 | 333-182027 | 10.7 | June 8, 2012 | |||||||
| 10.8* |
Offer Letter, between Qualys, Inc. and Peter Albert, dated April 14, 2011. | S-1 | 333-182027 | 10.8 | June 8, 2012 | |||||||
| 10.9* |
Offer Letter, between Qualys, Inc. and Bruce K. Posey, dated May 8, 2012. | S-1 | 333-182027 | 10.9 | June 8, 2012 | |||||||
-96-
Table of Contents
| Incorporated by Reference
|
||||||||||||
| Exhibit |
Description |
Filed |
Form |
File No. |
Exhibit No. | Filing Date | ||||||
| 10.10* |
Form of director and executive officer indemnification agreement. | S-1/A | 333-182027 | 10.10 | August 10, 2012 | |||||||
| 10.11 |
Lease Agreement, between Qualys, Inc. and Westport Office Park, LLC, dated July 11, 2006, as amended August 10, 2007, May 20, 2010 and December 5, 2011. | S-1 | 333-182027 | 10.11 | June 8, 2012 | |||||||
| 10.12* |
2011 Corporate Bonus Plan. | S-1 | 333-182027 | 10.12 | June 8, 2012 | |||||||
| 10.13* |
2012 Corporate Bonus Plan. | S-1 | 333-182027 | 10.13 | June 8, 2012 | |||||||
| 10.14 |
Master Services Agreement, between Qualys, Inc. and Savvis Communications Corporation, dated June 22, 2010. | S-1/A | 333-182027 | 10.14 | September 12, 2012 | |||||||
| 10.15† |
Master Agreement, between Qualys, Inc. and Interoute Communications Limited, dated March 31, 2008. | S-1/A | 333-182027 | 10.15 | September 12, 2012 | |||||||
| 10.16† |
Manufacturing Services Agreement, between Qualys, Inc. and Synnex Corporation, dated March 1, 2011. | S-1/A | 333-182027 | 10.16 | September 12, 2012 | |||||||
| 21.1 |
List of subsidiaries of Qualys, Inc. | 10-K | 001-35662 | 21.1 | March 5, 2013 | |||||||
| 23.1 |
Consent of Grant Thornton LLP, independent registered public accounting firm. | X | ||||||||||
| 31.1 |
Certification of Chief Executive Officer pursuant to Rule 13a-14(a) or Rule 15d-14(a) of the Securities Exchange Act of 1934, as adopted pursuant to Section 302 of The Sarbanes-Oxley Act of 2002. | X | ||||||||||
| 31.2 |
Certification of Chief Financial Officer pursuant to Rule 13a-14(a) or Rule 15d-14(a) of the Securities Exchange Act of 1934, as adopted pursuant to Section 302 of The Sarbanes-Oxley Act of 2002. | X | ||||||||||
-97-
Table of Contents
| Incorporated by Reference
|
||||||||||||
| Exhibit |
Description |
Filed |
Form |
File No. |
Exhibit No. | Filing Date | ||||||
| 32.1 |
Certification of Chief Executive Officer pursuant to Rule 13a014(b) or Rule 15d-14(b) of the Securities Exchange Act of 1934 and 18 U.S.C. Section 1350 as adopted pursuant to Section 906 of The Sarbanes-Oxley Act of 2002. | X | ||||||||||
| 32.2 |
Certification of Chief Financial Officer pursuant to Rule 13a014(b) or Rule 15d-14(b) of the Securities Exchange Act of 1934 and 18 U.S.C. Section 1350 as adopted pursuant to Section 906 of The Sarbanes-Oxley Act of 2002. | X | ||||||||||
| 101 INS^^ | XBRL Instance Document. | 10-K | 001-35662 | 101 INS | March 5, 2013 | |||||||
| 101 SCH^^ | XBRL Taxonomy Extension Schema Document. | 10-K | 001-35662 | 101 SCH | March 5, 2013 | |||||||
| 101 CAL^^ | XBRL Taxonomy Extension Calculation Linkbase Document. | 10-K | 001-35662 | 101 CAL | March 5, 2013 | |||||||
| 101 DEF^^ | XBRL Taxonomy Extension Definition Linkbase Document. | 10-K | 001-35662 | 101 DEF | March 5, 2013 | |||||||
| 101 LAB^^ | XBRL Taxonomy Extension Labels Linkbase Document. | 10-K | 001-35662 | 101 LAB | March 5, 2013 | |||||||
| 101 PRE^^ | XBRL Taxonomy Extension Presentation Linkbase Document. | 10-K | 001-35662 | 101 PRE | March 5, 2013 | |||||||
| * Indicates a management contract or compensatory plan or arrangement. | ||||||||||||
| † Portions of this exhibit have been omitted due to a determination by the Securities and Exchange Commission that these portions should be granted confidential treatment. | ||||||||||||
| ^^ Pursuant to Rule 406T of Regulation S-T, the Interactive Data Files on Exhibit 101 hereto are deemed not “filed” for purposes of Sections 11 or 12 of the Securities Act, are deemed not filed for purposes of Section 18 of the Exchange Act, and otherwise are not subject to liability under those Sections. | ||||||||||||
-98-