Attached files
| file | filename |
|---|---|
| 8-K - FORM 8-K - Endurance International Group Holdings, Inc. | d638783d8k.htm |
 Credit Suisse
Tech Conference December 4, 2013
Exhibit 99.1 |
 endurance.com
/
FORWARD LOOKING STATEMENTS AND OTHER IMPORTANT CAUTIONS
2
Statements in this presentation which are not statements of historical fact, including but
not limited to statements concerning our financial guidance for fiscal year 2013 and
our long term annual growth rate expectations, are “forward-looking statements” (as
defined in the U.S. Private Securities Litigation Reform Act of 1995). These
forward-looking statements are based on our current expectations and beliefs, as
well as a number of assumptions concerning future events. These statements are subject to risks,
uncertainties, assumptions and other important factors set forth in the our SEC filings,
many of which are outside our control, that could cause actual results to differ
materially from the results discussed in the forward-looking statements. Some of the key factors
that could cause actual results to differ from our expectations include: the rate of growth
of the SMB market for our solutions; our inability to maintain a high level of
subscriber satisfaction; our inability to continue to add new subscribers and increase sales to our
existing subscribers; system or Internet failures; our dependence on establishing and
maintaining strong brands; our inability to maintain or improve our competitive
position or market share; the loss of strategic relationships or alliances with third parties; our
inability to integrate recent or potential future acquisitions; the business risks of
international operations; the loss or unavailability of any of our co-located
data centers; our recognition of revenue for subscription-based services over the term of the applicable
subscriber agreement; the occurrence of security or privacy breaches; and adverse
consequences of our substantial level of indebtedness. You are
cautioned to not place undue reliance on such forward-looking statements because actual results may vary materially from
those expressed or implied. All forward-looking statements are based on information
available to us on this date and we assume no obligation to, and expressly disclaim
any obligation to, update or revise any forward-looking statements, whether as a result of new
information, future events or otherwise. This
presentation includes data based on our internal estimates. While we believe that our internal estimates are reasonable, no
independent source has verified such estimates.
The information on, or that can be accessed through, any of our websites is not deemed to be
incorporated in this presentation or to be part of this presentation. |
 endurance.com
/
AGENDA
3
•
Introduction to Endurance
•
Third Quarter Results
•
Supplemental Information
Hari Ravichandran
Founder, CEO
Tiv Ellawala
CFO |
 INTRODUCTION
TO ENDURANCE 4 |
 endurance.com
/
WE ARE A TECHNOLOGY PLATFORM
THAT TRANSFORMS THE WAY
SMBs DO BUSINESS
5 |
 endurance.com
/
6
WHAT WE DO
Cloud
Enablement
Platform
•
Domains
•
Email
•
Site Builders
•
Shared Hosting
•
Security
•
Site Backup
•
Mobile
•
AdWords
•
SEM / SEO Services
•
Social Media
•
BI and Analytics
•
Virtualized / Managed
Hosting
•
Email Marketing
•
Productivity Solutions
•
eCommerce
•
Professional Services |
 endurance.com
/
7
HOW WE DO IT
•
400,000 online referral
partners
•
Success-based marketing
•
Better conversion
•
Customer
segmentation
•
Better adoption rates
•
Better customer education
•
Most current products
•
Higher priced products |
 endurance.com
/
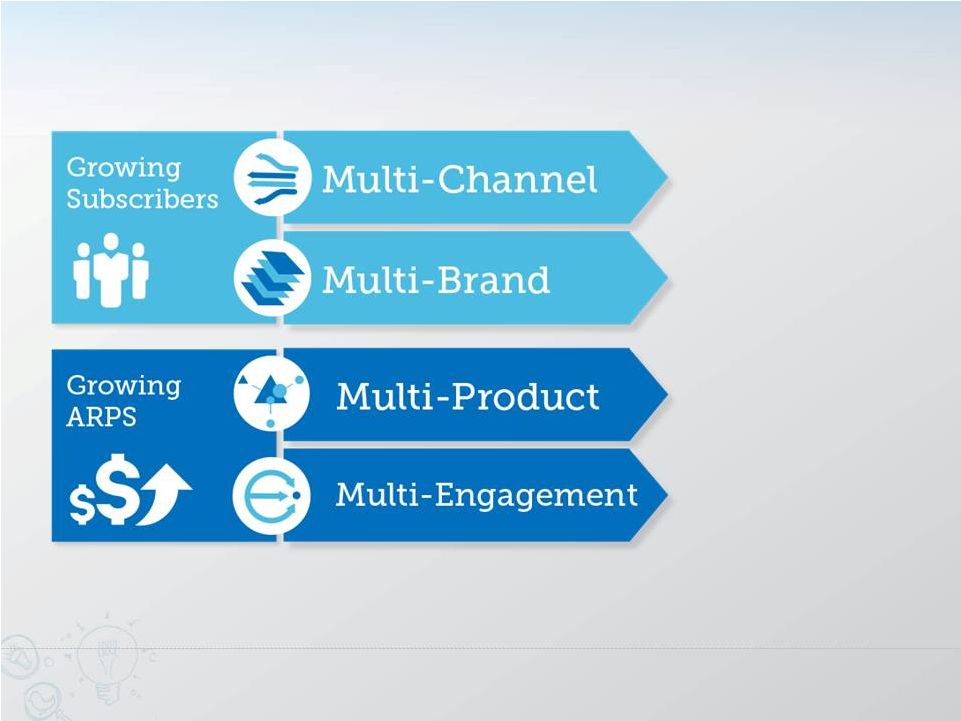
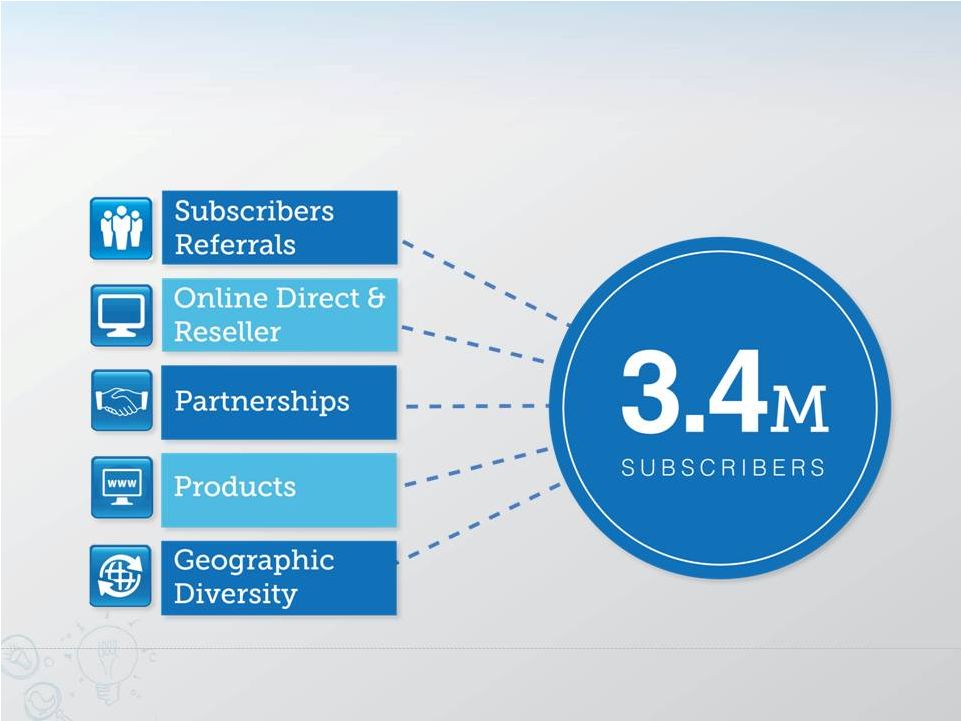
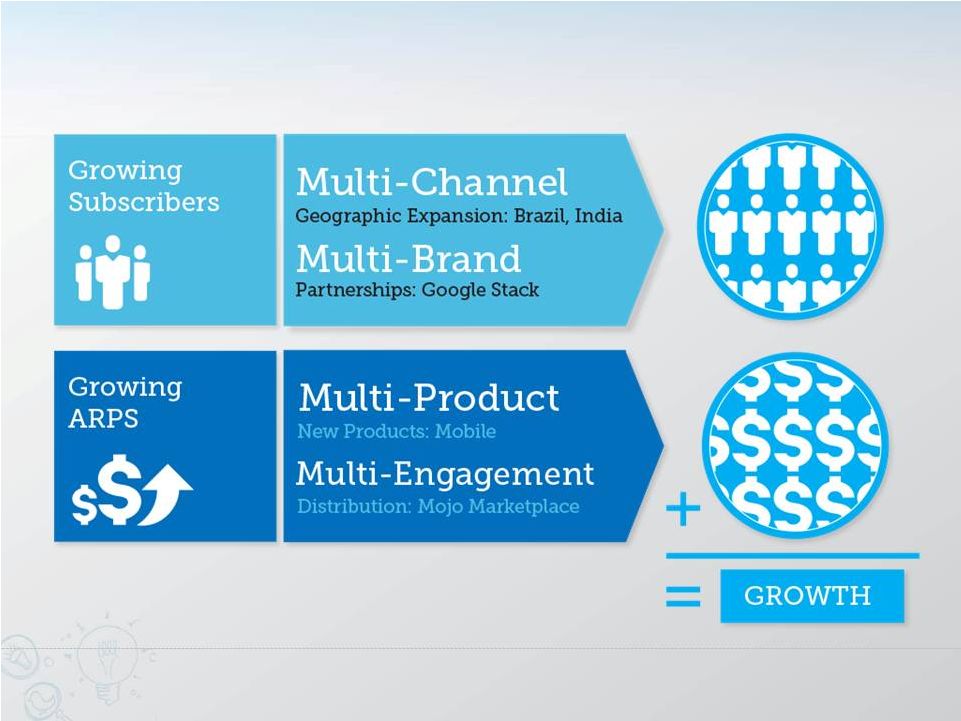
GROWING SUBSCRIBERS
MULTI-CHANNEL
8 |
 endurance.com
/
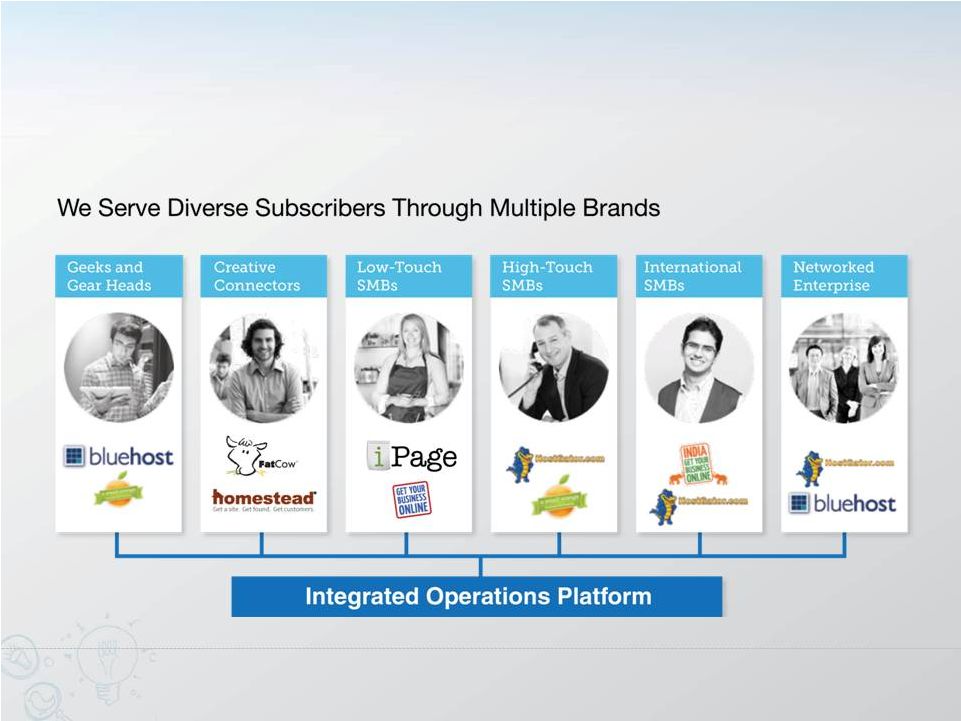
GROWING SUBSCRIBERS
MULTI-BRAND
9 |
 endurance.com
/
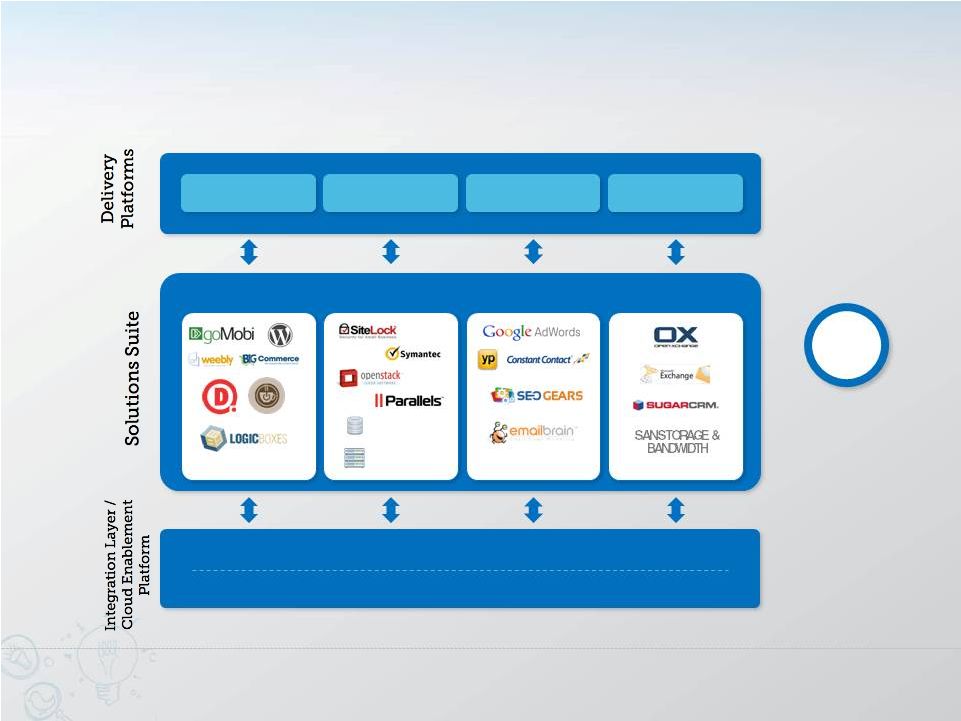
GROWING ARPS
MULTI-PRODUCT
Our proposed acquisition of Directi is targeted to close during the fourth quarter of
2013. 10
Brand Sites
Control Panel
Sales Floor
Marketplace
Catalog
Provisioning
Billing
Support
Storage
Network
Compute
Data
MySQL Databases
Site Backup & Restore
90%
90% of revenues from
Endurance owned
products
Web Presence
Compute & Security
Marketing
Productivity |
 endurance.com
/
GROWING ARPS
MULTI-ENGAGEMENT
11
Engaging Subscribers At The Right Time
Life Stage
Event
Triggered
Event
With the Right Messages
Listen
Teach
Sell
In the Right Channel & Touchpoint
Website
Email
Advisor
Social
Mojo
Mobile
Observe their behavior
across touchpoints
Engage them where
they are most active
Promote only where
they are responsive
In the Right Way |
 endurance.com
/
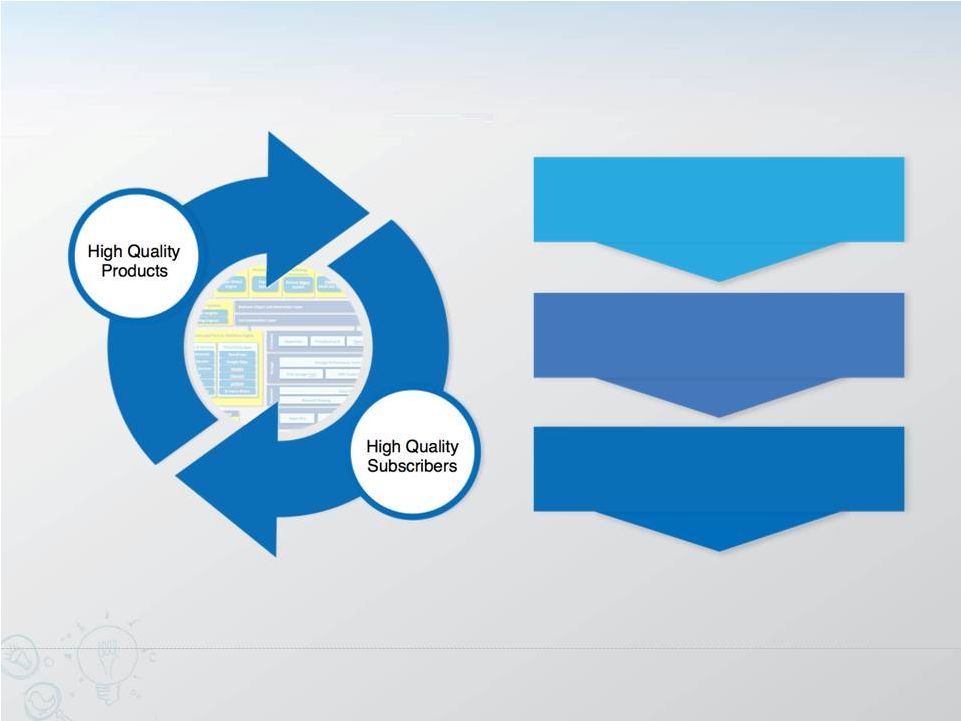
THE ENDURANCE DIFFERENCE
12
SUPERIOR PERFORMANCE
attracts
who demand
Best in class
Cloud Enablement Technology Platform
High quality
Subscribers
who
view web presence as mission critical
High quality
Products
that
drive revenue growth
When combined, these advantages
yield SUPERIOR PERFORMANCE
Cloud
Enablement
Technology
Platform |
 endurance.com
/
13
OPPORTUNITIES FOR GROWTH |
 THIRD QUARTER
RESULTS 14 |
 endurance.com
/
Q3 BUSINESS HIGHLIGHTS
15
Closed Refinancing
Exceeded Revenue, Adjusted EBITDA & UFCF Estimates
Increased Total Subscribers on Platform
9 months ended September 30, Revenue of $384M, Adjusted EBITDA
of $161M and Unlevered Free Cash Flow (UFCF) of $129M
Increased total subscribers on platform to over 3.440M
Grew ARPS while maintaining favorable MRR churn rate
Significant and increasing cash flow generation
Strong cash flow conversion |
 endurance.com
/
Q3 OPERATING METRICS
Subscriber data is pro-forma for acquisitions and represents organic growth in
subscribers. 16
Total Subscribers (‘000s)
MRR Retention Rate
ARPS ($)
12.95
13.14
2%
9%
Added 70,000 organic subscribers in Q3
10%
CAGR
2,857
2,972
3,059
3,114
3,223
3,315
3,370
3,440
Q4 2011
Q1 2012
Q2 2012
Q3 2012
Q4 2012
Q1 2013
Q2 2013
Q3 2013
10.51
11.48
Q3 2012 PF
Q3 2013
Without 2012 acquisitions
2012 acquisitions
99%
99%
Q3 2012 PF
Q3 2013 |
 endurance.com
/
Q3 KEY FINANCIAL METRICS
17
GAAP Revenue ($M)
UFCF ($M)
Adj. Revenue ($M)
Adj. EBITDA ($M)
59%
12%
36%
48%
15%
120.2
134.2
83.4
132.9
Q3 2012
Q3 2013
67.3
77.4
Q3 2012 PF
Q3 2013
Without 2012 acquisitions
2012 acquisitions
37.1
50.3
Q3 2012
Q3 2013
29.2
43.1
Q3 2012
Q3 2013 |
 endurance.com
/
REST OF YEAR GUIDANCE
18
Q4 2013
~$525M
~$204M
FY 2013
~$33M
~$162M
~$43M
~$134M
Long Term Annual
Growth
Mid-teens
High-teens
High-teens
Adjusted Revenue
Adjusted EBITDA
Unlevered FCF
Figures above are estimates based on our expectations as of the date of this
presentation. |
 endurance.com
/
endurance.com
/
SUPPLEMENTAL INFORMATION
19 |
 endurance.com
/
SUMMARY BALANCE SHEET
*Does not give pro forma effect to IPO and loan refinance.
20
($M)
December 31,
2012
September
30, 2013*
Unaudited
Cash & Cash Equivalents
23.2
33.4
Restricted Cash
0.9
1.2
Other Current Assets
44.0
54.0
Current Assets
68.1
88.6
Property
&
Equipment
–
Net
34.6
46.6
Goodwill
&
Other
Intangible
Assets
–
Net
1,417.4
1,346.8
Other Assets
18.0
37.2
Total Assets
1,538.1
1,519.2
($M)
December
31, 2012
September 30,
2013*
Unaudited
Accounts Payable & Accrued Expenses
39.3
43.5
Deferred Revenue
187.4
233.3
Other Liabilities
34.0
35.4
Revolver
15.0
-
Term Debt
1,115.0
1,198.8
Deferred Consideration
77.4
28.7
Total Liabilities
1,468.0
1,539.7
Shareholder’s Equity
70.2
-20.5
Total Liabilities & Shareholder’s Equity
1,538.1
1,519.2 |
 endurance.com
/
NON –
GAAP RECONCILIATION
STATEMENT
21
Three months
ended 9/30
Nine months
ended 9/30
2012
2013
2012
2013
Revenue
$83
$133
$175
$384
Purchase accounting
24
1
$57
7
Pre-acquisition revenue from acquired properties
13
0
116
1
Adjusted revenue
$120
$134
$349
$391
Total subscribers
3,114
3,440
3,114
3,440
ARPS
$12.95
$13.14
$12.84
$13.02
Adjusted revenue attributable to 2012 acquisitions
53
57
156
166
Adjusted revenue excluding revenue attributable to 2012 acquisitions
$67
$77
$193
$225
Total subscribers excluding subscribers attributable to 2012 acquisitions
2,151
2,247
2,151
2,247
ARPS excluding 2012 acquisitions
$10.51
$11.48
$10.22
$11.12
Net loss
$(28)
$(27)
$(67)
$(92)
Stock-based compensation
0
0
1
1
Amortization of long-lived assets related to acquisitions
26
26
57
79
Amortization of deferred financing costs
2
0
4
0
Changes in deferred revenue (inclusive of impact of purchase accounting)
26
11
94
44
Transaction expenses
8
2
10
6
Integration and restructuring expenses
0
9
0
40
Severance
0
0
0
0
Legal and professional expenses
0
1
0
5
Tax-affected impact of adjustments
(24)
(1)
(64)
(5)
Adjusted net income
$11
$21
$36
$79
Depreciation
2
5
4
13
Current and deferred tax benefit
8
2
27
3
17
22
34
66
Adjusted EBITDA
$37
$50
$101
$161
Change in operating assets and liabilities, net of acquisitions
(2)
0
(14)
(7)
Capital expenditures
(5)
(7)
(12)
(25)
Unlevered free cash flow
$29
$43
$74
$129
Interest expense, net (net of impact of amortization of deferred financing costs) |
 endurance.com
/
NON-GAAP FINANCIAL MEASURES
Adjusted net income, adjusted EBITDA, unlevered free cash flow, adjusted revenue and average
revenue per subscriber are non-GAAP financial measures and should not be
considered as alternatives to net income, revenue or any other measure of financial performance calculated and
presented in accordance with GAAP. We believe these non-GAAP financial measures are
helpful to investors because we believe they reflect the operating performance of our
business and help management and investors gauge our ability to generate cash flow, excluding some recurring and
non-recurring expenses that are included in the most directly comparable measures
calculated and presented in accordance with GAAP. Adjusted Net Income -
Adjusted net income is a non-GAAP financial measure that we calculate as net income
(loss) plus changes in deferred revenue inclusive of purchase accounting adjustments
related to acquisitions, amortization, stock-based compensation expense, severance,
expenses related to restructurings or integration of acquisitions, any dividend-related
payments accounted for as compensation expense, costs associated with litigation
matters and preparation for the initial public offering and the estimated tax effects of the foregoing adjustments. Due to our
history of acquisitions and financings, we have incurred accounting charges and expenses
that obscure the operating performance of our business. We believe that adjusting for
these items and the use of adjusted net income is useful to investors in evaluating the performance of our company.
Adjusted EBITDA -
Adjusted EBITDA is a non-GAAP financial measure that we calculate as adjusted net
income plus interest expense, depreciation, amortization and change in deferred
taxes. We manage our business based on the cash collected from our subscribers and the cash required to
acquire and service those subscribers. We believe highlighting cash collected and cash spent
in a given period is valuable insight for an investor to gauge the overall health of
our business. Under GAAP, although subscription fees are paid in advance, we recognize the associated revenue over
the subscription term, which does not fully reflect short-term trends in our operating
results. Unlevered
Free
Cash
Flow
-
Unlevered
free
cash
flow,
or
UFCF,
is
a
non-GAAP
financial
measure
that
we
calculate
as
adjusted
EBITDA
plus
changes
in
operating
assets
and
liabilities
(other
than
deferred
revenue)
net
of
acquisitions
less
capital
expenditures.
We
believe
the
most
useful
indicator of our operating performance is the cash generating potential of our company prior
to the impact of our capital structure and prior to any accounting charges related to
our acquisitions. We have substantial indebtedness primarily as a result of the December 2011 acquisition of a
controlling interest in our company by investment funds and entities affiliated with Warburg
Pincus and Goldman Sachs and a substantial dividend payment in November 2012. We also
believe that because our business has meaningful data center and related infrastructure requirements, the
level of capital expenditures required to run our business are an important factor for
investors. We believe UFCF is a useful measure that captures the effects of these
issues. 22 |
 endurance.com
/
NON-GAAP FINANCIAL MEASURES
(CONT.) Adjusted Revenue -
Adjusted revenue is a non-GAAP financial measure that we calculate as GAAP revenue
adjusted to exclude the impact of any fair value adjustments to deferred revenue
resulting from acquisitions and to include the revenue generated from subscribers we added through
business acquisitions as if those acquired subscribers had been our subscribers since the
beginning of the period presented. We believe that excluding fair value adjustments
to deferred revenue is useful to investors because it shows our revenue prior to purchase accounting charges
related to our acquisitions, and that including revenue from acquired subscribers in this
manner provides a helpful comparison of the revenues generated from our subscribers
from period to period. Average
Revenue
Per
Subscriber
-
Average
revenue
per
subscriber,
or
ARPS,
is
a
non-GAAP
financial
measure
that
we
calculate
as
the
amount
of
adjusted revenue we recognize from subscribers in a period divided by the average of the
number of total subscribers at the beginning of the period and
at
the
end
of
the
period.
We
believe
ARPS
is
an
indicator
of
our
ability
to
optimize
our
product
and
service
mix
and
pricing,
and
to
sell
products
and services to new and existing subscribers.
Our non-GAAP financial measures may not provide information that is directly comparable
to that provided by other companies in our industry, as other companies in our
industry may calculate non-GAAP financial results differently. In addition, there are limitations in using non-GAAP financial
measures because they are not prepared in accordance with GAAP, may be different from
non-GAAP financial measures used by other companies and exclude expenses that may
have a material impact on our reported financial results. Further, interest expense, which is excluded from some of
our non-GAAP measures, has and will continue to be for the foreseeable future a
significant recurring expense in our business. The presentation of non-GAAP
financial information is not meant to be considered in isolation or as a substitute for the directly comparable financial measures prepared
in accordance with GAAP. We urge you to review the reconciliations of our non-GAAP
financial measures to the comparable GAAP financial measures
included
with
this
presentation,
and
not
to
rely
on
any
single
financial
mseasure
to
evaluate
our
business.
23 |