Attached files
| file | filename |
|---|---|
| 8-K - 8-K - CF Industries Holdings, Inc. | a13-25620_18k.htm |
Exhibit 99.1
|
|
CF Industries Holdings, Inc. Citigroup 6th Annual Basic Materials Symposium December 4, 2013 |
|
|
All statements in this communication, other than those relating to historical facts, are “forward-looking statements.” These forward-looking statements are not guarantees of future performance and are subject to a number of assumptions, risks and uncertainties, many of which are beyond our control, which could cause actual results to differ materially from such statements. These statements include, but are not limited to, statements about the benefits, expected timing of closing and other aspects of the proposed transactions with Mosaic; statements about future strategic plans; and statements about future financial and operating results. Important factors that could cause actual results to differ materially from our expectations include, among others: risks and uncertainties arising from the possibility that the proposed transactions with Mosaic may be delayed or may not occur, including delays arising from any ability to obtain governmental approvals of the transactions; the risk that other conditions to the closing of the proposed transactions with Mosaic may not be satisfied; difficulties with realization of the benefits of the proposed transactions with Mosaic; the risk that disruptions from the proposed transactions with Mosaic will harm relationships with customers, employees and suppliers; the volatility of natural gas prices in North America; the cyclical nature of our business and the agricultural sector; the global commodity nature of our fertilizer products, the impact of global supply and demand on our selling prices, and the intense global competition from other fertilizer producers; conditions in the U.S. agricultural industry; reliance on third party providers of transportation services and equipment; risks associated with cyber security; weather conditions; our ability to complete our recently announced production capacity expansion projects on schedule as planned and on budget or at all; risks associated with other expansions of our business, including unanticipated adverse consequences and the significant resources that could be required; potential liabilities and expenditures related to environmental and health and safety laws and regulations; our potential inability to obtain or maintain required permits and governmental approvals or to meet financial assurance requirements from governmental authorities; future regulatory restrictions and requirements related to greenhouse gas emissions; the seasonality of the fertilizer business; the impact of changing market conditions on our forward sales programs; risks involving derivatives and the effectiveness of our risk measurement and hedging activities; the significant risks and hazards involved in producing and handling our products against which we may not be fully insured; our reliance on a limited number of key facilities; risks associated with joint ventures; acts of terrorism and regulations to combat terrorism; difficulties in securing the supply and delivery of raw materials, increases in their costs or delays or interruptions in their delivery; risks associated with international operations; losses on our investments in securities; deterioration of global market and economic conditions; our ability to manage our indebtedness; and loss of key members of management and professional staff. More detailed information about factors that may affect our performance may be found in our filings with the Securities and Exchange Commission, including our most recent periodic reports filed on Form 10-K and Form 10-Q, which are available in the Investor Relations section of the CF Industries Web site. Forward-looking statements are given only as of the date of this release and we disclaim any obligation to update or revise the forward-looking statements, whether as a result of new information, future events or otherwise, except as required by law. ***** This presentation includes certain non-GAAP financial measures as defined by SEC rules. As required by Regulation G, we have provided a reconciliation of those measures to the most directly comparable GAAP measures, which is available in the Appendix. 2 Forward-Looking Statements |
|
|
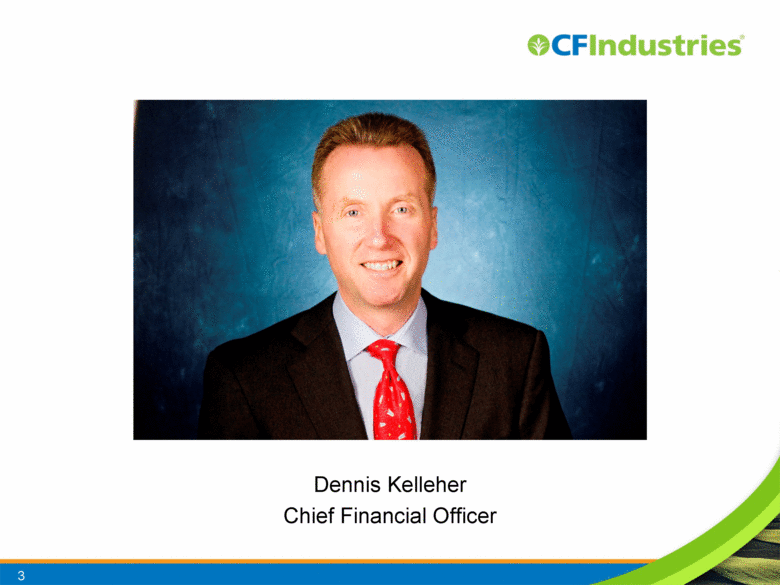
3 Dennis Kelleher Chief Financial Officer |
|
|
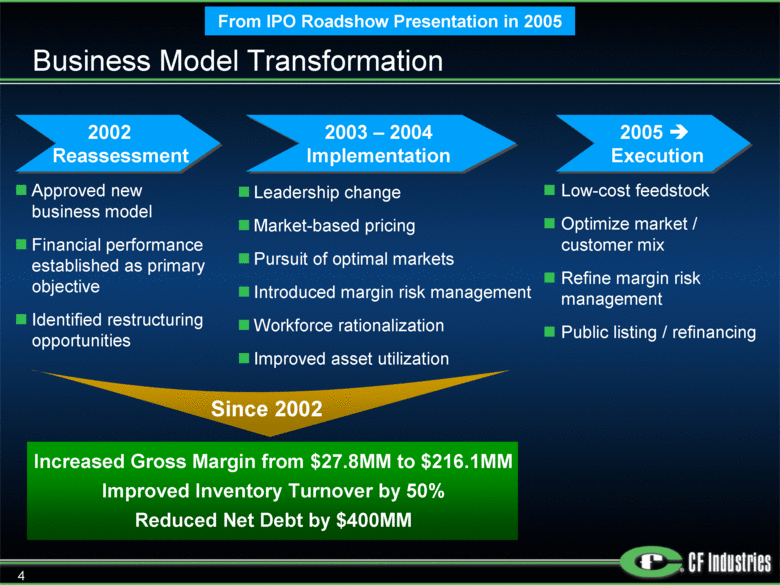
Business Model Transformation 2002 Reassessment 2005 Execution 2003 – 2004 Implementation Approved new business model Financial performance established as primary objective Identified restructuring opportunities Low-cost feedstock Optimize market / customer mix Refine margin risk management Public listing / refinancing Leadership change Market-based pricing Pursuit of optimal markets Introduced margin risk management Workforce rationalization Improved asset utilization Since 2002 Increased Gross Margin from $27.8MM to $216.1MM Improved Inventory Turnover by 50% Reduced Net Debt by $400MM From IPO Roadshow Presentation in 2005 4 |
|
|
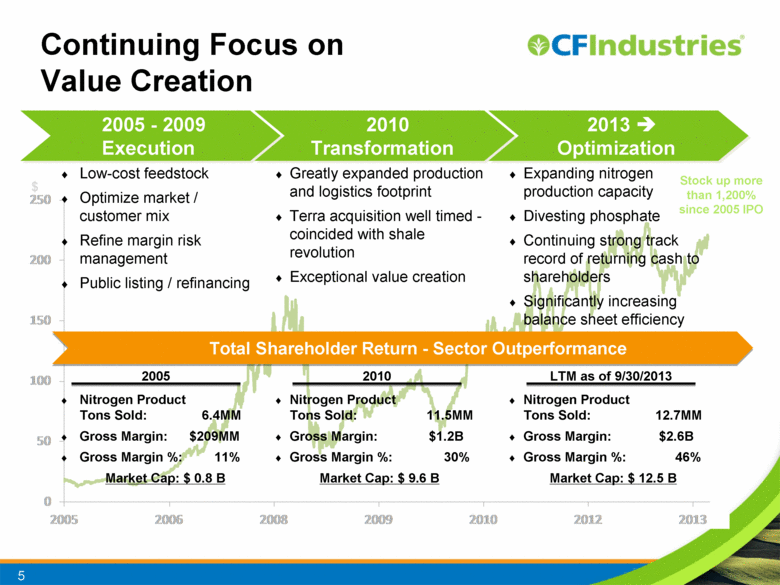
$ Stock up more than 1,200% since 2005 IPO Continuing Focus on Value Creation 5 2005 - 2009 Execution 2010 Transformation 2013 Optimization Low-cost feedstock Optimize market / customer mix Refine margin risk management Public listing / refinancing Greatly expanded production and logistics footprint Terra acquisition well timed - coincided with shale revolution Exceptional value creation Expanding nitrogen production capacity Divesting phosphate Continuing strong track record of returning cash to shareholders Significantly increasing balance sheet efficiency Nitrogen Product Tons Sold: 12.7MM Gross Margin: $2.6B Gross Margin %: 46% Market Cap: $ 12.5 B Nitrogen Product Tons Sold: 11.5MM Gross Margin: $1.2B Gross Margin %: 30% Market Cap: $ 9.6 B Nitrogen Product Tons Sold: 6.4MM Gross Margin: $209MM Gross Margin %: 11% Market Cap: $ 0.8 B Total Shareholder Return - Sector Outperformance 2005 2010 LTM as of 9/30/2013 0 50 100 150 200 250 2005 2006 2008 2009 2010 2012 2013 |
|
|
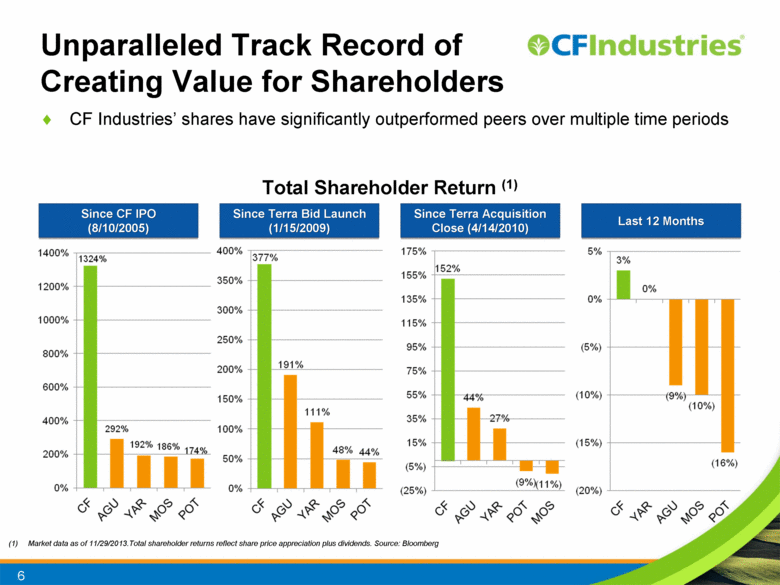
Unparalleled Track Record of Creating Value for Shareholders CF Industries’ shares have significantly outperformed peers over multiple time periods 6 Market data as of 11/29/2013.Total shareholder returns reflect share price appreciation plus dividends. Source: Bloomberg Since Terra Bid Launch (1/15/2009) Last 12 Months Total Shareholder Return (1) Since CF IPO (8/10/2005) Since Terra Acquisition Close (4/14/2010) |
|
|
Disciplined Capital Deployment Track Record 7 Organic Investment: $1.5B (3) Maintenance Capex Capacity Expansions – projects approved in 2012 and underway will lead to total nitrogen volume increase of ~40% since 2011 Last 3 Years Cumulative Operating Cash Flow : $6.4B (1) External Investment: $0.9B Acquired remaining 34% stake in Medicine Hat CF has returned close to half of its cash flow to stockholders while increasing nitrogen volume and significantly improving its credit ratings Return to Shareholders: $3.0B $290 million dividends since 2010 (2) $2.8B share repurchases since 2011 (2) $1.7B remaining on 2012 authorization (2) Recognized for effectiveness of share repurchase program (5) Total operating cash flow from 10/1/2010 to 9/30/2013 As of 12/2/2013 Total capital expenditures from 10/1/2010 to 9/30/2013 Other includes net debt repayment, distributions to non-controlling interest and other uses of cash “Adding Value or Destroying Value?” Credit Suisse, 6/18/2012 Other (4) Retired Terra acquisition term loan in 2011 Upgraded several notches to current investment grade ratings |
|
|
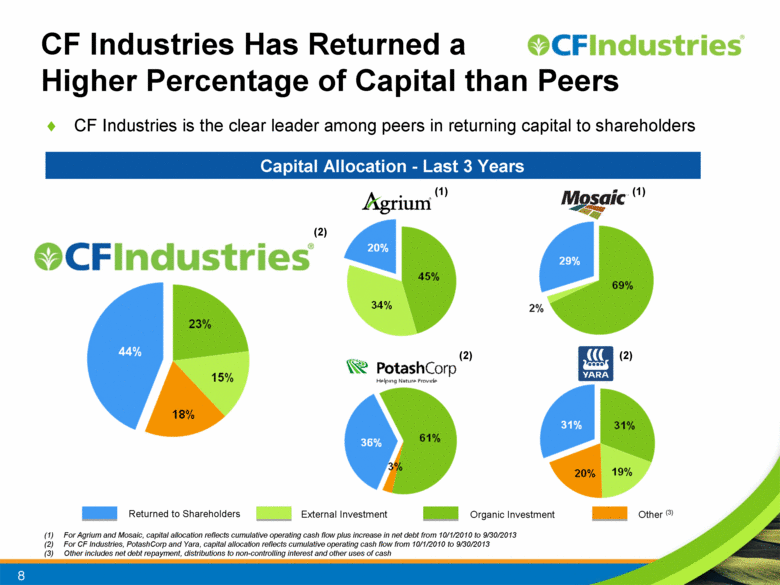
CF Industries is the clear leader among peers in returning capital to shareholders CF Industries Has Returned a Higher Percentage of Capital than Peers 8 Capital Allocation - Last 3 Years Organic Investment External Investment Other (3) Returned to Shareholders For Agrium and Mosaic, capital allocation reflects cumulative operating cash flow plus increase in net debt from 10/1/2010 to 9/30/2013 For CF Industries, PotashCorp and Yara, capital allocation reflects cumulative operating cash flow from 10/1/2010 to 9/30/2013 Other includes net debt repayment, distributions to non-controlling interest and other uses of cash (1) (1) (2) (2) (2) |
|
|
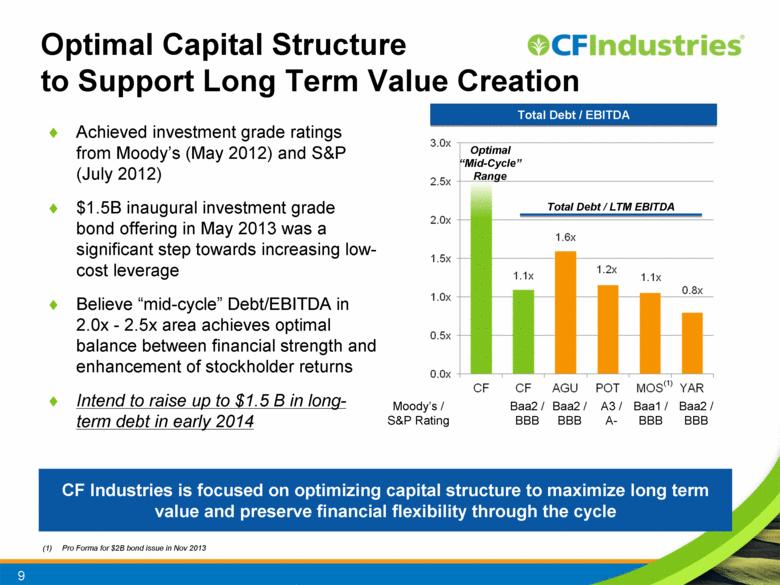
Optimal Capital Structure to Support Long Term Value Creation Achieved investment grade ratings from Moody’s (May 2012) and S&P (July 2012) $1.5B inaugural investment grade bond offering in May 2013 was a significant step towards increasing low-cost leverage Believe “mid-cycle” Debt/EBITDA in 2.0x - 2.5x area achieves optimal balance between financial strength and enhancement of stockholder returns Intend to raise up to $1.5 B in long-term debt in early 2014 9 CF Industries is focused on optimizing capital structure to maximize long term value and preserve financial flexibility through the cycle Optimal “Mid-Cycle” Range Baa2 / BBB Baa2 / BBB A3 / A- Baa1 / BBB Baa2 / BBB Moody’s / S&P Rating (1) Pro Forma for $2B bond issue in Nov 2013 Total Debt / LTM EBITDA Total Debt / EBITDA |
|
|
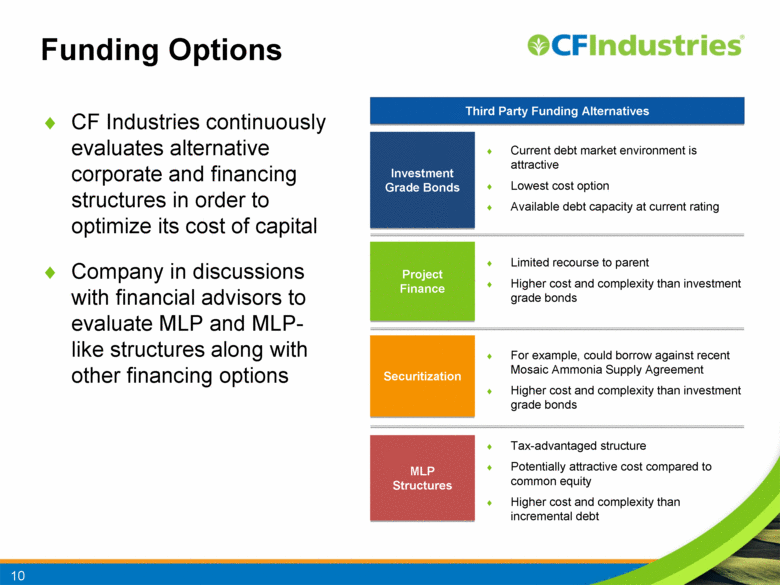
Funding Options CF Industries continuously evaluates alternative corporate and financing structures in order to optimize its cost of capital Company in discussions with financial advisors to evaluate MLP and MLP-like structures along with other financing options 10 Third Party Funding Alternatives Current debt market environment is attractive Lowest cost option Available debt capacity at current rating Investment Grade Bonds Project Finance Securitization Limited recourse to parent Higher cost and complexity than investment grade bonds For example, could borrow against recent Mosaic Ammonia Supply Agreement Higher cost and complexity than investment grade bonds MLP Structures Tax-advantaged structure Potentially attractive cost compared to common equity Higher cost and complexity than incremental debt |
|
|
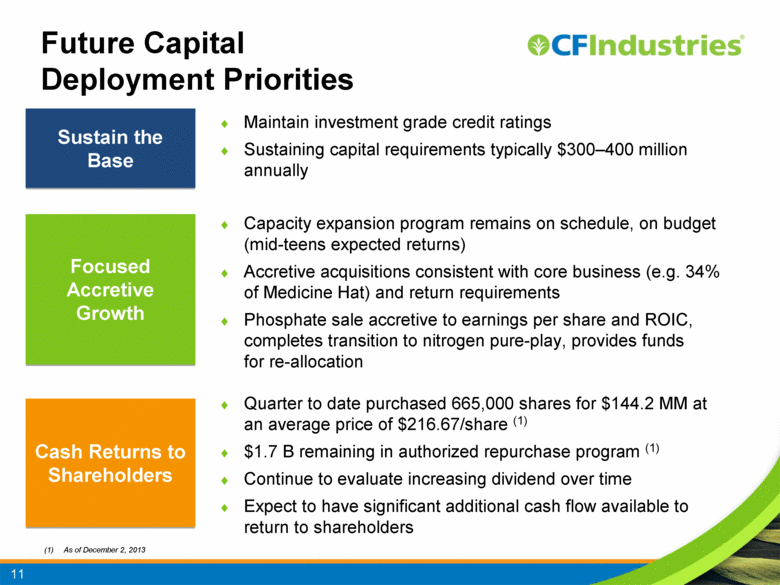
Future Capital Deployment Priorities Maintain investment grade credit ratings Sustaining capital requirements typically $300–400 million annually 11 Capacity expansion program remains on schedule, on budget (mid-teens expected returns) Accretive acquisitions consistent with core business (e.g. 34% of Medicine Hat) and return requirements Phosphate sale accretive to earnings per share and ROIC, completes transition to nitrogen pure-play, provides funds for re-allocation Quarter to date purchased 665,000 shares for $144.2 MM at an average price of $216.67/share (1) $1.7 B remaining in authorized repurchase program (1) Continue to evaluate increasing dividend over time Expect to have significant additional cash flow available to return to shareholders Sustain the Base Focused Accretive Growth Cash Returns to Shareholders As of December 2, 2013 |
|
|
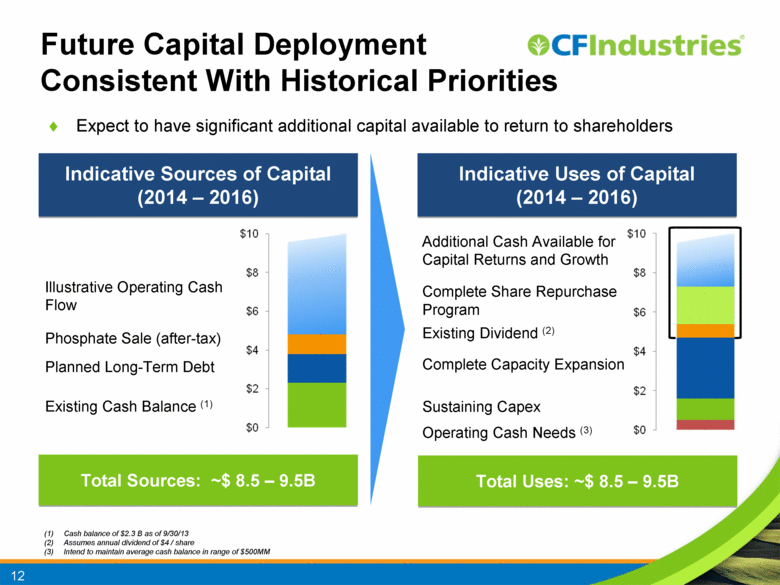
Future Capital Deployment Consistent With Historical Priorities 12 Indicative Sources of Capital (2014 – 2016) Indicative Uses of Capital (2014 – 2016) Total Sources: ~$ 8.5 – 9.5B Cash balance of $2.3 B as of 9/30/13 Assumes annual dividend of $4 / share Intend to maintain average cash balance in range of $500MM Expect to have significant additional capital available to return to shareholders Total Uses: ~$ 8.5 – 9.5B Illustrative Operating Cash Flow Phosphate Sale (after-tax) Planned Long-Term Debt Existing Cash Balance (1) Additional Cash Available for Capital Returns and Growth Complete Share Repurchase Program Existing Dividend (2) Complete Capacity Expansion Sustaining Capex Operating Cash Needs (3) |
|
|
Critical Factors Supporting Decision to Invest in New Nitrogen Capacity Strong and growing nitrogen demand Reliable source of low-cost natural gas feedstock Lowest delivered cost, broadest reach Early mover advantage Outstanding capabilities in project management, technology, and sales and marketing Low-cost debt financing Consistent base-level demand from Mosaic ammonia agreement decreases risk and increases confidence in project returns 13 |
|
|
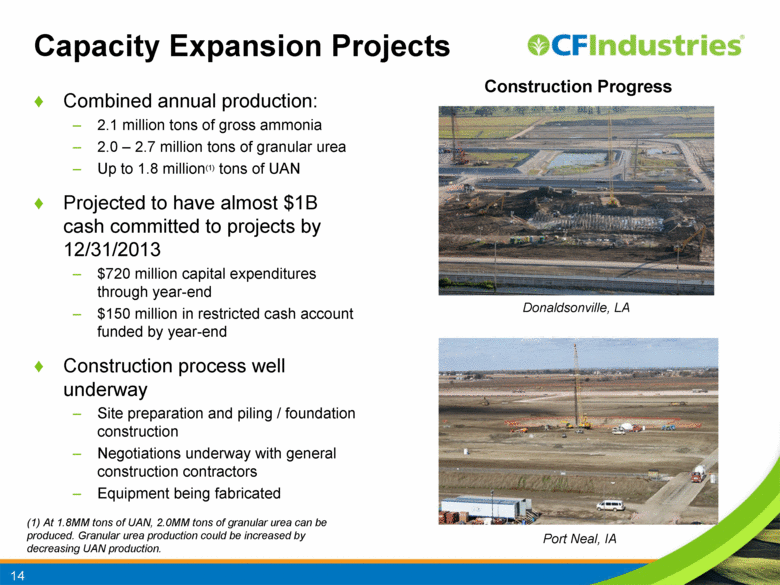
Capacity Expansion Projects Combined annual production: 2.1 million tons of gross ammonia 2.0 – 2.7 million tons of granular urea Up to 1.8 million(1) tons of UAN Projected to have almost $1B cash committed to projects by 12/31/2013 $720 million capital expenditures through year-end $150 million in restricted cash account funded by year-end Construction process well underway Site preparation and piling / foundation construction Negotiations underway with general construction contractors Equipment being fabricated 14 Construction Progress (1) At 1.8MM tons of UAN, 2.0MM tons of granular urea can be produced. Granular urea production could be increased by decreasing UAN production. Donaldsonville, LA Port Neal, IA |
|
|
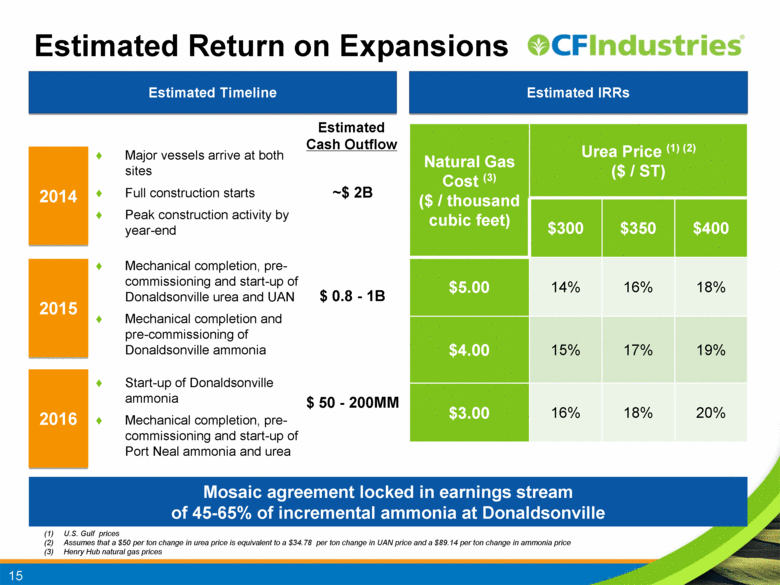
Estimated Return on Expansions Natural Gas Cost (3) ($ / thousand cubic feet) Urea Price (1) (2) ($ / ST) $300 $350 $400 $5.00 14% 16% 18% $4.00 15% 17% 19% $3.00 16% 18% 20% 15 Estimated IRRs Estimated Timeline 2014 2015 2016 Estimated Cash Outflow ~$ 2B $ 0.8 - 1B $ 50 - 200MM Major vessels arrive at both sites Full construction starts Peak construction activity by year-end Mechanical completion, pre-commissioning and start-up of Donaldsonville urea and UAN Mechanical completion and pre-commissioning of Donaldsonville ammonia Start-up of Donaldsonville ammonia Mechanical completion, pre-commissioning and start-up of Port Neal ammonia and urea Mosaic agreement locked in earnings stream of 45-65% of incremental ammonia at Donaldsonville U.S. Gulf prices Assumes that a $50 per ton change in urea price is equivalent to a $34.78 per ton change in UAN price and a $89.14 per ton change in ammonia price Henry Hub natural gas prices |
|
|
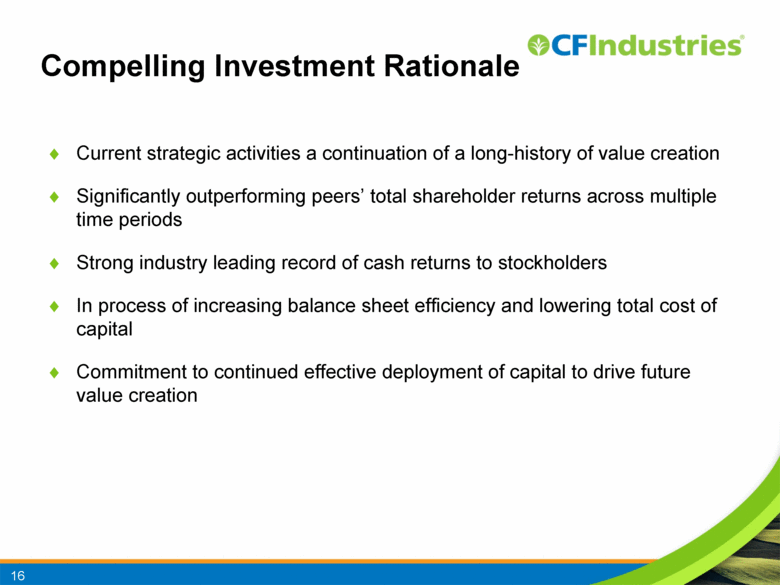
Compelling Investment Rationale Current strategic activities a continuation of a long-history of value creation Significantly outperforming peers’ total shareholder returns across multiple time periods Strong industry leading record of cash returns to stockholders In process of increasing balance sheet efficiency and lowering total cost of capital Commitment to continued effective deployment of capital to drive future value creation 16 |
|
|
[LOGO] |
|
|
Reconciliation of non-GAAP Measures – CF Industries 18 We have presented EBITDA, EBITDA as a % of sales, Enterprise Value to EBITDA, total debt to EBITDA, Dividends & Share Repurchases as a % of EBITDA and Dividends & Share Repurchases as a % of Equity Market Value because management uses these measures to track the company’s performance in comparison to its peers and believes that these are frequently used by securities analysts, investors and other interested parties in the evaluation of companies in our industry. Notes: EBITDA is defined as net earnings attributable to common stockholders plus interest expense (income)-net, income taxes, and depreciation, depletion and amortization. Other adjustments include the elimination of loan fee amortization that is included in both interest and amortization, and the portion of depreciation that is included in non-controlling interest. Share price as of the end of the applicable period. Enterprise value to EBITDA is defined as enterprise value divided by EBITDA. Enterprise value is defined as equity market value as of the period ending date plus debt minus cash. Equity market value is defined as shares outstanding multiplied by share price. Dividends & Share Repurchases as a percent of EBITDA is defined as average dividends paid and share repurchases for the specified time period divided by average EBITDA for the specified period. Dividends & Share Repurchases as a percent of Equity Market Value defined as average dividends paid plus share repurchases for the specified time period divided by the daily average equity market value for the specified time period. 12 Mnths 12 Mnths 12 Mnths 3 Year 9 Mnths 9 Mnths LTM Ending Ending Ending Avg as of Ending Ending Ending In millions, except percentages and share price 12/31/10 12/31/11 12/31/12 12/31/12 9/30/12 9/30/13 9/30/13 EBITDA Calculation Net Earnings Attributable to Common Stockholders 349 1,539 1,849 1,378 1,139 1,610 Interest Expense (net) 220 146 131 103 108 136 Income Taxes 277 932 964 722 499 741 Depreciation, depletion and amortization 395 416 420 319 314 415 Less: other adjustments (114) (47) (43) (37) (18) (25) EBITDA (1) 1,127 2,986 3,321 2,478 2,485 2,042 2,877 Sales 3,965 6,098 6,104 4,623 4,148 5,630 EBITDA as a % of Sales 28% 49% 54% 54% 49% 51% Enterprise Value Calculation Shares Outstanding 65.4 63.0 57.3 Share Price (2) 144.98 203.16 210.83 Equity Market Value 9,482 12,799 12,081 Debt 1,618 1,605 3,098 Cash (1,207) (2,275) (2,286) Enterprise Value 9,893 12,129 12,893 Enterprise Value / EBITDA (3) 3.3x 3.7x 4.5x Total Debt / EBITDA Debt 1,959 1,618 1,605 3,098 Total Debt / EBITDA 1.7x 0.5x 0.5x 1.1x Dividends & Share Repurchases as % of EBITDA Dividends 46 69 103 73 77 72 98 Share Repurchases - 1,000 500 500 500 1112 1,112 Dividends & Share Repurchases as % of EBITDA (4) 23% 42% Dividends + Share Repurchases of % of Equity Market Value Daily Average Equity Market Value 9,636 12,131 Dividends + Share Repurchases of % of Equity Market Value (5) 6% 10% CF Industries (in USD) |
|
|
Reconciliation of non-GAAP Measures – CF Industries 19 We have presented Total Debt to Equity Market Value, Free Cash Flow to Total Debt, Return on Invested Capital (ROIC) and Return on Equity (ROE) because management uses these measures to track the company’s performance in comparison to its peers and believes that these are frequently used by securities analysts, investors and other interested parties in the evaluation of companies in our industry. Invested capital, stockholders equity and each of their components are period-end amounts and not average amounts. Notes: Total Debt to Equity Market Value is defined as total debt divided by Equity Market Value. Total debt is defined as all debt for the specified time period. Equity Market Value is defined as shares outstanding multiplied by the share price. Free Cash Flow to Total Debt is defined as operating cash flow minus capital expenditures, dividends paid and minority interest divided by all debt. ROIC is defined as after tax operating income divided by invested capital. After tax operating income is defined as operating income times the net of 1 minus a standard tax rate of 35% (operating income x (1- tax rate of 35%)). Invested capital is defined as net debt plus stockholders equity. Net debt is defined as all debt plus minority interests (Non-controlling Interest) minus cash. ROE is defined as net earnings divided by stockholders equity. 12 Mnths 12 Mnths 12 Mnths 9 Mnths 9 Mnths LTM Ending Ending Ending Ending Ending Ending In millions, except percentages 12/31/10 12/31/11 12/31/12 9/30/12 9/30/13 9/30/13 Total Debt / Equity Market Value Total Debt 1,618 1,605 3,098 Equity Market Value 9,482 12,799 12,081 Total Debt / Equity Market Value (1) 17% 13% 26% Free Cash Flow to Total Debt Operating Cash Flow 1,194 2,079 2,376 1,954 1,429 1,851 Capital Expenditures (258) (247) (524) (261) (633) (895) Dividends (46) (69) (103) (77) (72) (98) Noncontrolling Interest (117) (146) (232) (213) (64) (83) Free Cash Flow 773 1,617 1,517 1,403 660 775 Free Cash Flow / Total Debt (2) 0.4x 1.0x 0.9x 0.3x ROIC Calculation Operating Income 2,791 2,959 2,343 1,847 2,463 Tax @ 35% (977) (1,036) (820) (646) (862) Net Operating Income After Tax 1,814 1,923 1,523 1,201 1,601 Cash (1,207) (2,275) (2,286) (2,286) Short Term Borrowing - - - Notes Payable 5 - - - Current Portion of LT Debt - - - - Noncurrent Notes Payable - 5 - - Long-term Debt 1,613 1,600 3,098 3,098 Non-Controlling Interest 386 380 356 356 Stockholders Equity 4,547 5,902 5,106 5,106 Invested Capital 5,344 5,612 6,274 6,274 ROIC (3) 34% 34% 26% Return on Equity Calculation Net Earnings Attributable to Common Stockholders 349 1,539 1,849 1,378 1,139 1,610 Stockholders Equity 4,050 4,547 5,902 5,106 5,106 ROE (4) 9% 34% 31% 32% CF Industries (in USD) |

