Attached files
| file | filename |
|---|---|
| 8-K - CURRENT REPORT - ASPEN GROUP, INC. | aspu_8k.htm |
OTCBB: ASPU
LD Micro Conference
December 4, 2013

SAFE HARBOR STATEMENT
1
Certain statements in this presentation and responses to various questions include forward-looking statements including statements
regarding our strategic plans for 2013 and 2013 through 2015 projections. The words “believe,” “may,” “estimate,” “continue,”
“anticipate,” “intend,” “should,” “plan,” “could,” “target,” “potential,” “is likely,” “will,” “expect” and similar expressions, as they relate to
us, are intended to identify forward-looking statements. We have based these forward-looking statements largely on our current
expectations and projections about future events and financial trends that we believe may affect our financial condition, results of
operations, business strategy and financial needs. Important factors that could cause actual results to differ from those in the forward-
looking statements include competition, ineffective media and/or marketing, failure to maintain growth in degree seeking students, and
failure to generate sufficient revenue. Further information on our risk factors is contained in our filings with the SEC, including the
Prospectus dated August 8, 2013. Any forward-looking statement made by us herein speaks only as of the date on which it is made.
Factors or events that could cause our actual results to differ may emerge from time to time, and it is not possible for us to predict all of
them. We undertake no obligation to publicly update any forward-looking statement, whether as a result of new information, future
developments or otherwise, except as may be required by law.
Regulation G - Non-GAAP Financial Measures
This presentation includes a discussion of EBITDA which is a non-GAAP financial measure. A reconciliation to the most directly
comparable GAAP financial measure is provided at the end of this presentation. The Company uses this financial measure which is
not calculated and presented in accordance with U.S. generally accepted accounting principles in evaluating its financial and
operational decision making and as a means to evaluate period-to period comparison. The Company presents this non-GAAP financial
measure because it believes it to be an important supplemental measure of performance that is commonly used by securities analysts,
investors and other interested parties in the evaluation of companies in our industry.
The Company defines EBITDA as earnings (or loss) from continuing operations before interest expense, income taxes, depreciation
and amortization, and amortization of non-cash stock-based compensation. The Company excludes stock-based compensation
because it is non-cash in nature.
and amortization, and amortization of non-cash stock-based compensation. The Company excludes stock-based compensation
because it is non-cash in nature.
This Non-GAAP financial measure should not be considered as an alternative to net income, operating income, cash flow from
operating activities, as a measure of liquidity or any other financial measure. It may not be indicative of the historical operating results
of the Company nor is it intended to be predictive of potential future results. Investors should not consider this non-GAAP financial
measure in isolation or as a substitute for performance measures calculated in accordance with GAAP.

THE HIGHER EDUCATION SECTOR IS
BROKEN
BROKEN
2
• >$1.2 Trillion Federal Student Loan Debt
• The U.S. Census Bureau found that the average student loan
amount jumped 82 percent to $27,547 between 1993 and 2011.
amount jumped 82 percent to $27,547 between 1993 and 2011.
• Tuition rates have risen over 500% since 1980’s
• Among all full-time students attending four-year programs
at for-profit schools, only about 22 percent can expect to
graduate in six years*
at for-profit schools, only about 22 percent can expect to
graduate in six years*
• At 44% of all for-profit schools, the odds are a student will
default rather than graduate**
default rather than graduate**
*http://www.edtrust.org/dc/press-room/news/broken-promises-for-profit-colleges-fail-our-students
**http://www.educationsector.org/sites/default/files/publications/Defaults_CYCT-F_JULY.pdf
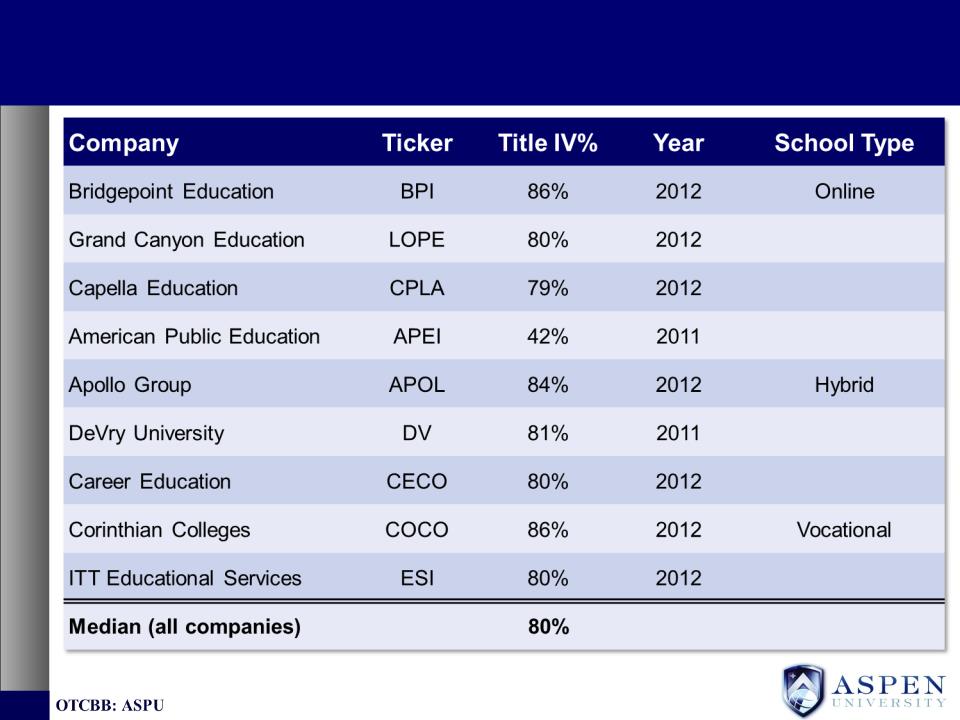
COMPETITORS’ EXPOSURE TO TITLE IV
90/10 RULE (ASPEN CURRENTLY AT 26%*)
90/10 RULE (ASPEN CURRENTLY AT 26%*)
3
Source: BMO Capital Markets, 4/15/13 *Based on recently filed 10/31/13 GAGAS DOE Audit

ASPEN UNIVERSITY SNAPSHOT
4
— Nationally Recognized &
Accredited Online University
Accredited Online University
— 65 Degree programs
— Doctorate, Master, Bachelor,
Associate, Certificates
Associate, Certificates
— MBA and MSN programs
are key to future growth
are key to future growth
— DOE Title IV Provisional Status
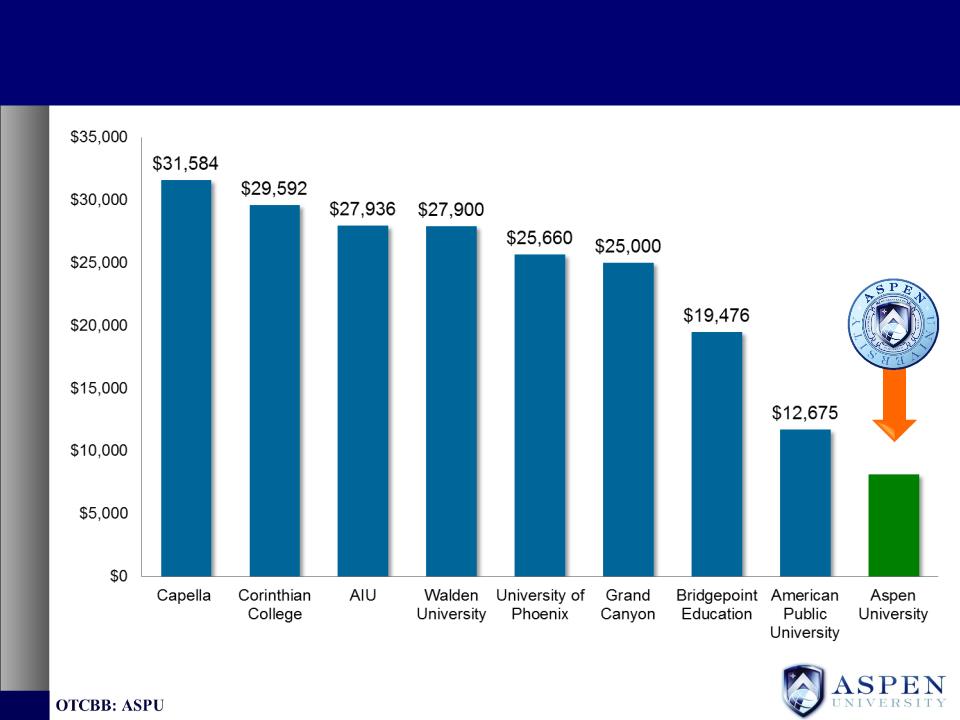
— Tuition is ~50% lower than online competitors
— 2,171 FT degree seeking students as of end October, 2013
§ 86% of F-T Degree Seeking Student Body are Graduate students
ASPEN’S METRICS AMONG BEST IN
INDUSTRY
INDUSTRY
5
Year-End 2012 Data
— Exceptional adjunct faculty: 61% hold a
Doctorate
Doctorate
— High course completion rates: 90%*
— High Student Satisfaction Rates: 95%*
— Strong graduation rates: 58%
— Among highest graduate employment
rates: 91%
rates: 91%
— Among lowest tuition rates in the For-
Profit education sector
Profit education sector
— Lowest % of Title IV revenues in the
sector: 26%
sector: 26%
§ Peers averaging 85%
*Among top 10 most popular courses
ASPEN UNIVERSITY MISSION STATEMENT
6
Build the First-Ever ‘Cash-Based’ University
-Keep tuition rates low enough to ‘pay-as-you-go’
Mission is for students to
achieve an ROI from their
educational investment
achieve an ROI from their
educational investment
ROI Formula:
Additional Compensation Earned
Since Graduation
Since Graduation
WORLD-CLASS MBA PROGRAM AT
AFFORDABLE PRICE
AFFORDABLE PRICE
7
$12,000*
*Effective June 1, 2013

Aspen offers RNs the ability to obtain an MSN for less than
$20,000:
$20,000:
— RNs begin with 7-course RN-to-MSN Bridge Program for $7,200
§ Thereby bypassing requirement for BSN degree
— Upon Bridge Program completion, matriculate to 12-course MSN
Program for $12,000
Program for $12,000
— Compensation for Nurses is defined state-by-state; studies indicate that
Nurses with an MSN earn between $30K - $90K more annually than
RNs
Nurses with an MSN earn between $30K - $90K more annually than
RNs
— Grew from 8% to 28% of Aspen’s full-time, degree-seeking student body
over the past 18 months
over the past 18 months
Aspen MSN Graduates Achieve an ROI on their
Academic Investment in Less Than 1 Year!
Academic Investment in Less Than 1 Year!
ASPEN’S NURSING PROGRAM:
AN ROI STORY
AN ROI STORY
8
*Not including part-time students
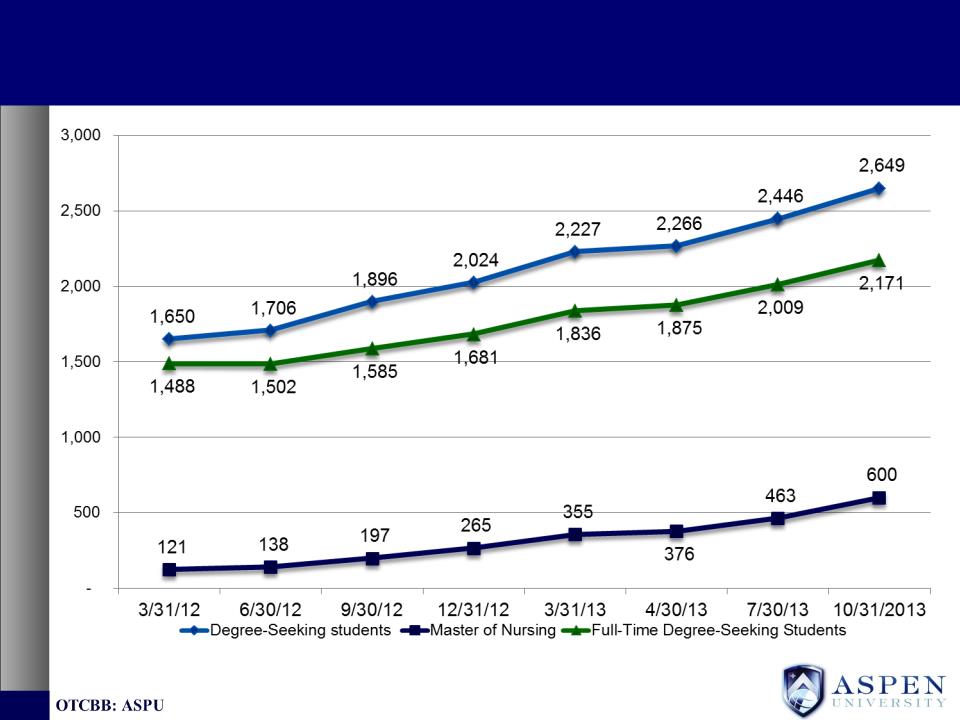
STUDENT ENROLLMENT TRENDS:
ASPEN’S NURSING PROGRAM EXPLODING
ASPEN’S NURSING PROGRAM EXPLODING
9

FY’Q2 (October 31) Quarterly Operating Metrics -
Best in History
Best in History
10
|
|
10/31/2012
|
7/31/2013
|
10/31/2013
|
|
Class Starts (Quarter)*
|
1,109
|
1,006
|
1,264
|
|
Average Tuition Per Start*
|
$ 601
|
$ 705
|
$ 755
|
|
Enrollments (Quarter)
|
232
|
266
|
295
|
|
Cost Per Enrollment (Qtr. Avg.)
|
$ 948
|
$ 916
|
$ 850
|
— Average tuition up 26% y/o/y, class starts up 14% y/o/y
— Cost per enrollment has dropped to $850
*GAAP revenues recognized over 10-week term (or 16-week term for FA students)
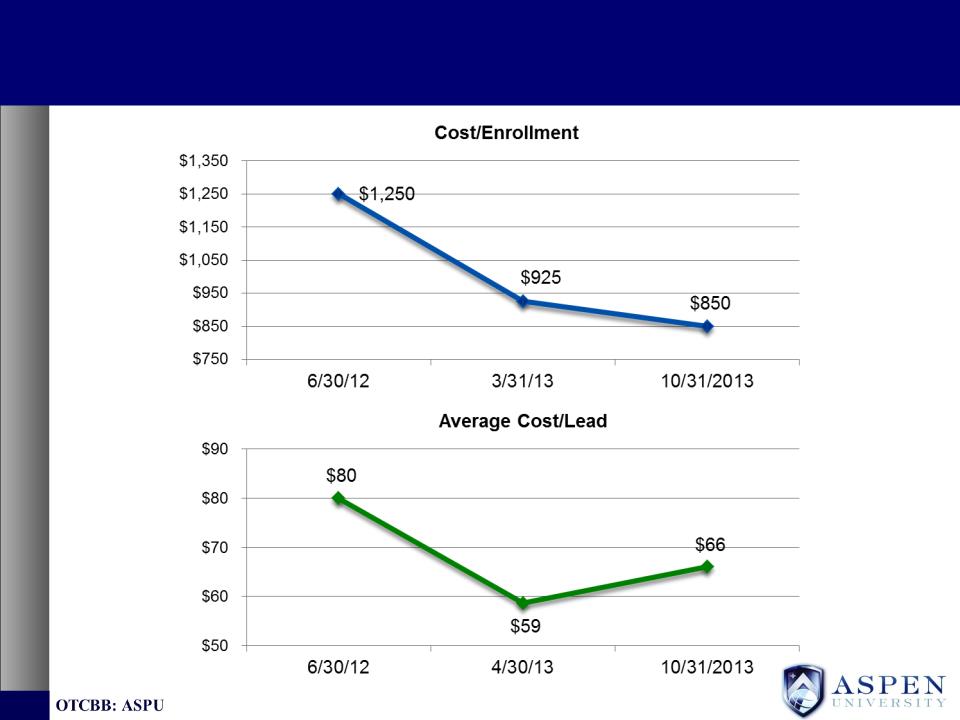
DECLINING STUDENT ENROLLMENT COSTS
11

HOW DOES ASPEN DO IT?
12
Aspen offers world class education at half the cost of its
competitors; Committed to cash-based, pay-as-you-go
education
competitors; Committed to cash-based, pay-as-you-go
education
— Management’s expertise in internet marketing and lead
generation
generation
— While competitors outsource lead-gen, Aspen does it all in house
— Cost per enrollment was $850 in Q2 of FY 2014
— Leads are higher quality, committed students who graduate and
the vast majority are currently employed
the vast majority are currently employed
— Aspen passes on cost savings to students
— Monthly Installment programs make already low tuition more
affordable
affordable
§ Make three $333.33 monthly tuition payments during each 10-week class
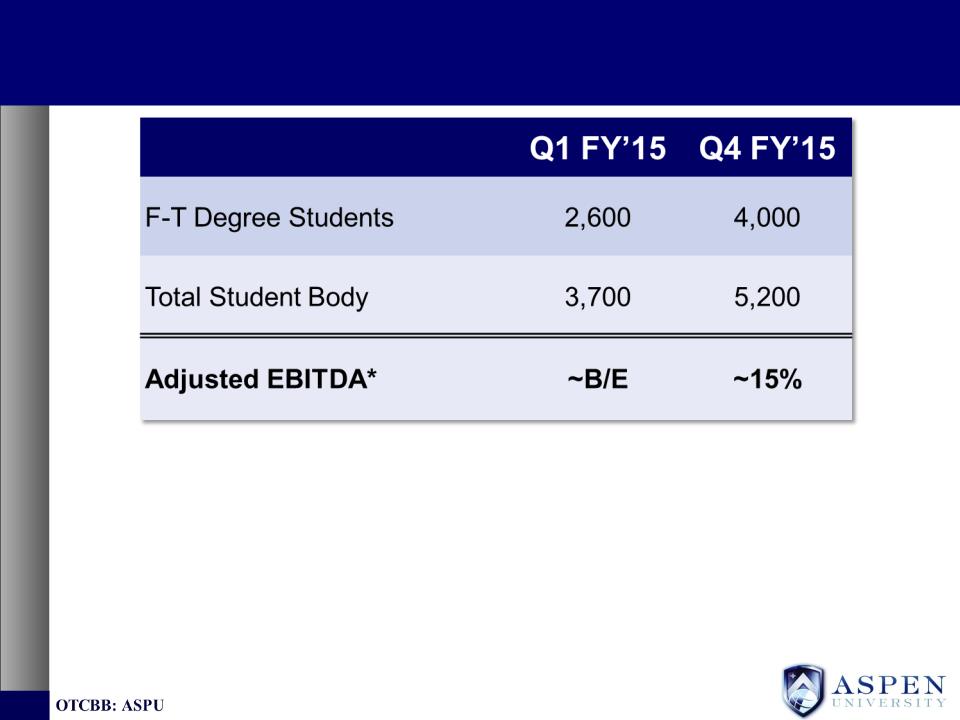
FY 2015 PROJECTIONS (4/30 Fiscal)
*Adjusted EBITDA excludes preferred dividends, interest expense, income taxes, collateral valuation adjustment,
bad debt expense, depreciation and amortization, and amortization of stock-based compensation.
bad debt expense, depreciation and amortization, and amortization of stock-based compensation.
— Aspen expects to break even on an Adjusted EBITDA* basis when the
full-time degree-seeking student body reaches ~2,600
full-time degree-seeking student body reaches ~2,600
— At 4,000 full-time degree-seeking students, Aspen expects to generate
~15% Adjusted EBITDA profit margin
~15% Adjusted EBITDA profit margin
13
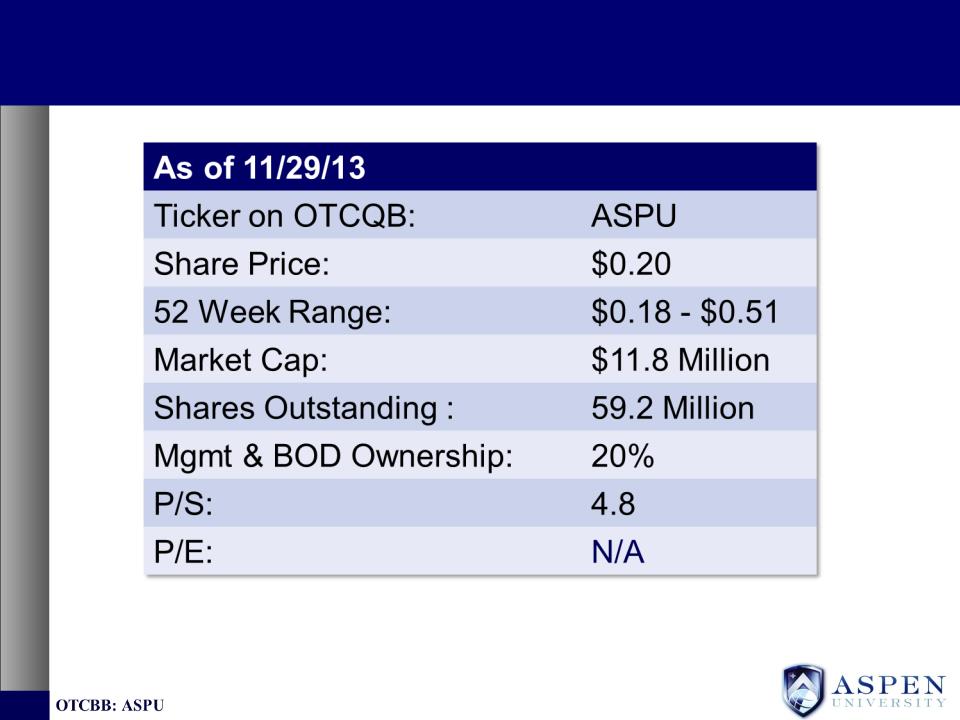
EQUITY SNAPSHOT
14
QUESTIONS & ANSWERS