Attached files
| file | filename |
|---|---|
| EX-99.1 - PRESS RELEASE - ARO Liquidation, Inc. | q313-exhibit991.htm |
| 8-K - 8-K - ARO Liquidation, Inc. | aro-20131204x8xk.htm |

1 Third Quarter 2013 Financial Results


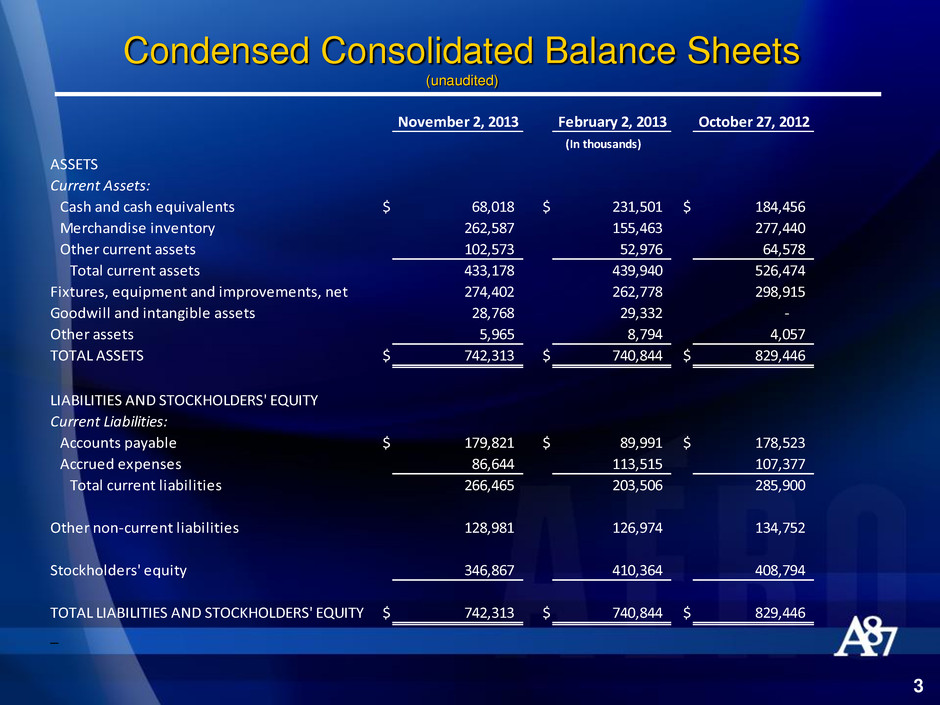
Condensed Consolidated Balance Sheets (unaudited) 3 November 2, 2013 February 2, 2013 October 27, 2012 ASSETS Current Assets: Cash and cash equivalents $ 68,018 $ 231,501 $ 184,456 Merchandise inventory 262,587 155,463 277,440 Other current assets 102,573 52,976 64,578 Total current assets 433,178 439,940 526,474 Fixtures, equipment and improvements, net 274,402 262,778 298,915 Goodwill and intangible assets 28,768 29,332 - Other assets 5,965 8,794 4,057 TOTAL ASSETS $ 742,313 $ 740,844 $ 829,446 LIABILITIES AND STOCKHOLDERS' EQUITY Current Liabilities: Accounts payable $ 179,821 $ 89,991 $ 178,523 Accrued expenses 86,644 113,515 107,377 Total current liabilities 266,465 203,506 285,900 Other non-current liabilities 128,981 126,974 134,752 Stockholders' equity 346,867 410,364 408,794 TOTAL LIABILITIES AND STOCKHOLDERS' EQUITY $ 742,313 $ 740,844 $ 829,446 _ (In thousands)

Condensed Consolidated Statements of Operation (unaudited) 4 November 2, 2013 % of sales October 27, 2012 % of sales Net sales $ 514,588 100.0 % $ 605,918 100.0% Cost of sales (includes certain buying, occupancy and warehousing expenses) 1 426,699 82.9 % 436,911 72.1% Gross profit 87,889 17.1 % 169,007 27.9% Selling, general and administrative expenses 128,923 25.1 % 126,514 20.9% (Loss) income from operations (41,034) (8.0)% 42,493 7.0% Interest expense, net 314 0.0 % 39 0.0% (Loss) income before income taxes (41,348) (8.0)% 42,454 7.0% Income tax (benefit) provision (15,725) (3.0)% 17,507 2.9% Net (loss) income $ (25,623) (5.0)% $ 24,947 4.1% Basic (loss) earnings per share $ (0.33) $ 0.31 Dilut d (loss) earnings per share $ (0.33) $ 0.31 Weighted average basic shares 78,488 79,833 Weighted average diluted shares 78,488 80,136 1 Cost of sales for the third quarter of fiscal 2013 was unfavorably impacted by store asset impairment charges of (In thousands, except per share data) 13 Weeks Ended $5.1 million ($2.8 million after tax, or $0.04 per diluted share).

Reconciliation of Net Loss and Diluted Loss Per Share (In thousands, except per share data) (Unaudited) 5 The following table presents a reconciliation of net loss and diluted loss per share ("EPS") on a GAAP basis to the non-GAAP adjusted basis: Net Loss Diluted EPS As reported $ (25,623) $ (0.33) Asset impairment charges 2,769 0.04 As adjusted $ (22,854) $ (0.29) The Company believes that the disclosure of adjusted net loss and adjusted loss per diluted share, better understand the Company's results. 13 Weeks Ended November 2, 2013 which are non-GAAP financial measures, provides investors with useful information to help them

6 Third Quarter Metrics Fiscal 2013 1 Fiscal 2012 Comparable sales change (15)% (1)% Comparable units per transaction change 2 % 3 % Comparable sales transactions change (10)% 2 % Comparable average unit retail change (7)% (5)% 1 The comparable changes for the 13-week period ended November 2, 2013 are compared to the 13-week period ended November 3, 2012. Third Quarter

Third Quarter Metrics 7 November 2, 2013 October 27, 2012 Average square footage increase 3 % 4 % Total square footage at end of period 4,158,439 4,033,820 Average square footage during period 4,161,383 4,027,337 Change in total inventory over comparable period (5)% 5 % Change in inventory per retail square foot (11)% 1 % over comparable period 13 Weeks Ended

8 Third Quarter 2013 Store Count Q2 Additions Closures Q3 Aéropostale U.S. 898 3 (4) 897 Aéropostale Canada 79 - - 79 Total Aéropostale 977 3 (4) 976 P.S. from Aéropostale 142 6 - 148 Total stores 1,119 9 (4) 1,124
