Attached files
| file | filename |
|---|---|
| 8-K - 8-K - DIGITAL RIVER INC /DE | a13-25546_18k.htm |
Exhibit 99.1
|
|
DIGITAL RIVER COMPARISON OF HISTORICAL NON-GAAP TO NON-GAAP FROM CONTINUING OPERATIONS |
|
|
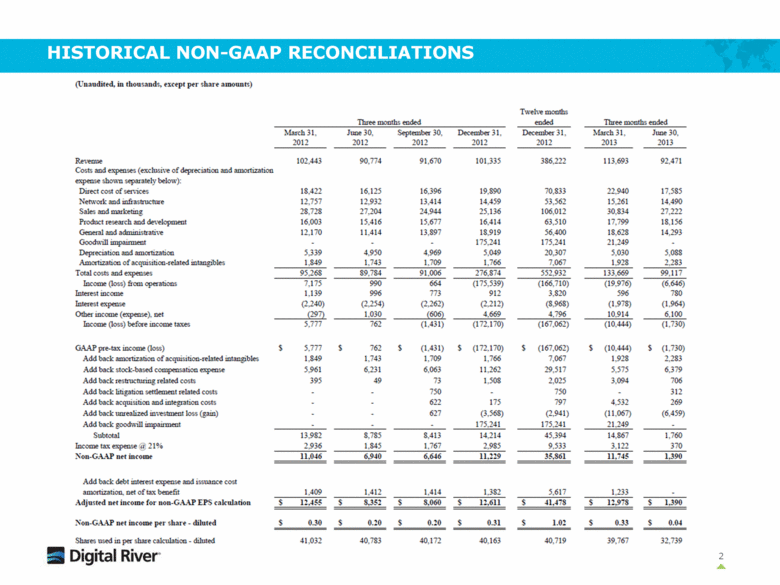
2 HISTORICAL NON-GAAP RECONCILIATIONS(Unaudited, in thousands, except per share amounts) Three months ended Twelve months ended Three months ended March 31, 2012 June 30, 2012 September 30, 2012 December 31, 2012 December 31, 2012 March 31, 2013 June 30, 2013 Revenue 102,443 90,774 91,670 101,335 386,222 113,693 92,471 Costs and expenses (exclusive of depreciation and amortization expense shown separately below): Direct cost of services 18,422 16,125 16,396 19,890 70,833 22,940 17,585 Network and infrastructure 12,757 12,932 13,414 14,459 53,562 15,261 14,490 Sales and marketing 28,728 27,204 24,944 25,136 106,012 30,834 27,222 Product research and development 16,003 15,416 15,677 16,414 63,510 17,799 18,156 General and administrative 12,170 11,414 13,897 18,919 56,400 18,628 14,293 Goodwill impairment - - - 175,241 175,241 21,249 - Depreciation and amortization 5,339 4,950 4,969 5,049 20,307 5,030 5,088 Amortization of acquisition-related intangibles 1,849 1,743 1,709 1,766 7,067 1,928 2,283 Total costs and expenses 95,268 89,784 91,006 276,874 552,932 133,669 99,117 Income (loss) from operations 7,175 990 664 (175,539 ) (166,710 ) (19,976 ) (6,646 ) Interest income 1,139 996 773 912 3,820 596 780 Interest expense (2,240 ) (2,254 ) (2,262 ) (2,212 ) (8,968 ) (1,978 ) (1,964 ) Other income (expense), net (297 ) 1,030 (606 ) 4,669 4,796 10,914 6,100 Income (loss) before income taxes 5,777 762 (1,431 ) (172,170 ) (167,062 ) (10,444 ) (1,730 ) GAAP pre-tax income (loss) $ 5,777 $ 762 $ (1,431 ) $ (172,170 ) $ (167,062 ) $ (10,444 ) $ (1,730 ) Add back amortization of acquisition-related intangibles 1,849 1,743 1,709 1,766 7,067 1,928 2,283 Add back stock-based compensation expense 5,961 6,231 6,063 11,262 29,517 5,575 6,379 Add back restructuring related costs 395 49 73 1,508 2,025 3,094 706 Add back litigation settlement related costs - - 750 - 750 - 312 Add back acquisition and integration costs - - 622 175 797 4,532 269 Add back unrealized investment loss (gain) - - 627 (3,568 ) (2,941 ) (11,067 ) (6,459 ) Add back goodwill impairment - - - 175,241 175,241 21,249 - Subtotal 13,982 8,785 8,413 14,214 45,394 14,867 1,760 Income tax expense @ 21% 2,936 1,845 1,767 2,985 9,533 3,122 370 Non-GAAP net income 11,046 6,940 6,646 11,229 35,861 11,745 1,390 Add back debt interest expense and issuance cost amortization, net of tax benefit1,409 1,412 1,414 1,382 5,617 1,233 - Adjusted net income for non-GAAP EPS calculation $ 12,455 $ 8,352 $ 8,060 $ 12,611 $ 41,478 $ 12,978 $ 1,390 Non-GAAP net income per share - diluted $ 0.30 $ 0.20 $ 0.20 $ 0.31 $ 1.02 $ 0.33 $ 0.04 Shares used in per share calculation - diluted 41,032 40,783 40,172 41,063 40,719 39,767 32,739 |
|
|
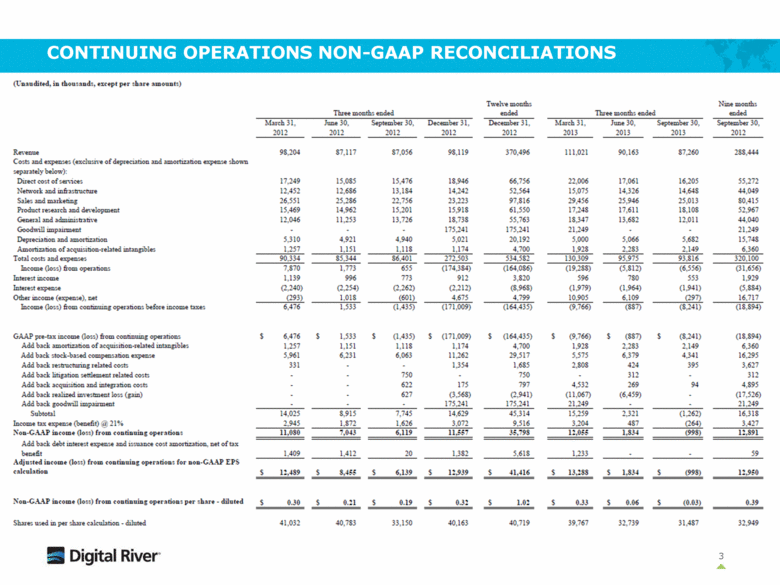
CONTINUING OPERATIONS NON-GAAP RECONCILITIONS (Unaudited, in thousands, except per share a amounts) Three months ended Twelve months ended Three months ended Nine months ended March 31, June 30, September 30, December 31, December 31, March 31, June 30, September 30, September 30, 2012 2012 2012 2012 2012 2013 2013 2013 2012 Revenue Costs expenses (exclusive of depreciation and amortization expense shown separately below): 98,204 87,117 87,056 98,119 370,496 111,021 90,163 87,260 288,444 Direct Cost of services 17,249 15,085 15,476 18,946 66,756 22,006 17,061 16,205 55,272 Network and infrastructure 12,452 12,686 13,184 14,242 52,564 15,075 14,326 14,648 44,049 Sales and marketing 26,551 25,286 22,756 23,223 97,816 29,456 25,946 25,013 80,415 Product research and development 15,469 14,962 15,201 15,918 61,550 17,248 17,611 18,108 52,967 General and administrative 12,046 11,253 13,726 18,738 55,763 18,}47 13,682 12,011 44,040 Goodwill impairment - - - 175,241 175,241 21,249 - - 21,249 Depreciation and amortization 5,310 4,921 4,940 5,021 20,192 5,000 5,066 5,682 15,748 Amortization of acquisition-related intangibles 1,257 1,151 1,118 1,174 4,700 1,928 2,283 2,149 6,360 Total costs and expenses 90,334 85,344 86,401 272,503 534,582 130,309 95,975 93,816 320,100 Income (loss) from operations 7,870 1,773 655 (174,384 ) (164,086 ) (19,288 ) (5,812 ) (6,556 ) (31,656 ) Interest income 1,139 996 773 912 3,820 596 780 553 1,929 Interest expense (2,240 ) (2,254 ) (2,262 ) (2,212 ) (8,968 ) (1,979 ) (1,964 ) (1,941 ) (5,884 ) Other income (expense), net (293 ) 1,018 (601 ) 4,675 4,799 10,905 6,109 (297 ) 16,717 Income (loss) from continuing operations before income taxes 6,476 1,533 (1,435 ) (171,009 ) (164,435 ) (9,766 ) (887 ) (8,241 ) (18,894 ) (GAAP pre-tax income (loss) from continuing operations 6,476 $1,533 $(1,435 ) $(171,009 ) $(164,435 ) $(9,766 ) $(887 ) $(8,241 ) (18,894 ) Add back amortization of acquisition-related intangibles 1,257 1,151 1,118 1,174 4,700 1,928 2,283 2,149 6,360 Add back stock-based compensation expense 5,961 6,231 6,063 11,262 29,517 5,575 6379 4,341 16,295 Add back restructuring related costs 331 - - 1,354 1,685 2,808 424 395 3,627 Add back litigation settlement related costs - - 750 - 750 - 312 - 312 Add back acquisition and integration costs - - 622 175 797 4,532 269 94 4,895 Add back realized investment loss (gain) - - 627 (3,568 ) (2,941 ) (11,067 ) (6,459 ) - (17,526 ) Add back goodwill impairment - - - 175,241 175,241 21,249 - - 21,249 Subtotal 14,025 8,915 (7,745 ) 14,629 (45,314 ) 15,259 2,321 (1,262 ) 16,318 Income tax expense (benefit) @ 21% 2,945 1,872 1,626 3,072 9,516 3,204 487 (264 ) 3,427 Non-GAAP income (loss) from continuing operations 11,080 7,043 6,119 11,557 35,798 12,055 1,834 998 1,891 Add back debt interest expense and issuance cost amortization, net of tax (benefit) 1,409 1,412 20 1,382 5,618 1,233 - - 59 Adjusted income (loss) from continuing operations for non-GAAP EPS calculation $12,489 $8,455 $6,139 $12,939 $41,416 $13,288 $1,834 $(998 ) 12,950 Non-GAAP income loss from continuing operations per share - diluted $0.30 $0.21 $0.19 $0.32 $1.02 $0.33 $0.06 $(0.03 ) 0.39 Shares used in per share calculation - diluted 41,032 40,783 33,150 40,163 40,719 39,767 32,739 31,487 32,949 |
|
|
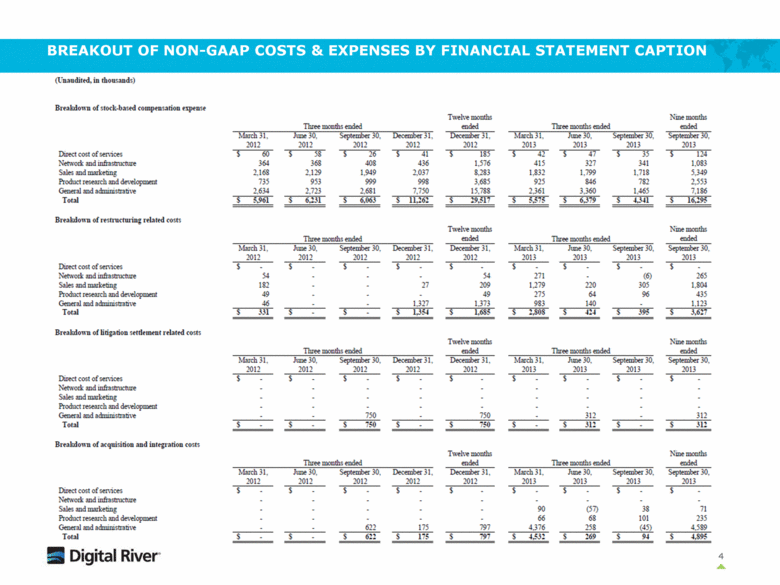
4 BREAKOUT OF NON-GAAP COSTS & EXPENSES BY FINANCIAL STATEMENT CAPTION (Unaudited, in thousands) Breakdown of stock-based compensation expense Three months ended Twelve months ended Three months ended Nine months ended March 31, 2012 June 30,2012 September 30, 2012 December 31, 2012 December 31, 2012 March 31, 2013 June 30, 2013 September 30, 2013 September 30, 2013 Direct cost of services $60 $58 $26 $41 $185 $42 $47 $35 $124 Network and infrastructure 364 368 408 436 1,576 415 327 341 1,083 Sales and marketing 2,168 2,129 1,949 2,037 8,283 1,832 1,799 1,718 5,349 Product research and development 735 953 999 998 3,685 925 846 782 2,553 General and administrative 2,634 2,723 2,681 7,750 15,788 2,361 3,360 1,465 7,186 Total $5,961 $6,231 $6,063 $11,262 $29,517 $5,575 $6,379 $4,341 $16,295 Breakdown of restructuring related costs Three months ended Twelve months ended Three months ended Nine months ended March 31, 2012 June 30, 2012 September 30, 2012 December 31, 2012 December 31, 2012 March 31, 2013 June 30, 2013 September 30, 2013 September 30, 2013 Direct cost of services $- $- $- $- $- $- $- $- $- Network and infrastructure 54 - - - 54 271 - (6 ) 265 Sales and marketing 182 - - 27 209 1,279 220 305 1,804 Product research and development 49 - - - 49 275 64 96 435 General and administrative 46 - - 1,327 1,373 983 140 - 1,123 Total $331 $- $- $1,354 $1,685 $2,808 $424 $395 $3,627 Breakdown of litigation settlement related costs Three months ended Twelve months ended Three months ended Nine months ended March 31, 2012 June 30, 2012 September 30, 2012 December 31, 2012 December 31, 2012 March 31, 2013 June 30, 2013 September 30, 2013 September 30, 2013 Direct cost of services $- $- $- $- $- $- $- $- $- Network and infrastructure - - - - - - - - - Sales and marketing - - - - - - - - - Product research and development - - - - - - - - - General and administrative - - 750 - 750 - 312 - 312 Total $- $- $750 $- $750 $- $312 $- $312 Breakdown of acquisition and integration costs Three months ended Twelve months ended Three months ended Nine months ended March 31, 2012 June 30, 2012 September 30, 2012 December 31, 2012 December 31, 2012 March 31, 2013 June 30, 2013 September 30, 2013 September 30, 2013 Direct cost of services $- $- $- $- $- $- $- $- $- Network and infrastructure - - - - - - - - - Sales and marketing - - - - - 90 (57 ) 38 71 Product research and development - - - - - 66 68 101 235 General and administrative - - 622 175 797 4,376 258 (45 ) 4,589 Total $- $- $622 $175 $797 4,532 $269 $94 $4,589 |


