Attached files
| file | filename |
|---|---|
| 8-K - FORM 8-K - CMS ENERGY CORP | d634632d8k.htm |
Exhibit 99.1
CMS ENERGY
BMO Utility Conference
December 4, 2013
Cross Winds Energy Park
Gas Combined Cycle Plant
Consumers Smart Energy Program
CMS ENERGY
This presentation is made as of the date hereof and contains “forward-looking statements” as defined in Rule 3b-6 of the Securities Exchange Act of 1934, Rule 175 of the Securities Act of 1933, and relevant legal decisions. The forward-looking statements are subject to risks and uncertainties. All forward-looking statements should be considered in the context of the risk and other factors detailed from time to time in CMS Energy’s and Consumers Energy’s Securities and Exchange Commission filings. Forward-looking statements should be read in conjunction with “FORWARD-LOOKING STATEMENTS AND
INFORMATION” and “RISK FACTORS” sections of CMS Energy’s and Consumers Energy’s Form 10-K for the year ended December 31, 2012 and as updated in subsequent 10-Qs. CMS Energy’s and Consumers Energy’s “FORWARD-LOOKING STATEMENTS AND INFORMATION” and “RISK FACTORS” sections are incorporated herein by reference and discuss important factors that could cause CMS Energy’s and Consumers Energy’s results to differ materially from those anticipated in such statements. CMS Energy and Consumers Energy undertake no obligation to update any of the information presented herein to reflect facts, events or circumstances after the date hereof.
The presentation also includes non-GAAP measures when describing CMS Energy’s results of operations and financial performance. A reconciliation of each of these measures to the most directly comparable GAAP measure is included in the appendix and posted on our website at www.cmsenergy.com.
CMS Energy provides historical financial results on both a reported (Generally Accepted Accounting Principles) and adjusted (non-GAAP) basis and provides forward-looking guidance on an adjusted basis. Management views adjusted earnings as a key measure of the company’s present operating financial performance, unaffected by discontinued operations, asset sales, impairments, regulatory items from prior years, or other items. These items have the potential to impact, favorably or unfavorably, the company’s reported earnings in future periods. Because the company is not able to estimate the impact of these matters, the company is not providing a reconciliation to the comparable future period reported earnings.
1
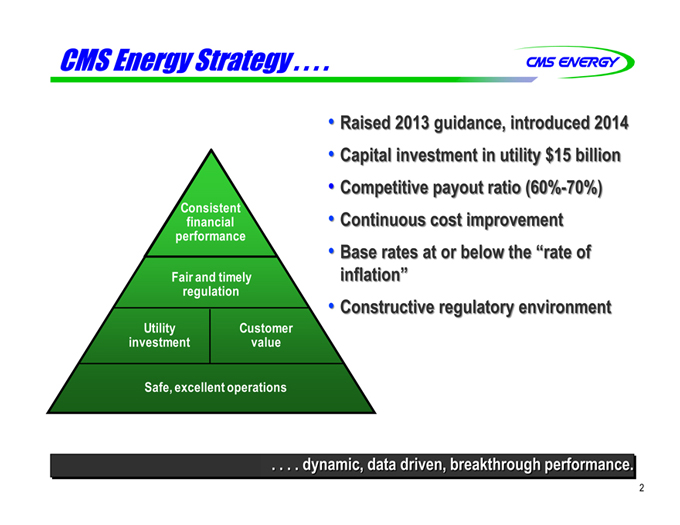
CMS Energy Strategy . . . . CMS ENERGY
Raised 2013 guidance, introduced 2014
Capital investment in utility $15 billion
Competitive payout ratio (60%-70%)
Continuous cost improvement
Base rates at or below the “rate of inflation”
Constructive regulatory environment
Consistent
financial
performance
Fair and timely
regulation
Utility investment
Customer value
Safe, excellent operations
. . . . dynamic, data driven, breakthrough performance.
2
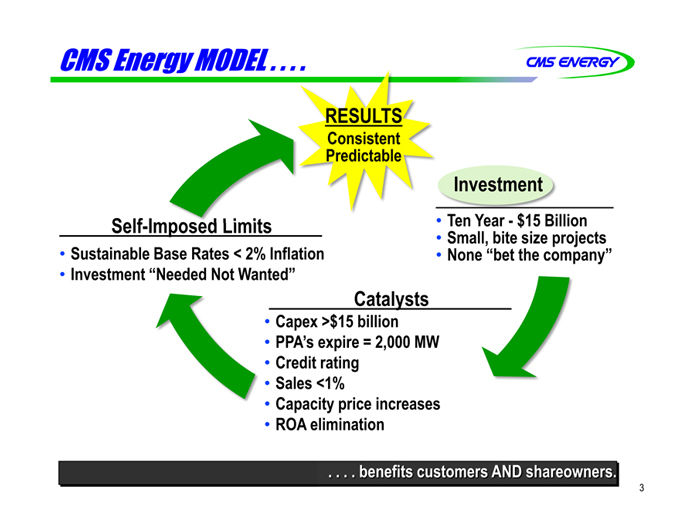
CMS Energy MODEL . . . . CMS ENERGY
RESULTS
Consistent Predictable
Self-Imposed Limits
Sustainable Base Rates < 2% Inflation
Investment “Needed Not Wanted”
Investment
Ten Year - $15 Billion
Small, bite size projects
None “bet the company”
Catalysts
Capex >$15 billion
PPA’s expire = 2,000 MW Credit rating
Sales <1%
Capacity price increases ROA elimination
. . . . benefits customers AND shareowners.
3
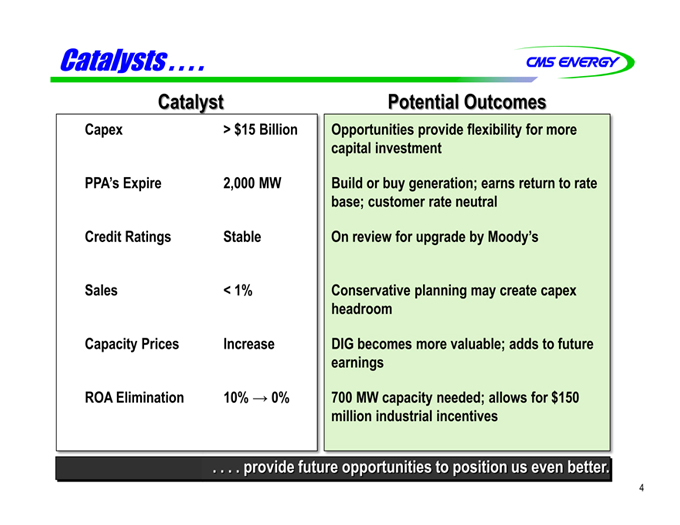
Catalysts . . . . CMS ENERGY
Catalyst
Capex > $15 Billion
PPA’s Expire 2,000 MW
Credit Ratings Stable
Sales < 1%
Capacity Prices Increase
ROA Elimination 10% -> 0%
Potential Outcomes
Opportunities provide flexibility for more
capital investment
Build or buy generation; earns return to rate
base; customer rate neutral
On review for upgrade by Moody’s
Conservative planning may create capex
headroom
DIG becomes more valuable; adds to future
earnings
700 MW capacity needed; allows for $150
million industrial incentives
. . . . provide future opportunities to position us even better.
4
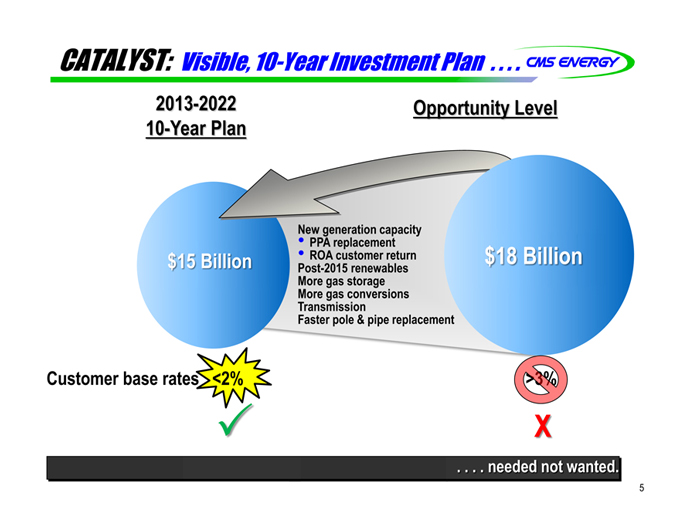
CATALYST: Visible, 10-Year Investment Plan . . . . CMS ENERGY
2013-2022
10-Year Plan
Opportunity Level
$15 Billion
New generation capacity
PPA replacement
ROA customer return Post-2015 renewables More gas storage More gas conversions Transmission Faster pole & pipe replacement
$18 Billion
Customer base rates <2%
>3%
X
. . . . needed not wanted.
5
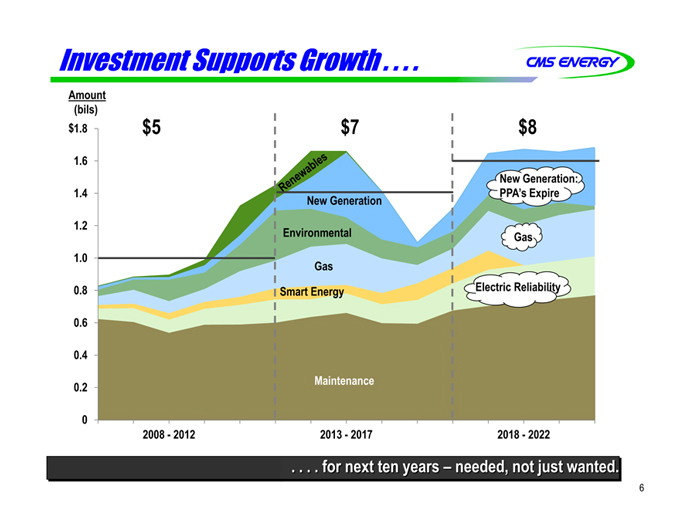
Investment Supports Growth . . . . CMS ENERGY
Amount
(bils)
$1.8 $5 $7 $8
1.6
1.4 Renewables New Generation:
1.2 New Generation PPA’s Expire
1.0 Environmental Gas
0.8 Gas
0.6 Smart Energy Electric Reliability
0.4
0.2 Maintenance
0
2008 - 2012 2013 - 2017 2018 - 2022
. . . . for next ten years - needed, not just wanted.
6
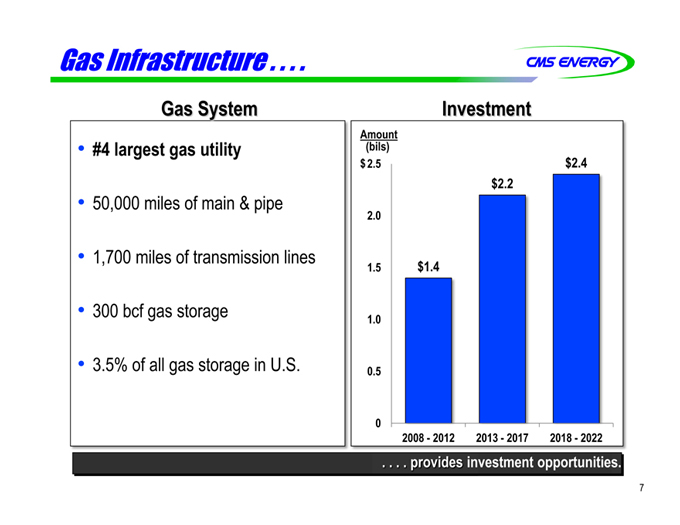
Gas Infrastructure . . . . CMS ENERGY
Gas System
#4 largest gas utility
50,000 miles of main & pipe
1,700 miles of transmission lines
300 bcf gas storage
3.5% of all gas storage in U.S.
Investment
Amount
(bils)
$ 2.5 $2.4
$2.2
2.0
1.5 $1.4
1.0
0.5
0
2008 - 2012 2013 - 2017 2018 - 2022
. . . . provides investment opportunities.
7
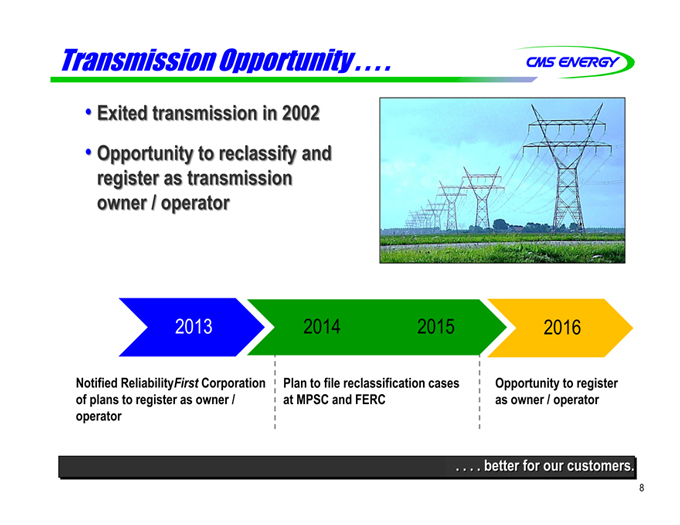
Transmission Opportunity. . . . CMS ENERGY
Exited transmission in 2002
Opportunity to reclassify and register as transmission owner / operator
2013 2014 2015 2016
Notified Reliability First Corporation of plans to register as owner / operator
Plan to file reclassification cases at MPSC and FERC
Opportunity to register as owner / operator
. . . . better for our customers.
8
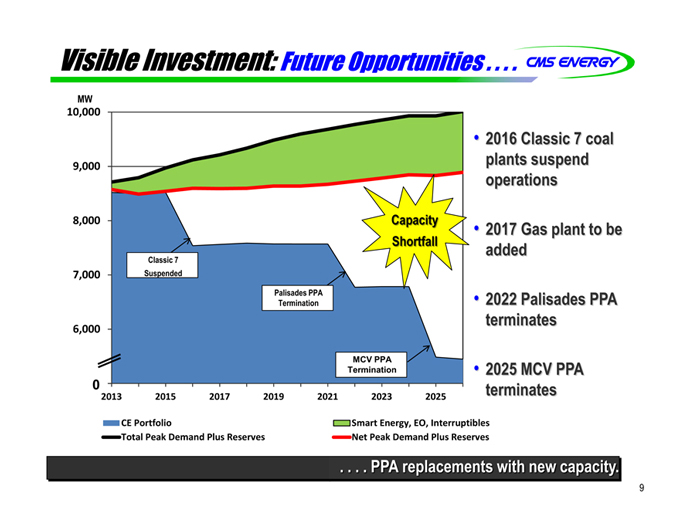
Visible Investment: Future Opportunities. . . . CMS ENERGY
MW
10,000 9,000 8,000 7,000 6,000 0
2013 2015 2017 2019 2021 2023 2025
Capacity Shortfall
Classic 7 Suspended
Palisades PPA Termination
MCV PPA Termination
2016 Classic 7 coal plants suspend operations
2017 Gas plant to be added
2022 Palisades PPA terminates
2025 MCV PPA terminates
CE Portfolio
Smart Energy, EO, Interruptibles
Total Peak Demand Plus Reserves
Net Peak Demand Plus Reserves
. . . . PPA replacements with new capacity.
9
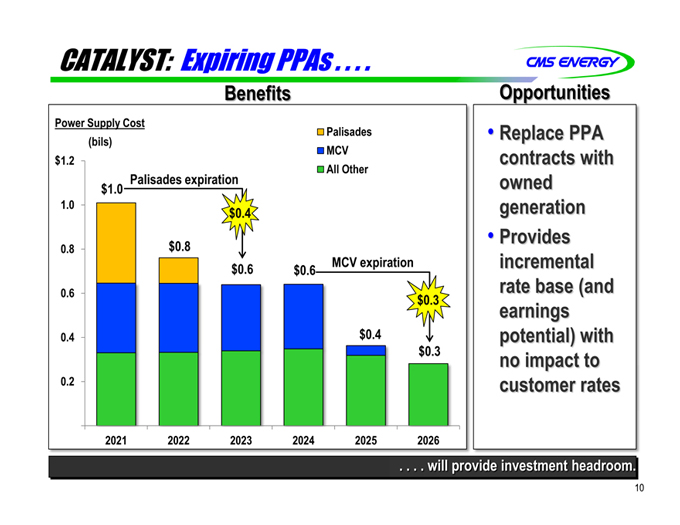
CATALYST: Expiring PPAs. . . . CMS ENERGY
Benefits
Power Supply Cost
(bils)
Palisades MCV All Other
$1.2 1.0 0.8 0.6 0.4 0.2
2021 2022 2023 2024 2025 2026
Palisades expiration
$1.0 $0.8 $0.6 $0.4
MCV expiration
$0.6 $0.4 $0.3 $0.3
Opportunities
Replace PPA contracts with owned generation
Provides incremental rate base (and earnings potential) with no impact to customer rates
. . . . will provide investment headroom.
10
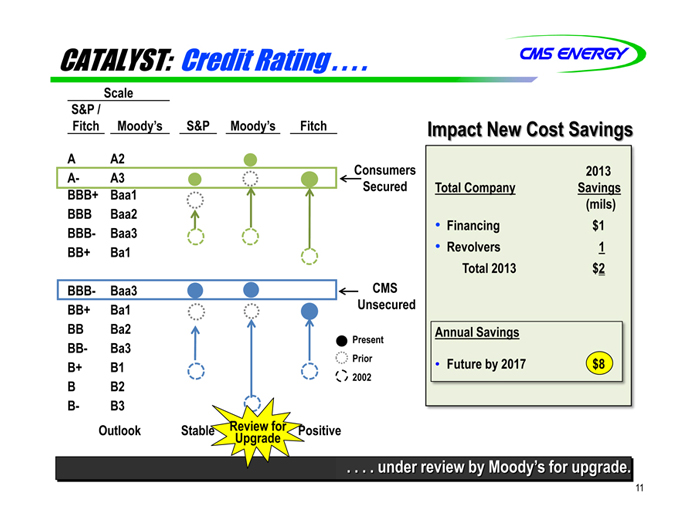
CATALYST: Credit Rating. . . . CMS ENERGY
Scale
S&P / Fitch Moody’s S&P Moody’s Fitch
A A2
A- A3 Consumers Secured
BBB+ Baa1
BBB Baa2
BBB- Baa3
BB+ Ba1
CMS Unsecured
BBB- Baa3
BB+ Ba1
BB Ba2
BB- Ba3
B+ B1
B B2
B- B3
Present
Prior
2002
Outlook
Stable
Review for Upgrade
Positive
Impact New Cost Savings
Total Company
2013 Savings
(mils)
Financing $1
Revolvers 1
Total 2013 $2
Annual Savings
Future by 2017 $8
. . . . under review by Moody’s for upgrade.
11
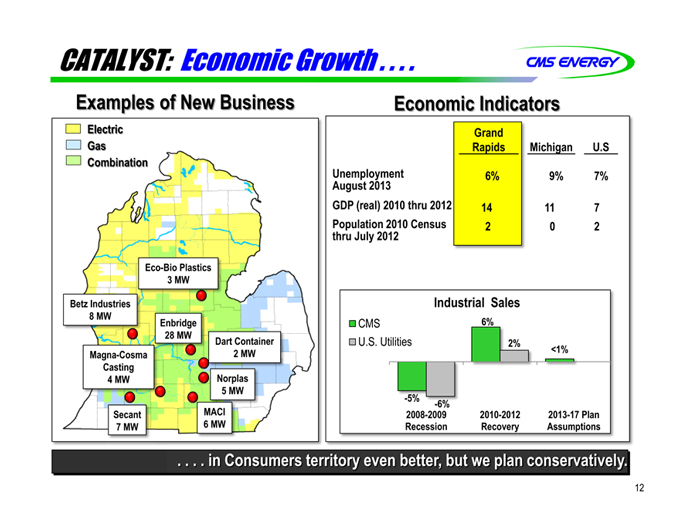
CATALYST: Economic Growth. . . . CMS ENERGY
Examples of New Business
Electric Gas Combination
Eco-Bio Plastics 3 MW
Betz Industries 8 MW
Enbridge 28 MW
Dart Container 2 MW
Magna-Cosma Casting 4 MW
Norplas 5 MW
Secant 7 MW
MACI 6 MW
Economic Indicators
Grand Rapids Michigan U.S
Unemployment August 2013 6% 9% 7%
GDP (real) 2010 thru 2012 14 11 7
Population 2010 Census thru July 2012 2 0 2
Industrial Sales
CMS U.S. Utilities
6% 2% <1% -5% -6%
2008-2009 Recession
2010-2012 Recovery
2013-17 Plan Assumptions
. . . . in Consumers territory even better, but we plan conservatively.
12
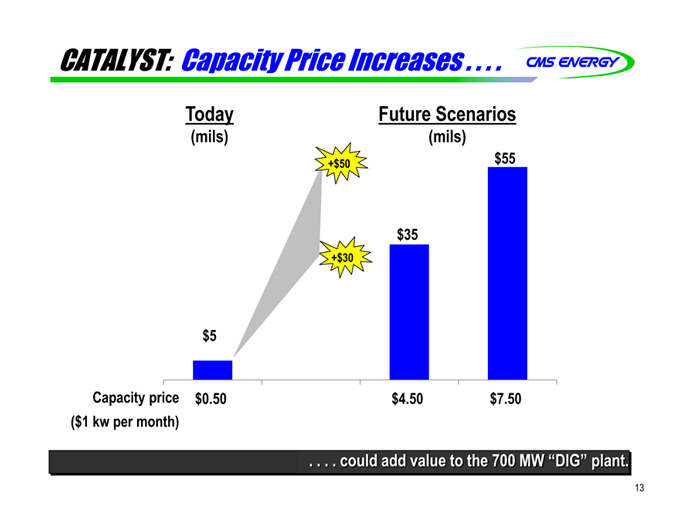
CATALYST: Capacity Price Increases. . . . CMS ENERGY
Today (mils)
Future Scenarios (mils)
+$50 +$30
$5 $35 $55
Capacity price
$0.50 $4.50 $7.50
($1 kw per month)
. . . . could add value to the 700 MW “DIG” plant.
13
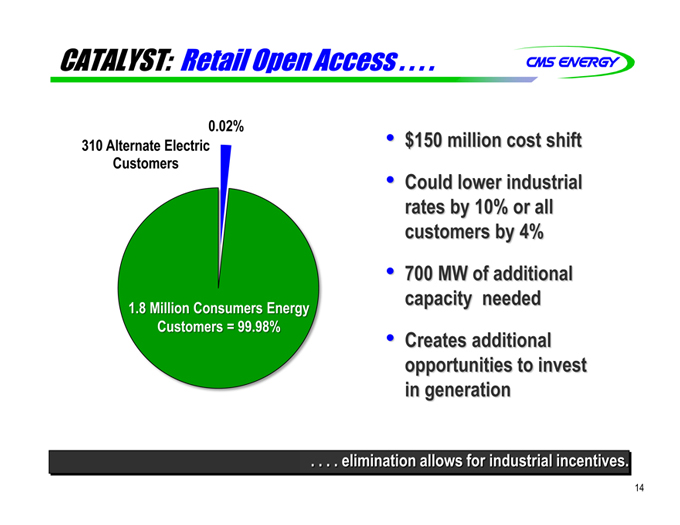
CATALYST: Retail Open Access. . . . CMS ENERGY
310 Alternate Electric 0.02%
Customers
1.8 Million Consumers Energy
Customers = 99.98%
$150 million cost shift
Could lower industrial
rates by 10% or all
customers by 4%
700 MW of additional
capacity needed
Creates additional
opportunities to invest
in generation
. . . . elimination allows for industrial incentives.
14
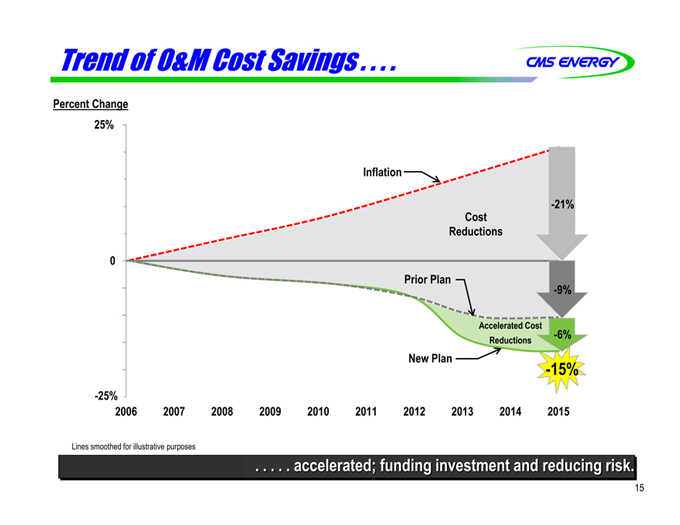
Trend of O&M Cost Savings. . . . CMS ENERGY
Percent Change
25%
Inflation
-21%
Cost
Reductions
0
Prior Plan
-9%
Accelerated Cost
Reductions -6%
New Plan -15%
-25%
2006 2007 2008 2009 2010 2011 2012 2013 2014 2015
Lines smoothed for illustrative purposes
. . . . . accelerated; funding investment and reducing risk.
15
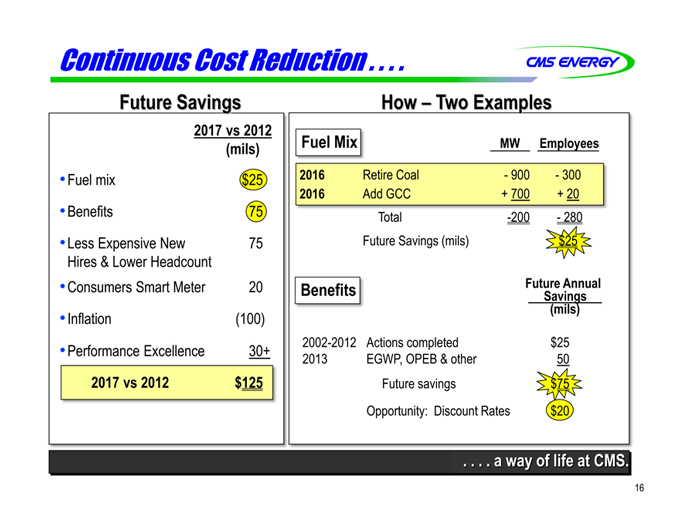
Continuous Cost Reduction. . . . CMS ENERGY
Future Savings
2017 vs 2012
(mils)
Fuel mix $25
Benefits 75
Less Expensive New 75
Hires & Lower Headcount
Consumers Smart Meter 20
Inflation (100)
Performance Excellence 30+
2017 vs 2012 $125
How - Two Examples
Fuel Mix MW Employees
2016 Retire Coal - 900 - 300
2016 Add GCC + 700 + 20
Total -200 - 280
Future Savings (mils) $25
Benefits Future Savings Annual
(mils)
2002-2012 Actions completed $25
2013 EGWP, OPEB & other 50
Future savings $75
Opportunity: Discount Rates $20
. . . . a way of life at CMS.
16
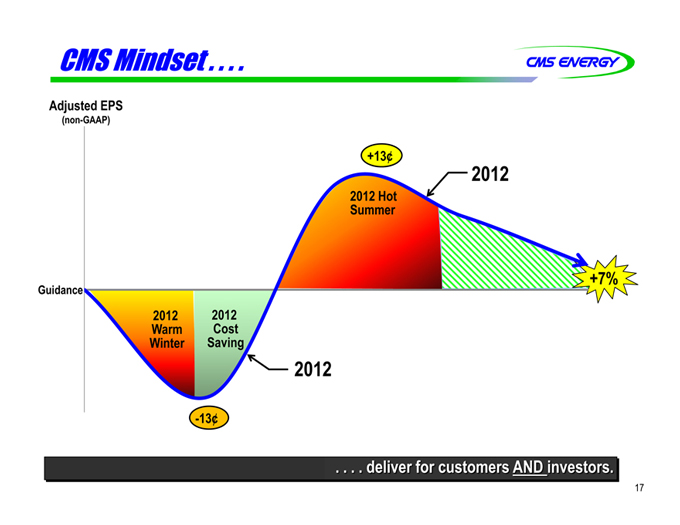
CMS Mindset. . . . CMS ENERGY
Adjusted EPS
(non-GAAP)
+13¢
2012
2012 Hot
Summer
Guidance +7%
2012 2012
Warm Cost
Winter Saving
2012
-13¢
. . . . deliver for customers AND investors.
17
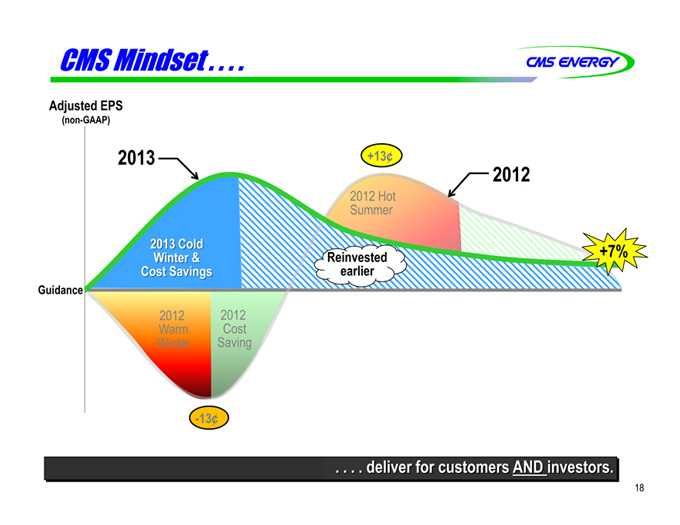
CMS Mindset. . . . CMS ENERGY
Adjusted EPS
(non-GAAP)
2013 +13¢ 2012
2012 Hot
Summer
2013 Cold +7%
Winter & Reinvested
Cost Savings earlier
Guidance
2012 2012
Warm Cost
Winter Saving
-13¢
. . . . deliver for customers AND investors.
18
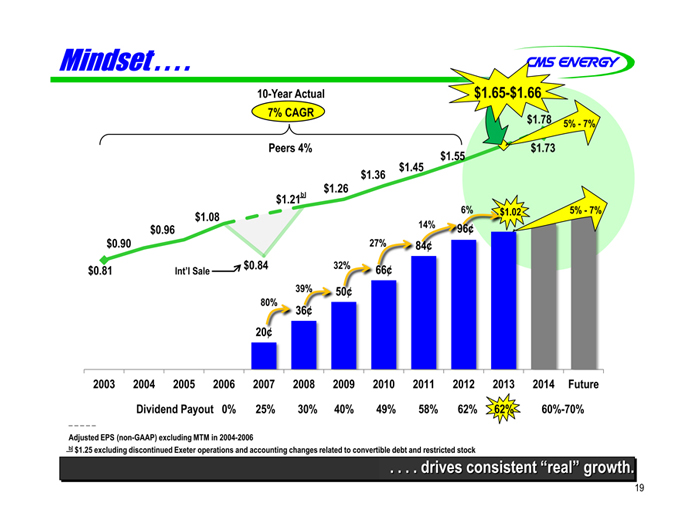
Mindset....
CMS ENERGY
10-Year Actual $1.65-$1.66
7% CAGR
$1.78
5%-7%
Peers 4%
$1.73
$1.55
$1.36
$1.45
$1.26
$1.21b
$1.08
6%
$1.02
5%-7%
$0.96
14%
27%
$0.90
$0.81
Int’l Sale
$0.84
32%
39%
80%
20
2003 2004 2005 2006 2007 2008 2009 2010 2011 2012 2013 2014
Future
Dividend Payout 0%
25% 30% 40% 49% 58% 62% 62% 60%-70%
Adjusted EPS (non-GAAP) excluding MTM in 2004-2006 b $1.25 excluding discontinued Exeter operations and accounting changes related to convertible debt and restricted stock
....drives consistent “real” growth.
20 36 50 66 84 96
19

APPENDIX
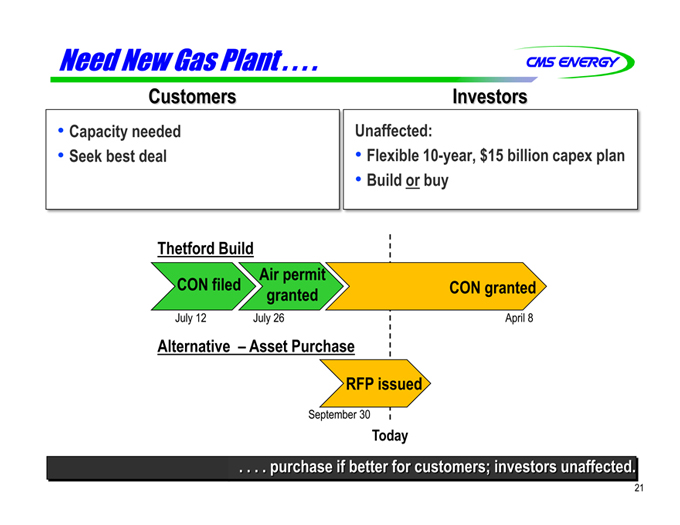
Need New Gas Plant....
CMS ENERGY
Customers
Investors
Capacity needed
Unaffected:
Seek best deal
Flexible 10-year, $15 billion capex plan
Build or buy
Thetford Build
Air permit
CON filed
CON granted
July 12
July 26
April 8
Alternative – Asset Purchase
RFP issued
September 30
Today
. . . . purchase if better for customers; investors unaffected.
21
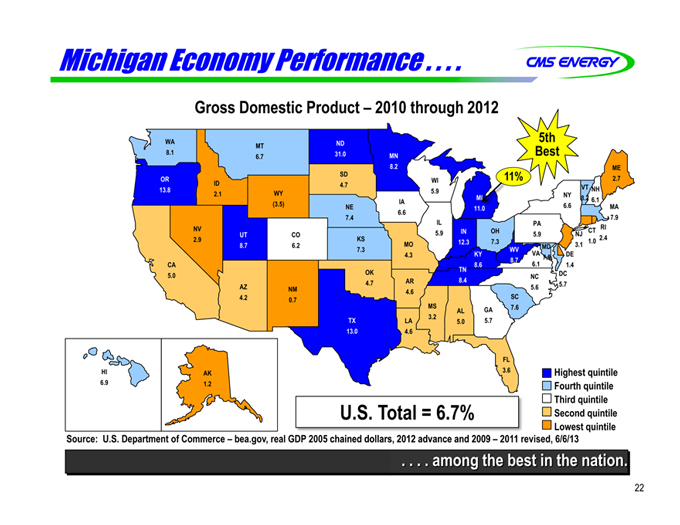
Michigan Economy Performance. . . . CMS ENERGY
Gross Domestic Product – 2010 through 2012
WA 8.1 MT 6.7 ND 31.0
MN 8.2
5th Best
OR 13.8
ID 2.1
SD 4.7
WI 5.9
11%
ME 2.7 VT NH
(3.5) WY
IA 6.6
MI 11.0
NY 8.2 6.1 MA
NE 7.4
6.6 7.9 IL PA
NV UT CO 5.9 IN
OH 5.9 NJ CT RI 2.9
8.7 6.2 KS MO 12.3 7.3 MD
3.1 1.0 2.4 7.3 4.3 KY WV
VA 7.5 DE 8.7 CA 8.6 6.1
1.4 OK TN 5.0
NC DC 4.7 AR 8.4 5.7
AZ NM 4.6 5.6 4.2 0.7
SC MS AL GA 7.6
TX LA 3.2 5.0 5.7 13.0 4.6
FL HI AK 3.6 Highest quintile
6.9 1.2 Fourth quintile
Third quintile
U.S. Total = 6.7%
Second quintile
Lowest quintile
Source: U.S. Department of Commerce – bea.gov, real GDP 2005 chained dollars, 2012 advance and 2009 - 2011 revised, 6/6/13
. . . . among the best in the nation.
22
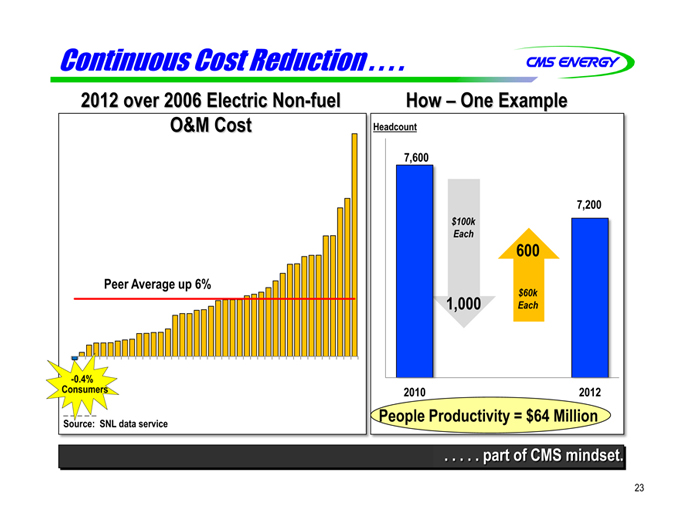
Continuous Cost Reduction. . . .
CMS ENERGY
2012 over 2006 Electric Non-fuel O&M Cost
Peer Average up 6%
-0.4% Consumers
Source: SNL data service
How – One Example
Headcount
7,600
7,200
$100k
Each
600
$60k
1,000 Each
2010 2012
People Productivity = $64 Million
. . . . . part of CMS mindset.
23
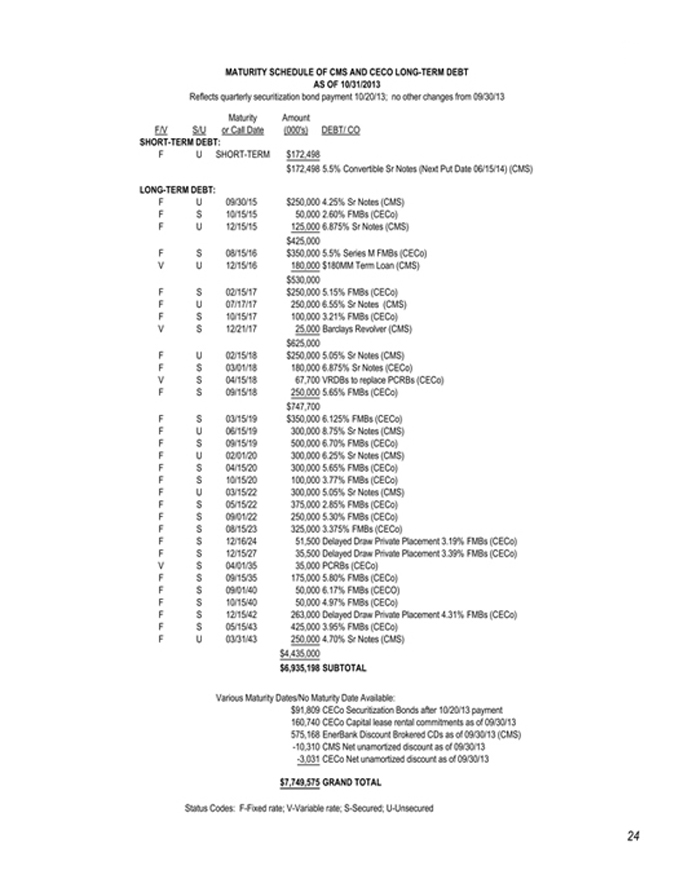
MATURITY SCHEDULE OF CMS AND CECO LONG-TERM DEBT AS OF 10/31/2013
Reflects quarterly securitization bond payment 10/20/13; no other changes from 09/30/13
Maturity Amount
F/V S/U or Call Date (000’s) DEBT/ CO
SHORT-TERM DEBT:
F U SHORT-TERM $172,498
$172,498 5.5% Convertible Sr Notes (Next Put Date 06/15/14) (CMS)
LONG-TERM DEBT:
F U 09/30/15 $250,000 4.25% Sr Notes (CMS)
F S 10/15/15 50,000 2.60% FMBs (CECo)
F U 12/15/15 125,000 6.875% Sr Notes (CMS)
$425,000
F S 08/15/16 $350,000 5.5% Series M FMBs (CECo)
V U 12/15/16 180,000 $180MM Term Loan (CMS)
$530,000
F S 02/15/17 $250,000 5.15% FMBs (CECo)
F U 07/17/17 250,000 6.55% Sr Notes (CMS)
F S 10/15/17 100,000 3.21% FMBs (CECo)
V S 12/21/17 25,000 Barclays Revolver (CMS)
$625,000
F U 02/15/18 $250,000 5.05% Sr Notes (CMS)
F S 03/01/18 180,000 6.875% Sr Notes (CECo)
V S 04/15/18 67,700 VRDBs to replace PCRBs (CECo)
F S 09/15/18 250,000 5.65% FMBs (CECo)
$747,700
F S 03/15/19 $350,000 6.125% FMBs (CECo)
F U 06/15/19 300,000 8.75% Sr Notes (CMS)
F S 09/15/19 500,000 6.70% FMBs (CECo)
F U 02/01/20 300,000 6.25% Sr Notes (CMS)
F S 04/15/20 300,000 5.65% FMBs (CECo)
F S 10/15/20 100,000 3.77% FMBs (CECo)
F U 03/15/22 300,000 5.05% Sr Notes (CMS)
F S 05/15/22 375,000 2.85% FMBs (CECo)
F S 09/01/22 250,000 5.30% FMBs (CECo)
F S 08/15/23 325,000 3.375% FMBs (CECo)
F S 12/16/24 51,500 Delayed Draw Private Placement 3.19% FMBs (CECo)
F S 12/15/27 35,500 Delayed Draw Private Placement 3.39% FMBs (CECo)
V S 04/01/35 35,000 PCRBs (CECo)
F S 09/15/35 175,000 5.80% FMBs (CECo)
F S 09/01/40 50,000 6.17% FMBs (CECO)
F S 10/15/40 50,000 4.97% FMBs (CECo)
F S 12/15/42 263,000 Delayed Draw Private Placement 4.31% FMBs (CECo)
F S 05/15/43 425,000 3.95% FMBs (CECo)
F U 03/31/43 250,000 4.70% Sr Notes (CMS)
$4,435,000
$6,935,198 SUBTOTAL
Various Maturity Dates/No Maturity Date Available: $91,809 CECo Securitization Bonds after 10/20/13 payment 160,740 CECo Capital lease rental commitments as of 09/30/13 575,168 EnerBank Discount Brokered CDs as of 09/30/13 (CMS) -10,310 CMS Net unamortized discount as of 09/30/13 -3,031 CECo Net unamortized discount as of 09/30/13 $7,749,575 GRAND TOTAL
Status Codes: F-Fixed rate; V-Variable rate; S-Secured; U-Unsecured
24
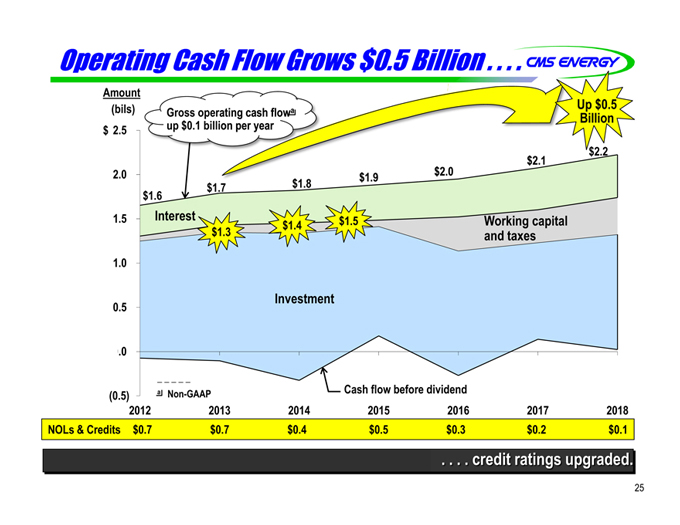
Operating Cash Flow Grows $0.5 Billion. . . .
CMS ENERGY
Amount
(bils)
Gross operating cash flowa up $0.1 billion per year
Up $0.5 Billion
$2.5 2.0 $1.6 $1.7 $1.8 $1.9 $2.0 $2.1 $2.2
1.5 Interest $1.3 $1.4 $1.5
Working capital and taxes
1.0 0.5 Investment .0 (0.5)
a Non-GAAP
Cash flow before dividend
2012 2013 2014 2015 2016 2017 2018
NOLs & Credits
$0.7 $0.7 $0.4 $0.5 $0.3 $0.2 $0.1
. . . . credit ratings upgraded.
25
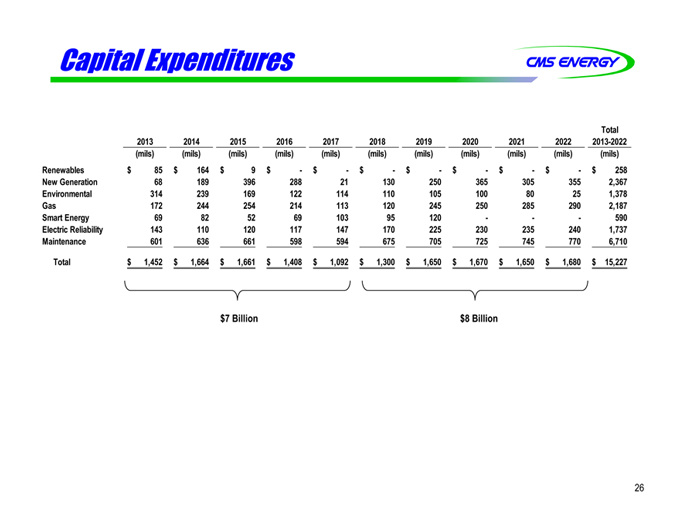
Capital Expenditures CMS ENERGY
Total
2013 2014 2015 2016 2017 2018 2019 2020 2021 2022 2013-2022
(mils) (mils) (mils) (mils) (mils) (mils) (mils) (mils) (mils) (mils) (mils)
Renewables $ 85 $ 164 $ 9 $ - $ - $ - $ - $ - $ - $ - $ 258
New Generation 68 189 396 288 21 130 250 365 305 355 2,367
Environmental 314 239 169 122 114 110 105 100 80 25 1,378
Gas 172 244 254 214 113 120 245 250 285 290 2,187
Smart Energy 69 82 52 69 103 95 120 - - - 590
Electric Reliability 143 110 120 117 147 170 225 230 235 240 1,737
Maintenance 601 636 661 598 594 675 705 725 745 770 6,710
Total $ 1,452 $ 1,664 $ 1,661 $ 1,408 $ 1,092 $ 1,300 $ 1,650 $ 1,670 $1,650 $ 1,680 $ 15,227
$7 Billion $8 Billion
26
GAAP RECONCILIATION
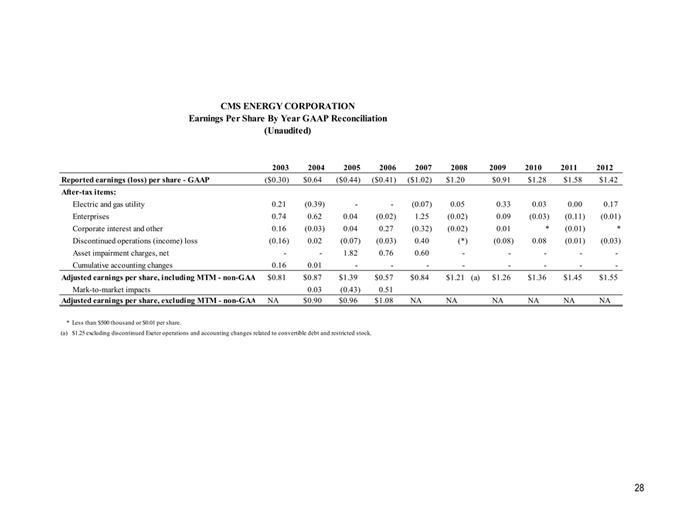
CMS ENERGY CORPORATION Earnings Per Share By Year GAAP Reconciliation (Unaudited)
2003 2004 2005 2006 2007 2008 2009 2010 2011 2012
Reported earnings (loss) per share - GAAP ($0.30) $0.64 ($0.44) ($0.41) ($1.02) $1.20 $0.91 $1.28 $1.58 $1.42
After-tax items:
Electric and gas utility 0.21 (0.39) - - (0.07) 0.05 0.33 0.03 0.00 0.17
Enterprises 0.74 0.62 0.04 (0.02) 1.25 (0.02) 0.09 (0.03) (0.11) (0.01)
Corporate interest and other 0.16 (0.03) 0.04 0.27 (0.32) (0.02) 0.01 * (0.01) *
Discontinued operations (income) loss (0.16) 0.02 (0.07) (0.03) 0.40 (*) (0.08) 0.08 (0.01) (0.03)
Asset impairment charges, net - - 1.82 0.76 0.60 - - - - -
Cumulative accounting changes 0.16 0.01 - - - - - - - -
Adjusted earnings per share, including MTM - non-GAA $0.81 $0.87 $1.39 $0.57 $0.84 $1.21(a) $1.26 $1.36 $1.45 $1.55
Mark-to-market impacts 0.03 (0.43) 0.51
Adjusted earnings per share, excluding MTM - non-GAA NA $0.90 $0.96 $1.08 NA NA NA NA NA NA
* Less than $500 thousand or $0.01 per share.
(a) $1.25 excluding discontinued Exeter operations and accounting changes related to convertible debt and restricted stock.
28
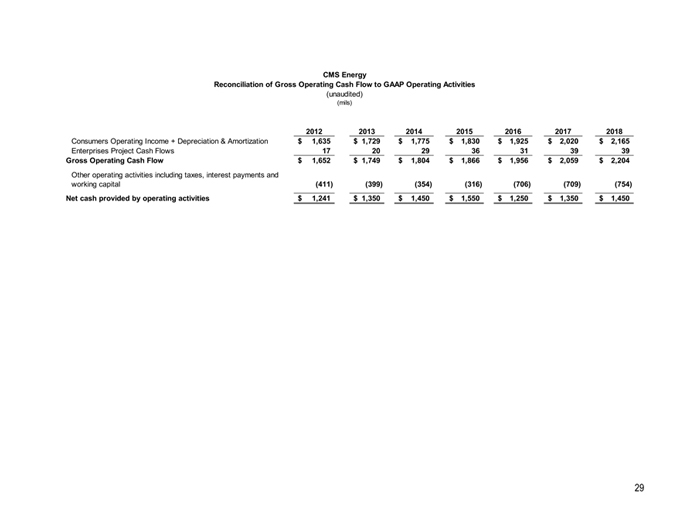
CMS Energy
Reconciliation of Gross Operating Cash Flow to GAAP Operating Activities
(unaudited)
(mils)
2012 2013 2014 2015 2016 2017 2018
Consumers Operating Income + Depreciation & Amortization $1,635 $1,729 $1,775 $1,830 $1,925 $2,020 $2,165
Enterprises Project Cash Flows 17 20 29 36 31 39 39
Gross Operating Cash Flow $1,652 $1,749 $1,804 $1,866 $1,956 $2,059 $2,204
Other operating activities including taxes, interest payments and working capital (411) (399) (354) (316) (706) (709) (754)
Net cash provided by operating activities $1,241 $1,350 $1,450 $1,550 $1,250 $1,350 $1,450
29