Attached files
| file | filename |
|---|---|
| 8-K - FORM 8-K - FRANK'S INTERNATIONAL N.V. | d635051d8k.htm |
 Investor Presentation
Fourth Quarter 2013
Fourth Quarter 2013
0
Exhibit 99.1 |
 Corporate Information
1
Keith Mosing
Chairman, President and CEO
John Walker
Vice President,
International Operations
John Sinders
Senior Vice President,
Finance and Investor Relations
Mark Margavio
Vice President and CFO
Thomas Dunavant
Investor Relations Manager
Ph: (713) 358-7343
thomas.dunavant@franksintl.com
Frank’s International N.V.
10260 Westheimer, Suite 700
Houston, TX 77042
www.franksintl.com
Disclaimer
This
presentation
contains
forward-looking
statements
within
the
meaning
of
Section
27A
of
the
Securities
Act
of
1933
and
Section
21E
of
the
Securities
Exchange
Act
of
1934.
All
statements,
other
than
statements
of
historical
facts,
included
in
this
press
release
that
address
activities,
events
or
developments
that
the
Company
expects,
believes
or
anticipates
will
or
may
occur
in
the
future
are
forward-looking
statements.
Without
limiting
the
generality
of
the
foregoing,
forward-looking
statements
contained
in
this
press
release
specifically
include
statements,
estimates
and
projections
regarding
the
Company’s
future
business
strategy
and
prospects
for
growth,
cash
flows
and
liquidity,
financial
strategy,
budget,
projections
and
operating
results,
the
amount,
nature
and
timing
of
capital
expenditures,
the
availability
and
terms
of
capital,
the
level
of
activity
in
the
oil
and
gas
industry,
volatility
of
oil
and
gas
prices,
unique
risks
associated
with
offshore
operations,
political,
economic
and
regulatory
uncertainties
in
international
operations,
the
ability
to
develop
new
technologies
and
products,
the
ability
to
protect
intellectual
property
rights,
the
ability
to
employ
and
retain
skilled
and
qualified
workers,
the
level
of
competition
in
the
Company’s
industry
and
other
guidance.
These
statements
are
based
on
certain
assumptions
made
by
the
Company
based
on
management’s
experience,
expectations
and
perception
of
historical
trends,
current
conditions,
anticipated
future
developments
and
other
factors
believed
to
be
appropriate.
Forward-looking
statements
are
not
guarantees
of
performance.
Although
the
Company
believes
the
expectations
reflected
in
its
forward-looking
statements
are
reasonable
and
are
based
on
reasonable
assumptions,
no
assurance
can
be
given
that
these
assumptions
are
accurate
or
that
any
of
these
expectations
will
be
achieved
(in
full
or
at
all)
or
will
prove
to
have
been
correct.
Moreover,
such
statements
are
subject
to
a
number
of
assumptions,
risks
and
uncertainties,
many
of
which
are
beyond
the
control
of
the
Company,
which
may
cause
actual
results
to
differ
materially
from
those
implied
or
expressed
by
the
forward-looking
statements.
These
include
the
factors
discussed
or
referenced
in
the
“Risk
Factors”
section
of
the
Company’s
prospectus
filed
with
the
U.S.
Securities
and
Exchange
Commission
(the
“SEC”)
on
August
9,
2013
and
its
subsequent
filings
with
the
SEC.
Accordingly,
you
should
not
place
undue
reliance
on
any
of
the
Company’s
forward-looking
statements.
Any
forward-looking
statement
speaks
only
as
of
the
date
on
which
such
statement
is
made,
and
the
Company
undertakes
no
obligation
to
correct
or
update
any
forward-looking
statement,
whether
as
a
result
of
new
information,
future
events
or
otherwise,
except
as
required
by
applicable
law,
and
we
caution
you
not
to
rely
on
them
unduly.
This
presentation
includes
the
non-GAAP
financial
measures
of
Adjusted
EBITDA
and
Adjusted
EBITDA
margin,
which
may
be
used
periodically
by
management
when
discussing
the
Company’s
financial
results
with
investors
and
analysts.
Adjusted
EBITDA
and
Adjusted
EBITDA
margin
are
presented
because
management
believes
these
metrics
provide
additional
information
relative
to
the
performance
of
the
Company’s
business.
These
metrics
are
commonly
employed
by
financial
analysts
and
investors
to
evaluate
the
operating
and
financial
performance
of
the
Company
from
period
to
period
and
to
compare
it
with
the
performance
of
other
publicly
traded
companies
within
the
industry.
You
should
not
consider
Adjusted
EBITDA
and
Adjusted
EBITDA
margin
in
isolation
or
as
a
substitute
for
analysis
of
the
Company’s
results
as
reported
under
GAAP.
Because
Adjusted
EBITDA
and
Adjusted
EBITDA
margin
may
be
defined
differently
by
other
companies
in
the
Company’s
industry,
the
Company’s
presentation
of
Adjusted
EBITDA
and
Adjusted
EBITDA
margin
may
not
be
comparable
to
similarly
titled
measures
of
other
companies,
thereby
diminishing
their
utility.
For
a
reconciliation
of
each
to
the
nearest
comparable
measure
in
accordance
with
GAAP,
please
see
the
Appendix. |
 Outline
2
FI Overview
Industry Update –
Rig Counts
FI Business Segments
Services
US Land
Offshore (US and International)
Tubular Sales
Financial Update |
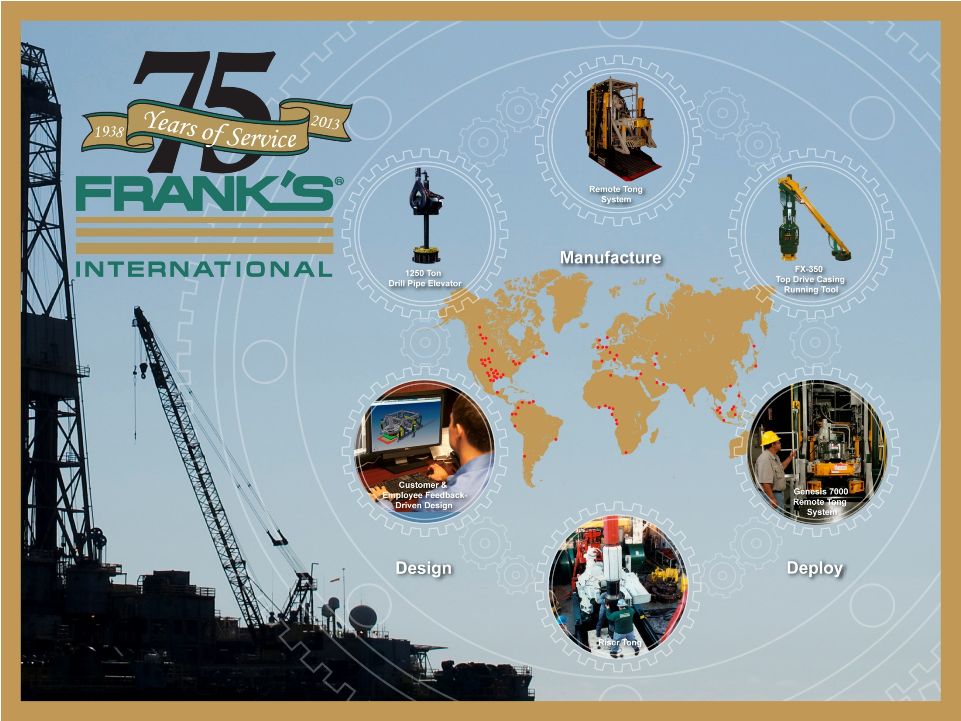
 Frank’s: A Leading Global Provider of Tubular Services
Tubular Services Critical to Drilling
and Completion
Frank’s is a Market Leader
Frank’s Financial Results
Demonstrate Value
$3.3
bn
market
growing
at
~13%
/
year
(1)
Key to successful and safe well completion
Requires specialized equipment and
capabilities
–
especially
offshore
Minimizes costly rig time when performed
efficiently and properly
#1 or #2 market share in all major oil and gas
markets
(1)
69% of revenue generated offshore
Proprietary
equipment
–
104
patents
granted
and 37 currently pending (U.S.)
Global footprint with blue chip customer base
Reputation earned over eight decades
$1,056
mm
of
revenue
in
2012
(3)
$447
mm
of
2012
Adjusted
EBITDA
(2)
–
42%
Adjusted
EBITDA
margin
(2)
Less than $1mm debt
1% annualized dividend yield
3
1)
“Casing & Tubing Running Market”
analysis prepared by Spears & Associates, May 2013.
2)
Adjusted EBITDA is a non-GAAP financial measure. See reconciliation of net
income to adjusted EBITDA included in the appendix. 3)
Not Adjusted for Discontinued Operations.
Frank’s Unique Set of Capabilities
Focused Provider of Tubular Services
Innovate Well Solutions
Deeper Wells/Deeper Water Depth
Hostile Environments
Remote Geographies |
 Strong Position in Deep Water Markets
Frank’s Offshore Exposure (% of Total Revenue)
Typical Industry Casing Costs per Well
(2)
Frank’s Offshore Exposure By Segment
(3)
1)
Per IHS.
2)
“Casing & Tubing Running Market”
analysis prepared by Spears & Associates, May 2013.
3)
2012 revenue by segment.
Opportunity for continued growth in offshore drilling with more than 60% of
deep water reserves currently
in
appraisal,
developing
or
discovery
status
(1)
$467 mm
International Services
$423 mm
U.S. Services
$166 mm
Pipe and Products
4 |
 Focused Provider of Tubular Services
Structural String
Conductor String
Surface Casing
Intermediate Casing
Liner Strings
Production Liner
and Tie Back
String
7”
x 9 7/8”
@ 19,000’
Rig Floor 75’
36”
@ 5,000’
28”
@ 6,000’
22”
@ 8,000’
18”
@ 9,000’
16”
@ 12,000’
13 5/8”
@ 13,000’
11 7/8”
@ 17,000’
9 7/8”
@ 18,000’
Proper
well
construction
helps
ensure
well
integrity,
safety
and
productivity
5
Onshore Well
Offshore Well |
 Cobra –
Completion
Control Line
Manipulating System
Solutions –
Frank’s Proprietary Tools
Fluid Grip
Automated Tong
1250 Ton Landing
String Handling
Tools
Clamp
Type
Elevator
Specialized Tools Provide Unique Solutions
Over 100 patents issued and 37 patents pending
Automated Tong
Cassette System
FX-350 Top Drive
Casing Running
Tool
Challenge
Onshore
Offshore
Horizontal drilling
Longer laterals
Automated rigs
Deeper water
Deeper wells
Very heavy casing and
landing strings
Dual mast rigs,
automated rig floor
Corrosion-resistant
alloy tubulars
Downhole instruments
and valves with control
cables
6 |
 Deepest Completed Well
Casing and landing string
installation for the Chevron
Northwood well in the U.S.
Gulf of Mexico, to a total depth
of 31,866 feet in a water depth
of 6,000 feet (2013)
7 |
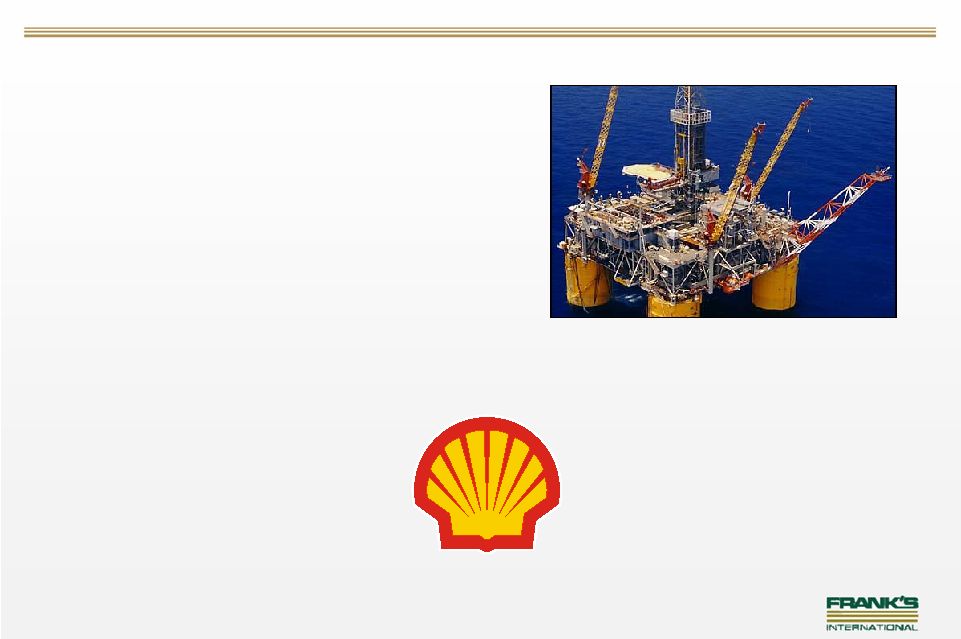 Greatest Hook Load
Broke our own record for
greatest hook load recorded at
1,140 tons while lifting 24,500
feet of combined casing and
landing string for Shell’s
Stones development in the
U.S. Gulf of Mexico (2012)
8 |
 Hostile Environment
Selected for BP’s Shah Deniz
Project, an ongoing multiple
well project offshore of
Azerbaijan due to its ability to
provide “zero marking”
handling of corrosion-resistant
alloy tubulars (2006 –
present)
9 |
 Well Integrity
Provided all tubular services
for the relief well drilled by BP
to contain the Macondo well in
the U.S. Gulf of Mexico (2010)
10 |
 Outline
11
FI Overview
Industry Update –
Rig Counts
FI Business Segments
Services
US Land
Offshore (US and International)
Tubular Sales
Financial Update |
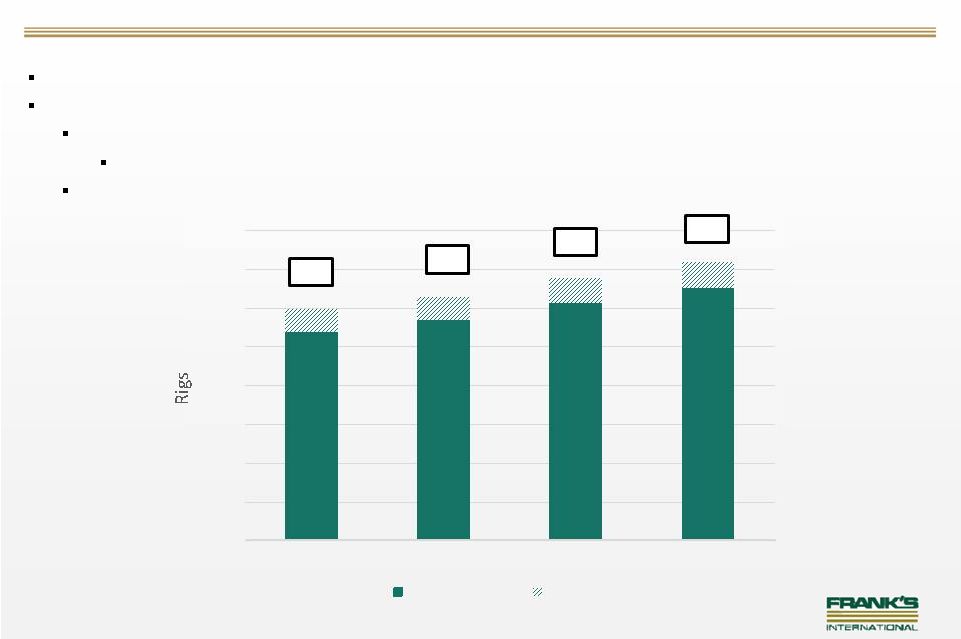 Worldwide Offshore Rig Count Continues to Increase
Total Semi-Submersible and Drillship count increasing 8% in 2014
Anticipated Newbuilds
2014 –
27 Drillships and 6 Semi-Submersibles
Gulf
of
Mexico
rig
activity
increasing
with
8
newbuilds
–
all
Drillships
2015 –
17 Drillships and 7 Semi-Submersibles
12
Source: ISI, RigLogix
Note:
Rig
count
is
average
for
4 quarter
th
270
285
307
326
29
30
32
34
0
50
100
150
200
250
300
350
400
2012
2013
2014e
2015e
Contracted
Not Contracted
299
315
339
360 |
 US Land Rig Count Decreasing
13
Overall US Land rig count has decreased with a decline in gas rigs
Horizontal drilling has steadily increase from 2011 to 2013, averaging 62.4% of
rigs Overall well count has remained flat at 9,175 for 3Q13
Source: Baker Hughes IR |
 Outline
14
FI Overview
Industry Update –
Rig Counts
FI Business Segments
Services
US Land
Offshore (US and International)
Tubular Sales
Financial Update |
 US Land Segment
15
Competitive environment -
Increased pricing pressure
Recent revenue decline –
focused on maintaining
margins
More complex well
architecture in oil basins
creates opportunity for FI
FI has ability to relocate
crews and equipment to
areas of demand |
 Offshore (Gulf of Mexico and International)
16
Increasing deep and ultra-deep
rig count
Deep and Ultra-Deep water
drilling increases well
complexity
FI has high market share in deep
and ultra-deep water
Opportunity for FI to growth
geographically
YTD Revenue growth in US
Offshore and International
markets |
 Tubular Sales Segment (Formerly Pipe & Products)
17
Specialize in large OD pipe for
conductor casing and TLP
tendons
Manufacture a range of
connectors for large OD pipe
(20”–36”+)
80 acre Port of Iberia facility |
 Global Footprint Provides Access to Attractive Markets
Frank’s U.S. Operations
Frank’s International
Operations
18
Over 90 sales and support offices in 60 countries
Operations in nearly all major markets |
 Outline
19
FI Overview
Industry Update –
Rig Counts
FI Business Segments
Services
US Land
Offshore (US and International)
Tubular Sales
Financial Update |
 Financial & Investment Highlights
Attractive End-Markets Driven by Continued Oil & Gas Exploration
and Development
Global Market Leader
Focused Service Provider with Unique Engineering Capabilities
and Favorable Reputation
Strong Position in Deep Water Offshore Markets
Historically Maintenance CapEx has averaged 5-7% of revenue
Strong Free Cash Flow Generation Supports Dividend
20 |
   3 Quarter and YTD Highlights
Growth in US Offshore offset by decline in US Land
$8 million in bad debt expense relating to Latin America
$40 million YTD increase in Tubular Sales deferred revenue
21
Sep 30,
Sep 30,
2013
Q/Q
Y/Y
2013
Y/Y
Revenue from External Customers
International Services
121,680
$
0.7%
5.0%
353,041
$
4.0%
U.S. Services
108,126
-6.5%
-3.7%
321,295
1.8%
Tubular Sales
40,296
-28.7%
5.3%
121,314
11.1%
Total
270,102
$
-7.8%
1.4%
795,650
$
4.1%
Segment Adjusted EBITDA:
International Services
48,752
$
-10.4%
-12.9%
153,134
$
-7.7%
U.S. Services
47,215
-20.6%
-17.4%
149,494
0.2%
Tubular Sales
5,338
-62.0%
116.6%
25,893
61.3%
Corporate and other
(33)
-
-
3
-
Total
101,272
$
-21.0%
-12.4%
328,524
$
-0.8%
EBITDA margin
International Services
40.1%
43.4%
U.S. Services
43.7%
46.5%
Tubular Sales
13.2%
21.3%
Total
37.5%
41.3%
Three Months Ended
Nine Months Ended
rd |
 Increasing Well Complexity Driving Financial Results
Numerous Domestic Acquisitions
Accelerated International Expansion
Financial Crisis / GOM
Moratorium
Increasing Well Complexity
1)
Adjusted EBITDA is a non-GAAP financial measure. See reconciliation of net
income to adjusted EBITDA included in the appendix. 2)
Not Adjusted for Discontinued Operations.
22 |
 $1,510
$1,425
$1,340
$1,243
$1,075
$875
$3,050
$2,800
$2,475
$2,074
$1,725
$1,600
$4,560
$4,225
$3,815
$2,800
$2,475
$3,317
$0
$1,000
$2,000
$3,000
$4,000
$5,000
2010
2011
2012
2013E
2014E
2015E
Onshore
Offshore
$2,175
$2,025
$1,765
$1,600
$1,275
$1,050
$2,385
$2,200
$2,050
$1,717
$1,525
$1,425
$4,560
$4,225
$3,815
$2,800
$2,475
$3,317
$0
$1,000
$2,000
$3,000
$4,000
$5,000
2010
2011
2012
2013E
2014E
2015E
North America
International
Tubular Services: A Growing Market Worldwide
Source: “Casing & Tubing Running Market”
analysis prepared by Spears & Associates, May 2013.
Tubular Services Market By Geography
Tubular Services Market by Location
23
($mm)
($mm) |
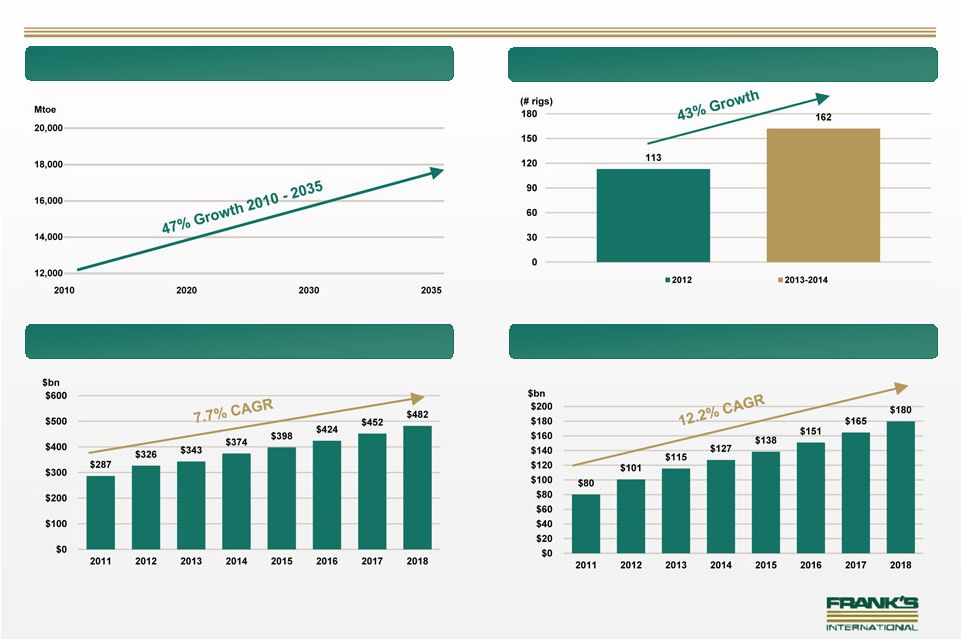 Attractive End Markets Driven by Energy Growth and Development
Projected Global Energy Demand
Global Offshore Equipment & Service Market
Source: IEA Energy Outlook 2012.
DW Rigs -
5 Largest Offshore Drillers
Global Oilfield Equipment & Service Market
Source:
“Casing
&
Tubing
Running
Market”
analysis
prepared
by
Spears & Associates, May 2013.
Source:
“Casing
&
Tubing
Running
Market”
analysis
prepared
by
Spears & Associates, May 2013.
Source:
“Casing
&
Tubing
Running
Market”
analysis
prepared
by
Spears & Associates, May 2013.
24 |
 Questions?
25 |