Attached files
| file | filename |
|---|---|
| 8-K - CHINA FUND INC | fp0008752_8k.htm |
|
Oct 31, 2013
|
Monthly Insight
The China Fund, Inc. (CHN)
|
|
Investment Objective
|
The investment objective of the Fund is to achieve long term capital appreciation. The Fund seeks to achieve its objective through investment in the equity securities of companies and other entities with significant assets, investments, production activities, trading or other business interests in China or which derive a significant part of their revenue from China.
The Fund has an operating policy that the Fund will invest at least 80% of its assets in China companies. For this purpose, ‘China companies’ are (i) companies for which the principal securities trading market is in China; (ii) companies for which the principal securities trading market is outside of China or in companies organized outside of China, that in both cases derive at least 50% of their revenues from goods or services sold or produced, or have a least 50% of their assets in China; or (iii) companies organized in China. Under the policy, China means the People’s Republic of China, including Hong Kong, and Taiwan. The Fund will provide its stockholders with at least 60 days’ prior notice of any change to this policy.
|
Performance Overview
|
|
Performance History
|
1 month
|
3 months
|
YTD
|
1 Year
|
3 Years
|
5 Years
|
10 Years
|
Since
|
|
(p.a.)
|
(p.a.)
|
(p.a.)
|
Inception
|
|
NAV (%)
|
4.16
|
8.51
|
14.13
|
21.38
|
2.08
|
18.37
|
13.98
|
11.00
|
|
Market price (%)
|
4.38
|
10.43
|
5.84
|
19.67
|
-1.23
|
17.44
|
9.70
|
9.91
|
|
Benchmark (%)
|
2.95
|
8.61
|
6.34
|
13.27
|
3.14
|
16.35
|
9.80
|
N/A
|
|
Performance History
|
2012
|
2011
|
2010
|
2009
|
2008
|
2007
|
2006
|
2005
|
|
NAV (%)
|
12.07
|
-24.37
|
27.25
|
72.82
|
-46.95
|
86.20
|
57.10
|
6.09
|
|
Market price (%)
|
20.46
|
-27.51
|
23.60
|
72.19
|
-40.65
|
50.24
|
65.67
|
-21.51
|
|
Benchmark (%)
|
22.65
|
-18.36
|
13.60
|
67.12
|
-49.37
|
37.97
|
39.50
|
10.27
|
Source: State Street Bank and Trust Company. Source for index data: MSCI as at Oct 31, 2013.
|
Portfolio Analysis
|
|
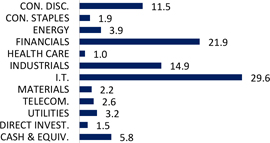
Sector allocation (%)
|
Country allocation (%)
|
 |
 |
|
Source: State Street Bank and Trust Company as at Oct 31, 2013.
|
* China includes A-shares (5.3%), A-share equity linked securities (7.2%), B-shares (0.0%), H-shares (11.9%) and Red-chips (16.0%).
|

The China Fund, Inc. (CHN)
|
Portfolio Analysis (continued)
|
|
Top 10 Holdings
|
Sector
|
%
|
|
CHINA EVERBRIGHT INTERNATIONAL, LTD.
|
INDUSTRIALS
|
6.1
|
|
TAIWAN SEMICONDUCTOR MANUFACTURING CO., LTD.
|
I.T.
|
5.9
|
|
HAND ENTERPRISE SOLUTIONS CO., LTD.
|
I.T.
|
5.3
|
|
INDUSTRIAL & COMMERCIAL BANK OF CHINA
|
FINANCIALS
|
4.2
|
|
SUN HUNG KAI PROPERTIES, LTD.
|
FINANCIALS
|
4.1
|
|
CNOOC, LTD.
|
ENERGY
|
3.6
|
|
TENCENT HOLDINGS, LTD.
|
I.T.
|
3.5
|
|
ENN ENERGY HOLDINGS, LTD.
|
UTILITIES
|
3.2
|
|
CHINA MOBILE, LTD.
|
TELECOM
|
2.6
|
|
RUENTEX DEVELOPMENT CO., LTD.
|
FINANCIALS
|
2.6
|
|
Total
|
41.1
|
|
|
Direct Investments
|
Sector
|
%
|
|
GOLDEN MEDITECH HOLDINGS, LTD. 15.0%, 11/16/13
|
OTHERS
|
1.5
|
|
Total
|
1.5
|
Source: State Street Bank and Trust Company as at Oct 31, 2013.
|
Fund Details
|
|
NAV
|
$25.77
|
|
Market price
|
$22.66
|
|
Premium/Discount
|
-12.07%
|
|
Market cap
|
US$355.35m
|
|
Shares outstanding
|
15,682,029
|
|
Exchange listed
|
NYSE
|
|
Listing date
|
July 10, 1992
|
|
Benchmark
|
MSCI Golden Dragon Index (Total Return)
|
|
Fund Manager
|
Christina Chung
|
|
Listed and direct investment manager
|
RCM Asia Pacific Limited
|
Source: State Street Bank and Trust Company as at Oct 31, 2013.
|
Distribution History (10 years)
|
|
Declaration
date |
Ex-dividend
date
|
Record
date |
Payable
date |
Dividend/
Share |
Income
|
Long-term Capital
|
Short-term Capital
|
|
10 Dec 2012
|
20 Dec 2012
|
24 Dec 2012
|
28 Dec 2012
|
3.2517
|
0.3473
|
2.9044
|
0.0000
|
|
8 Dec 2011
|
21 Dec 2011
|
23 Dec 2011
|
29 Dec 2011
|
2.9964
|
0.1742
|
2.8222
|
0.0000
|
|
8 Dec 2010
|
21 Dec 2010
|
24 Dec 2010
|
29 Dec 2010
|
2.2742
|
0.3746
|
1.8996
|
0.0000
|
|
9 Dec 2009
|
22 Dec 2009
|
24 Dec 2009
|
29 Dec 2009
|
0.2557
|
0.2557
|
0.0000
|
0.0000
|
|
8 Dec 2008
|
22 Dec 2008
|
24 Dec 2008
|
23 Jan 2009
|
5.8174
|
0.4813
|
5.3361
|
0.0000
|
|
7 Dec 2007
|
19 Dec 2007
|
21 Dec 2007
|
25 Jan 2008
|
12.1200
|
0.2800
|
9.0000
|
2.8400
|
|
8 Dec 2006
|
19 Dec 2006
|
21 Dec 2006
|
29 Dec 2006
|
4.0117
|
0.2996
|
2.7309
|
0.9812
|
|
9 Dec 2005
|
19 Dec 2005
|
21 Dec 2005
|
29 Dec 2005
|
2.5119
|
0.2172
|
2.2947
|
0.0000
|
|
13 Dec 2004
|
20 Dec 2004
|
22 Dec 2004
|
7 Jan 2005
|
3.5701
|
0.1963
|
3.2664
|
0.1074
|
|
19 Dec 2003
|
29 Dec 2003
|
31 Dec 2003
|
15 Jan 2004
|
1.7800
|
0.0700
|
0.6700
|
1.0400
|
Source : State Street Bank and Trust Company as at December 31, 2012. Dividend/Share includes Income, Long-term Capital gains and Short-term Capital gains.
2
The China Fund, Inc. (CHN)
The China Fund Inc. NAV Performance of USD $10,000 since inception (with dividends reinvested at NAV price)
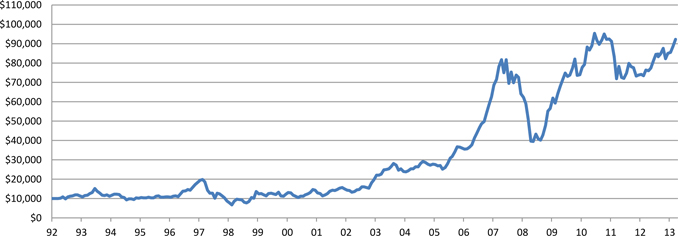
Past performance is not a guide to future returns.
Source: State Street Bank and Trust Company as at Oct 31, 2013.
The China Fund Inc. Premium / Discount
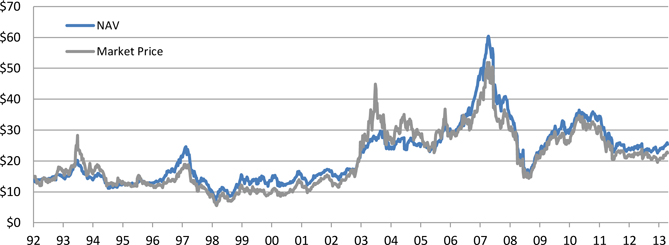
Past performance is not a guide to future returns.
Source: State Street Bank and Trust Company as at Oct 31, 2013.
3
The China Fund, Inc. (CHN)
Manager’s Commentary
Market Review
In October, the Hong Kong equity market consolidated and remained in its trading range despite news flow regarding the official establishment of the Shanghai Free Trade Zone. The US government shutdown and discussions about Janet Yellen being the next Federal Reserve Chairman soon took center stage, adding uncertainty that flowed through to the Hong Kong and China markets. As a resolution was finally reached regarding the debt ceiling and tapering was delayed, earnings season kicked off and investors turned their focus back to company specific stories. In general, China’s macroeconomic numbers for the month did not change much and the pace of the economy remained steady. The third quarter earnings results were broadly in line with consensus, but fewer companies posted earnings upgrades than expected. The inter-bank market was a bit tight at one stage but liquidity concerns eased after the People’s Bank of China resumed its reverse repo program on Oct 29.
Towards month-end, investors started rotating out of stocks that had outperformed for the year such as Macau and internet names, and switching into stocks expected to benefit from reform themes as the Third Plenary session of the 18th Central Committee came into the spotlight. In the banking space, while the bid price for Chong Hing Bank was in line with market expectations, the deal structure – comprising a partial offer (for 75% of the bank) rather than the anticipated full takeover disappointed the market, triggering profit taking in other banking takeover targets.
Taiwan’s GDP growth slowed to 1.6% year-on-year for the third quarter of 2013 compared to 2.5% year-on-year for the second quarter, lower than the consensus. The market shifted its focus to the technology sector, especially suppliers of Apple’s new products including the iPad Air and iPad mini 2.
Fund Review
The Fund outperformed the benchmark in October, which was mainly attributable to stock selection. Stock picking in the industrials sector and the underweight to telecom services helped the Fund’s relative performance the most, whereas stock selection in financials and materials hurt the most.
The top contributor for the month was China Everbright International. Although there was no specific news flow on the company, the market focused back to the environmental theme related plays as the Third Plenary session of the 18th Central Committee drew closer. Another top contributor was Gree Electrical. The share price was supported by the resilient third quarter earnings result and strong order flows. On the other hand, the top active detractor was Hand Enterprise. The share price consolidated after strong year-to-date performance.
Outlook
Expectations for reform initiatives will continue to underpin Chinese equities in the short term. As most of the areas of potential reforms have been well anticipated by the market, any upside surprises will have to come from detailed and broad based policies in these reform areas. In particular, the market will react positively to any policy initiatives in reforming the state-owned enterprise sector as well as fostering the development of private enterprises.
In Taiwan, we maintain our view that the second half of the year will be better, but we have lowered our expectations on the strength and pace of the recovery due to weaker than expected domestic consumption and exports. However, Taiwan should still be a major beneficiary of the expected recovery of the US and European economies.
Source : RCM Asia Pacific Limited as at October 31, 2013.
4
The China Fund, Inc. (CHN)
Portfolio Holdings
|
CUSIP
|
Security Description
|
Cost Base
|
Base MV
|
Shares
|
Percentage of
Net Assets
|
|
663094902
|
China Everbright International, Ltd.
|
11,203,641
|
24,677,288
|
24,687,000
|
6.1
|
|
688910900
|
Taiwan Semiconductor Manufacturing Co., Ltd.
|
17,081,578
|
23,711,738
|
6,362,000
|
5.9
|
|
B3VN92906
|
HAND Enterprise Solutions Co., Ltd.
|
1,592,681
|
21,565,204
|
8,484,773
|
5.3
|
|
B1G1QD902
|
Industrial & Commercial Bank of China
|
16,829,555
|
17,050,554
|
24,390,000
|
4.2
|
|
685992000
|
Sun Hung Kai Properties, Ltd.
|
17,289,798
|
16,596,900
|
1,269,000
|
4.1
|
|
B00G0S903
|
CNOOC, Ltd.
|
14,516,684
|
14,435,898
|
7,048,000
|
3.6
|
|
B01CT3905
|
Tencent Holdings, Ltd.
|
7,312,795
|
14,313,482
|
262,100
|
3.5
|
|
633393905
|
Enn Energy Holdings, Ltd.
|
606,420
|
12,991,378
|
2,204,000
|
3.2
|
|
607355906
|
China Mobile, Ltd.
|
10,406,102
|
10,598,835
|
1,009,500
|
2.6
|
|
674842901
|
Ruentex Development Co., Ltd.
|
4,180,803
|
10,328,123
|
4,933,904
|
2.6
|
|
644806002
|
Hutchison Whampoa, Ltd.
|
8,096,189
|
9,626,295
|
773,000
|
2.4
|
|
635186901
|
Digital China Holdings, Ltd.
|
13,205,899
|
9,546,075
|
7,256,000
|
2.4
|
|
17313A533
|
Gree Electric Appliances, Inc. Access Product (expiration 01/17/14)
|
6,453,442
|
9,218,470
|
1,838,546
|
2.3
|
|
671815900
|
Qingling Motors Co., Ltd.
|
8,718,221
|
8,890,024
|
28,960,000
|
2.2
|
|
B3WH02907
|
Hermes Microvision, Inc.
|
7,867,215
|
8,798,958
|
269,000
|
2.2
|
|
658444906
|
Merida Industry Co., Ltd.
|
6,624,016
|
8,546,708
|
1,126,000
|
2.1
|
|
913BMZ902
|
Ping An Insurance (Group) Company of China, Ltd. Access Product (expiration 06/30/15)
|
9,494,979
|
8,500,199
|
1,418,047
|
2.1
|
|
626073902
|
Delta Electronics, Inc.
|
4,550,608
|
8,382,971
|
1,615,000
|
2.1
|
|
B15456906
|
Bank of China, Ltd.
|
8,369,492
|
8,343,354
|
17,771,000
|
2.1
|
|
620267906
|
Advantech Co., Ltd.
|
4,104,778
|
8,238,193
|
1,284,000
|
2.0
|
|
B2R2ZC908
|
CSR Corp., Ltd.
|
7,466,211
|
8,222,648
|
9,930,000
|
2.0
|
|
637248907
|
MediaTek, Inc.
|
6,194,126
|
7,648,803
|
559,000
|
1.9
|
|
608169900
|
Beijing Enterprises Holdings, Ltd.
|
6,527,292
|
7,590,545
|
927,500
|
1.9
|
|
619376908
|
China Resources Land, Ltd.
|
5,128,719
|
7,395,451
|
2,554,000
|
1.8
|
|
608232906
|
Taiwan Life Insurance Co., Ltd.
|
4,955,245
|
7,165,134
|
8,065,443
|
1.8
|
|
644094906
|
Taiwan FamilyMart Co., Ltd.
|
871,903
|
6,522,382
|
1,197,652
|
1.6
|
|
B1L8PB906
|
Tong Hsing Electronic Industries, Ltd.
|
5,127,409
|
6,367,246
|
1,203,000
|
1.6
|
|
923HKD007
|
Golden Meditech Holdings, Ltd. (acquired 11/16/12) 1.0%, 12/20/13
|
7,509,916
|
6,007,700
|
58,222,500
|
1.5
|
|
626735906
|
Hong Kong Exchanges and Clearing, Ltd.
|
4,947,274
|
4,953,464
|
306,500
|
1.2
|
|
B236JB905
|
Tiangong International Co., Ltd.
|
5,449,043
|
4,743,320
|
18,480,000
|
1.2
|
|
613623909
|
Hengan International Group Co., Ltd.
|
3,889,897
|
4,601,092
|
375,500
|
1.1
|
|
B633D9904
|
Zhongsheng Group Holdings, Ltd.
|
3,466,065
|
4,243,791
|
2,662,000
|
1.1
|
|
643055908
|
Golden Meditech Holdings, Ltd.
|
4,555,715
|
4,203,146
|
35,040,000
|
1.0
|
|
B57JY2909
|
China Minsheng Banking Corp., Ltd.
|
3,689,595
|
4,160,030
|
3,628,000
|
1.0
|
|
633521901
|
Taiwan Hon Chuan Enterprise Co., Ltd.
|
4,732,446
|
4,018,040
|
1,904,000
|
1.0
|
|
645166901
|
Largan Precision Co., Ltd.
|
3,937,557
|
4,016,406
|
118,000
|
1.0
|
|
17313X574
|
China State Construction Engineering Corp., Ltd. (expiration 01/17/14)
|
4,674,320
|
3,960,790
|
7,375,772
|
1.0
|
|
B16NHT900
|
Shui On Land, Ltd.
|
4,155,622
|
3,835,819
|
11,055,500
|
0.9
|
|
628625907
|
Li & Fung, Ltd.
|
3,939,103
|
3,666,583
|
2,608,000
|
0.9
|
|
665157905
|
Comba Telecom Systems Holdings, Ltd.
|
7,565,579
|
3,604,282
|
10,958,500
|
0.9
|
|
B6VG8G904
|
Asian Pay Television Trust
|
4,074,574
|
3,311,968
|
5,200,000
|
0.8
|
|
643280902
|
Chipbond Technology Corp.
|
3,350,697
|
3,287,476
|
1,626,000
|
0.8
|
|
651795908
|
Natural Beauty Bio-Technology, Ltd.
|
4,906,910
|
3,076,854
|
47,710,000
|
0.8
|
|
993HWH901
|
Daqin Railway Co., Ltd. Access Product (expiration
11/02/16)
|
2,786,924
|
2,935,552
|
2,449,968
|
0.7
|
|
972ZGS900
|
Gree Electric Appliances, Inc. Access Product (expiration 10/14/13)
|
1,898,593
|
2,157,268
|
430,249
|
0.5
|
|
ACI009HH0
|
China Suntien Green Energy Corp., Ltd.
|
1,109,537
|
1,304,133
|
3,731,000
|
0.3
|
|
B1B25Q909
|
Daqin Railway Co., Ltd. Access Product (expiration 01/20/15)
|
1,246,037
|
1,282,199
|
1,070,283
|
0.3
|
|
BD04NT905
|
Integrated Waste Solutions Group Holdings, Ltd.
|
7,974,083
|
1,119,908
|
25,314,000
|
0.3
|
|
972ZHB906
|
China State Construction Engineering Corp., Ltd. (expiration 07/28/14)
|
886,370
|
835,799
|
1,555,844
|
0.3
|
|
ACI0090H8
|
Zong Su Foods (acquired 09/21/10)
|
15,000,034
|
-
|
2,677
|
0.0
|
Source: State Street Bank and Trust Company as at Oct 31, 2013.
5
The China Fund, Inc. (CHN)
The information contained herein has been obtained from sources believed to be reliable but RCM (an Allianz Global Investors company) and its affiliates do not warrant the information to be accurate, complete or reliable. The opinions expressed herein are subject to change at any time and without notice. Past performance is not indicative of future results. This material is not intended as an offer or solicitation for the purchase or sale of any financial instrument. Investors should consider the investment objectives, risks, charges and expenses of any mutual fund carefully before investing. This and other information is contained in the fund’s annual and semiannual reports, proxy statement and other fund information, which may be obtained by contacting your financial advisor or visiting the fund’s website at www.chinafundinc.com. This information is unaudited and is intended for informational purposes only. It is presented only to provide information on investment strategies and opportunities. The Fund seeks to achieve its objective through investment in the equity securities of companies and other entities with significant assets, investments, production activities, trading or other business interests in China or which derive a significant part of their revenue from China. Investing in non-U.S. securities entails additional risks, including political and economic risk and the risk of currency fluctuations, as well as lower liquidity. These risks, which can result in greater price volatility, will generally be enhanced in less diversified funds that concentrate investments in a particular geographic region. The Fund is a closed-end exchange traded management investment company. This material is presented only to provide information and is not intended for trading purposes. Closed-end funds, unlike open-end funds, are not continuously offered. After the initial public offering, shares are sold on the open market through a stock exchange, where shares may trade at a premium or a discount. Holdings are subject to change daily.