Attached files
| file | filename |
|---|---|
| 8-K - 8-K - Western Asset Mortgage Capital Corp | a13-24710_18k.htm |
Exhibit 99.1
|
|
Credit Suisse Mortgage REIT and Servicer Conference November 20, 2013 |
|
|
Safe Harbor Statement We make forward-looking statements in this presentation that are subject to risks and uncertainties. These forward-looking statements include information about possible or assumed future results of our business, financial condition, liquidity, results of operations, plans and objectives. When we use the words "believe," "expect," "anticipate," "estimate," "plan," "continue," "intend," "should," "may" or similar expressions, we intend to identify forward-looking statements. Statements regarding the following subjects, among others, may be forward-looking: our business and investment strategy; our projected operating results; our ability to obtain financing arrangements; financing and advance rates for Agency MBS and our target assets; our expected leverage; general volatility of the securities markets in which we invest and the market price of our common stock; our expected investments; interest rate mismatches between Agency MBS and our target assets and our borrowings used to fund such investments; changes in interest rates and the market value of Agency MBS and our target assets; changes in prepayment rates on Agency MBS and Non-Agency MBS; effects of hedging instruments on Agency MBS and our target assets; rates of default or decreased recovery rates on Agency MBS and our target assets; the degree to which any hedging strategies may or may not protect us from interest rate volatility; impact of and changes in governmental regulations, tax law and rates, accounting guidance and similar matters; our ability to maintain our qualification as a REIT; our ability to maintain our exemption from registration under the Investment Company Act of 1940, as amended; availability of investment opportunities in mortgage-related, real estate-related and other securities; availability of qualified personnel; estimates relating to our ability to make distributions to our stockholders in the future; our understanding of our competition; and market trends in our industry, interest rates, real estate values, the debt securities markets or the general economy. The forward-looking statements in this presentation are based on our beliefs, assumptions and expectations of our future performance, taking into account all information currently available to us. You should not place undue reliance on these forward-looking statements. These beliefs, assumptions and expectations can change as a result of many possible events or factors, not all of which are known to us. Some of these factors are described in our filings with the SEC under the headings "Summary," "Risk factors," "Management's discussion and analysis of financial condition and results of operations" and "Business." If a change occurs, our business, financial condition, liquidity and results of operations may vary materially from those expressed in our forward-looking statements. Any forward-looking statement speaks only as of the date on which it is made. New risks and uncertainties arise over time, and it is not possible for us to predict those events or how they may affect us. Except as required by law, we are not obligated to, and do not intend to, update or revise any forward-looking statements, whether as a result of new information, future events or otherwise. This presentation is not an offer to sell securities nor a solicitation of an offer to buy securities in any jurisdiction where the offer and sale is not permitted. 1 |
|
|
Overview of Western Asset Mortgage Capital Corporation WMC is a public mortgage REIT that primarily invests in Agency MBS, but also invests in Non-Agency MBS and other mortgage related assets One of the largest U.S. fixed income asset managers with AUM of $443 billion(1) Structured Product AUM of $55 billion including Agency RMBS of $34 billion(1) Global reach with offices in Pasadena, New York, London, Tokyo, Sao Paulo, Melbourne, Dubai, Singapore and Hong Kong Senior investment team members have over 18 years investment experience on average Extensive mortgage investing track record Manager Mortgage REIT launched in May 2012 to capture attractive current and long-term investment opportunities in the Agency residential mortgage market Also invests in Non-Agency RMBS and Agency and Non-Agency CMBS $3.6 billion investment portfolio as of September 30, 2013 (NYSE: WMC) 1 As of 9/30/2013 2 |
|
|
Executive Management Team Gavin L. James President, Chief Executive Officer 3 Travis M. Carr Chief Operating Officer 20 Years Investment Experience Western Asset Management Company (2000-Present) Product Specialist Head of mortgage-related business efforts Pacific Investment Management Company (1997-2000) Senior Associate Royal Thrift & Loan Company (1994-1997) Secondary Market Analyst Home State Financial Corp.(1993-1994) Mortgage Broker University of California, Los Angeles, B.A. Chartered Financial Analyst 32 Years Investment Experience Western Asset Management Company (1998-Present) Director of Global Portfolio Operations Member of Global Strategy Committee J.P. Morgan Investment Management (1990-1998) Senior Portfolio Manager Mellon Bank (1987-1990) Head of Fixed Income Sales & Trading Drexel Burnham Lambert (1981-1987) Cross Markets Trader Kingston College, London, B.A. Steven M. Sherwyn Chief Financial Officer and Treasurer 26 Years Investment Experience Western Asset Mortgage Capital Corporation (2012-Present) Chief Financial Officer and Treasurer Care Investment Trust, Inc. (2010-2012) Chief Financial Officer and Treasurer Western Asset Management Corp. (2009) Consultant Galiot Capital Corporation (2008-2009) Chief Financial Officer Quadra Realty Trust (2007-2008) Chief Financial Officer and Treasurer Hypo Real Estate (2004-2008) Managing Director New York University Law School, L.L.M. in Taxation Stanford University Law School, J.D. Wharton School, University of Pennsylvania, B.S. |
|
|
Investment Management Team 16 Years Investment Experience Western Asset Management Company (2013-Present) Head of MBS/ABS Member of U.S. Broad Markets Committee Stark Investments (2007-2013) Portfolio Manager and Head of Consumer Credit Invesco Fixed Income (2003-2007) Senior Manager, Head of Credit and Research Prudential Insurance/Questech Financial (2001-2002) Principal, Senior Vice President, Capital Markets Copelco Capital, Inc./Citicorp Vendor Finance, Inc. (1998-2001) Managing Director, Structured Finance Moody's Investor Service (1997-1998) Assistant Vice President, Credit Analyst Temple University, M.B.A. Finance Indian Institute of Technology, B. Tech. Anup Agarwal Chief Investment Officer 4 Bonnie M. Wongtrakool, CFA Portfolio Manager 14 Years Investment Experience Western Asset Management Company (2003-Present) Portfolio Manager, Agency RMBS Mercer Management Consulting (2000-2003) Associate Lehman Brothers (1999) Summer Associate Orion Partners, LP (1996-1997) Associate Donaldson, Lufkin & Jenrette Securities Corp. (1994-1996) Analyst Harvard Law School, J.D., graduated magna cum laude Harvard College, A.B., graduated magna cum laude Chartered Financial Analyst Sean O. Johnson, CFA Portfolio Manager 24 Years Investment Experience Western Asset Management Company (1995-Present) Portfolio Manager, Agency RMBS Pacific Investment Management Company (1993-1995) Research Analyst, Fixed Income Wilshire Associates (1989-1993) Supervisor, Investment Performance University of Southern California, B.S. Chartered Financial Analyst |
|
|
Western Asset’s REIT Team – Deep & Proven Additional Structured Product Resources 10 members* 24 years 5 5 members* 13 years 10 members* 11 years 11 members* 24 years 4 members* 14 years 35+ Years of MBS Experience and Innovation 1974 First investment in Agency RMBS 1991 Began investing in CMBS 1991 Invested in Resolution Trust Corporation (RTC) programs 2004 Created Super Senior Option ARM 1970 1985 1990 1995 2000 2005 2010 1987 Began investing in Non-Agency RMBS 1990 Began investing in ABS Anup Agarwal Chief Investment Officer Investment Oversight Committee Liquidity Structured Products Agency MBS Derivatives 2009 Initial closing of PPIP Includes senior members of the investment manager team * represents team members / years of average experience 2012 WMC Launched Deep Global Infrastructure 889 staff across all functions 126 investment professionals Future opportunities |
|
|
Key Highlights Third Quarter 2013 Generated net income of $7.5 million, or $0.31 per share Generated core earnings of $20.1 million, or $0.83 per share Regular dividend of $0.90 per share Generated positive economic return on book value of 1.8% Since IPO Generated GAAP net income of $8.7 million Generated core earnings of $102.2 million, or $5.03 per share Generated an annualized economic return on book value of approximately 9.6%, comprised of: $5.10 per share in dividends $3.19 per share decrease in book value 6 (1) Core earnings is a non-GAAP measure defined as net income excluding: (i) net realized gain (loss) on investments and derivative contracts; (ii) net unrealized gain (loss) on investments; (iii) loss resulting from mark-to-market adjustments on derivative contracts; (iv) other loss on RMBS; (v) non-cash stock-based compensation expense; and (vi) one-time events pursuant to changes in GAAP and certain other non-cash charges. (2) Economic return, for any period, is calculated by taking the sum of (i) the total dividends declared and (ii) the change in net book value during the period and dividing by the beginning book value. (3) Dividend return includes all dividends declared during the period from May 15, 2012, the date of WMC’s commencement of initial operations, through September 30, 2013. (1) (2) (1) (3) |

|
|
Third Quarter 2013 Financial Results GAAP Net Income of $7.5 million, or $0.31 per share Core Net Income of $20.1 million, or $0.83 per share Net Interest Income of $23.4 million, including interest from IO securities, linked transactions and taking into account the full cost of hedging Net interest spread of 2.28%, including IO securities and fully hedged cost of financing 3.42% adjusted gross yield 1.14% fully hedged cost of funds Operating expenses of $3.5 million representing annualized cost of 3.4% on book value $16.81 net book value per share as of September 30, 2013 CPR of 5.3% for the quarter $3.6 billion investment portfolio as of September 30, 2013 $3.3 billion in total borrowings as of September 30, 2013 7 (1) Non-GAAP measures, which include Agency MBS, Non-Agency MBS (including linked transactions), and interest income on Agency IOs classified as derivatives. (2) Inclusive of the $0.90 dividend declared on September 19, 2013 (3) Third quarter weighted average Constant Prepayment Rate for the company’s Agency RMBS portfolio on an annualized basis. (1) (3) (1) (1) (1) (2) (1) |
|
|
Ten Months of 2013: Volatile Period for Mortgage Assets 8 Mortgage spreads have increased while Spec Pool Pay-ups have significantly decreased...... |
|
|
Ten Months of 2013: Interest Rate Volatility Has Increased 1 yr. x 10 yr. Swap Volatility Volatility has subsided in the last two months 9 Source: Bloomberg |
|
|
Leading Economic Return Amongst Peers May 10, 2012 to September 30, 2013 (not annualized) 10 Since its IPO and through the third quarter of 2013, WMC generated an economic return on book value in excess of the peer group average by approximately 1,100 basis points. Book value change and dividend return are inclusive of WMC’s third quarter dividend of $0.90 that was declared on September 19, 2013. Dividend return includes all dividends declared during the period from May 15, 2012, the date of WMC’s commencement of initial operations, through September 30, 2013. Peer group dividend return includes all dividends declared during the period and adjusting for 50% of the dividends declared during the period ending June 30, 2012. Economic return is calculated by taking the sum of (i) the total dividends declared and (ii) the change in net book value during the period and dividing by the beginning book value. Calculations for the period are not annualized. Peer Group consists of AGNC, ANH, ARR, CMO, CYS, HTS & NLY (1) (2) (3) |
|
|
11 Portfolio Composition as of September 30, 2013 Lower loan balance pools generally consist of loans below $150,000. Other consists of newly issued pools, high spread at origination “SATO” and low third party origination pools. Agency RMBS Coupon Principal Balance Amortized Cost Estimated Fair Value 30-year fixed rate 3.5% $ 1,560.7 $ 1,679.6 $ 1,583.7 4.0% $ 572.1 $ 631. 3 $ 601.1 5.5% $ 89.4 $ 101.5 $ 99. 6 6.0% $ 9.4 $10.5 $ 10.3 20-year fixed rate 3.0% $ 540.2 $ 566.8 $ 542.2 3.5% $ 101.8 $ 108.5 $ 105.9 4.0% $ 38.7 $ 42 .9 $ 41.2 Total Agency RMBS $ 2,912.3 $ 3,141.1 $ 2,984.0 Non-Agency RMBS 1.1% $ 401.7 $ 267.2 $ 265. 7 Agency & Non-Agency CMBS 1.6% $ 12.0 $ 8.3 $ 8.3 Agency RMBS IOs and IIOs 4.3% N/A $ 198.0 $ 197.0 Agency and Non-Agency IOs and IIOs accounted for as derivatives 4.8 % N/A N/A $ 95.4 Agency & Non-Agency CMBS IOs and IIOs 0.7% N/A $ 11.9 $ 11.9 Total Agency and Non-Agency IOs and IIOs $ 209.9 $ 304.3 Total Portfolio $ 3,626.5 $ 3,562. 3 |
|
|
8.1x leverage calculation does not reflect net To-Be Announced (“TBA”) mortgage pass-through certificates position. As of September 30, 2013, the net long position in TBAs was $390 million in notional value. Adjusted leverage is a Non-GAAP measure. Non-GAAP measures which include Agency and Non-Agency MBS (including the cost of interest rate swaps and linked transactions), and interest income on IOs and IIOs classified as derivatives, and for the quarter ended September 30, 2013. Includes net interest component related to interest rate swaps and reflects interest expense adjusted to include realized loss (the interest expense component) for all interest rate swaps. Estimated impact of liability hedges on the duration of net assets. Leverage Ratio: 8.1x Leverage Ratio adjusted for TBA position of 9.0x Net Duration of Agency RMBS Portfolio: 1.1 years Agency RMBS Weighted Average Loan Age (“WALA”) of 11.6 months Percentage of funding covered by swaps: 83% Percentage of swaps that are forward starting: 27% Portfolio Gross Yield : 3.42% Hedge Adjusted Cost of Financing : 1.14% Net Interest Spread : 2.28% CPR of 5.3% for Q3 versus Agency REIT Peer Group average of 16.1% Duration Contribution by Maturity Date Key Portfolio Metrics as of September 30, 2013 (3) (2) (2) 12 (1) (4) Total 6-Months 2-Year 5-Year 10-Year 20-Year 30-Year Agency RMBS 5.56 0.09 0.70 1.52 2.11 1.07 0.07 Non-Agency RMBS 0.47 0.00 0.01 0.09 0.20 0.15 0.02 Swaps -4.44 -0.06 -0.14 -0.88 -2.38 -1.05 0.06 Total (ex Non-Agency RMBS) 1.12 0.04 0.56 0.65 -0.27 0.01 0.13(1) (2) (3) (4) |
|
|
Financing Summary Repurchase Agreements ($ in millions – as of September 30, 2013) Original Maturity Repo Outstanding % Repo Outstanding $ Interest Rate Remaining Days to Maturity ≤ 30 Days 11.4% $376.5 0.64% 11 >30 Days to ≤ 60 Days 7.3% $241.0 0.76% 14 >60 Days to ≤ 90 Days 7.3% $240.9 0.38% 30 > 90 Days 74.0% $2,450.5 0.44% 41 Total/Wtd Avg 100% $3,308.9 0.48% 36 13 Master repurchase agreements with 18 counterparties Internal credit review Capacity in excess of our needs |
|
|
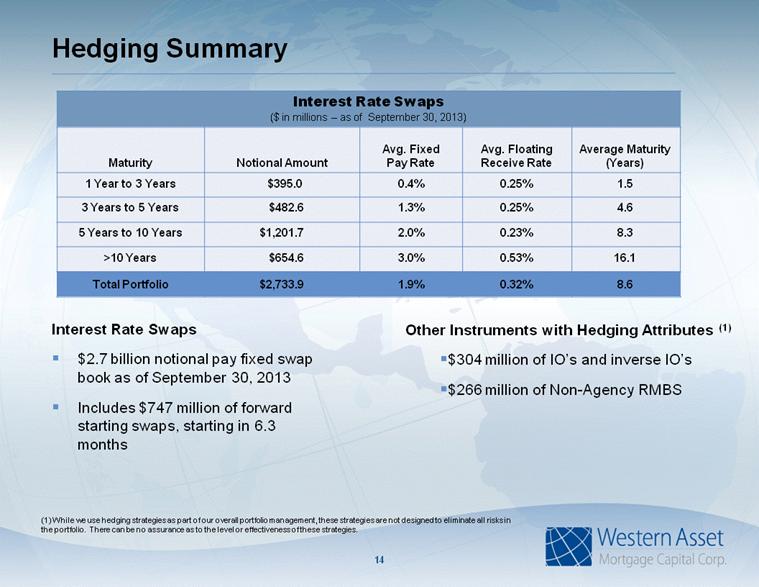
Hedging Summary 14 Interest Rate Swaps $2.7 billion notional pay fixed swap book as of September 30, 2013 Includes $747 million of forward starting swaps, starting in 6.3 months (1) While we use hedging strategies as part of our overall portfolio management, these strategies are not designed to eliminate all risks in the portfolio. There can be no assurance as to the level or effectiveness of these strategies. Interest Rate Swaps ($ in millions – as of September 30, 2013) Maturity Notional Amount Avg. Fixed Pay Rate Avg. Floating Receive Rate Average Maturity (Years) 1 Year to 3 Years $395.0 0.4% 0.25% 1.5 3 Years to 5 Years $482.6 1.3% 0.25% 4.6 5 Years to 10 Years $1,201.7 2.0% 0.23% 8.3 >10 Years $654.6 3.0% 0.53% 16.1 Total Portfolio $2,733.9 1.9% 0.32% 8.6 Other Instruments with Hedging Attributes (1) $304 million of IO’s and inverse IO’s $266 million of Non-Agency RMBS |
|
|
Portfolio Dynamics Maintained exposure to 20 year pools due to lower spread duration Shifted towards higher coupon 30 year pools Increased exposure to select Non-Agency securities that we believe are correlated to housing recovery and home price appreciation Strategy focused on housing turnover prepayments Added for the first time a small amount of CMBS Continue to target Agency pools with characteristics that lead to lower than expected CPRs Lower loan balance loans High loan-to-value MHA/HARP origination loans Newly issued (low WALA) loans High SATO (Spread at Origination) loans 15 |
|
|
Investment Highlights Western Asset is one of the largest fixed income managers with extensive experience in managing RMBS since 1974 Differentiated investment approach to managing prepayment and interest rate risk We believe current net interest spreads and CPR position the Company well to seek its objective of superior risk-adjusted returns Industry leading finance and administrative infrastructure Key strategic relationships provides superior market access 16 |
|
|
Contact Information 17 Western Asset Mortgage Capital Corporation c/o Financial Profiles, Inc. 11601 Wilshire Blvd., Suite 1920 Los Angeles, CA 90025 www.westernassetmcc.com Investor Relations Contact: Larry Clark Tel: (310) 478-2700 x29 lclark@finprofiles.com |