Attached files
| file | filename |
|---|---|
| 8-K - FORM 8-K - PUBLIC SERVICE ENTERPRISE GROUP INC | d631648d8k.htm |
 EXHIBIT 99
3
Forward Looking Statement
Certain of the matters discussed in this communication about us and our subsidiaries future
performance, including, without limitation, future revenues, earnings, strategies, prospects,
consequences and all other statements that are not purely historical constitute
“forward- looking statements” within the meaning of the Private Securities
Litigation Reform Act of 1995. Such forward-looking statements are subject to risks and
uncertainties, which could cause actual results to differ materially from those anticipated.
Such statements are based on management's beliefs as well as assumptions made by and
information currently available to management. When used herein, the words
“anticipate,” “intend,” “estimate,” “believe,”
“expect,” “plan,” “should,” “hypothetical,” “potential,” “forecast,” “project,”
variations of such words and similar expressions are intended to identify forward-looking
statements. Factors that may cause actual results to differ are often presented with the
forward-looking statements themselves. Other factors that could cause actual results to
differ materially from those contemplated in any forward looking statements made by us
herein are discussed in filings we make with the United States Securities and Exchange
Commission (SEC), including our Annual Report on Form 10-K and subsequent reports on
Form 10-Q and Form 8-K and available on our website:
http://www.pseg.com. These factors include, but are not
limited to: •
adverse changes in the demand for or the price of the capacity and energy that we
sell into wholesale electricity markets,
• adverse changes in energy industry law, policies and regulation, including market
structures and a potential shift away from competitive markets toward subsidized
market mechanisms, transmission planning and cost allocation rules, including rules
regarding how transmission is planned and who is permitted to build transmission in
the future, and reliability standards,
• any inability of our transmission and distribution businesses to obtain adequate and
timely rate relief and regulatory approvals from federal and state regulators,
• changes in federal and state environmental regulations that could increase our costs
or limit our operations,
• changes in nuclear regulation and/or general developments in the nuclear power
industry, including various impacts from any accidents or incidents experienced at our
facilities or by others in the industry, that could limit operations of our nuclear
generating units,
• actions or activities at one of our nuclear units located on a multi-unit site that
might adversely affect our ability to continue to operate that unit or other units
located at the same site,
• any inability to balance our energy obligations, available supply and risks,
•
any deterioration in our credit quality or the credit quality of our counterparties,
including in our leveraged leases,
•
availability of capital and credit at commercially reasonable terms and conditions and
our ability to meet cash needs,
•
changes in the cost of, or interruption in the supply of, fuel and other commodities
necessary to the operation of our generating units,
•
delays in receipt of necessary permits and approvals for our construction and
development activities,
•
delays or unforeseen cost escalations in our construction and development activities,
•
any inability to achieve, or continue to sustain, our expected levels of operating
performance,
•
any equipment failures, accidents, severe weather events or other incidents that
impact our ability to provide safe and reliable service to our customers, and any
inability to obtain sufficient coverage or recover proceeds of insurance on such
matters,
•
increases in competition in energy supply markets as well as competition from certain
rate-based transmission projects,
•
any inability to realize anticipated tax benefits or retain tax credits,
•
challenges associated with recruitment and/or retention of a qualified workforce,
•
adverse performance of our decommissioning and defined benefit plan trust fund
investments and changes in funding requirements, and
•
changes in technology, such as distributed generation and microgrids, and
resultant changes in customer usage patterns, including energy efficiency and
demand response.
All of the forward-looking statements made in this report are qualified by these cautionary
statements and we cannot assure you that the results or developments anticipated by
management will be realized or even if realized, will have the expected consequences to,
or effects on, us or our business prospects, financial condition or results of operations.
Readers are cautioned not to place undue reliance on these forward-looking statements in
making any investment decision. Forward-looking statements made in this report apply only
as of the date of this report. While we may elect to update forward-looking statements from
time to time, we specifically disclaim any obligation to do so, even if internal estimates
change, unless otherwise required by applicable securities laws. The forward-looking
statements contained in this report are intended to qualify for the safe harbor provisions of
Section 27A of the Securities Act of 1933, as amended, and Section 21E of the Securities
Exchange Act of 1934, as amended.
|
 GAAP Disclaimer
PSEG
presents
Operating
Earnings
in
addition
to
its
Income
from
Continuing
Operations/Net
Income
reported
in
accordance
with
accounting
principles
generally
accepted
in
the
United
States
(GAAP).
Operating
Earnings
is
a
non-
GAAP
financial
measure
that
differs
from
Net
Income
because
it
excludes
gains
or
losses
associated
with
Nuclear
Decommissioning
Trust
(NDT),
Mark-to-Market
(MTM)
accounting,
and
other
material
one-time
items.
PSEG
presents
Operating
Earnings
because
management
believes
that
it
is
appropriate
for
investors
to
consider
results
excluding
these
items
in
addition
to
the
results
reported
in
accordance
with
GAAP.
PSEG
believes
that
the
non-GAAP
financial
measure
of
Operating
Earnings
provides
a
consistent
and
comparable
measure
of
performance
of
its
businesses
to
help
shareholders
understand
performance
trends.
This
information
is
not
intended
to
be
viewed
as
an
alternative
to
GAAP
information.
Slides
A
and
B
at
the
end
of
this
presentation
include
a
list
of
items
excluded
from
Income
from
Continuing
Operations/Net
Income
to
reconcile
to
Operating
Earnings,
with
a
reference
to
that
slide
included
on
each
of
the
slides
where
the
non-GAAP
information
appears.
4 |
 76 local NJ towns and 9 counties
support
•
76 municipalities and nine counties (Bergen, Essex, Hudson,
Mercer, Middlesex, Passaic, Somerset, Union and Salem) have
approved resolutions in support of Energy Strong, PSE&G’s
infrastructure proposal to improve and fortify its electric and gas
distribution systems
•
PSE&G is seeking BPU approval to implement the first five years of
the Energy Strong proposal, an investment of $2.6 Billion
•
The Energy Strong proposal is currently being evaluated by the
NJ Board of Public Utilities
11 |
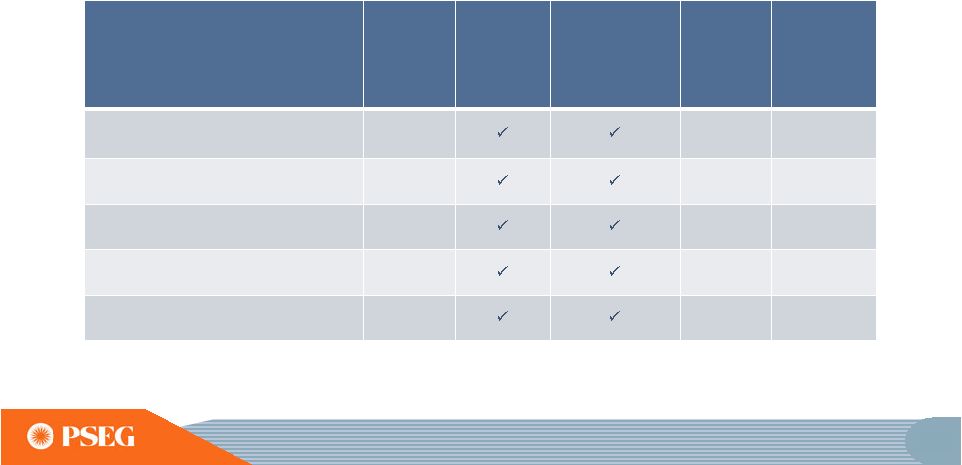 Our
$3.4 billion transmission investment program drives double digit earnings
growth at PSE&G through 2015 and includes…
PSE&G’s Five Major Transmission Projects
Approved
ROE
Inclusion
of CWIP in
Rate Base
100% Recovery
of Costs
Due to
Abandonment
Total
Estimated
Project
Costs
Expected
In-service
Date
Susquehanna-Roseland
12.93%
$790
June 2014
/June 2015
Northeast Grid Reliability
11.93%
$895
June 2015
North Central Reliability
11.68%
$390
June 2014
Burlington–Camden 230kV
11.68%
$399
June 2014
Mickleton–Gloucester-Camden 230kV
11.68%
$435
June 2015
12 |
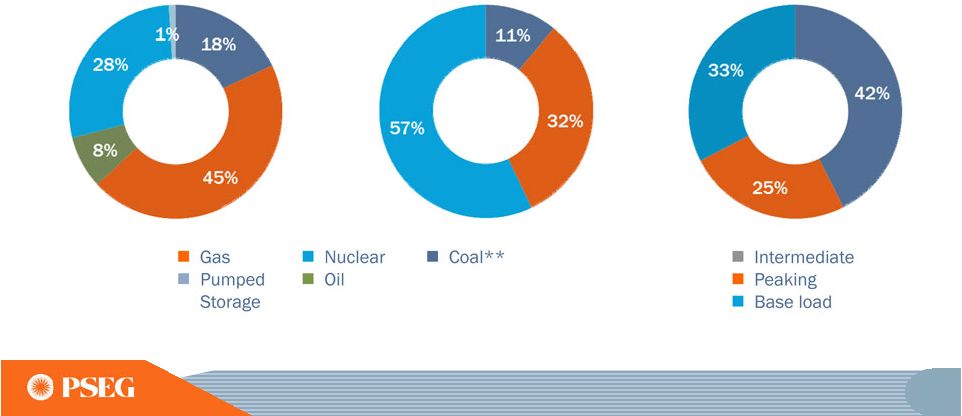 PSEG Power value advantaged by asset diversity, fuel
flexibility and location
Fuel Diversity*
Total MW: 13,226
Energy Produced*
Total GWh: 52,511
Energy Market
Served* Total
MW: 13,226 *2012
**INCLUDES
NEW
JERSEY
UNITS
THAT
FUEL
SWITCH
TO
GAS.
14 |
 What’s Next: PSEG’s Capital Spending expansion opportunities directed
toward growth in regulated business Potential
PSEG 2013-2015E Capital Spending*
$7.5 Billion
by Subsidiary
Potential
PSEG 2013-2015E Capital Spending*
$7.5 Billion
Growth / Environmental / Maintenance
E = ESTIMATE; CAPITAL EXCLUDES AFUDC. *DATA AS OF JUNE 30, 2013.
19 |
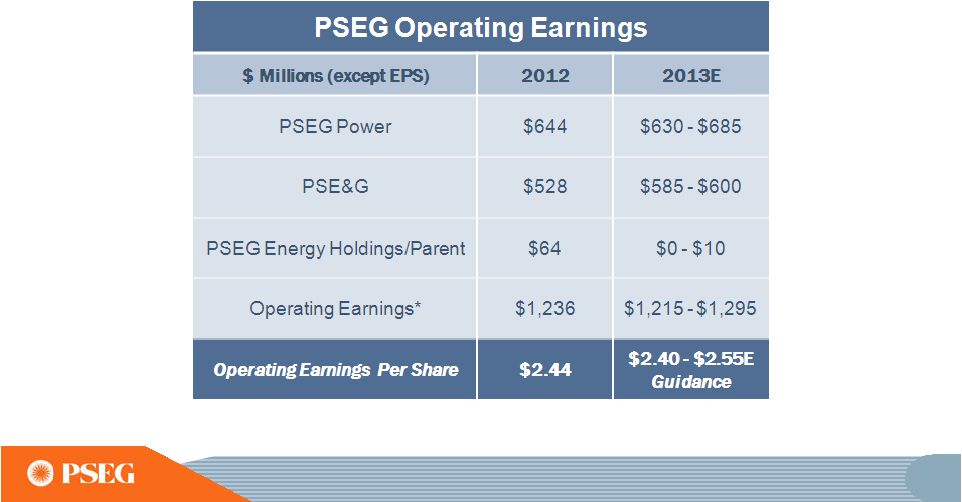
 Operating Earnings in 2013 benefiting
from return on transmission and Power’s locational advantage
Operating Earnings
Earnings per Share
$ millions (except EPS)
2013
2012
2013
2012
PSEG Power
$ 580
$ 523
$ 1.14
$ 1.03
PSE&G
468
453
0.92
0.89
PSEG Energy Holdings/
Enterprise
13
53
0.03
0.11
Operating Earnings*
$ 1,061
$ 1,029
$ 2.09
$ 2.03
Nine months ended September 30
*SEE SLIDE B FOR ITEMS EXCLUDED FROM INCOME FROM CONTINUING OPERATIONS/NET
INCOME TO RECONCILE TO OPERATING EARNINGS. 20
|
 Strength in YTD operating earnings supports
increase in 2013 guidance
E = ESTIMATE
*SEE SLIDE A FOR ITEMS EXCLUDED FROM INCOME FROM CONTINUING
OPERATIONS/NET INCOME TO RECONCILE TO OPERATING EARNINGS.
Based on our performance year-to-date, we have raised guidance for
full year operating earnings from $2.25-$2.50 to $2.40-$2.55 per
share 21 |
 Where we’re going …
PSE&G operating earnings are
forecast to grow at double digit rate through 2015
with growth in transmission to 40% of rate base
•
O&M Growth per year
•
PSE&G Rate Base
Transmission
E&G Distribution
EMP
•
EFORd Rate -
CCGT
•
Nuclear Generation
•
Holdings Solar Investment
•
LIPA Earnings
PSEG Focus
($ millions, except as noted)
•
2.2%
(forecast
3
)
•
$12,600
•
$5,000
4
•
$6,900
5
•
$700
5
•
1.4%
•
30.4TWh
•
$290
•
$15-$20
6
2015E
•
0.8%
(actual
2
)
•
$9,000
•
$2,500
•
$5,900
•
$600
•
1.7%
•
29.8TWh
•
$240
•
$0
2012
•
2.4%
(planned
1
)
•
$6,800
•
$866
•
$5,900
•
$0
•
1.6%
•
29.3TWh
•
$0
•
$0
2008
(1)
Planned compound annual growth rate 2008-2012.
(2)
Actual compound annual growth rate 2008-2012.
(3) Two-year compound annual growth rate from 2013.
(4) Includes additional Transmission hardening.
(5) Includes approved solar programs and proposed ES programs.
(6) Reflects a fully-executed, expanded Operating Services Agreement with
LIPA. .
E = ESTIMATE.
.
22 |
 PSE&G’s 2013 operating earnings
benefiting from transmission growth and cost containment
initiatives
$528
2012
2013 Guidance
PSE&G Operating Earnings*
($ Millions)
$585 -
$600E
E
= ESTIMATE
*SEE SLIDE A FOR ITEMS EXCLUDED FROM INCOME FROM CONTINUING
OPERATIONS/NET INCOME TO RECONCILE TO OPERATING EARNINGS.
50 |
 PSEG Power Nuclear fleet is a critical element
of success
Hope Creek
•
Operated by PSEG Nuclear
•
PSEG Ownership: 100%
•
Technology: Boiling Water
Reactor
•
Total
Capacity:
1,174
MW
•
Owned
Capacity:
1,174
MW
•
License Expiration: 2046
•
Next Refueling
Spring 2015
Salem
Units 1 and 2
•
Operated by PSEG Nuclear
•
PSEG Ownership: 57%,
Exelon –
43%
•
Technology: Pressurized Water
Reactor
•
Total Capacity: 2,326 MW
•
Owned Capacity: 1,335 MW
•
License Expiration:
2036 and 2040
•
Next Refueling
Unit 1 –
Fall 2014
Unit 2 –
Spring 2014
Peach Bottom
Units 2 and 3
•
Operated by Exelon
•
PSEG Ownership: 50%
•
Technology: Boiling Water
Reactor
•
Total Capacity: 2,245 MW
•
Owned Capacity:
1,123 MW
•
License Expiration:
2033 and 2034
•
Next Refueling
58
Unit 2 –
Fall 2014
Unit 3 –
Fall 2015
Scheduled uprate of ~130
MW expected 2015/2016 |
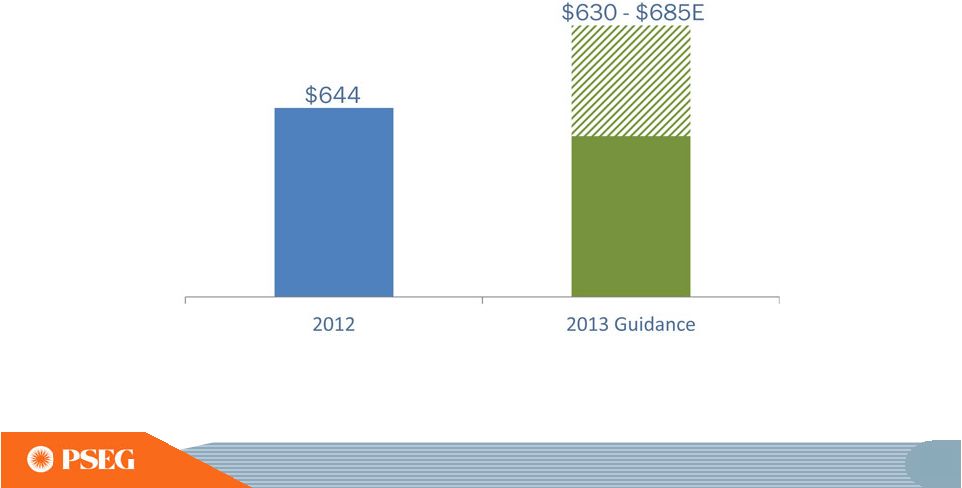 Power’s 2013 operating earnings
benefiting from locational value and operational efficiency
E= ESTIMATE
*SEE SLIDE A FOR ITEMS EXCLUDED FROM INCOME FROM CONTINUING
OPERATIONS/NET INCOME TO RECONCILE TO OPERATING EARNINGS.
PSEG Power Operating Earnings*
($ Millions)
70 |
 PSEG Summary
•
Raised
2013
full-year
operating
earnings
guidance
to
$2.40
-
$2.55
per
share
–
based
on
financial
results
year-to-date
•
Double
digit
operating
earnings
growth
at
PSE&G
starting
in
2013,
and
continuing
through
2015
driven
by
transmission
investments
and
approved
programs
•
Power’s
continued
focus
on
operational
excellence,
market
expertise
and
financial
strength
reduces
risk
in
low
price
environment
•
Strong
Balance
Sheet
and
Cash
Flow
support
full
capital
program
without
the
need
for
equity
•
Long
history
of
returning
cash
to
the
shareholder
through
the
common
dividend,
with
opportunity
for
future
growth
104 |
 Items Excluded from Income from Continuing
Operations/Net Income to Reconcile to Operating Earnings
2012
2011
2010
2009
2008
Earnings Impact ($ Millions)
Operating Earnings
1,236
$
1,389
$
1,584
$
1,567
$
1,478
$
Gain (Loss) on Nuclear Decommissioning Trust (NDT)
Fund Related Activity (PSEG Power)
52
50
46
9
(71)
Gain (Loss) on Mark-to-Market (MTM)
(a)
(PSEG Power)
(10)
107
(1)
(11)
14
Lease Transaction Activity (Energy Holdings)
36
(173)
-
29
(490)
Storm O&M (PSEG Power)
(39)
-
-
-
-
Market Transition Charge Refund (PSE&G)
-
-
(72)
-
-
Gain (Loss) on Asset Sales and Impairments (Energy Holdings)
-
34
-
-
(13)
Income from Continuing Operations
1,275
$
1,407
$
1,557
$
1,594
$
918
$
Discontinued Operations
-
96
7
(2)
270
Net Income
1,275
$
1,503
$
1,564
$
1,592
$
1,188
$
Fully Diluted Average Shares Outstanding (in Millions)
507
507
507
507
508
Per Share Impact (Diluted)
Operating Earnings
2.44
$
2.74
$
3.12
$
3.09
$
2.91
$
Gain (Loss) on NDT Fund Related Activity (PSEG Power)
0.10
0.10
0.09
0.02
(0.14)
Gain (Loss) on MTM
(a)
(PSEG Power)
(0.02)
0.21
-
(0.02)
0.03
Lease TransactionActivity (Energy Holdings)
0.07
(0.34)
-
0.05
(0.96)
Storm O&M (PSEG Power)
(0.08)
-
-
-
-
Market Transition Charge Refund (PSE&G)
-
-
(0.14)
-
-
Gain (Loss) on Asset Sales and Impairments (Energy Holdings)
-
0.06
-
-
(0.03)
Income from Continuing Operations
2.51
$
2.77
$
3.07
$
3.14
$
1.81
$
Discontinued Operations
-
0.19
0.01
-
0.53
Net Income
2.51
$
2.96
$
3.08
$
3.14
$
2.34
$
(a) Includes the financial impact from positions with forward delivery months.
(Unaudited)
For the Year Ended
December 31,
PUBLIC SERVICE ENTERPRISE GROUP INCORPORATED
Reconciling Items, net of tax
A
PLEASE
SEE
PAGE
4
FOR
AN
EXPLANATION
OF
PSEG’S
USE
OF
OPERATING
EARNINGS
AS
A
NON-GAAP
FINANCIAL
MEASURE
AND
HOW
IT
DIFFERS
FROM
INCOME
FROM
CONTINUING
OPERATIONS/NET
INCOME
. |
 Items Excluded from Income from Continuing
Operations/Net Income to Reconcile to Operating Earnings
B
PLEASE SEE PAGE 4 FOR AN EXPLANATION OF PSEG’S USE OF OPERATING
EARNINGS AS A NON-GAAP FINANCIAL MEASURE AND HOW IT DIFFERS FROM
INCOME FROM CONTINUING OPERATIONS/NET INCOME.
2013
2012
2013
2012
Earnings Impact ($ Millions)
Operating Earnings
385
$
382
$
1,061
$
1,029
$
Gain (Loss) on Nuclear Decommissioning Trust (NDT)
Fund Related Activity (PSEG Power)
12
40
29
49
Gain (Loss) on Mark-to-Market (MTM)
(a)
(PSEG Power)
3
(76)
(22)
(34)
Lease Related Activity (PSEG Energy Holdings)
-
1
-
7
Storm O&M, net of insurance recoveries (PSEG Power)
(10)
-
(25)
-
Income from Continuing Operations
390
$
347
$
1,043
$
1,051
$
Net Income
390
$
347
$
1,043
$
1,051
$
Fully Diluted Average Shares Outstanding (in Millions)
508
507
507
507
Per Share Impact (Diluted)
Operating Earnings
0.76
$
0.75
$
2.09
$
2.03
$
Gain (Loss) on NDT Fund Related Activity (PSEG Power)
0.02
0.08
0.06
0.10
Gain (Loss) on MTM
(a)
(PSEG Power)
0.01
(0.15)
(0.04)
(0.07)
Lease Related Activity (PSEG Energy Holdings)
-
-
-
0.01
Storm O&M, net of insurance recoveries (PSEG Power)
(0.02)
-
(0.05)
-
Income from Continuing Operations
0.77
$
0.68
$
2.06
$
2.07
$
Net Income
0.77
$
0.68
$
2.06
$
2.07
$
(a) Includes the financial impact from positions with forward delivery
months. Three Months Ended
Nine Months Ended
PUBLIC SERVICE ENTERPRISE GROUP INCORPORATED
(Unaudited)
September 30,
September 30,
Reconciling Items, net of tax |