Attached files
| file | filename |
|---|---|
| 8-K/A - 8-K/A - CARDINAL FINANCIAL CORP | a13-23870_18ka.htm |
Exhibit 99.1
|
|
Cardinal Financial Corporation Sandler O’Neill + Partners East Coast Financial Services Conference November 13-14, 2013 |
|
|
FORWARD LOOKING STATEMENTS Statements contained in this presentation which are not historical facts are forward-looking statements as that item is defined in the Private Securities Litigation Reform Act of 1995. Such forward-looking statements are subject to risks and uncertainties which could cause actual results to differ materially from estimated results. For an explanation of the risks and uncertainties associated with forward-looking statements, please refer to the Company’s Annual Report on Form 10-K for the year ended December 31, 2012 and other reports filed and furnished to the Securities and Exchange Commission. | 2 |
|
|
Aggressive on Sales, CONSERVATIVE ON RISK OUR OPERATING PHILOSOPHY | 3 |

|
|
BUSINESS LINE PROFILE | 4 Founded 1998 Retail Banking Offices 291 Headquarters Tysons Corner Fairfax, VA Mortgage Banking Offices 20 Commercial Banking Retail Banking Residential Mortgage Wealth Management 1Includes: Rockville, MD Banking Office Scheduled Opening 4Q2013 |
|
|
MANAGEMENT TEAM Industry Experience Years in Market Bernard Clineburg Chairman & CEO 42 years 42 Chris Bergstrom EVP, CCO/CRO 31 years 24 Alice Frazier EVP, COO 25 years 22 Dennis Griffith EVP, Chief Lending Officer 40 years 40 Kevin Reynolds EVP, Director of Sales 31 years 31 Mark Wendel EVP, CFO 31 years 7 Bob Brower CEO, George Mason Mortgage 22 years 22 | 5 |
|
|
4th Consecutive Appearance PUBLIC RECOGNITION 2011 (38th), 2012 (37th) 2012 BANK HONOR ROLL | 6 ABABANKINGJOURNAL Ranked 8th among institutions with total assets between $1 billion and $10 billion SmallCap600® August 9, 2013 2013 Bank Performance Scorecard Overall Financial Performance Ranked 5th of 187 Banks Nationwide $1 billion to $5 billion in assets. |

|
|
Strong Largest economy in the U.S.1 Housing trends year over year2 Median sales price increased 10.0% Median Days on Market decreased from 19 to 9 Stable 2001-2009 Regional GRP growth of 25%3 Unemployment rate consistently below national average THE GREATER WASHINGTON MSA | 7 Source: 1Policom Corporation, 2013 Economic Strength Rankings 2 GMU Center for Regional Analysis, Real Estate Business Intelligence 3 Greater Washington Initiative |
|
|
THE GREATER WASHINGTON MSA | 8 Growing 5 major corporate headquarter relocations in recent years1 Gained more than 285,000 jobs (8.87% growth) since 2000 59 Inc. “500 Fastest-Growing Companies” Greater Washington Jobs by Sector, 20122 1Greater Washington Initiative 2GMU Center for Regional Analysis |
|
|
OFFICE LOCATIONS | 9 Map: SNL Financial 2013 New Banking Office Locations Mortgage Office Locations 2013 New Mortgage Office Locations Banking Office Locations |

|
|
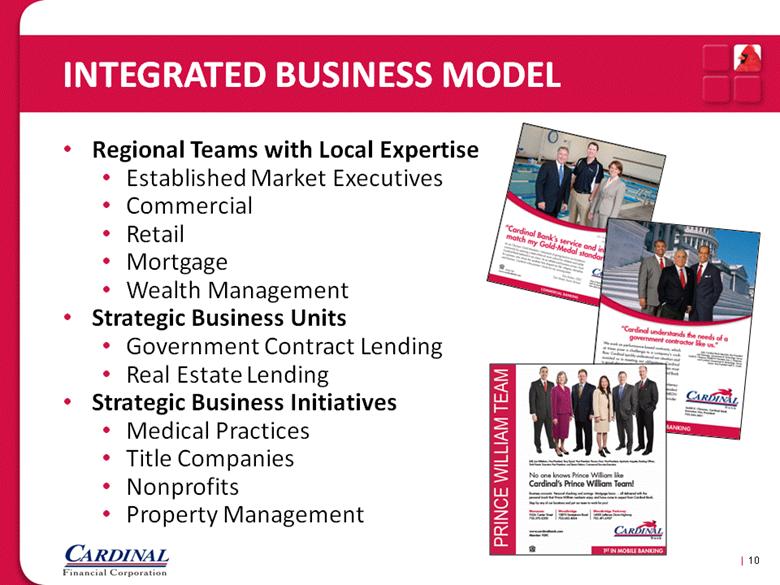
INTEGRATED BUSINESS MODEL Regional Teams with Local Expertise Established Market Executives Commercial Retail Mortgage Wealth Management Strategic Business Units Government Contract Lending Real Estate Lending Strategic Business Initiatives Medical Practices Title Companies Nonprofits Property Management | 10 |
|
|
OUR RETAIL MARKETS Region Median Household Income 20121 Total Population 20121 Projected Population Increase 2012 – 20171 Fairfax County and City of Fairfax, VA $101,779 1,100,757 5.48% Loudoun County, VA $113,282 327,715 15.03% Prince William County, VA $89,162 415,479 11.61% Arlington County, VA $90,423 215,286 8.62% Alexandria (City), VA $80,536 143,372 8.71% Montgomery County , MD $91,837 986,965 5.23% District of Columbia $59,100 617,405 2.61% Fredericksburg (City), VA $48,767 25,368 12.44% Stafford County, VA $87,476 130,703 5.83% | 11 1Source: SNL Financial |

|
|
OUR DEPOSIT MARKET SHARE Region 2Q2013 CFNL Banking Offices Deposit Growth, 2Q2012-2Q2013 Total Deposits in Market1 CFNL Deposits Market Growth CFNL Growth Greater Washington MSA $167.6 billion $2.43 billion 28 (2.19)% 4.13% Fairfax County, VA $41.3 billion $1.15 billion 10 (10.78%) (2.74%) Loudoun County, VA $5.0 billion $219 million 4 4.74% (0.28%) Montgomery County, MD $30.8 billion $143.3 million 12 (1.17%) 96.99% Arlington County, VA $5.6 billion $137.8 million 4 3.27% 15.06% District of Columbia $36.5 billion $88.7 million 2 10.05% 14.77% Prince William County, VA $3.6 billion $61.1 million 2 4.74% 3.33% Manassas, VA (City) $1.0 billion $128.6 million 1 (3.81%) 9.00% Fairfax, VA (City) $2.9 billion $101.8 million 1 13.87% 5.28% Alexandria, VA (City) $5.4 billion $52.5 million 1 6.28% (2.87%) Fredericksburg , VA (City) $1.2 billion $32.8 million 1 1.60% 7.97% Stafford County, VA $826 million $18 million 1 3.91% 9.71% | 12 Source: SNL Financial 1Excludes E-Trade Bank which are brokered deposits 2 Rockville, MD Branch scheduled opening, 4Q2013 |
|
|
ANNUAL GROWTH | 13 1From 9/30/2008 through 9/30/2013 Excludes Brokered Deposits CAGR1 Loans: 12.56% Deposits: 12.43% Total Assets: 11.35% |
|
|
COMMERCIAL LENDING PROFILE Loan Portfolio of $1.94 billion 28 Loan Officers Commercial Real Estate Government Contract Small Business Retail | 14 Net Loans Held for Investment Loan Officers Average Industry Experience Average Years In-Market 28 22 Years 19 |
|
|
LOAN PORTFOLIO MIX | 15 As of 9/30/2013 |
|
|
COMMERCIAL REAL ESTATE PORTFOLIO | 16 Recreational As of 9/30/2013 |
|
|
STRONG CONSERVATIVE CREDIT CULTURE | 17 Source: SNL Financial Complete Listing of Peer Group Used in Appendix Nonperforming Assets to Assets |
|
|
DEPOSIT PROFILE Emphasis on core deposits and increasing relationships 6 Business Deposit Officers Aggressive deposit campaigns with strategic follow-up marketing | 18 Total Deposits1 Area # of Officers Average Industry Experience Average Years In-Market Retail Officers 28 20 Years 20 Business Deposit Officers 6 15 Years 10 Leadership 2 32 Years 30 1Excludes Brokered Deposits |
|
|
CORE DEPOSIT BASE & COST OF DEPOSITS | 19 Cost of Deposits1 1Excludes Brokered Deposits Money Market/ Savings $1.82 billion as of 9/30/2013 Excludes Brokered Deposits |
|
|
DEPOSIT GROWTH | 20 |
|
|
CARDINAL IS WELL CAPITALIZED | 21 |
|
|
MORTGAGE BANKING PROFILE George Mason Mortgage operates 20 branches in 15 counties, throughout Virginia, Maryland, and the District of Columbia Marketing gains have ranged between 1.8% and 2.1% YTD | 22 GMM Loan Officers Avg Closings per GMM Loan Officer per Quarter Q42011 102 $7,632,000 Q42012 160 $7,947,819 Q32012 144 $8,306,204 Q32013 201 $4,614,660 1Excludes Managed Companies |
|
|
Full Service Brokerage Services1 Investment Management WEALTH MANAGEMENT PROFILE 1 Securities offered through Raymond James Financial Services, Inc., Member FINRA/SIPC, and are: • Not deposits • Not insured by FDIC or any other government agency • Not guaranteed by Cardinal Bank • Subject to risk, may lose value. Cardinal Bank and Cardinal Wealth Services are independent of Raymond James Financial Services. | 23 Senior Management Average Industry Experience Average Years In-Market 2 23 Years 17 |
|
|
STRATEGIC GROWTH: DE NOVO Expand DC/ Montgomery County Presence Georgetown, Washington, DC (August 5, 2013) Rockville, MD (4Q2013) New Market Executive and two additional commercial lenders with regional expertise Targeted Industry Initiatives Mortgage Office Expansion Richmond, VA Virginia Beach, VA Culpeper, VA | 24 Map: SNL Financial 2013 New Mortgage Office Locations |
|
|
STRATEGIC GROWTH: MERGERS & ACQUISITIONS | 25 Washington MSA 24 banks in the Washington MSA with assets between $200 million and $1 billion Markets with Growth Potential Richmond MSA Baltimore MSA Strong Local Management to lead Regional Market Teams Complementary Product Line Offering Attractive Branch Network Map: SNL Financial 2013 New Mortgage Office Locations |

|
|
STRATEGIC GROWTH: OVERVIEW OF UFBC ACQUISITION Will create largest community bank headquartered in Northern Virginia Will increase deposit market share position in Washington DC MSA Strong, experienced management team Will increase fee-income through the addition of insurance capabilities and expansion of the wealth business Will grow balance sheet with high-quality loans, significant non-interest bearing and core deposits Expansion of UFBC current relationships with increased legal lending limit and more comprehensive services | 26 UFBC (8) CFNL (28) |
|
|
FINANCIAL HIGHLIGHTS 3Q2012 3Q2013 YTD 9/30/2012 YTD 9/30/2013 Return on Assets 2.08% 0.43% 1.65% 0.95% Return on Equity 20.09% 3.73% 15.58% 8.34% Assets In billions $3.01 $2.80 Loans In billions $1.72 $1.94 Deposits $2.18 $2.08 | 27 |
|
|
STOCK PROFILE: CFNL (NASDAQ) | 28 Share Price (10/31/2013) $16.50 52 Week Range $14.40 - $18.40 Shares Outstanding 30,288,000 Market Capitalization $499.8 million Average Daily Volume 265,202 Price (10/31/13)/Book 1.58x Price (10/31/13)/ Tangible Book (9/30/13) 1.63x |
|
|
INVESTMENT SUMMARY Well-positioned for growth Franchise value in premier market Resilient regional economy Opportunities for organic and M&A growth Strong, experienced management team Excellent asset quality and diversified loan portfolio Diversified revenue stream Shareholder-focused Attractive valuation Dividend has increased 500% since 2009 52% compound annual EPS growth rate over past 5 years | 29 |
|
|
Aggressive on Sales, CONSERVATIVE ON RISK OUR OPERATING PHILOSOPHY | 30 |
|
|
APPENDIX A Peer Comparisons |
|
|
REGIONAL PEER GROUP | 32 Company Name State Ticker Total Assets Reported 2Q2013 ($000) American National Bankshares Inc. VA AMNB 1,294,017 Cardinal Financial Corporation VA CFNL 2,900,102 Community Bankers Trust Corporation VA ESXB 1,124,567 Eagle Bancorp, Inc. MD EGBN 3,410,568 Eastern Virginia Bankshares, Inc. VA EVBS 1,115,804 First Community Bancshares, Inc. VA FCBC 2,650,735 Franklin Financial Corporation VA FRNK 1,050,630 Middleburg Financial Corporation VA MBRG 1,217,200 Monarch Financial Holdings, Inc. VA MNRK 1,021,399 National Bankshares, Inc. VA NKSH 1,091,086 Old Line Bancshares, Inc. MD OLBK 1,147,085 Sandy Spring Bancorp, Inc. MD SASR 4,072,617 Shore Bancshares, Inc. MD SHBI 1,054,277 StellarOne Corporation VA STEL 3,014,166 Union First Market Bankshares Corporation VA UBSH 4,056,557 Virginia Commerce Bancorp, Inc. VA VCBI 2,836,235 WashingtonFirst Bankshares, Inc. VA WFBI 1,125,059 Source: SNL Financial Includes VA/MD/DC Banks with Assets between $1b and $4.5b |
|
|
NATIONAL PEER GROUP Company Name State Ticker Total Assets Reported 2Q2013 ($000) Ameris Bancorp GA ABCB 2,808,675 BNC Bancorp NC BNCN 2,929,636 BofI Holding, Inc. CA BOFI 3,090,771 Cardinal Financial Corporation VA CFNL 2,900,102 Community Bank CA CYHT 3,172,519 Enterprise Financial Services Corp MO EFSC 3,094,420 Financial Institutions, Inc. NY FISI 2,782,303 First Bancorp NC FBNC 3,247,410 First NBC Bank Holding Company LA NBCB 3,027,395 Hanmi Financial Corporation CA HAFC 2,773,414 HomeStreet, Inc. WA HMST 2,776,124 Hudson Valley Holding Corp. NY HVB 2,981,975 Kearny Financial Corp. (MHC) NJ KRNY 3,145,360 Lakeland Financial Corporation IN LKFN 2,975,462 MainSource Financial Group, Inc. IN MSFG 2,771,055 Oritani Financial Corp. NJ ORIT 2,831,922 StellarOne Corporation VA STEL 3,014,166 Sun Bancorp, Inc. NJ SNBC 3,205,921 Virginia Commerce Bancorp, Inc. VA VCBI 2,836,235 Washington Trust Bancorp, Inc. RI WASH 3,061,307 Wilshire Bancorp, Inc. CA WIBC 2,787,401 | 33 Source: SNL Financial Includes Banks with Assets between $2.75b and $3.5b Excludes First Financial Corporation |
|
|
CREDIT QUALITY RANKING National Peers NPAs/Assets (%) 1Q2013 Cardinal Financial Corporation VA 0.10 Financial Institutions, Inc. NY 0.43 Lakeland Financial Corporation IN 0.73 Washington Trust Bancorp, Inc. RI 0.79 Oritani Financial Corp. NJ 0.91 Hudson Valley Holding Corp. NY 1.01 StellarOne Corporation VA 1.02 Kearny Financial Corp. (MHC) NJ 1.05 Enterprise Financial Services Corp MO 1.10 Hanmi Financial Corporation CA 1.13 Community Bank CA 1.20 MainSource Financial Group, Inc. IN 1.30 Virginia Commerce Bancorp, Inc. VA 1.66 First Bancorp NC 1.78 BNC Bancorp NC 1.78 Sun Bancorp, Inc. NJ 2.45 Ameris Bancorp GA 2.55 BofI Holding, Inc. CA NA First NBC Bank Holding Company LA NA HomeStreet, Inc. WA NA Wilshire Bancorp, Inc. CA NA Regional Peers NPAs/Assets (%) 2Q2013 Cardinal Financial Corporation VA 0.10 Eastern Virginia Bankshares, Inc. VA 0.87 American National Bankshares Inc. VA 0.88 StellarOne Corporation VA 1.02 Sandy Spring Bancorp, Inc. MD 1.05 National Bankshares, Inc. VA 1.20 First Community Bancshares, Inc. VA 1.28 WashingtonFirst Bankshares, Inc. VA 1.41 Virginia Commerce Bancorp, Inc. VA 1.66 Union First Market Bankshares Corporation VA 1.69 Community Bankers Trust Corporation VA 2.07 Middleburg Financial Corporation VA 2.36 Old Line Bancshares, Inc. MD 2.70 Shore Bancshares, Inc. MD 3.91 Franklin Financial Corporation VA 4.59 Eagle Bancorp, Inc. MD NA Monarch Financial Holdings, Inc. VA NA | 34 Source: SNL Financial |
|
|
APPENDIX B Cardinal Financial Corporation Acquisition of United Financial Banking Companies, Inc. September 9, 2013 |
|
|
FORWARD-LOOKING STATEMENTS This communication contains forward-looking statements with respect to the proposed merger between Cardinal Financial Corporation (“Cardinal”) and United Financial Banking Companies, Inc. (“UFBC”) and the timing of consummation of the merger that are made in reliance upon the safe harbor provisions of the Private Securities Litigation Reform Act of 1995. The words “anticipates”, “projects”, “intends”, “estimates”, “expects”, “believes”, “plans”, “may”, “will”, “should”, “could” and other similar expressions are intended to identify such forward-looking statements. These forward-looking statements are necessarily speculative and speak only as of the date made, and are subject to numerous assumptions, risks and uncertainties, all of which may change over time. Actual results could differ materially from such forward-looking statements. The following factors, among others, could cause actual results to differ materially and adversely from such forward-looking statements: (1) the business of Cardinal and UFBC may not be combined successfully, or such combination may take longer, be more difficult, time-consuming or costly to accomplish than expected; (2) the expected growth opportunities or cost savings from the merger may not be fully realized or may take longer to realize than expected; (3) deposit attrition, operating costs, customer losses and business disruption following the merger, including adverse effects on relationships with employees, may be greater than expected; (4) the regulatory approvals required for the merger may not be obtained on the proposed terms or on the anticipated schedule; (5) the shareholders of UFBC may fail to approve the merger; (6) legislative or regulatory changes, including changes in accounting standards, may adversely affect the businesses in which Cardinal and UFBC are engaged; (7) the interest rate environment may further compress margins and adversely affect net interest income; (8) results may be adversely affected by continued diversification of assets and adverse changes to credit quality; and (9) competition from other financial services companies in Cardinal’s and UFBC’s markets could adversely affect operations. Cardinal and UFBC caution that the foregoing list of factors is not exclusive. All subsequent written and oral forward-looking statements concerning the proposed transaction or other matters attributable to Cardinal or UFBC or any person acting on their behalf are expressly qualified in their entirety by the cautionary statements above. Cardinal and UFBC do not undertake any obligation to update any forward-looking statement to reflect circumstances or events that occur after the date the forward-looking statements are made. | 36 |
|
|
TRANSACTION RATIONALE Enhances franchise in attractive, northern Virginia market Both banks have similar strategy with an emphasis on commercial banking Increases core bank revenue and earnings contribution Increases fee-income through the addition of insurance capabilities and expansion of the wealth business Expansion of UFBC current relationships with increased legal lending limit and more comprehensive services | 37 Strategic Rationale Attractive Financial Returns Low Risk Profile Accretive to first full year core earnings per share Tangible book value dilution earn back period of 3 - 4 years Double digit internal rate of return Pro forma capital ratios above “well-capitalized” guidelines Grows balance sheet with high-quality loans, significant non-interest bearing and core deposits Strong conservative credit and risk culture is consistent with Cardinal Non complex business lines that are easily integrated Integration risk mitigated by in-market transaction with a well known management team Customer attrition risk mitigated with retention of Harold C. Rauner as regional president |
|
|
OVERVIEW OF UFBC United Financial Banking Companies, Inc., headquartered in Vienna, VA, operates 8 branches located throughout Northern Virginia The company is publicly-traded (OTCQB: UFBC) with a market capitalization of $25.0 million UFBC is the holding company to its sole commercial bank subsidiary, The Business Bank The company is led by a strong, experienced management team The Business Bank Insurance Agency, LLC offers a full range of commercial and personal insurance products and services Brokerage services provided through LPL Financial Corporation | 38 Corporate Overview Headquarters: Vienna, VA Chief Executive Officer: Harold C. Rauner Employees (FTE): 74 GAAP Balance Sheet (6/30/13) Assets: $334 million Gross Loans: $226 million Deposits: $298 million Tangible Common Equity: $26 million SBLF Preferred Equity: $3 million Bank Level Performance Metrics (6/30/13) Efficiency Ratio (LTM): 83.5% Return on Average Assets (LTM): 0.30% Net Interest Margin (LTM): 3.63% NPAs / Assets: 0.52% Risk Based Capital Ratio: 14.21% |
|
|
PRO FORMA BRANCH MAP Will create largest community bank headquartered in Northern Virginia Increases deposit market share position in Washington DC MSA Branch consolidation expected Washington DC MSA is a highly attractive market Population expected to increase 5.9% over the next five years versus 3.5% for the nation Median household income is $83,803 versus a nationwide median of $50,157 | 39 Deposit Market Share – Washington DC MSA Source: SNL Financial; Deposit data as of June 30, 2012 UFBC (8) CFNL (28) 2012 Rank 2011 Rank Institution Names Branches Deposits ($000's) Market Share (%) 1 1 Capital One Financial Corp. (VA) 194 28,769,547 18.65 2 2 Wells Fargo & Co. (CA) 157 21,759,647 14.10 3 3 Bank of America Corp. (NC) 169 20,233,958 13.12 4 4 SunTrust Banks Inc. (GA) 180 16,392,076 10.63 5 5 BB&T Corp. (NC) 181 13,146,952 8.52 6 6 PNC Financial Services Group (PA) 190 10,047,898 6.51 7 7 Citigroup Inc. (NY) 42 5,523,739 3.58 8 8 United Bankshares Inc. (WV) 62 4,547,590 2.95 9 9 M&T Bank Corp. (NY) 81 3,853,571 2.50 10 10 HSBC 12 3,293,985 2.14 12 15 Pro Forma Company 36 2,334,003 1.51 15 15 Cardinal Financial Corp. (VA) 28 2,043,401 1.32 35 35 United Financial Banking Co. (VA) 8 290,602 0.19 |
|
|
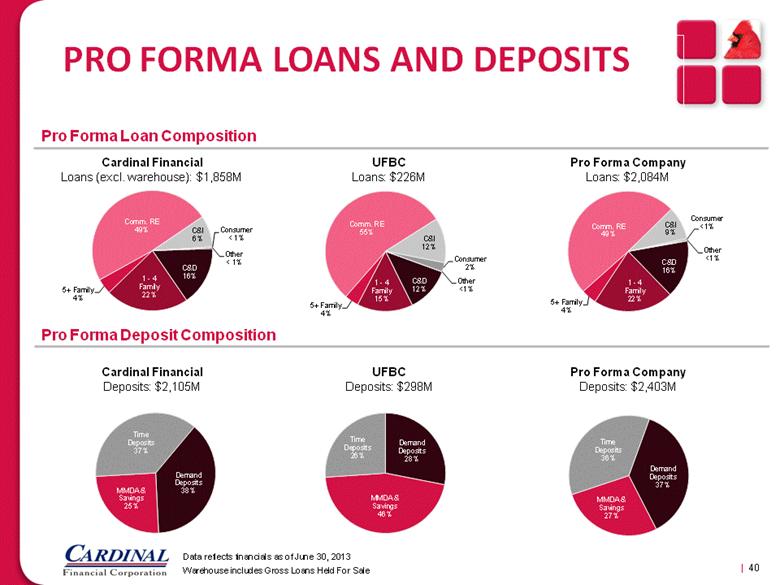
PRO FORMA LOANS AND DEPOSITS | 40 Pro Forma Loan Composition Pro Forma Deposit Composition Cardinal Financial Loans (excl. warehouse): $1,858M UFBC Loans: $226M Pro Forma Company Loans: $2,084M Cardinal Financial Deposits: $2,105M UFBC Deposits: $298M Pro Forma Company Deposits: $2,403M Data reflects financials as of June 30, 2013 Warehouse includes Gross Loans Held For Sale C&D 12% 1 - 4 Family 15% 5+ Family 4% Comm. RE 55% C&I 12% Consumer 2% Other <1% C&D 16% 1 - 4 Family 22% 5+ Family 4% Comm. RE 49% C&I 6% Consumer < 1% Other < 1% Demand Deposits 38% MMDA & Savings 25% Time Deposits 37% Demand Deposits 37% MMDA & Savings 27% Time Deposits 36% C&D 16% 1 - 4 Family 22% 5+ Family 4% Comm. RE 49% C&I 9% Consumer <1% Other <1% |
|
|
TRANSACTION TERMS Approximately 50% Stock / 50% Cash $19.13 per share in stock, plus $19.13 per share in cash Aggregate transaction value of approximately $51.7 million, excluding stock options and warrants | 41 Consideration Stock Options Approvals Exchange Ratio SBLF Preferred Stock Anticipated Closing Fixed exchange ratio of 1.154 based on the average closing price of Cardinal’s common stock for the 10 trading days ending on September 6, 2013 All UFBC stock options will be cashed out at closing based on the per share merger consideration value ($38.26) minus the exercise price As a closing condition, UFBC will redeem its $3.0 million in outstanding SBLF Preferred Stock UFBC will require shareholder approval; Cardinal will not require shareholder approval Customary regulatory approvals will be required to close the transaction Anticipated closing in the first quarter of 2014 |

|
|
TRANSACTION OVERVIEW | 42 Assumptions Pricing Multiples Pro Forma Impact Assumptions based on meaningful due diligence Review of UFBC’s top banking relationships Estimated cost saves assumes multiple branch consolidations and exceed 40% Credit/interest rate marks after detailed review of portfolios and 3rd party analysis Assumes retention of UFBC’s Trust Preferred Securities and redemption of SBLF Price / Tangible Book Value (6/30/13): 1.97x Price / 2013E EPS (including synergies): < 12x Franchise Premium / Core Deposits: 10.6% Accretive to first full year core earnings per share Tangible book value dilution earn back period of 3-4 years Double digit internal rate of return Pro forma capital ratios above “well-capitalized” guidelines |
|
|
ADDITIONAL INFORMATION This presentation is being made in respect of the proposed merger transaction involving Cardinal Financial Corporation (“Cardinal”) and United Financial Banking Companies, Inc. (“UFBC”). This presentation does not constitute an offer to sell or the solicitation of an offer to buy any securities or a solicitation of any vote or approval. In connection with the proposed merger, Cardinal will file with the Securities and Exchange Commission (“SEC”) a registration statement on Form S-4 that will include a proxy statement/prospectus for the shareholders of UFBC. Cardinal also plans to file other documents with the SEC regarding the proposed merger transaction. UFBC will mail the final proxy statement/prospectus to its shareholders. Before making any voting or investment decision, shareholders and investors are urged to read the proxy statement/prospectus regarding the proposed transaction and any other relevant documents carefully in their entirety when they become available because they will contain important information about the proposed transaction. The proxy statement/prospectus, as well as other filings containing information about Cardinal, will be available without charge at the SEC’s Internet site (http://www.sec.gov). When available, free copies of the proxy statement/prospectus may also be obtained by directing a request by telephone or mail to Cardinal Financial Corporation, 8270 Greensboro Drive, Suite 500, McLean, Virginia 22102, Attention: Investor Relations (telephone: (703) 584-3400), or by accessing Cardinal’s Internet site (http://www.cardinalbank.com) under “Investor Relations.” The information on Cardinal’s Internet site is not, and shall not be deemed to be, a part of this presentation or incorporated into other filings Cardinal makes with the SEC. | 43 |
|
|
www.cardinalbank.com Corporate Headquarters 8270 Greensboro Drive Suite 500 McLean, VA 22102 For more information, please contact: Bernard Clineburg Chairman and CEO (703) 584-3477 Bernard.Clineburg@cardinalbank.com Chris Bergstrom EVP, Chief Risk Officer (703) 584-3421 Chris.Bergstrom@cardinalbank.com Alice Frazier EVP, Chief Operating Officer (703) 584-6033 Alice.Frazier@cardinalbank.com |