Attached files
| file | filename |
|---|---|
| EX-99.1 - AVAYA PRESS RELEASE - AVAYA INC | a112013avaya4qerfinalful.htm |
| 8-K - 8-K - AVAYA INC | form8-kearnings11x20x20.htm |
The Power of We™ November 20, 2013 Avaya Q4 2013 Earnings Call Exhibit 99.2
© 2013 Avaya 2 Forward - Looking Statements Certain statements contained in this presentation are forward-looking statements, including statements regarding our future financial and operating performance, as well as statements regarding our future growth plans and drivers. These statements may be identified by the use of forward-looking terminology such as "anticipate," "believe," "continue," "could," "estimate," "expect," "intend," "may," "might," "plan," "potential," "predict," "should" or "will" or other similar terminology. We have based these forward-looking statements on our current expectations, assumptions, estimates and projections. While we believe these expectations, assumptions, estimates and projections are reasonable, such forward looking statements are only predictions and involve known and unknown risks and uncertainties, many of which are beyond our control. These and other important factors may cause our actual results, performance or achievements to differ materially from any future results, performance or achievements expressed or implied by these forward-looking statements. For a list and description of such risks and uncertainties, please refer to our filings with the SEC that are available at www.sec.gov and in particular, our 2012 Form 10-K and our Form 10-Q filed with the SEC on August 9, 2013. We disclaim any intention or obligation to update or revise any forward-looking statements, whether as a result of new information, future events or otherwise. This presentation should be read in conjunction with our Form 8-K filed with the SEC on November 20, 2013. Within this presentation, we refer to certain non‐GAAP financial measures that involve adjustments to GAAP measures. A reconciliation between our non-GAAP financial measures and GAAP financial measures is included on the last two slides of this presentation. These slides, as well as current and historical financial data are available on our web site at www.avaya.com/investors None of the information included on the website is incorporated by reference in this presentation.
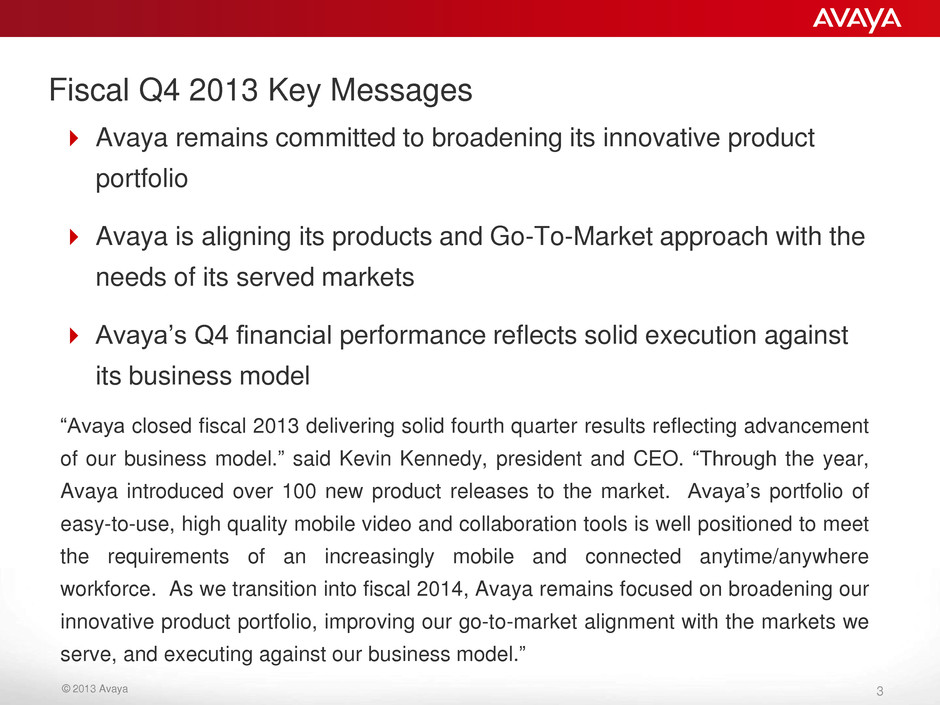
© 2013 Avaya 3 Fiscal Q4 2013 Key Messages Avaya remains committed to broadening its innovative product portfolio Avaya is aligning its products and Go-To-Market approach with the needs of its served markets Avaya’s Q4 financial performance reflects solid execution against its business model “Avaya closed fiscal 2013 delivering solid fourth quarter results reflecting advancement of our business model.” said Kevin Kennedy, president and CEO. “Through the year, Avaya introduced over 100 new product releases to the market. Avaya’s portfolio of easy-to-use, high quality mobile video and collaboration tools is well positioned to meet the requirements of an increasingly mobile and connected anytime/anywhere workforce. As we transition into fiscal 2014, Avaya remains focused on broadening our innovative product portfolio, improving our go-to-market alignment with the markets we serve, and executing against our business model.”
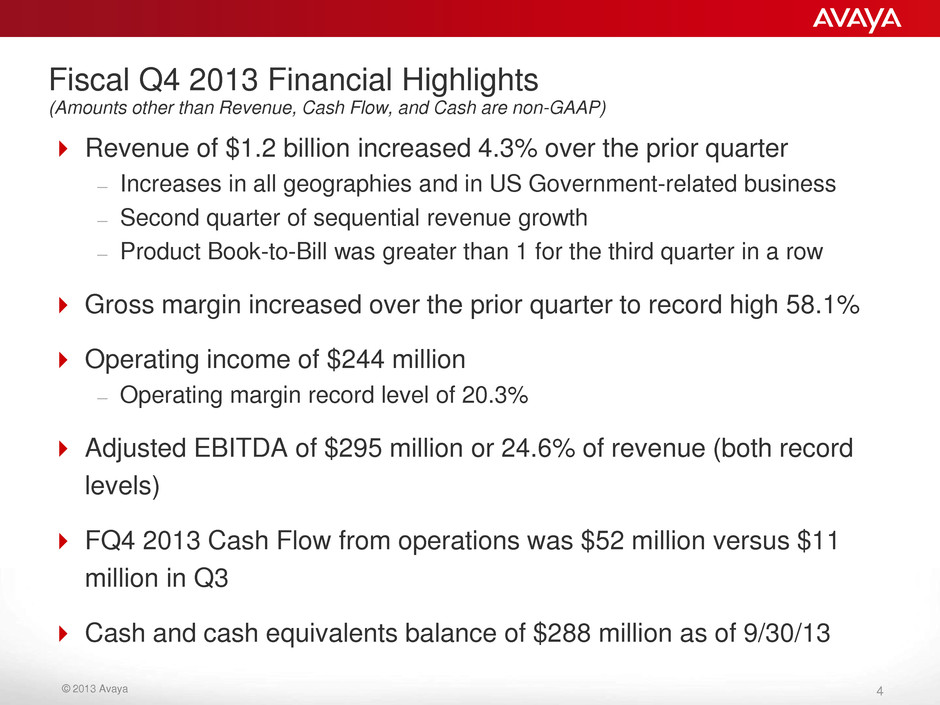
© 2013 Avaya 4 Fiscal Q4 2013 Financial Highlights (Amounts other than Revenue, Cash Flow, and Cash are non-GAAP) Revenue of $1.2 billion increased 4.3% over the prior quarter – Increases in all geographies and in US Government-related business – Second quarter of sequential revenue growth – Product Book-to-Bill was greater than 1 for the third quarter in a row Gross margin increased over the prior quarter to record high 58.1% Operating income of $244 million – Operating margin record level of 20.3% Adjusted EBITDA of $295 million or 24.6% of revenue (both record levels) FQ4 2013 Cash Flow from operations was $52 million versus $11 million in Q3 Cash and cash equivalents balance of $288 million as of 9/30/13
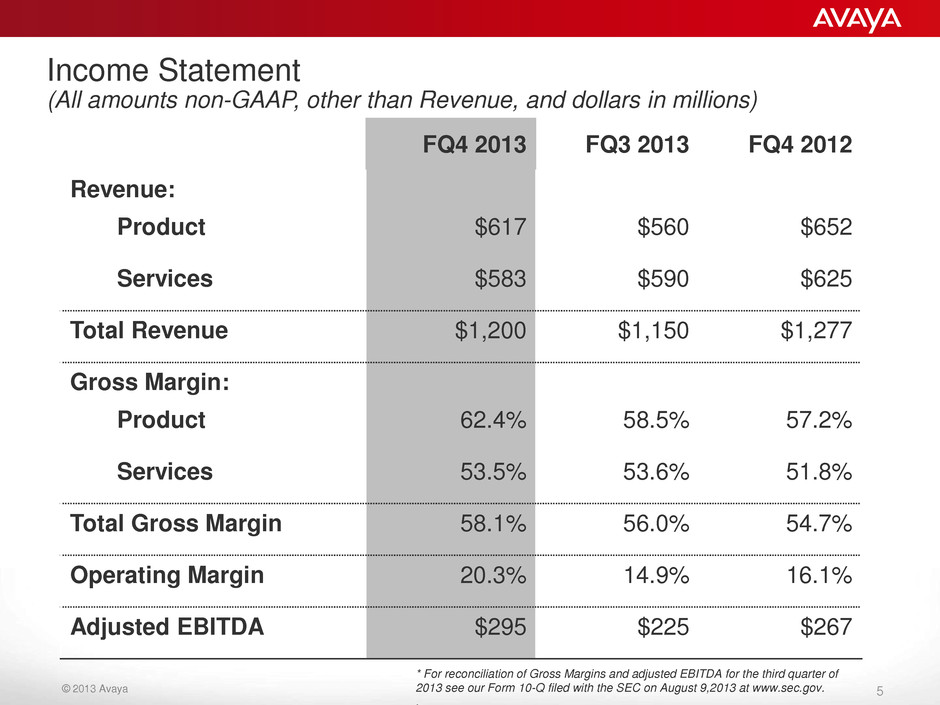
© 2013 Avaya 5 Income Statement (All amounts non-GAAP, other than Revenue, and dollars in millions) FQ4 2013 FQ3 2013 FQ4 2012 Revenue: Product $617 $560 $652 Services $583 $590 $625 Total Revenue $1,200 $1,150 $1,277 Gross Margin: Product 62.4% 58.5% 57.2% Services 53.5% 53.6% 51.8% Total Gross Margin 58.1% 56.0% 54.7% Operating Margin 20.3% 14.9% 16.1% Adjusted EBITDA $295 $225 $267 * For reconciliation of Gross Margins and adjusted EBITDA for the third quarter of 2013 see our Form 10-Q filed with the SEC on August 9,2013 at www.sec.gov. .
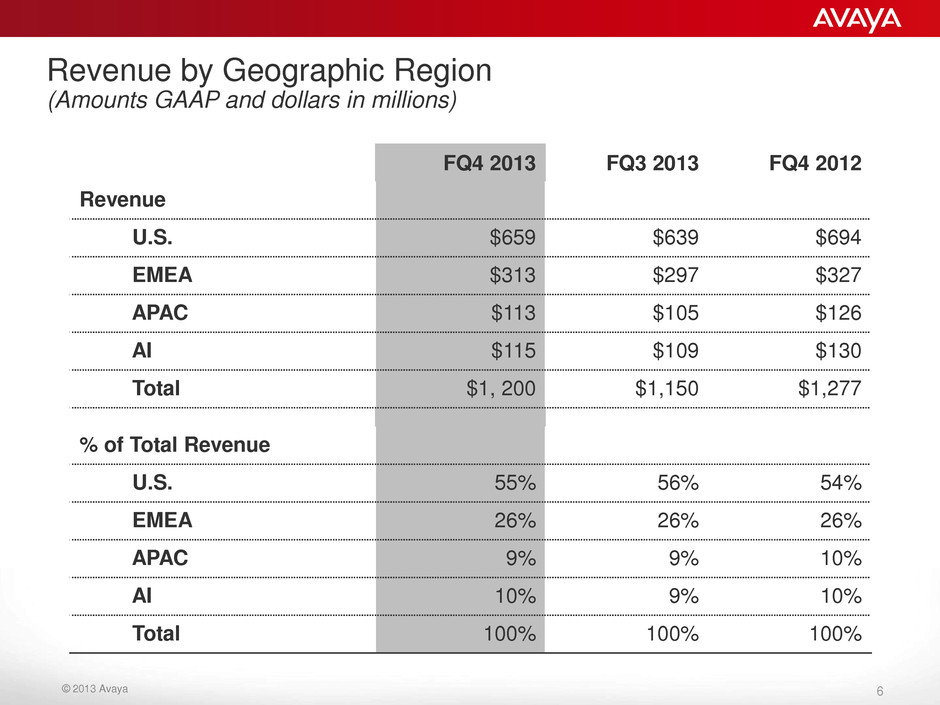
© 2013 Avaya 6 Revenue by Geographic Region (Amounts GAAP and dollars in millions) FQ4 2013 FQ3 2013 FQ4 2012 Revenue U.S. $659 $639 $694 EMEA $313 $297 $327 APAC $113 $105 $126 AI $115 $109 $130 Total $1, 200 $1,150 $1,277 % of Total Revenue U.S. 55% 56% 54% EMEA 26% 26% 26% APAC 9% 9% 10% AI 10% 9% 10% Total 100% 100% 100%
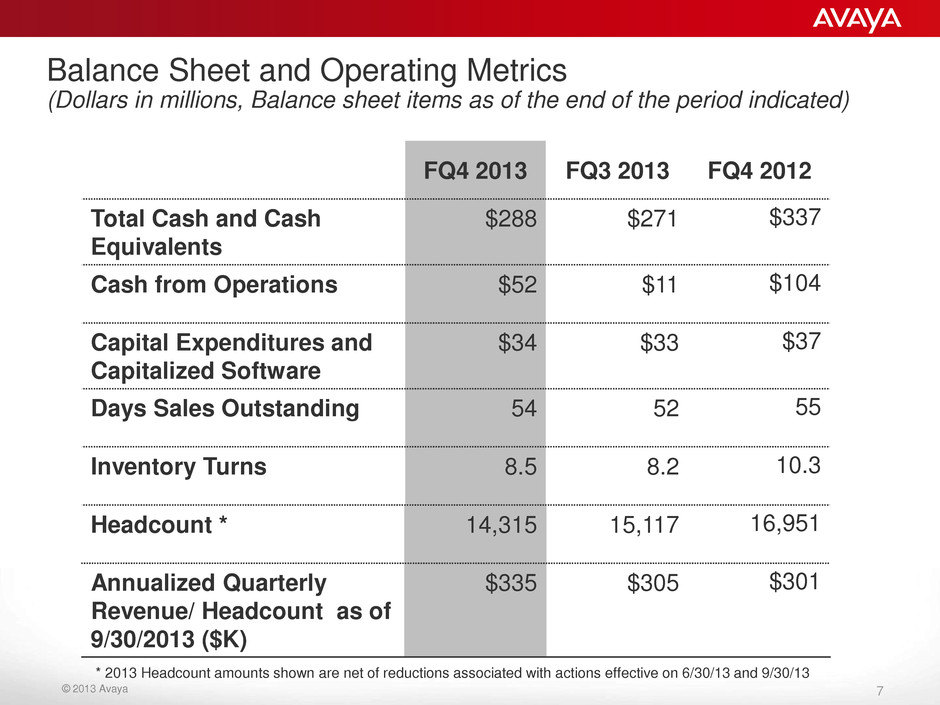
© 2013 Avaya 7 Balance Sheet and Operating Metrics (Dollars in millions, Balance sheet items as of the end of the period indicated) FQ4 2013 FQ3 2013 FQ4 2012 Total Cash and Cash Equivalents $288 $271 $337 Cash from Operations $52 $11 $104 Capital Expenditures and Capitalized Software $34 $33 $37 Days Sales Outstanding 54 52 55 Inventory Turns 8.5 8.2 10.3 Headcount * 14,315 15,117 16,951 Annualized Quarterly Revenue/ Headcount as of 9/30/2013 ($K) $335 $305 $301 * 2013 Headcount amounts shown are net of reductions associated with actions effective on 6/30/13 and 9/30/13
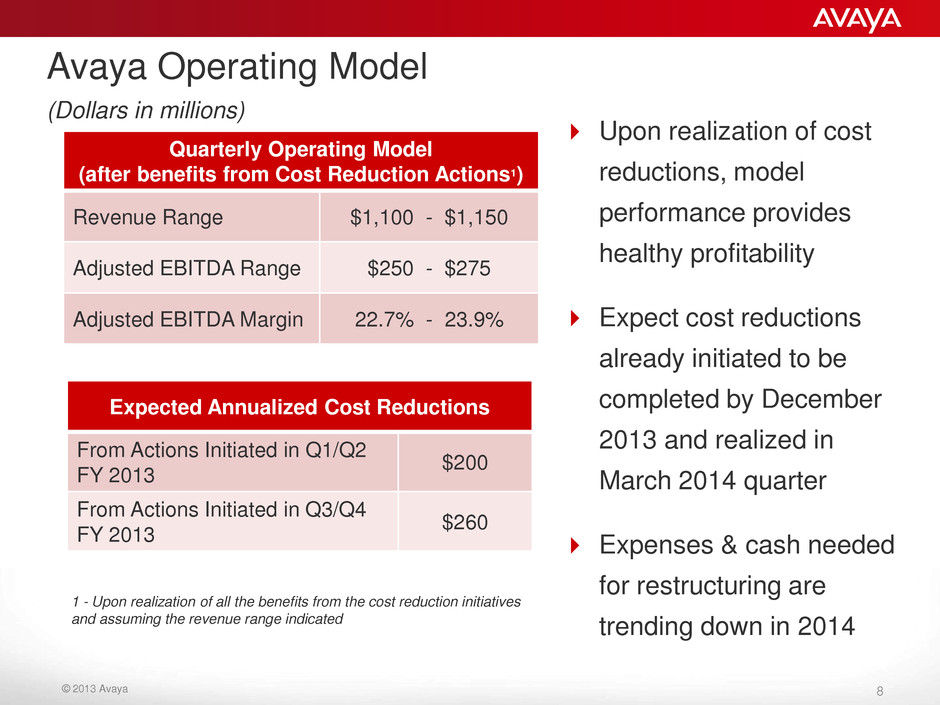
© 2013 Avaya 8 Avaya Operating Model (Dollars in millions) Quarterly Operating Model (after benefits from Cost Reduction Actions1) Revenue Range $1,100 - $1,150 Adjusted EBITDA Range $250 - $275 Adjusted EBITDA Margin 22.7% - 23.9% Expected Annualized Cost Reductions From Actions Initiated in Q1/Q2 FY 2013 $200 From Actions Initiated in Q3/Q4 FY 2013 $260 1 - Upon realization of all the benefits from the cost reduction initiatives and assuming the revenue range indicated Upon realization of cost reductions, model performance provides healthy profitability Expect cost reductions already initiated to be completed by December 2013 and realized in March 2014 quarter Expenses & cash needed for restructuring are trending down in 2014
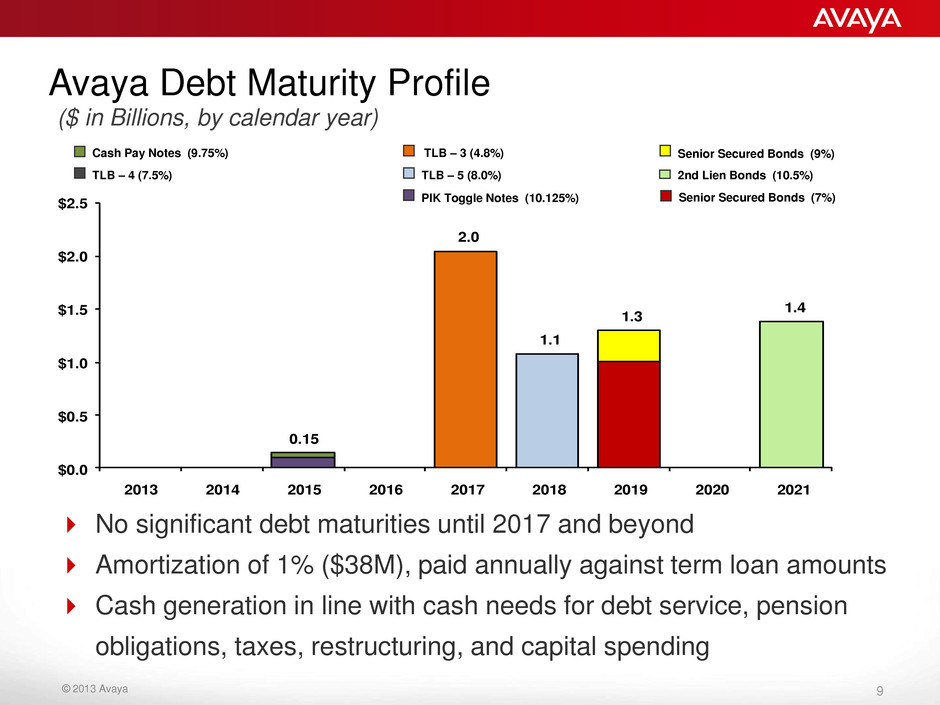
© 2013 Avaya 9 0.15 2.0 1.1 1.3 1.4 $0.0 $0.5 $1.0 $1.5 $2.0 $2.5 2013 2014 2015 2016 2017 2018 2019 2020 2021 Avaya Debt Maturity Profile ($ in Billions, by calendar year) Senior Secured Bonds (9%) Senior Secured Bonds (7%) Cash Pay Notes (9.75%) PIK Toggle Notes (10.125%) TLB – 5 (8.0%) TLB – 4 (7.5%) TLB – 3 (4.8%) 2nd Lien Bonds (10.5%) No significant debt maturities until 2017 and beyond Amortization of 1% ($38M), paid annually against term loan amounts Cash generation in line with cash needs for debt service, pension obligations, taxes, restructuring, and capital spending
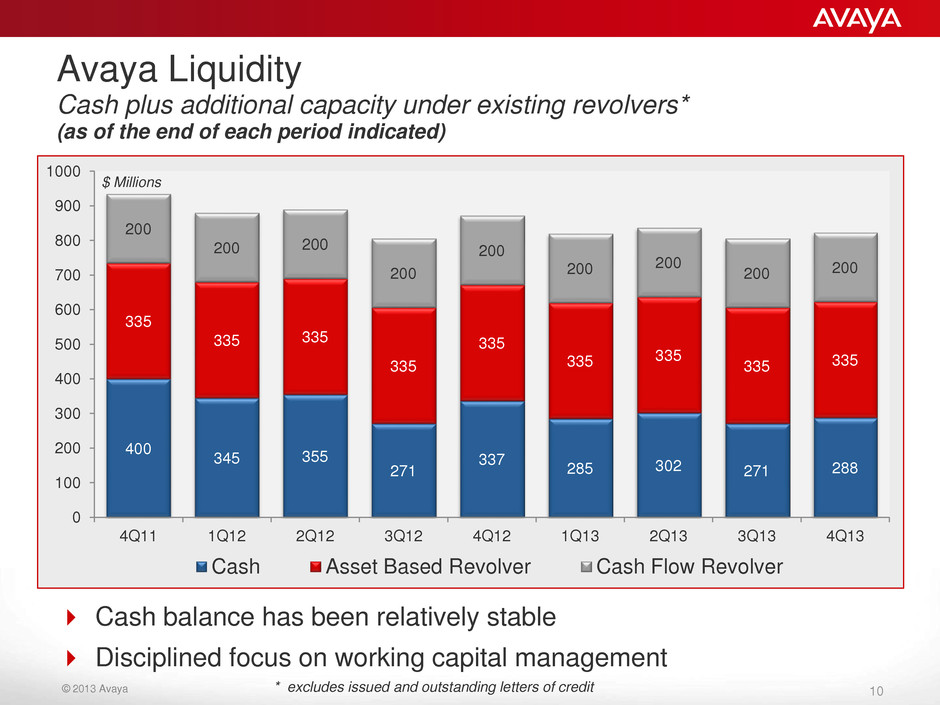
© 2013 Avaya 10 400 345 355 271 337 285 302 271 288 335 335 335 335 335 335 335 335 335 200 200 200 200 200 200 200 200 200 0 100 200 300 400 500 600 700 800 900 1000 4Q11 1Q12 2Q12 3Q12 4Q12 1Q13 2Q13 3Q13 4Q13 $ Millions Cash Asset Based Revolver Cash Flow Revolver Avaya Liquidity Cash plus additional capacity under existing revolvers* (as of the end of each period indicated) Cash balance has been relatively stable Disciplined focus on working capital management * excludes issued and outstanding letters of credit
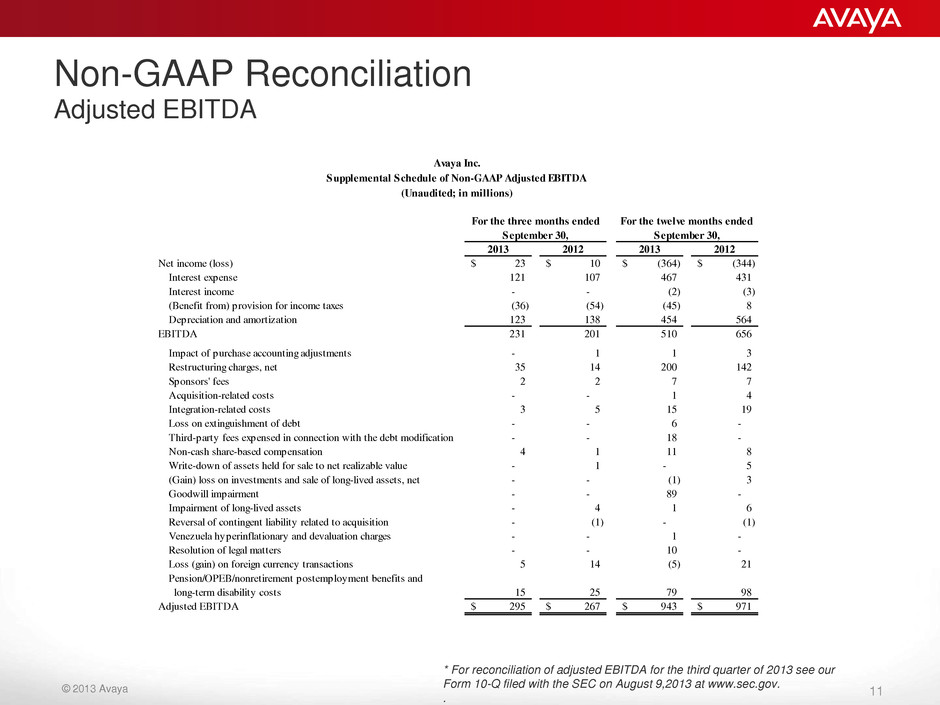
© 2013 Avaya 11 Non-GAAP Reconciliation Adjusted EBITDA * For reconciliation of adjusted EBITDA for the third quarter of 2013 see our Form 10-Q filed with the SEC on August 9,2013 at www.sec.gov. . 2013 2012 2013 2012 Net income (loss) 23$ 10$ (364)$ (344)$ Interest expense 121 107 467 431 Interest income - - (2) (3) (Benefit from) provision for income taxes (36) (54) (45) 8 Depreciation and amortization 123 138 454 564 231 201 510 656 Impact of purchase accounting adjustments - 1 1 3 Restructuring charges, net 35 14 200 142 Sponsors' fees 2 2 7 7 Acquisition-related costs - - 1 4 Integration-related costs 3 5 15 19 Loss on extinguishment of debt - - 6 - Third-party fees expensed in connection with the debt modification - - 18 - Non-cash share-based compensation 4 1 11 8 Write-down of assets held for sale to net realizable value - 1 - 5 (Gain) loss on investments and sale of long-lived assets, net - - (1) 3 Goodwill impairment - - 89 - Impairment of long-lived assets - 4 1 6 Reversal of contingent liability related to acquisition - (1) - (1) Venezuela hyperinflationary and devaluation charges - - 1 - Resolution of legal matters - - 10 - Loss (gain) on foreign currency transactions 5 14 (5) 21 Pension/OPEB/nonretirement postemployment benefits and long-term disability costs 15 25 79 98 Adjusted EBITDA 295$ 267$ 943$ 971$ EBITDA For the three months ended September 30, For the twelve months ended September 30, Avaya Inc. Supplemental Schedule of Non-GAAP Adjusted EBITDA (Unaudited; in millions)
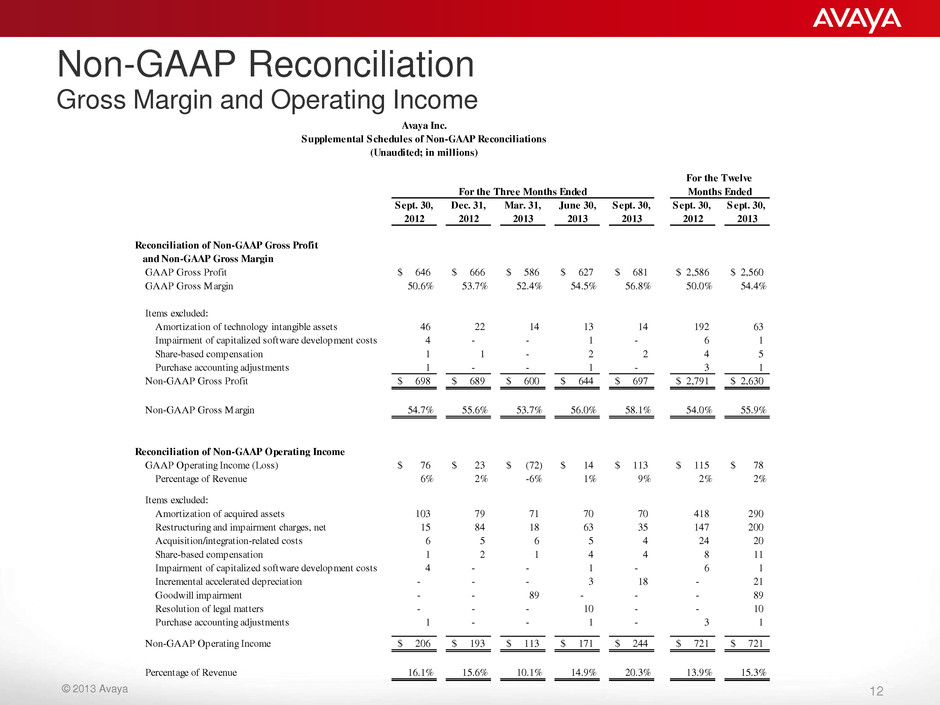
© 2013 Avaya 12 Non-GAAP Reconciliation Gross Margin and Operating Income Sept. 30, Dec. 31, Mar. 31, June 30, Sept. 30, Sept. 30, Sept. 30, 2012 2012 2013 2013 2013 2012 2013 GAAP Gross Profit 646$ 666$ 586$ 627$ 681$ 2,586$ 2,560$ GAAP Gross Margin 50.6% 53.7% 52.4% 54.5% 56.8% 50.0% 54.4% Items excluded: Amortization of technology intangible assets 46 22 14 13 14 192 63 Impairment of capitalized software development costs 4 - - 1 - 6 1 Share-based compensation 1 1 - 2 2 4 5 Purchase accounting adjustments 1 - - 1 - 3 1 Non-GAAP Gross Profit 698$ 689$ 600$ 644$ 697$ 2,791$ 2,630$ Non-GAAP Gross Margin 54.7% 55.6% 53.7% 56.0% 58.1% 54.0% 55.9% Reconciliation of Non-GAAP Operating Income GAAP Operating Income (Loss) 76$ 23$ (72)$ 14$ 113$ 115$ 78$ Percentage of Revenue 6% 2% -6% 1% 9% 2% 2% Items excluded: Amortization of acquired assets 103 79 71 70 70 418 290 Restructuring and impairment charges, net 15 84 18 63 35 147 200 Acquisition/integration-related costs 6 5 6 5 4 24 20 Share-based compensation 1 2 1 4 4 8 11 Impairment of capitalized software development costs 4 - - 1 - 6 1 Incremental accelerated depreciation - - - 3 18 - 21 Goodwill impairment - - 89 - - - 89 Resolution of legal matters - - - 10 - - 10 Purchase accounting adjustments 1 - - 1 - 3 1 Non-GAAP Operating Income 206$ 193$ 113$ 171$ 244$ 721$ 721$ Percentage of Revenue 16.1% 15.6% 10.1% 14.9% 20.3% 13.9% 15.3% Reconciliation of Non-GAAP Gross Profit and Non-GAAP Gross Margin Avaya Inc. Supplemental Schedules of Non-GAAP Reconciliations (Unaudited; in millions) For the Twelve Months EndedFor the Three Months Ended
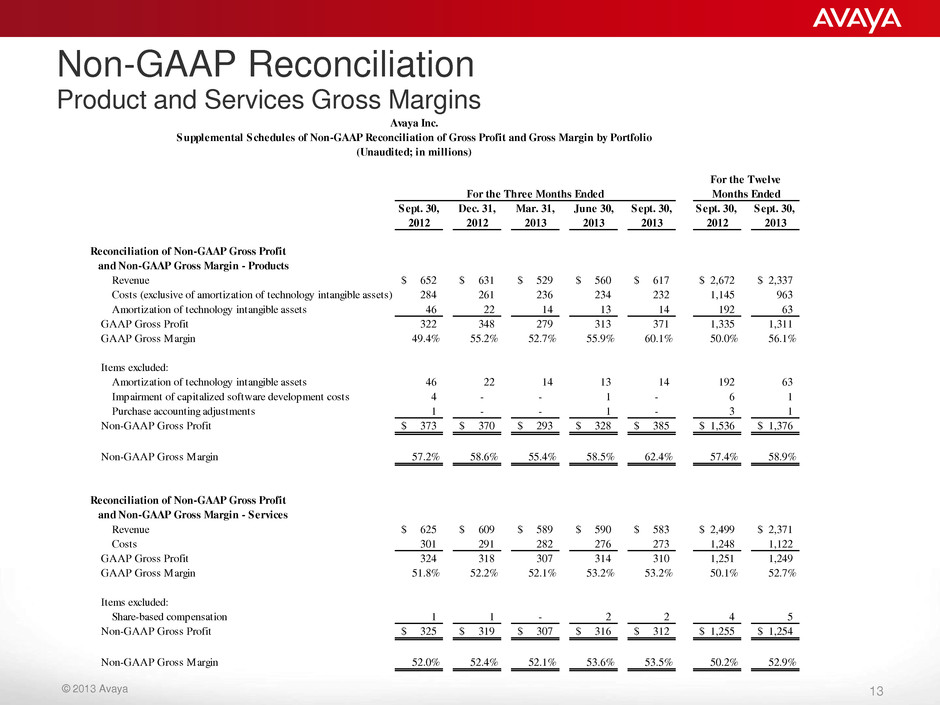
© 2013 Avaya 13 Non-GAAP Reconciliation Product and Services Gross Margins Sept. 30, Dec. 31, Mar. 31, June 30, Sept. 30, Sept. 30, Sept. 30, 2012 2012 2013 2013 2013 2012 2013 Revenue 652$ 631$ 529$ 560$ 617$ 2,672$ 2,337$ Costs (exclusive of amortization of technology intangible assets)ts (exclusive of amortization of technology intangible assets) 284 261 236 234 232 1,145 963 Amortization of technology intangible assetsortiz tion of technol gy intangible assets 46 22 14 13 14 192 63 GAAP Gross Profit 322 348 279 313 371 1,335 1,311 GAAP Gross Margin 49.4% 55.2% 52.7% 55.9% 60.1% 50.0% 56.1% Items excluded: Amortization of technology intangible assets 46 22 14 13 14 192 63 Impairment of capitalized software development costs 4 - - 1 - 6 1 Purchase accounting adjustments 1 - - 1 - 3 1 Non-GAAP Gross Profit 373$ 370$ 293$ 328$ 385$ 1,536$ 1,376$ Non-GAAP Gross Margin 57.2% 58.6% 55.4% 58.5% 62.4% 57.4% 58.9% Revenue 625$ 609$ 589$ 590$ 583$ 2,499$ 2,371$ Costs 301 291 282 276 273 1,248 1,122 GAAP Gross Profit 324 318 307 314 310 1,251 1,249 GAAP Gross Margin 51.8% 52.2% 52.1% 53.2% 53.2% 50.1% 52.7% Items excluded: Share-based compensation 1 1 - 2 2 4 5 Non-GAAP Gross Profit 325$ 319$ 307$ 316$ 312$ 1,255$ 1,254$ Non-GAAP Gross Margin 52.0% 52.4% 52.1% 53.6% 53.5% 50.2% 52.9% Reconciliation of Non-GAAP Gross Profit and Non-GAAP Gross Margin - Services Avaya Inc. Supplemental Schedules of Non-GAAP Reconciliation of Gross Profit and Gross Margin by Portfolio (Unaudited; in millions) For the Three Months Ended Reconciliation of Non-GAAP Gross Profit and Non-GAAP Gross Margin - Products For the Twelve Months Ended
