Attached files
| file | filename |
|---|---|
| 8-K - FORM 8-K - Virtu KCG Holdings LLC | d631862d8k.htm |
Exhibit 99.1
KCG Holdings, Inc. (NYSE: KCG) KBW Securities Brokerage & Market Structure Conference November 19, 2013
© 2013 KCG Proprietary and Confidential Safe Harbor Certain statements contained herein may constitute "forward-looking statements" within the meaning of the safe harbor provisions of the U.S. Private Securities Litigation Reform Act of 1995. Forward-looking statements are typically identified by words such as "believe," "expect," "anticipate," "intend," "target," "estimate," "continue," "positions," "prospects" or "potential," by future conditional verbs such as "will," "would," "should," "could" or "may," or by variations of such words or by similar expressions. These "forward-looking statements" are not historical facts and are based on current expectations, estimates and projections about KCG's industry, management beliefs and certain assumptions made by management, many of which, by their nature, are inherently uncertain and beyond our control. Any forward-looking statement contained herein speaks only as of the date on which it is made. We undertake no obligation to publicly update any forward-looking statement, whether written or oral, that may be made from time to time, whether as a result of new information, future developments or otherwise. Accordingly, readers are cautioned that any such forward-looking statements are not guarantees of future performance and are subject to certain risks, uncertainties and assumptions that are difficult to predict including, without limitation, risks associated with: (i) the strategic combination of Knight Capital Group, Inc. ("Knight") and GETCO Holding Company, LLC ("GETCO"), including, among other things, (a) difficulties and delays in integrating the Knight and GETCO businesses or fully realizing cost savings and other benefits, (b) the inability to sustain revenue and earnings growth, and (c) customer and client reactions; (ii) the August 1, 2012 technology issue that resulted in Knight's broker-dealer subsidiary sending numerous erroneous orders in NYSE-listed and NYSE Arca securities into the market and the impact to Knight's capital structure and business as well as actions taken in response thereto and consequences thereof; (iii) the costs and risks associated with the sale of Knight's institutional fixed income sales and trading business, the pending sale of KCG's reverse mortgage origination and securitization business and the departure of the managers of KCG's listed derivatives group; (iv) the ability of KCG's broker-dealer subsidiary to recover all or a portion of the damages that are attributable to the manner in which NASDAQ OMX handled the Facebook IPO; (v) changes in market structure, legislative, regulatory or financial reporting rules, including the continuing legislative and regulatory scrutiny of high-frequency trading; (vi) past or future changes to organizational structure and management; (vii) KCG's ability to develop competitive new products and services in a timely manner and the acceptance of such products and services by KCG's customers and potential customers; (viii) KCG's ability to keep up with technological changes; (ix) KCG's ability to effectively identify and manage market risk, operational risk, legal risk, liquidity risk, reputational risk, counterparty risk, international risk, regulatory risk, and compliance risk; (x) the cost and other effects of material contingencies, including litigation contingencies, and any adverse judicial, administrative or arbitral rulings or proceedings; and (xi) the effects of increased competition and KCG's ability to maintain and expand market share. The list above is not exhaustive. Readers should carefully review the risks and uncertainties disclosed in KCG's and Knight's reports with the SEC, including, without limitation, those detailed under "Certain Factors Affecting Results of Operations" in KCG's Quarterly Report on Form 10-Q for the period ended September 30, 2013, under "Risk Factors" in Knight's Annual Report on Form 10-K for the year-ended December 31, 2012 and the Current Report on Form 8-K filed by KCG on August 9, 2013 and November 12, 2013, respectively, and in other reports or documents KCG files with, or furnishes to, the SEC from time to time. For additional disclosures, please see https://www.kcg.com/legal/global-disclosures.
© 2013 KCG Proprietary and Confidential Contents About KCG 4 Accelerated timetable to cost synergies 5 Integration updates 6 - Market Making - Global Execution Services Additive savings from debt reduction 8 Balance sheet 9 Market conditions 10 Investment rationale 11 Addendum 12 - Regulation G reconciliations
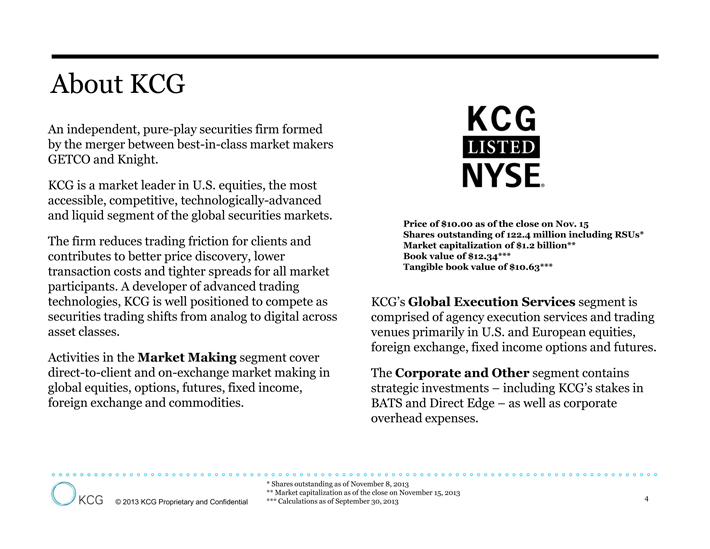
© 2013 KCG Proprietary and Confidential About KCG An independent, pure-play securities firm formed by the merger between best-in-class market makers GETCO and Knight. KCG is a market leader in U.S. equities, the most accessible, competitive, technologically-advanced and liquid segment of the global securities markets. The firm reduces trading friction for clients and contributes to better price discovery, lower transaction costs and tighter spreads for all market participants. A developer of advanced trading technologies, KCG is well positioned to compete as securities trading shifts from analog to digital across asset classes. Activities in the Market Making segment cover direct-to-client and on-exchange market making in global equities, options, futures, fixed income, foreign exchange and commodities. Price of $10.00 as of the close on Nov. 15 Shares outstanding of 122.4 million including RSUs* Market capitalization of $1.2 billion** Book value of $12.34*** Tangible book value of $10.63*** KCG’s Global Execution Services segment is comprised of agency execution services and trading venues primarily in U.S. and European equities, foreign exchange, fixed income options and futures. The Corporate and Other segment contains strategic investments – including KCG’s stakes in BATS and Direct Edge – as well as corporate overhead expenses. 4 * Shares outstanding as of November 8, 2013 ** Market capitalization as of the close on November 15, 2013 *** Calculations as of September 30, 2013
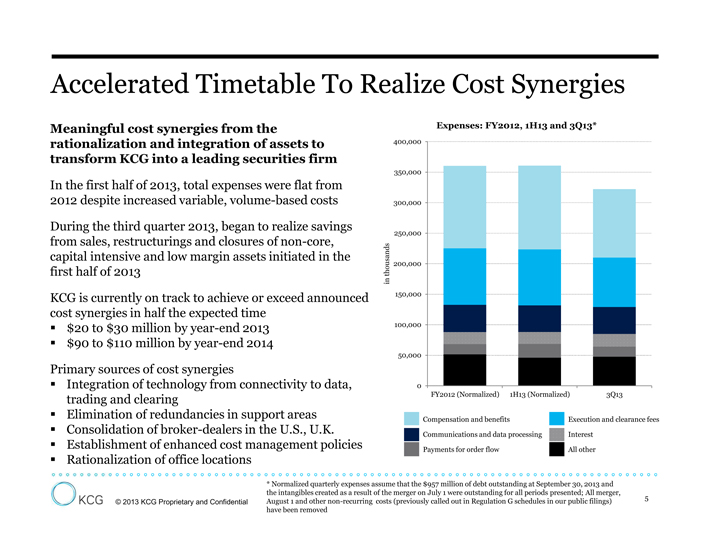
© 2013 KCG Proprietary and Confidential Accelerated Timetable To Realize Cost Synergies Meaningful cost synergies from the rationalization and integration of assets to transform KCG into a leading securities firm In the first half of 2013, total expenses were flat from 2012 despite increased variable, volume-based costs During the third quarter 2013, began to realize savings from sales, restructurings and closures of non-core, capital intensive and low margin assets initiated in the first half of 2013 KCG is currently on track to achieve or exceed announced cost synergies in half the expected time ??$20 to $30 million by year-end 2013 ??$90 to $110 million by year-end 2014 Primary sources of cost synergies ??Integration of technology from connectivity to data, trading and clearing ??Elimination of redundancies in support areas ??Consolidation of broker-dealers in the U.S., U.K. ??Establishment of enhanced cost management policies ??Rationalization of office locations 5 * Normalized quarterly expenses assume that the $957 million of debt outstanding at September 30, 2013 and the intangibles created as a result of the merger on July 1 were outstanding for all periods presented; All merger, August 1 and other non-recurring costs (previously called out in Regulation G schedules in our public filings) have been removed 0 50,000 100,000 150,000 200,000 250,000 300,000 350,000 400,000 FY2012 (Normalized) 1H13 (Normalized) 3Q13 in thousands Expenses: FY2012, 1H13 and 3Q13* Compensation and benefits Execution and clearance fees Communications and data processing Interest Payments for order flow All other
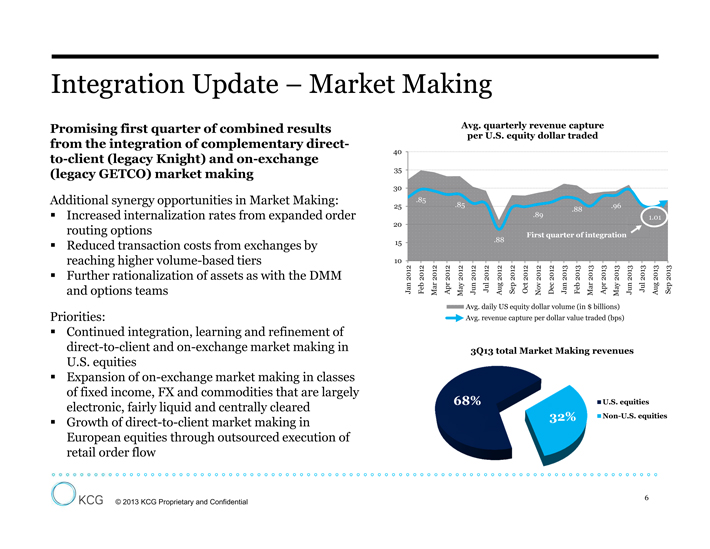
© 2013 KCG Proprietary and Confidential Integration Update – Market Making Promising first quarter of combined results from the integration of complementary directto- client (legacy Knight) and on-exchange (legacy GETCO) market making Additional synergy opportunities in Market Making: ??Increased internalization rates from expanded order routing options ??Reduced transaction costs from exchanges by reaching higher volume-based tiers ??Further rationalization of assets as with the DMM and options teams Priorities: ??Continued integration, learning and refinement of direct-to-client and on-exchange market making in U.S. equities ??Expansion of on-exchange market making in classes of fixed income, FX and commodities that are largely electronic, fairly liquid and centrally cleared ??Growth of direct-to-client market making in European equities through outsourced execution of retail order flow 6 .85 .85 .88 .89 .88 .96 1.01 10 15 20 25 30 35 40 Jan 2012 Feb 2012 Mar 2012 Apr 2012 May 2012 Jun 2012 Jul 2012 Aug 2012 Sep 2012 Oct 2012 Nov 2012 Dec 2012 Jan 2013 Feb 2013 Mar 2013 Apr 2013 May 2013 Jun 2013 Jul 2013 Aug 2013 Sep 2013 Avg. quarterly revenue capture per U.S. equity dollar traded Avg. daily US equity dollar volume (in $ billions) Avg. revenue capture per dollar value traded (bps) First quarter of integration 68% 32% 3Q13 total Market Making revenues U.S. equities Non-U.S. equities
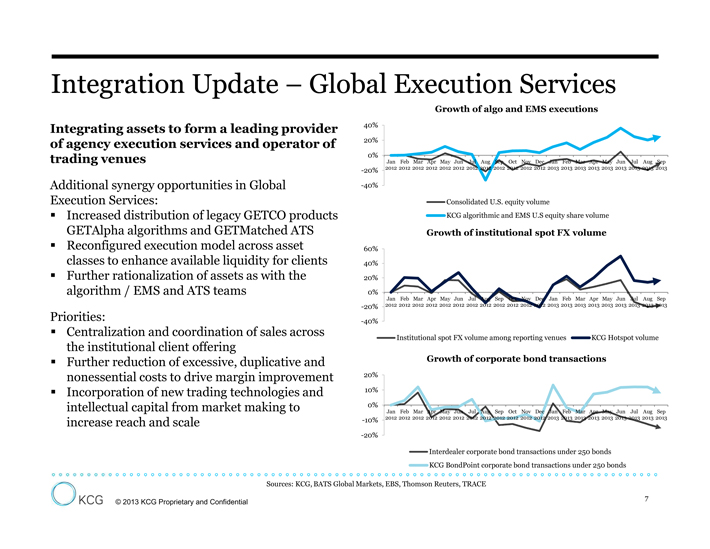
© 2013 KCG Proprietary and Confidential Integration Update – Global Execution Services Integrating assets to form a leading provider of agency execution services and operator of trading venues Additional synergy opportunities in Global Execution Services: ??Increased distribution of legacy GETCO products GETAlpha algorithms and GETMatched ATS ??Reconfigured execution model across asset classes to enhance available liquidity for clients ??Further rationalization of assets as with the algorithm / EMS and ATS teams Priorities: ??Centralization and coordination of sales across the institutional client offering ??Further reduction of excessive, duplicative and nonessential costs to drive margin improvement ??Incorporation of new trading technologies and intellectual capital from market making to increase reach and scale -40% -20% 0% 20% 40% Jan 2012 Feb 2012 Mar 2012 Apr 2012 May 2012 Jun 2012 Jul 2012 Aug 2012 Sep 2012 Oct 2012 Nov 2012 Dec 2012 Jan 2013 Feb 2013 Mar 2013 Apr 2013 May 2013 Jun 2013 Jul 2013 Aug 2013 Sep 2013 Growth of algo and EMS executions Consolidated U.S. equity volume KCG algorithmic and EMS U.S equity share volume -40% -20% 0% 20% 40% 60% Jan 2012 Feb 2012 Mar 2012 Apr 2012 May 2012 Jun 2012 Jul 2012 Aug 2012 Sep 2012 Oct 2012 Nov 2012 Dec 2012 Jan 2013 Feb 2013 Mar 2013 Apr 2013 May 2013 Jun 2013 Jul 2013 Aug 2013 Sep 2013 Growth of institutional spot FX volume Institutional spot FX volume among reporting venues KCG Hotspot volume -20% -10% 0% 10% 20% Jan 2012 Feb 2012 Mar 2012 Apr 2012 May 2012 Jun 2012 Jul 2012 Aug 2012 Sep 2012 Oct 2012 Nov 2012 Dec 2012 Jan 2013 Feb 2013 Mar 2013 Apr 2013 May 2013 Jun 2013 Jul 2013 Aug 2013 Sep 2013 Growth of corporate bond transactions Interdealer corporate bond transactions under 250 bonds KCG BondPoint corporate bond transactions under 250 bonds 7 Sources: KCG, BATS Global Markets, EBS, Thomson Reuters, TRACE
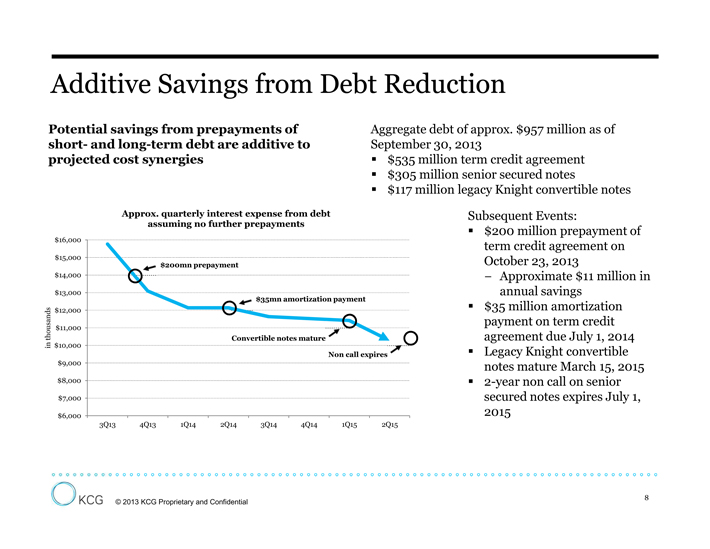
© 2013 KCG Proprietary and Confidential Additive Savings from Debt Reduction Potential savings from prepayments of short- and long-term debt are additive to projected cost synergies Aggregate debt of approx. $957 million as of September 30, 2013 ??$535 million term credit agreement ??$305 million senior secured notes ??$117 million legacy Knight convertible notes Subsequent Events: ??$200 million prepayment of term credit agreement on October 23, 2013 ? Approximate $11 million in annual savings ??$35 million amortization payment on term credit agreement due July 1, 2014 ??Legacy Knight convertible notes mature March 15, 2015 ??2-year non call on senior secured notes expires July 1, 2015 8 $6,000 $7,000 $8,000 $9,000 $10,000 $11,000 $12,000 $13,000 $14,000 $15,000 $16,000 3Q13 4Q13 1Q14 2Q14 3Q14 4Q14 1Q15 2Q15 in thousands Approx. quarterly interest expense from debt assuming no further prepayments $35mn amortization payment $200mn prepayment Convertible notes mature Non call expires
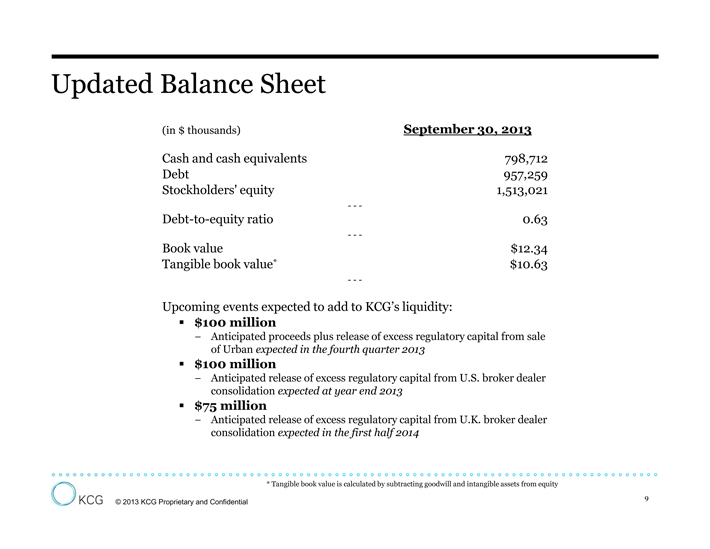
© 2013 KCG Proprietary and Confidential (in $ thousands) September 30, 2013 Cash and cash equivalents 798,712 Debt 957,259 Stockholders' equity 1,513,021 - - - Debt-to-equity ratio 0.63 - - - Book value $12.34 Tangible book value* $10.63 - - - Upcoming events expected to add to KCG’s liquidity: ??$100 million ? Anticipated proceeds plus release of excess regulatory capital from sale of Urban expected in the fourth quarter 2013 ??$100 million ? Anticipated release of excess regulatory capital from U.S. broker dealer consolidation expected at year end 2013 ??$75 million ? Anticipated release of excess regulatory capital from U.K. broker dealer consolidation expected in the first half 2014 Updated Balance Sheet * Tangible book value is calculated by subtracting goodwill and intangible assets from equity 9
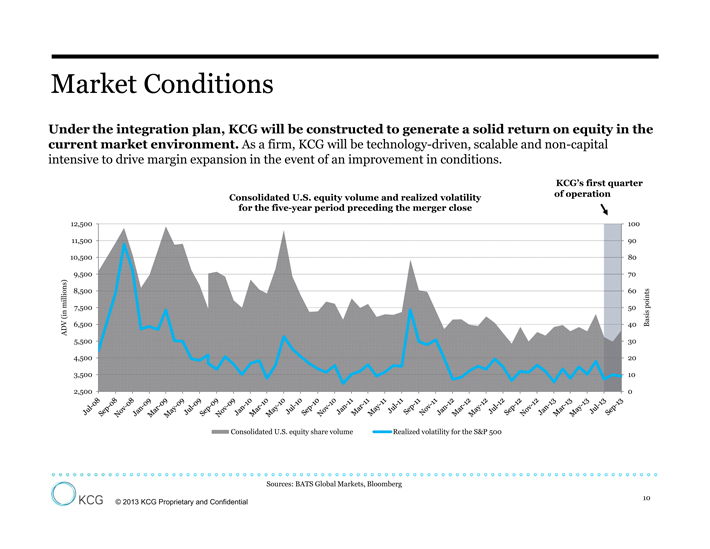
© 2013 KCG Proprietary and Confidential Market Conditions 10 0 10 20 30 40 50 60 70 80 90 100 2,500 3,500 4,500 5,500 6,500 7,500 8,500 9,500 10,500 11,500 12,500 Basis points ADV (in millions) Consolidated U.S. equity volume and realized volatility for the five-year period preceding the merger close Consolidated U.S. equity share volume Realized volatility for the S&P 500 Under the integration plan, KCG will be constructed to generate a solid return on equity in the current market environment. As a firm, KCG will be technology-driven, scalable and non-capital intensive to drive margin expansion in the event of an improvement in conditions. KCG’s first quarter of operation Sources: BATS Global Markets, Bloomberg
© 2013 KCG Proprietary and Confidential Investment Rationale ??A market leader in U.S. equities and developer of advanced trading technologies ??Profitable on an operating basis in the first quarter as a combined firm ??Accelerated timetable to realize projected cost synergies and an aggressive debt reduction plan ??Strong cash generation and increasing diversification of revenues across asset classes ??Currently trading at a discount to tangible book value 11
© 2013 KCG Proprietary and Confidential Addendum
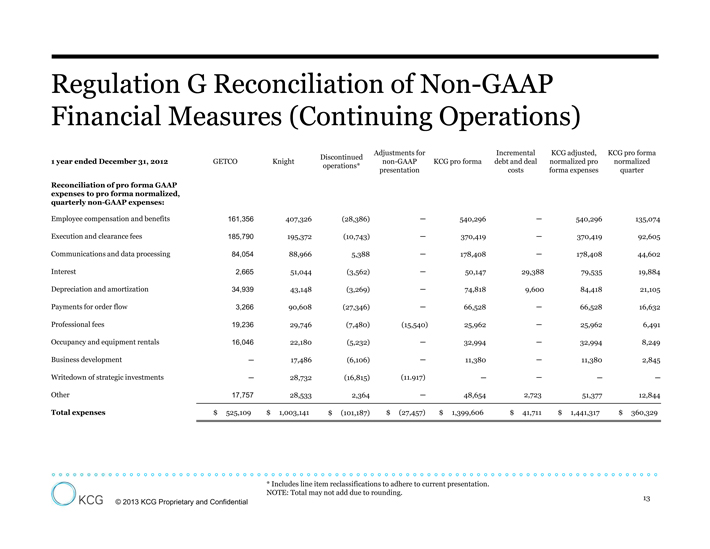
© 2013 KCG Proprietary and Confidential Regulation G Reconciliation of Non-GAAP Financial Measures (Continuing Operations) 13 1 year ended December 31, 2012 GETCO Knight Discontinued operations* Adjustments for non-GAAP presentation KCG pro forma Incremental debt and deal costs KCG adjusted, normalized pro forma expenses KCG pro forma normalized quarter Reconciliation of pro forma GAAP expenses to pro forma normalized, quarterly non-GAAP expenses: Employee compensation and benefits 161,356 407,326 (28,386) ? 540,296 ? 540,296 135,074 Execution and clearance fees 185,790 195,372 (10,743) ? 370,419 ? 370,419 92,605 Communications and data processing 84,054 88,966 5,388 ? 178,408 ? 178,408 44,602 Interest 2,665 51,044 (3,562) ? 50,147 29,388 79,535 19,884 Depreciation and amortization 34,939 43,148 (3,269) ? 74,818 9,600 84,418 21,105 Payments for order flow 3,266 90,608 (27,346) ? 66,528 ? 66,528 16,632 Professional fees 19,236 29,746 (7,480) (15,540) 25,962 ? 25,962 6,491 Occupancy and equipment rentals 16,046 22,180 (5,232) ? 32,994 ? 32,994 8,249 Business development ? 17,486 (6,106) ? 11,380 ? 11,380 2,845 Writedown of strategic investments ? 28,732 (16,815) (11.917) ? ? ? ? Other 17,757 28,533 2,364 ? 48,654 2,723 51,377 12,844 Total expenses $ 525,109 $ 1,003,141 $ (101,187) $ (27,457) $ 1,399,606 $ 41,711 $ 1,441,317 $ 360,329 * Includes line item reclassifications to adhere to current presentation. NOTE: Total may not add due to rounding.
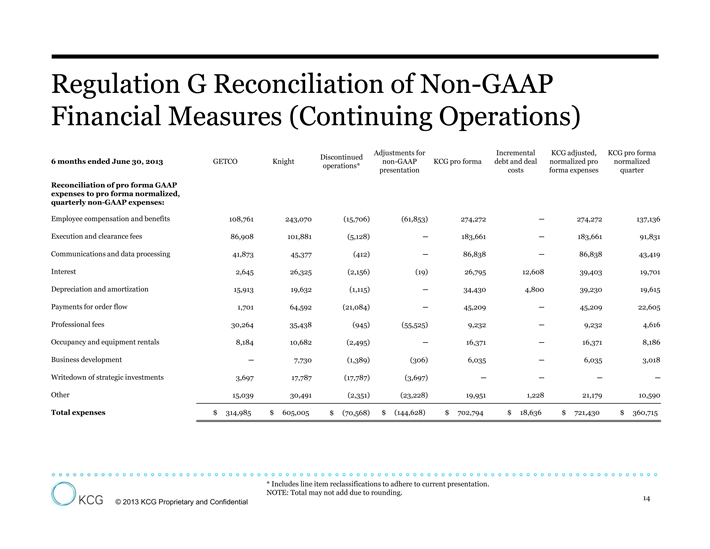
© 2013 KCG Proprietary and Confidential Regulation G Reconciliation of Non-GAAP Financial Measures (Continuing Operations) 14 6 months ended June 30, 2013 GETCO Knight Discontinued operations* Adjustments for non-GAAP presentation KCG pro forma Incremental debt and deal costs KCG adjusted, normalized pro forma expenses KCG pro forma normalized quarter Reconciliation of pro forma GAAP expenses to pro forma normalized, quarterly non-GAAP expenses: Employee compensation and benefits 108,761 243,070 (15,706) (61,853) 274,272 ? 274,272 137,136 Execution and clearance fees 86,908 101,881 (5,128) ? 183,661 ? 183,661 91,831 Communications and data processing 41,873 45,377 (412) ? 86,838 ? 86,838 43,419 Interest 2,645 26,325 (2,156) (19) 26,795 12,608 39,403 19,701 Depreciation and amortization 15,913 19,632 (1,115) ? 34,430 4,800 39,230 19,615 Payments for order flow 1,701 64,592 (21,084) ? 45,209 ? 45,209 22,605 Professional fees 30,264 35,438 (945) (55,525) 9,232 ? 9,232 4,616 Occupancy and equipment rentals 8,184 10,682 (2,495) ? 16,371 ? 16,371 8,186 Business development ? 7,730 (1,389) (306) 6,035 ? 6,035 3,018 Writedown of strategic investments 3,697 17,787 (17,787) (3,697) ? ? ? ? Other 15,039 30,491 (2,351) (23,228) 19,951 1,228 21,179 10,590 Total expenses $ 314,985 $ 605,005 $ (70,568) $ (144,628) $ 702,794 $ 18,636 $ 721,430 $ 360,715 * Includes line item reclassifications to adhere to current presentation. NOTE: Total may not add due to rounding.
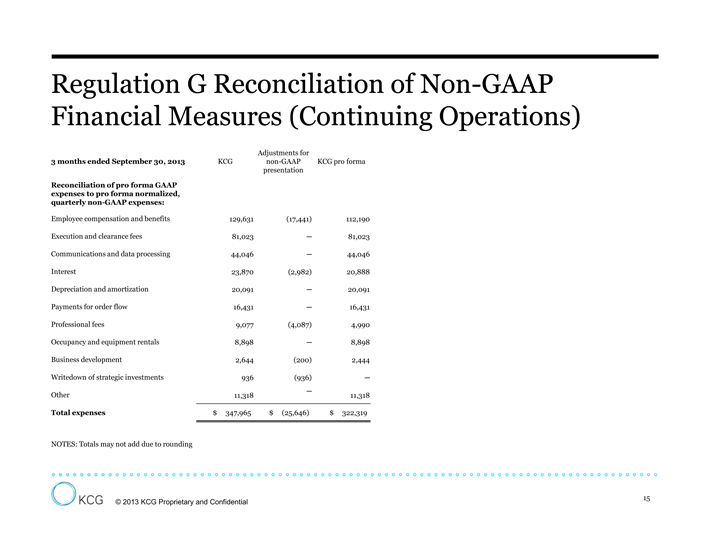
© 2013 KCG Proprietary and Confidential Regulation G Reconciliation of Non-GAAP Financial Measures (Continuing Operations) 15 3 months ended September 30, 2013 KCG Adjustments for non-GAAP presentation KCG pro forma Reconciliation of pro forma GAAP expenses to pro forma normalized, quarterly non-GAAP expenses: Employee compensation and benefits 129,631 (17,441) 112,190 Execution and clearance fees 81,023 ? 81,023 Communications and data processing 44,046 ? 44,046 Interest 23,870 (2,982) 20,888 Depreciation and amortization 20,091 ? 20,091 Payments for order flow 16,431 ? 16,431 Professional fees 9,077 (4,087) 4,990 Occupancy and equipment rentals 8,898 ? 8,898 Business development 2,644 (200) 2,444 Writedown of strategic investments 936 (936) ? Other 11,318 ? 11,318 Total expenses $ 347,965 $ (25,646) $ 322,319 NOTES: Totals may not add due to rounding