Attached files
| file | filename |
|---|---|
| 8-K - FORM 8-K - SEALED AIR CORP/DE | d629788d8k.htm |
 Lender Presentation
November 18, 2013
Carol P. Lowe –
Senior Vice President & CFO
Tod S. Christie –
Treasurer
Exhibit 99.1 |
| Safe Harbor and Regulation G Statement
2
This presentation contains “forward-looking statements” within the meaning of the Private
Securities Litigation Reform Act of 1995. Forward-looking statements can be identified by
such words as “anticipates,” “believes,” “plan,” “assumes,”
“could,” “estimates,” “expects,” “intends,” “may,”
“plans to,” “will” and similar expressions. These statements reflect our
beliefs and expectations as to future events and trends affecting our business, our consolidated
financial position and our results of operations. Examples of these forward-looking
statements include expectations regarding our anticipated effective income tax rate, the
potential cash tax benefits associated with the W.R. Grace settlement, potential volume,
revenue and operating growth for future periods, expectations and assumptions associated with our
restructuring programs, availability and pricing of raw materials, success of our growth
initiatives, economic conditions, and the success of pricing actions. A variety of factors
may cause actual results to differ materially from these expectations, including general
domestic and international economic and political conditions; changes in our raw material and energy costs; credit
ratings; the success of restructuring plans; currency translation and devaluation effects, including
Venezuela; the competitive environment; the effects of animal and food-related health
issues; environmental matters; and regulatory actions and legal matters. For more
extensive information, see “Risk Factors” and “Cautionary Notice Regarding
Forward-Looking Statements,” which appear in our most recent Annual Report on Form 10-K,
as filed with the Securities and Exchange Commission, and as revised and updated by our
Quarterly Reports on Form 10-Q and Current Reports on Form 8-K. While we may elect to
update these forward-looking statements at some point in the future, we specifically
disclaim any obligation to do so, whether as a result of new information, future events, or otherwise.
Our management uses non-U.S. GAAP financial measures to evaluate the Company’s performance,
which exclude items we consider unusual or special items. We believe the use of such financial
measures and information may be useful to investors. We believe that the use of non-U.S.
GAAP measures helps investors to gain a better understanding of core operating results and
future prospects, consistent with how management measures and forecasts the Company's
performance, especially when comparing such results to previous periods or forecasts. For important
information on our use of non-U.S. GAAP financial measures and information, including
reconciliations of such non-U.S. GAAP financial measures and information to comparable U.S.
GAAP measures and information, please refer to the financial tables and information provided in
our earnings release. |
 Sealed Air Overview |
 A
Company Focused on Sustainability WHO WE ARE
We Re-imagine™
the industries we serve to create a world that feels, tastes and works better.
We deliver consistent, superior solutions in:
4
We help sustain healthy communities by ensuring the safety and
quality of what people eat and drink by creating sustainable
innovative solutions. These solutions provide measurable results
to our business partners through increased shelf life, food
safety, operational efficiency and help in building their brands.
We help our customers win by minimizing damage, maximizing
efficiency and reducing cost with sustainable, engineered,
protective packaging solutions.
We create a cleaner and a healthier future by delivering to
customers integrated sustainable solutions that drive operational
efficiency, improve performance, protect brands and enhance
end user experience and satisfaction.
(~49% of sales)
(~21% of sales)
(~28% of sales) |
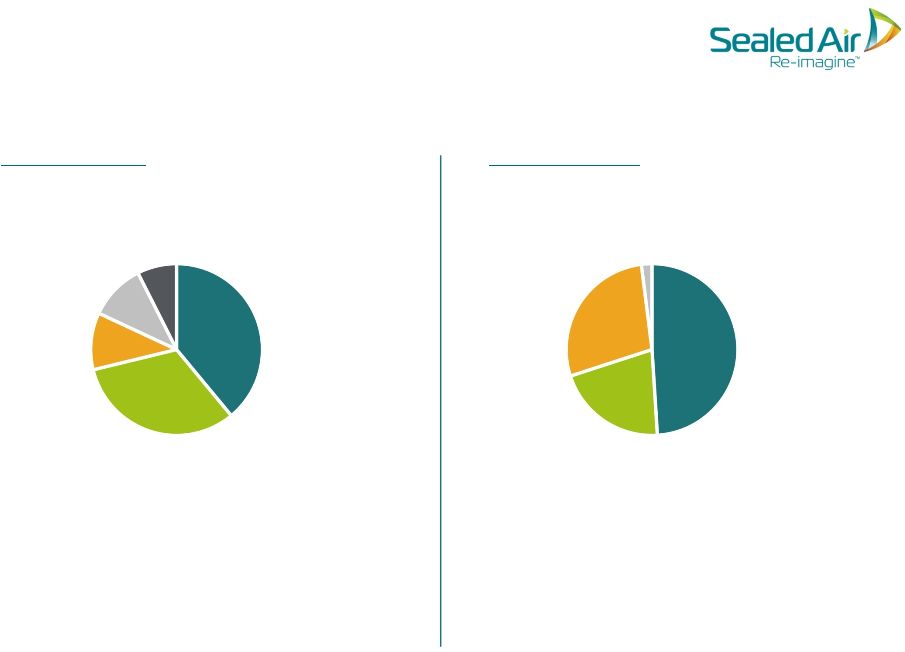 JANZ
7%
AMAT
11%
Latin
America
11%
Europe
32%
North
America
39%
Other
2%
Diversey
Care
28%
Product
Care
21%
Food
Care
49%
(2)
(1)
LTM $7.7B Diversified Revenue Base
By Geography
By Businesses
5
(1)
Asia, Middle East, Africa and Turkey.
(2)
Japan, Australia, and New Zealand. |
 Net
Sales (1)
Credit Facility EBITDA
(1)
LTM Net Sales: $7,729M
LTM Credit Facility EBITDA:
$1,090M
% of
Net Sales
(2)
12.7%
11.9%
14.7%
13.8%
13.1%
14.3%
14.5%
6
Discontinued Operations
Discontinued Operations
Net Sales and Credit Facility EBITDA
$235
$229
$279
$273
$8
$14
$13
$13
$243
$243
$292
$286
$242
$281
$281
Q1'12
Q2'12
Q3'12
Q4'12
Q1'13
Q2'13
Q3'13
$1,845
$1,924
$1,900
$73
$80
$79
$1,918
$2,004
$1,979
$1,978
$1,853
$1,962
$1,936
Q1'12
Q2'12
Q3'12
Q4'12
Q1'13
Q2'13
Q3'13
($ in million)
Note: Credit Facility EBITDA defined by Credit Facility agreement. Diversey Japan was divested during
Q4 2012 and classified as discontinued operations during Q3 2012.
(1) Includes the results of the rigid medical packaging business. Please see Sealed Air’s
November 13, 2013 press release for information about the sale of this business.
(2) Credit Facility EBITDA as a percentage of continuing operations / reported net sales. |
 UPDATE ON RESTRUCTURING PROGRAMS
Realigning Cost Structure
RESTRUCTURING
PROGRAMS
2012 –
2014
INTEGRATION &
OPTIMIZATION
2013 –
2015
EARNINGS QUALITY
IMPROVEMENT
Annualized Cost
Synergies and
Savings
Over $200M compared
to 2011
$80 -
$110M compared
to 2012
Estimated Time of
Completion
End of 2014
End of 2015
Total Costs of
Program
Approx. $240M
(Excl. Approx. $30M
capex)
$130 -
$150M
(Excl. Approx. $50M
capex)
Employee Head
Count Reduction
Approx. 1,700
Approx. 450
7 |
 Financial Overview |
 Key
Takeaways THIRD QUARTER 2013
9
Q3 Performance Summary
•
Sales $1.9B
–
Up 2.0% as reported
–
Up 2.7% constant currency
–
Volume increased 1.2%
–
Price/mix favorable 1.5%
•
Adj. EBITDA: $282M, 14.6% of sales
Excluding SARs expense:
•
Q3 2013 Adj. EBITDA: $290.7M, 15.0% of sales
•
Q3 2012 Adj. EBITDA: $277.5M, 14.6% of sales
•
Delivered year over year constant currency
sales growth in all regions except for
Europe
•
Developing regions constant currency sales
increased 9%, accounting for 26% of total
net sales
•
Favorable product price/mix across all
divisions and all regions, except Europe
•
EBITDA margin expansion due to higher
volumes and cost savings initiatives
•
Core Tax Rate of 23.3%
Reported U.S. GAAP Measures
Q3-13 Net Sales: $1.9B; Operating Profit: $140M
Q3-12 Net Sales: $1.9B; Operating Loss*: ($1.2B)
Q3-13 Effective tax rate: 24.6%
*Includes impairment of goodwill and certain intangible assets associated with the
Diversey acquisition Please see Sealed Air’s 10-Q filed on November 8, 2013 for
important information about the use of non-U.S. GAAP financial measures, including
applicable reconciliations to U.S. GAAP financial measures. |
 Q3
2013 Net Sales Bridge ($ in millions)
Foreign
Exchange
Price/Mix
-15
Q3 2012
Net Sales
Q3 2013
Net Sales
Volume
10
1,936
+23
+28
+2%
1,900 |
 11
Q3 2013 Adj. EBITDA Bridge
($ in millions)
Please see Sealed Air’s 10-Q filed on November 8, 2013 for important
information about the use of non-U.S. GAAP financial measures, including applicable
reconciliations to U.S. GAAP financial measures.
0
-6
-13
-1
6
+2.7%
275
22
282
Q3 2012
Adj.
EBITDA
Cost
Synergies
Volume
Mix & Price/
Cost Spread
SG&A/
Other
SARs
Foreign
Exchange
Q3 2013
Adj.
EBITDA |
 SIGNIFICANT YoY IMPROVEMENT
YTD Free Cash Flow
12
($ in millions)
($ in millions)
Nine Months Ended
September 30,
Free Cash Flow
2012
2013
U.S. GAAP Cash Flow from
Operating Activities
$ 65
$ 278
Capital Expenditures
(98)
(80)
Free Cash Flow
$ (33)
$ 198
2012
Year-Over-Year Improvement
2013
Nine Months Ended September 30
•
Higher net earnings
•
Net Improvement in working capital metrics
•
Lower Capital Expenditures
Please see Sealed Air’s 10-Q filed on November 8, 2013 for important information about the
use of non-U.S. GAAP financial measures, including applicable reconciliations to U.S. GAAP
financial measures. ($33)
$198 |
 Liquidity & Net Debt
13
($ in millions)
Liquidity
Position
1,677
Net Debt
Lower net debt as a result of cash generated
from operating activities, partially offset by
dividend payments
777
700
200
Sept 2013
Cash & Cash Equivalents
Revolving Credit Facility
A/R Securitization
4,779
4,727
Dec 2012
Sept 2013
Please see Sealed Air’s 10-Q filed on November 8, 2013 for important information about the
use of non-U.S. GAAP financial measures, including applicable reconciliations to U.S. GAAP
financial measures. |
 Adjusted EBITDA: Approx. $1.055B
(Depreciation and Amortization: $310M; interest expense: $355M; non-cash profit
sharing: $40M) Net Sales: Approx. $7.7B or 1% YoY Growth
(includes approx. 1% unfavorable FX & approx. $100M expected contribution from
rigid medical packaging business)
2013 Revised Outlook
Free Cash Flow: Approx. $375M
(assumes: $140M cash restructuring; $130M capex; $290M cash interest expense
) Note: Adjusted EBITDA, EPS and D&A guidance excludes the impact of
special items, and assumes an estimated core tax rate of 20% –
23%.
Please see Sealed Air’s 10-Q filed on November 8, 2013 for important
information about the use of non-U.S. GAAP financial measures, including applicable
reconciliations to U.S. GAAP financial measures.
14
Adjusted EPS: $1.25 –
$1.30
(includes approx. $0.04 per share expected contribution from rigid medical
packaging business) |
 W.R.
Grace Update 15
•
Third Circuit Court of Appeals has rejected four of the five appeals, but we are
still waiting on a decision related to objections to Grace’s plan brought by
certain holders of Grace's pre-bankruptcy debt
•
Grace indicated that it would expect to emerge from bankruptcy by the end of
January 2014 if the Third Circuit ruled on the lender appeal but that its
emergence could be further delayed by 2 to 3 months if further appeals were
filed; we cannot provide assurance that this timing will be correct or will not be
revised
•
Sealed Air is prepared to make its settlement payment once all funding
conditions are met but has not waived any condition, including that Grace’s plan
not be subject to appeal
•
We continue to monitor the bankruptcy process
•
Estimated cash liability of $925 million as of December 31, 2013 – partially
offset by related tax benefits
|
 Adjusted Debt Maturity
16
As of 9/30/13 ($ millions)
89
319
394
2
691
150
750
425
750
425
450
925
79
2013
2014
2015
2016
2017
2018
2019
2020
2021
2023
2033
W.R. Grace Settlement*
Senior Secured Credit Facilities (term loans) = $1.49B
Short Term Borrowings and Other Debt
Bonds = $2.95B
*Reflects estimated cash liability at December 31, 2013. Exact timing of the
resolution is unknown. Note: As adjusted for November 15, 2013 pay down of
Term Loan B. |
 Q&A |
 Appendix |
 Non-U.S. GAAP Reconciliation
19
Credit Facility EBITDA Reconciliation
(Unaudited)
(In Millions)
December 31, 2012
March 31, 2013
June 30, 2013
September 30, 2013
U.S. GAAP net earnings from continuing operations
(10.9)
$
2.7
$
56.3
$
37.7
$
Special items
109.2
51.4
19.0
46.7
U.S. GAAP adjusted net earnings from continuing operations
98.3
$
54.1
$
75.3
$
84.4
$
Interest Expense
93.5
90.8
89.7
88.9
Income tax provision (benefit)
(2.6)
(8.5)
23.5
25.6
189.2
$
136.4
$
188.5
$
198.9
$
Depreciation and amortization
73.1
80.5
82.6
73.5
Non-cash profit sharing expense
4.6
9.9
10.0
9.7
Write down of non-strategic assets, included in depreciation and
amortization -
-
(4.8)
(0.1)
Total non-U.S. GAAP adjusted EBITDA
266.9
$
226.8
$
276.3
$
282.0
$
Less: Stock appreciation rights
-
-
(0.1)
(8.7)
Less: Cash portion on loss on debt redemption
(6.4)
-
-
-
Less: European manufacturing facility closure charges
(0.8)
-
-
-
Less: Settlement agreement related costs
(0.1)
-
-
-
Less: Legacy Diversey non-recurring restructuring charges
(1.8)
-
-
-
Add: Non cash contributons -
Pensions
5.3
4.6
4.6
4.6
Add: Commissions, fees and expenses paid in cash in connection with the repayment
of any Indebtedness, any Permitted Acquisition, any Disposition, any Debt
Incurrence, the Transactions or any equity issuance
7.4
10.4
-
-
Add: EBITDA from discontinued operations
13.0
-
-
-
Add: EBITDA (loss) from unrestricted subsidiaries
3.5
1.9
1.4
0.6
Other
(1.5)
(1.7)
(1.5)
2.8
Total Credit Facility EBITDA
285.5
$
242.0
$
280.7
$
281.3
$
Three months ended,
Please see Sealed Air’s 10-Q filed on November 8, 2013 for important information about the
use of non-U.S. GAAP financial measures, including applicable reconciliations to U.S. GAAP
financial measures. Non-U.S.
GAAP adjusted
EBIT
-
continuing
operations |