Attached files
| file | filename |
|---|---|
| 8-K - 8-K - HOLOGIC INC | d627497d8k.htm |
| EX-99.2 - EX-99.2 - HOLOGIC INC | d627497dex992.htm |
 -
-
Financial results and company highlights
Financial results and company highlights
-
-
First quarter and fiscal year 2014 outlook
First quarter and fiscal year 2014 outlook
Fourth
Fourth
Quarter
Quarter
Fiscal
Fiscal
2013
2013
Performance
Performance
–
–
September
September
28,
28,
2013
2013
Exhibit 99.3 |
 This
presentation contains forward-looking information that involves risks and uncertainties, including statements about the Company’s plans, objectives,
expectations and intentions. Such statements include, without limitation: financial or other
information included herein based upon or otherwise incorporating judgments
or
estimates
relating
to
future
performance,
events
or
expectations;
the
Company’s
strategies,
positioning,
resources,
capabilities,
and
expectations
for
future performance; and the Company's outlook and financial and other guidance. These
forward-looking statements are based upon assumptions made by the Company as of the
date hereof and are subject to known and unknown risks and uncertainties that could cause actual results to differ materially from those
anticipated.
Risks and uncertainties that could adversely affect the Company’s business and prospects,
and otherwise cause actual results to differ materially from those anticipated, include
without limitation: the ability of the Company to successfully manage recent and ongoing leadership and organizational changes, including the
ability of the Company to attract, motivate and retain key employees; U.S., European and
general worldwide economic conditions and related uncertainties; the Company’s
reliance on third-party reimbursement policies to support the sales and market acceptance of its products, including the possible adverse impact of
government
regulation
and
changes
in
the
availability
and
amount
of
reimbursement
and
uncertainties
for
new
products
or
product
enhancements;
uncertainties
regarding
the
recently
enacted
or
future
healthcare
reform
legislation,
including
associated
tax
provisions,
or
budget
reduction
or
other
cost
containment
efforts;
changes in guidelines, recommendations and studies published by various organizations that
could affect the use of the Company’s products; uncertainties inherent in the
development of new products and the enhancement of existing products, including FDA approval and/or clearance and other regulatory risks, technical risks,
cost overruns and delays; the risk that products may contain undetected errors or defects or
otherwise not perform as anticipated; risks associated with strategic alliances
and
the
ability
of
the
Company
to
realize
anticipated
benefits
of
those
alliances;
risks
associated
with
acquisitions,
including
without
limitation,
the
Company’s ability to successfully integrate acquired businesses, the risks that the
acquired businesses may not operate as effectively and efficiently as expected even if
otherwise successfully integrated, the risks that acquisitions may involve unexpected costs or unexpected liabilities, including the risks and challenges
associated with the Company’s recent acquisition of Gen-Probe and operations in
China; the risks of conducting business internationally, including the effect of
exchange rate fluctuations on those operations; manufacturing risks, including the
Company’s reliance on a single or limited source of supply for key components, and
the need to comply with especially high standards for the manufacture of many of its products; the Company’s ability to predict accurately the demand for its
products, and products under development, and to develop strategies to address its markets
successfully; the early stage of market development for certain of the
Company’s
products;
the
Company’s
leverage
risks,
including
the
Company’s
obligation
to
meet
payment
obligations
and
financial
covenants
associated
with
its
debt; risks related to the use and protection of intellectual property; expenses,
uncertainties and potential liabilities relating to litigation, including, without
limitation, commercial, intellectual property, employment and product liability litigation;
technical innovations that could render products marketed or under development by the
Company obsolete; competition; and the Company’s ability to attract and retain qualified personnel.
The risks included above are not exhaustive. Other factors that could adversely affect the
company's business and prospects are described in the filings made by the Company
with
the
SEC.
The
Company
expressly
disclaims
any
obligation
or
undertaking
to
release
publicly
any
updates
or
revisions
to
any
such
statements
presented herein to reflect any change in expectations or any change in events, conditions or
circumstances on which any such statements are based. Hologic,
Adiana,
Aptima,
fFn,
Gen-Probe,
MammoSite,
Mini
C-Arm,
MyoSure,
NovaSure,
and
Panther
and
associated
logos,
as
may
be
used
throughout
this
presentation, are trademarks and/or registered trademarks of Hologic, Inc. and/or its
subsidiaries in the United States and/or other countries. Safe Harbor Statement
2 |
 Q4 FY 2013
Overview Key Performance Metrics
Key Performance Metrics
Q4 FY 2013
Q4 FY 2013
Revenues*
Revenues of $622.1 million
•
Revenues up $33.6 million, or 5.7%, vs. Q4’12
1
(and up $21.9 million or 3.7% vs.
Q4’12 non-GAAP revenues)
•
Revenues down $(4.0) million, or (0.6)%, vs. Q3’13
Net Income*
GAAP net loss of $1.1 billion and
non-GAAP net income of $107.6 million
•
Non-GAAP net income up $9.3 million, or 9.4%, vs. Q4’12
•
Non-GAAP net income up $4.4 million, or 4.3%, vs. Q3’13
•
GAAP net loss includes a $1.1 billion goodwill impairment charge
Adjusted EBITDA*
$231.4 million
•
Up $21.4 million, or 10.2%, vs. Q4’12
•
Up $4.0 million, or 1.7%, vs. Q3’13
3
1
On a constant currency basis, total revenues would have increased to $621.4M*, or 5.6%
compared to Q4’12. The constant currency revenue amount for Q4’13 is a non-GAAP number that reflects
what revenues in that quarter would have been had the Company applied the foreign currency
exchange rates it used for determining its revenues in Q4’12. *
See
the
definition
of
the
non-GAAP
financial
measures
and
the
reconciliation
of
those
measures
to
the
comparable
GAAP
financial
measures
on
pages
5-13
of
this
presentation.
Quarter Ended September 28, 2013 (unaudited)
Quarter Ended September 28, 2013 (unaudited) |
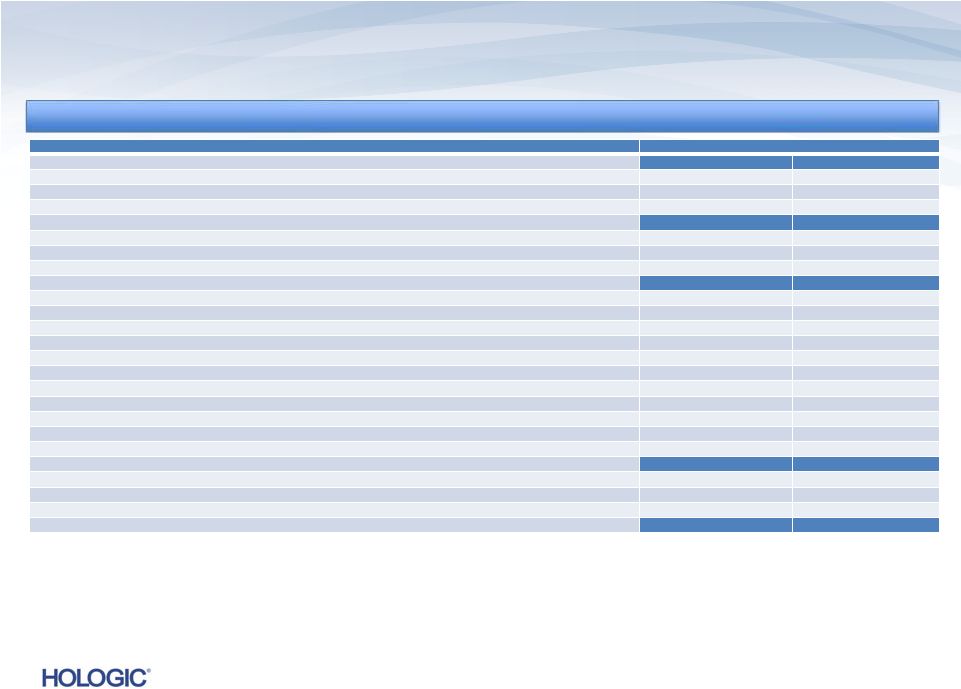
 Q4 FY 2013
Financial Performance * See the definition of the non-GAAP financial
measures and the reconciliation of those measures
to the comparable GAAP financial measures on
pages 5-13 of this presentation.
GAAP
NON-GAAP*
$s in millions,
except EPS
Q4’13
Q4’12
Change
Q3’13
Change
Q4’13
Q4’12
Change
Q3’13
Change
Revenues
$622.1
$588.5
5.7%
$626.1
(0.6)%
$622.1
$600.2
3.7%
$626.1
(0.6)%
Gross Margins
46.7%
46.6%
10 bps
49.5%
(280) bps
61.5%
62.2%
(70) bps
62.4%
(90) bps
Operating Expenses
$1,326.8
$318.0
nmf
$248.6
nmf
$174.9
$186.6
(6.3)%
$185.0
(5.4)%
Pre-Tax (Loss) Income
$(1,104.9)
$(98.0)
nmf
$(6.9)
nmf
$158.3
$149.0
6.2%
$151.8
4.3%
Net (Loss) Income
$(1,113.9)
$(77.8)
nmf
$(11.0)
nmf
$107.6
$98.3
9.4%
$103.2
4.3%
Diluted EPS
$(4.11)
$(0.29)
nmf
$(0.04)
nmf
$0.39
$0.37
$0.02
$0.38
$0.01
4
Note: nmf denotes “not meaningful”
GAAP costs and expenses include:
Stock-based
compensation-
$10.4M,
$14.2M
and
$10.8M
in
Q4’13,
Q4’12
and
Q3’13,
respectively
Goodwill Impairment charge of $1.1 billion
Quarter Ended September 28, 2013 (unaudited)
Quarter Ended September 28, 2013 (unaudited) |
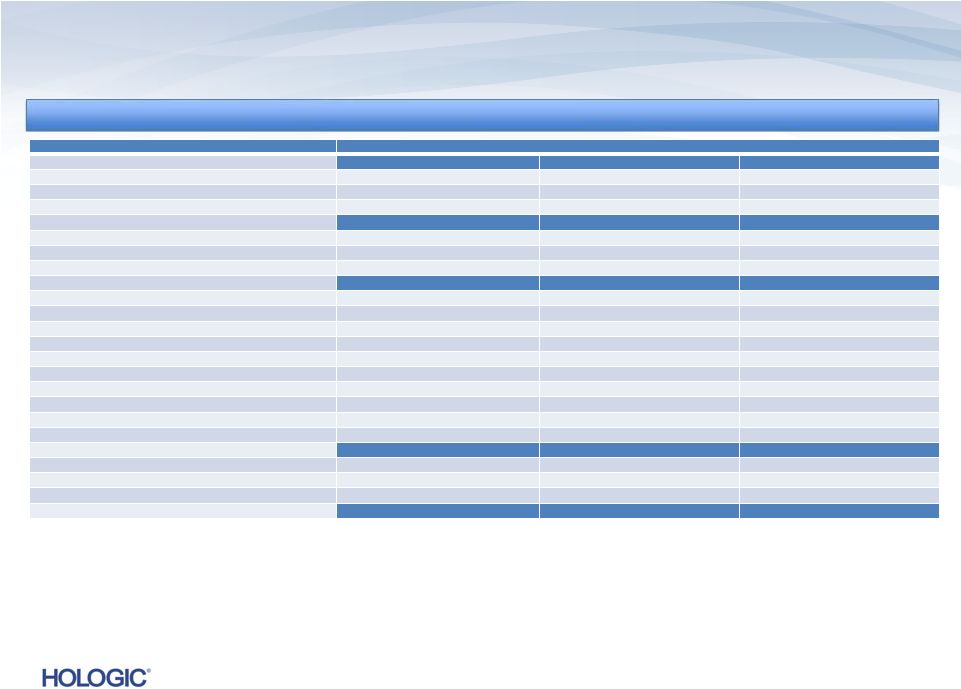 Reconciliation
of GAAP to Non-GAAP (unaudited) 5
Three Months Ended
Three Months Ended
September 28, 2013
September 28, 2013
September 29, 2012
September 29, 2012
June 29, 2013
June 29, 2013
REVENUES
GAAP revenues
$622,118
$588,548
$626,136
Adjustments related to Novartis collaboration
-
11,606
-
Non-GAAP revenues
$622,118
$622,118
$600,154 ¹
$626,136
$626,136
EARNINGS PER SHARE
GAAP
loss
per
share
-
Diluted
$(4.11)
$(0.29)
$(0.04)
Adjustments to net loss (as detailed below)
4.50
0.66
0.42
Non-GAAP
earnings
per
share
-
Diluted
$0.39²
$0.37 ²
$0.38²
GROSS MARGINS
GAAP gross margins
$290,631
$274,317
$309,758
Adjustments:
Contingent revenue from Novartis collaboration
-
11,606
-
Amortization of intangible assets
80,885
66,072
75,990
Fair value write-up of acquired inventory sold
-
19,918
-
Fair value adjustment to depreciation expense
1,741
1,203
1,771
Impairment of intangible assets
-
-
1,714
Acquisition and integration-related costs
7,993
612
1,268
Other
1,308
(427)
-
Non-GAAP gross margins
$382,558
$382,558
$373,301
$373,301
$390,501
$390,501
GROSS MARGIN PERCENTAGE
GAAP gross margin percentage
46.7%
46.6%
49.5%
Impact of adjustments above
14.8%
15.6%
12.9%
Non-GAAP gross margin percentage
61.5%
61.5%
62.2%
62.2%
62.4%
62.4%
Continued on next page
In thousands, except earnings per share
In thousands, except earnings per share |
 In thousands,
except earnings per share In thousands, except earnings per share
6
Three Months Ended
Three Months Ended
September 28, 2013
September 28, 2013
September 29, 2012
September 29, 2012
June 29, 2013
June 29, 2013
OPERATING EXPENSES
GAAP operating expenses
$1,326,836
$318,020
$248,606
Adjustments:
Amortization of intangible assets
(26,726)
(24,832)
(28,678)
Contingent consideration
465
(40,399)
(22,072)
Acquisition and integration-related costs
(2,979)
4
(37,901)
4
(4,660)
4
Restructuring and divestiture charges
(9,720)
(16,687)
(6,690)
Impairment of goodwill
(1,117,369)
(5,826)
-
In-process research and development
-
(4,500)
-
Fair value adjustment to depreciation expense
(1,329)
4
(1,300)
4
(1,338)
4
Litigation benefit
5,721
-
-
Other
-
(12)
(214)
Non-GAAP operating expenses
$174,899
$174,899
$186,563
$186,563
$184,954
$184,954
INTEREST EXPENSE
GAAP interest expense
$65,783
$56,673
$67,162
Adjustments:
Non-cash interest expense relating to convertible notes
(11,829)
(16,514)
(11,638)
Debt transaction costs
(1,055)
-
-
Non-GAAP interest expense
$52,899
$52,899
$40,159
$40,159
$55,524
$55,524
PRE-TAX INCOME
GAAP pre-tax loss
$(1,104,937)
$(97,964)
$(6,923)
Adjustments to pre-tax loss as detailed above
1,256,748
246,955
156,033
Debt extinguishment loss
5,962
-
-
Other
500
-
2,701
Non-GAAP pre-tax income
$158,273
$158,273
$148,991
$148,991
$151,811
$151,811
NET INCOME
GAAP net loss
$(1,113,902)
$(77,767)
$(10,950)
Adjustments to pre-tax loss as detailed above
1,263,210
246,955
158,734
Income tax effect of reconciling items
(41,682)³
(70,854)³
(44,553)³
Non-GAAP net income
$107,626
$107,626
$98,334
$98,334
$103,231
$103,231
EBITDA
Non-GAAP net income
$107,626
$98,334
$103,231
Interest expense, net, not adjusted above
52,368
39,766
55,220
Provision for income taxes
50,647
50,657
48,580
Depreciation expense, not adjusted above
20,782
21,241
20,427
Adjusted EBITDA
$231,423
$231,423
$209,998
$209,998
$227,458
$227,458
Reconciliation of GAAP to Non-GAAP (unaudited)
Continued on next page |
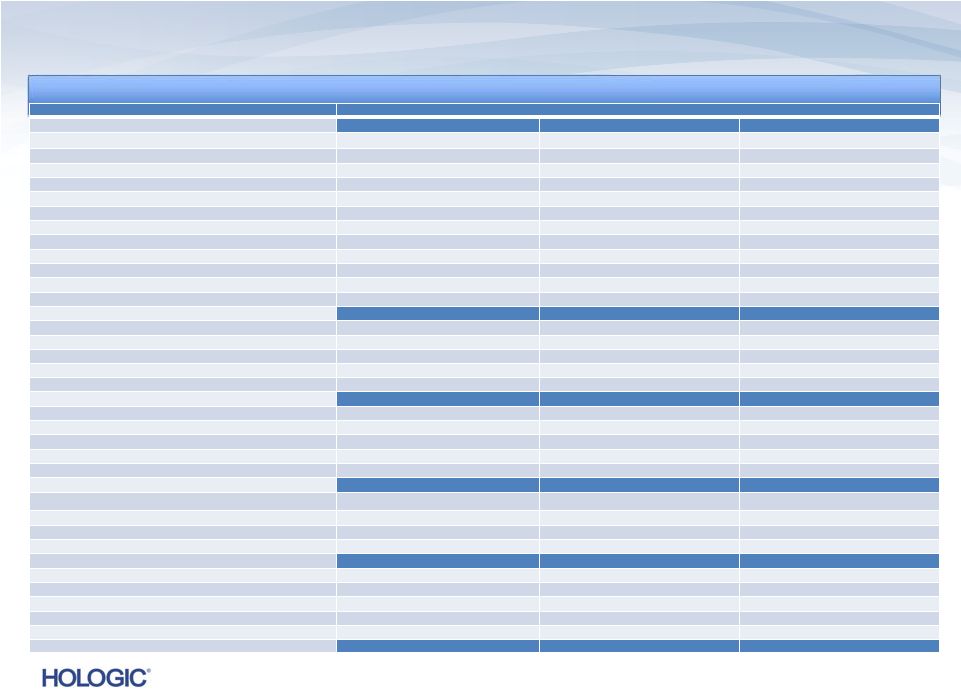
 Reconciliation
of GAAP to Non-GAAP (unaudited) 7
Year Ended
Year Ended
September 28,2013
September 28,2013
September 29, 2012
September 29, 2012
REVENUES
GAAP revenues
$2,492,279
$2,002,652
Net adjustments primarily related to Novartis collaboration
19,704
11,606
Non-GAAP revenues
$2,511,983¹
$2,014,258¹
EARNINGS PER SHARE
GAAP
loss
per
share
-
Diluted
$(4.36)
$(0.28)
Adjustments to net (loss) income (as detailed below)
5.86
1.66
Non-GAAP
earnings
per
share
-
Diluted
$1.50²
$1.38²
GROSS MARGINS
GAAP gross margins
$1,161,388
$994,437
Adjustments:
Contingent revenue from Novartis collaboration and other, net
19,704
11,606
Amortization of intangible assets
307,895
201,864
Fair value write-up of acquired inventory sold
52,397
19,918
Fair value adjustment to depreciation expense
7,100
1,203
Impairment of intangible assets
1,714
-
Acquisition and integration-related costs
11,868
800
Adiana closure costs
-
19,064
Other
1,308
-
Non-GAAP gross margins
$1,563,374
$1,563,374
$1,248,892
$1,248,892
GROSS MARGIN PERCENTAGE
GAAP gross margin percentage
46.6%
49.7%
Impact of adjustments above
15.6%
12.3%
Non-GAAP gross margin percentage
62.2%
62.2%
62.0%
62.0%
Continued on next page
In thousands, except earnings per share
In thousands, except earnings per share |
 8
Year Ended
Year Ended
September 28, 2013
September 28, 2013
September 29, 2012
September 29, 2012
OPERATING EXPENSES
GAAP operating expenses
$2,067,670
$880,720
Adjustments:
Amortization of intangible assets
(112,597)
(72,036)
Contingent consideration
(91,320)
(119,497)
Acquisition and integration-related costs
(17,984)
4
(44,305)
4
Restructuring and divestiture charges
(32,805)
(17,036)
Impairment of goodwill
(1,117,369)
(5,826)
Gain on sale of intellectual property, net
53,884
12,424
Fair value adjustment to depreciation expense
(4,957)
4
(1,300)
4
Litigation benefit
8,584
-
In-process research and development
-
(4,500)
Other
-
(931)
Non-GAAP operating expenses
$753,106
$753,106
$627,713
$627,713
INTEREST EXPENSE
GAAP interest expense
$281,075
$140,287
Adjustments:
Non-cash interest expense relating to convertible notes
(52,732)
(68,532)
Debt transaction costs
(7,469)
-
Other
-
(528)
Non-GAAP interest expense
$220,874
$220,874
$71,227
$71,227
OTHER INCOME, NET
GAAP other income, net
$3,605
$7,256
Cost method investment loss
4,466
-
Other
301
-
Non-GAAP other income, net
$8,372
$8,372
$7,256
$7,256
PRE-TAX INCOME
GAAP pre-tax loss
$(1,192,961)
$(61,661)
Adjustments to pre-tax loss as detailed above
1,781,518
576,522
Debt extinguishment loss
9,209
42,347
Non-GAAP pre-tax income
$597,766
$597,766
$557,208
$557,208
NET INCOME
GAAP net loss
$(1,172,838)
$(73,634)
Adjustments to pre-tax loss as detailed above
1,790,727
618,869
Income tax effect of reconciling items
(211,408)
3
(177,478)
3
Non-GAAP net income
$406,481
$406,481
$367,757
$367,757
EBITDA
Non-GAAP net income
$406,481
$367,757
Interest expense, net, not adjusted above
219,572
68,887
Provision for income taxes
191,285
189,451
Depreciation expense, not adjusted above
80,825
69,348
Adjusted EBITDA
$898,163
$898,163
$695,443
$695,443
Reconciliation of GAAP to Non-GAAP (unaudited)
Continued on next page
In thousands, except earnings per share
In thousands, except earnings per share |
 9
Reconciliation of GAAP to Non-GAAP (unaudited)
Footnotes:
1
To primarily reflect a fair value adjustment recorded in purchase accounting
relating to contingent revenue earned and received under the Novartis
collaboration post acquisition, which was eliminated under purchase accounting.
2
Non-GAAP earnings per share was calculated based on: 273,925; 268,106; and
272,531 weighted average diluted shares outstanding for the three months
ended September 28, 2013, September 29, 2012, and June 29, 2013, respectively, and
271,869 and 266,795 weighted average diluted shares outstanding for the years ended
September 28, 2013 and September 29, 2012, respectively.
3
To reflect an annual effective tax rate of 32.0%, 34.0% and 32.0% on a non-GAAP
basis for the three months ended September 28, 2013, September 29, 2012, and
June 29, 2013, respectively, and 32.0% and 34.0% on a non-GAAP basis for
the years ended September 28, 2013 and September 29, 2012, respectively.
4
The breakdown of this expense by P&L line item is as follows:
Three Months Ended
Three Months Ended
Year Ended
Year Ended
September 28, 2013
September 28, 2013
September 29, 2012
September 29, 2012
June 29, 2013
June 29, 2013
September 28, 2013
September 28, 2013
September 29, 2012
September 29, 2012
Acquisition-related costs
R&D
$686
$805
$1,337
$4,684
$1,038
S&M
600
691
1,229
4,873
725
G&A
1,693
36,405
2,094
8,427
42,542
Total OpEx
$2,979
$37,901
$4,660
$17,984
$44,305
COGS
7,993
612
1,268
11,868
800
Total Adjustment
$10,972
$38,513
$5,928
$29,852
$45,105
Fair value adjustment for
depreciation expense
R&D
$431
$293
$434
$1,741
$293
S&M
65
44
66
262
44
G&A
833
963
838
2,954
963
Total OpEx
$1,329
$1,300
$1,338
$4,957
$1,300
COGS
1,741
1,203
1,771
7,100
1,203
Total Adjustment
$3,070
$2,503
$3,109
$12,057
$2,503
In thousands, except tax rates
In thousands, except tax rates |
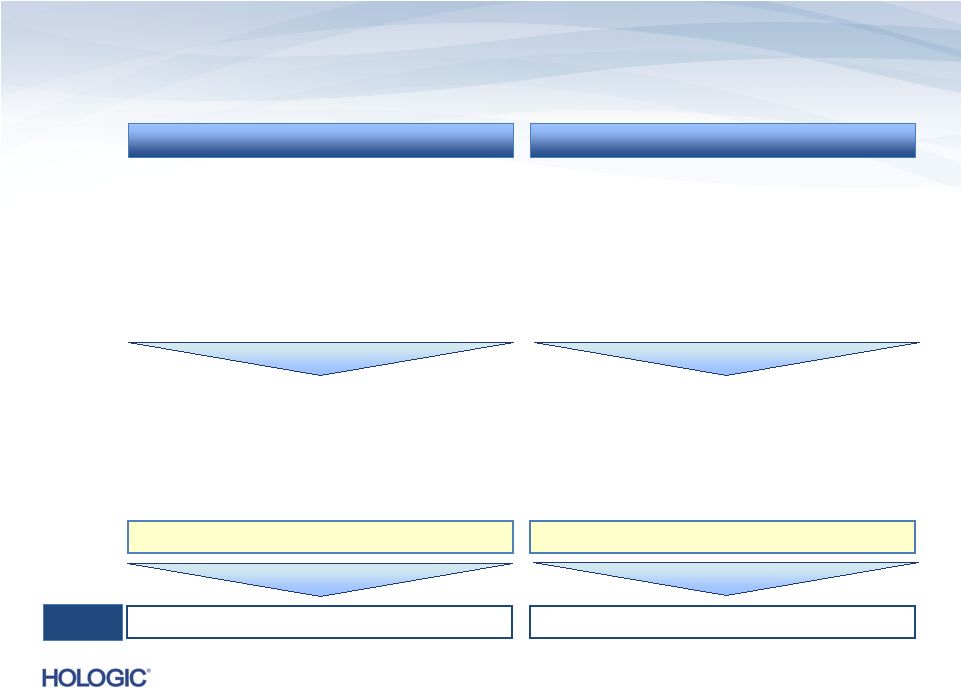 Overview of
Operating Cash Flow and Return on Invested Capital
¹
Adjustments for OCF include contingent consideration paid for acquisition.
²
Average
net
debt
and
stockholders’
equity
during
the
period.
³
For
2013,
calculated
inclusive
of
impairment
charge;
stockholders’
equity
and
ROIC
are
$3.0B
and
7.6%,
respectively,
excluding
impairment
charge.
Operating Cash Flow (OCF)
Return on Invested Capital (ROIC)
•
Measures the cash flow available for
deleveraging, shareholder return and
incremental investment in the business
•
Hologic uses operating cash flow for
evaluating and executing on its
deleveraging and capital return objectives
•
Measures the after-tax returns generated by
the company relative to the total invested
capital base (equity and debt)
•
Hologic uses ROIC for evaluating investment
decisions relative to cost of capital and as a
key element of Hologic’s performance-based
executive compensation plan
OCF = CFO + Adj. (1)
ROIC = NOPAT / (Net debt + S/H Equity)
FY13
Results
$630.8M
8.26%
•
Key building blocks:
–
Cash flow from operations (CFO)
–
Non-operating adjustments¹
(Adj.)
•
Key building blocks
–
Net operating profit after tax (NOPAT)
–
Net debt²
–
Stockholders’
equity
(S/H
Equity)
²
,
³
10 |
 11
Year Ended
Year Ended
September 28, 2013
September 28, 2013
NET OPERATING PROFIT AFTER TAX (NON-GAAP)
Non-GAAP net income
$406,481
Provision for income taxes
191,285
Non-GAAP interest expense
220,874
Non-GAAP other income
(8,372)
Adjusted net operating profit before tax (Non-GAAP)
$810,268
$810,268
Non-GAAP effective tax rate
32.0 %
Adjusted net operating profit after tax (Non-GAAP)
$550,982
$550,982
AVERAGE NET DEBT PLUS AVERAGE STOCKHOLDER'S EQUITY
Average cash, cash equivalents and restricted cash
$(697,765)
Average total debt
4,920,762
Average stockholder’s equity
2,451,272
Average net debt plus average stockholder's equity
$6,674,269
$6,674,269
ADJUSTED ROIC
Adjusted ROIC (adjusted net operating profit after tax above divided by average net debt plus
S/E above) 8.26%
8.26%
AVERAGE NET DEBT PLUS AVERAGE STOCKHOLDER'S EQUITY (PRE-IMPAIRMENT CHARGE)
Average cash, cash equivalents and restricted cash
$(697,765)
Average total debt
4,920,762
Average stockholder’s equity (pre-impairment charge)
3,009,957
Average net debt plus average stockholder's equity (pre-impairment charge)
$7,232,954
$7,232,954
ADJUSTED ROIC (PRE-IMPAIRMENT CHARGE)
Adjusted ROIC (pre-Impairment charge)
7.62%
7.62%
Return on Invested Capital (unaudited)
In thousands
In thousands |
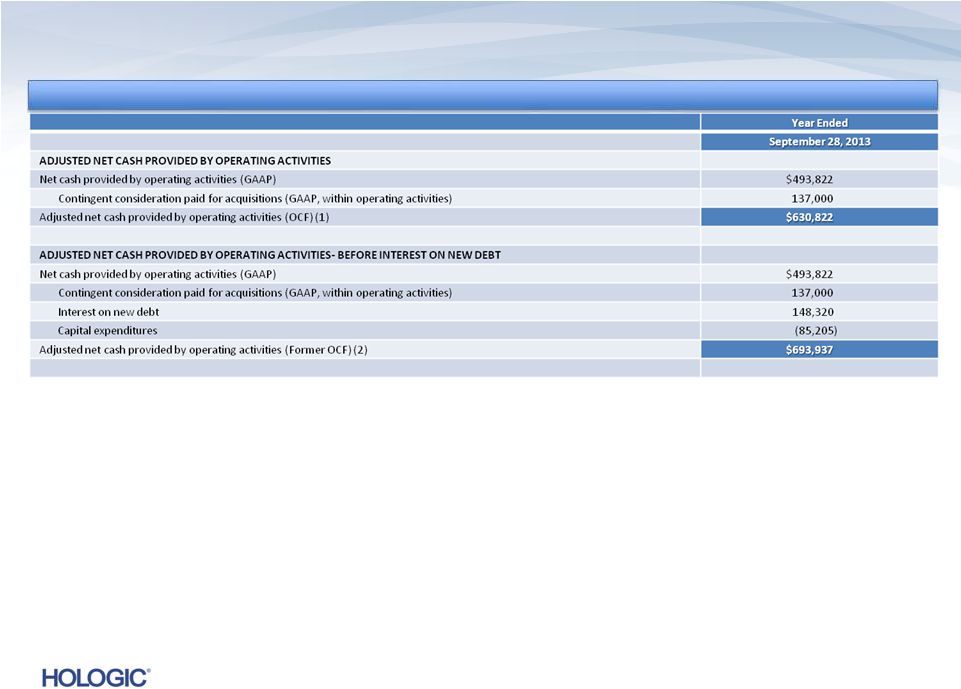 12
Operating Cash Flow (unaudited)
(1) Operating cash flow represents operating cash flow within operating activities, but before
Investing/Financing Activities (which include capital expenditures). (2) Former
operating cash flow represents operating cash flow within operating activities, including capital expenditures, and excluding interest paid on debt acquired in Fiscal 2012.
In thousands
In thousands |
 Hologic has
presented the following non-GAAP financial measures in this presentation: revenues; net income; EPS; and adjusted EBITDA. Hologic
defines its non-GAAP revenues to primarily include contingent revenue earned under the
Novartis collaboration post-acquisition which was eliminated under purchase
accounting. Hologic defines adjusted EBITDA as its non-GAAP net income plus net interest expense, income taxes, and
depreciation and amortization expense included in its non-GAAP net income. Hologic defines
its non-GAAP net income and EPS to exclude: (i) the amortization of intangible
assets; (ii) acquisition-related charges and effects, such as charges for contingent consideration (comprised of (a)
adjustments
for
changes
in
the
fair
value
of
the
contingent
consideration
liabilities
initially
recorded
as
part
of
the
purchase
price
of
an
acquisition
as required by GAAP, and (b) contingent consideration that is tied to continuing employment of
the former shareholders and employees which is recorded as compensation expense),
transaction costs, integration costs including retention, and credits and/or charges associated with the write-up
of acquired inventory and fixed assets to fair value, and the effect of a reduction in revenue
primarily related to contingent revenue under the Novartis collaboration, described
above; (iii) non-cash interest expense related to amortization of the debt discount for convertible debt securities;
(iv) restructuring and divestiture charges; (v) non-cash extinguishment losses and debt
transaction costs; (vi) litigation settlement charges (benefits); (vii)
other-than-temporary impairment losses on investments; and (viii) other one-time, nonrecurring, unusual or infrequent charges, expenses or
gains that may not be indicative of the Hologic’s core business results; and include
income taxes related to such adjustments. Hologic believes the use of non-GAAP
revenues is useful to investors as it eliminates certain effects of purchase accounting on its recognition of
revenue.
Hologic
believes
the
use
of
non-GAAP
net
income
is
useful
to
investors
by
eliminating
certain
of
the
more
significant
effects
of
its
acquisitions and related activities, non-cash charges resulting from the application of
GAAP to convertible debt instruments with cash settlement features, charges related to
debt extinguishment losses, investment impairments, litigation settlements, and restructuring and divestiture initiatives.
These non-GAAP measures also reflect how Hologic manages its businesses internally. In
addition to the adjustments set forth in the calculation of Hologic’s non-GAAP
net income and EPS, its adjusted EBITDA eliminates the effects of financing, income taxes and the accounting effects of capital
spending. As with the items eliminated in its calculation of non-GAAP net income, these
items may vary for different companies for reasons unrelated to the overall operating
performance of Hologic’s business. When analyzing Hologic’s operating performance, investors should not consider these
non-GAAP financial measures as a substitute for net income prepared in accordance with
GAAP. Use of Non-GAAP Financial Measures
13 |
 Consolidated
Balance Sheet Data (unaudited)
$s in millions
$s in millions
September 28, 2013
September 28, 2013
September 29, 2012
September 29, 2012
Cash
$829.4
$566.1
Working Capital
$535.7
$901.7
Total Assets
$9,000.8
$10,477.1
Long-Term Liabilities
$5,970.9
$6,854.7
Total Liabilities
$7,059.3
$7,516.1
Stockholders’
Equity
$1,941.5
$2,961.0
14 |
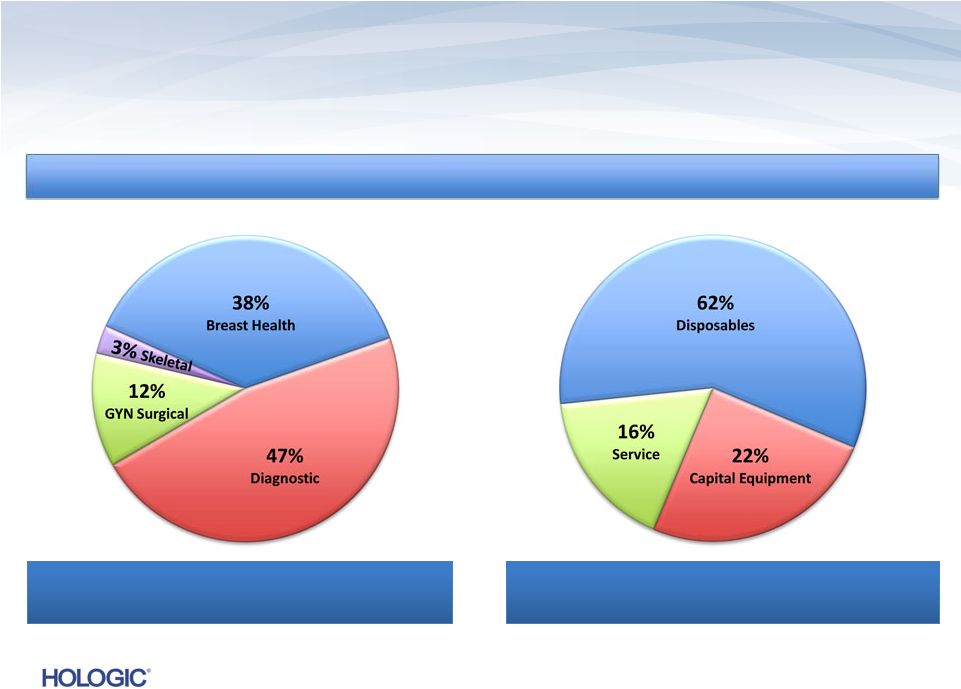 U.S.
Revenues ~ 77% U.S. Revenues ~ 77%
International Revenues ~ 23%
International Revenues ~ 23%
Four Business Segments
Disposables/Service ~ 78%
Disposables/Service ~ 78%
Capital Equipment ~ 22%
Capital Equipment ~ 22%
15
Breakdown of Q4 FY 2013 Revenues of $622.1M (unaudited)
Breakdown of Q4 FY 2013 Revenues of $622.1M (unaudited) |
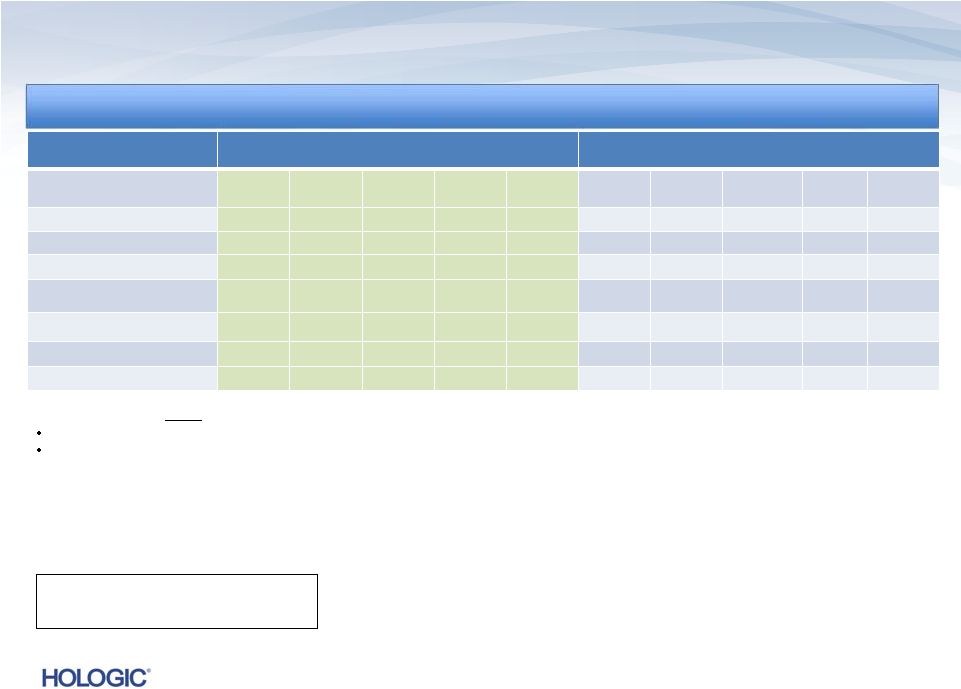
 Q4 FY 2013
Segment Highlights Diagnostics (unaudited)
Diagnostics revenues represent 47% of total revenues and 54% of total product revenues in
Q4’13 –
On
a
constant
currency
basis,
Diagnostics
revenues
would
have
increased
to
$289.5M¹,
or
14.2%,
compared
to
Q4’12
GAAP costs and expenses include:
•
Stock-based compensation of $5.3M, $8.1M and $5.4M in Q4’13, Q4’12 and
Q3’13, respectively Non-GAAP* revenues, costs and expenses primarily
exclude: •
Impairment of goodwill of $1,117.4M in Q4’13
•
Amortization of intangible assets of $78.3M, $60.7M and $74.4M in Q4’13, Q4’12 and
Q3’13, respectively –
In Q4’13, $58.4M was in COGS and $19.9M in OpEx
–
In Q4’12, $43.7M was in COGS and $17.0M in OpEx
–
In Q3’13, $53.4M was in COGS and $21.0M in OpEx
•
Acquisition and integration-related costs of $10.5M, $38.5M and $5.5M in Q4’13,
Q4’12 and Q3’13, respectively –
In Q4’13, $7.6M was in COGS and $2.9M in OpEx
–
In Q4’12, $0.6M was in COGS and $37.9M in OpEx
–
In Q3’13, $1.0M was in COGS and $4.5M in OpEx
•
Restructuring
and
divestiture
charges
of
$4.1M,
$14.8M
and
$3.1M
in
Q4’13,
Q4’12
and
Q3’13,
respectively
•
Fair value adjustment to depreciation expense of $3.1M, $2.5M and $3.1M in Q4’13,
Q4’12 and Q3’13, respectively –
$1.7M was in COGS and $1.4M in OpEx in Q4’13
–
$1.2M was in COGS and $1.3M in OpEx in Q4’12
–
$1.8M was in COGS and $1.3M in OpEx in Q3’13
•
Contingent consideration of $(0.5M), $32.9M, and $21.6M in Q4’13, Q4’12 and
Q3’13, respectively •
Fair value write-up of acquired inventory sold of $19.9M in Q4’12 (COGS)
•
Purchase accounting and other adjustments, net, reducing revenues by $11.6M in
Q4’12 Thin Prep, fFN and Molecular Diagnostics
GAAP
GAAP
$s in millions
Q4’13
Q4’12
Change
Q3’13
Change
Revenues
$290.0
$253.5
14.4%
$297.4
(2.5)%
Gross Margins
40.0%
40.1%
(20) bps
47.8%
(790) bps
Operating Loss
$(1,115.4)
$(86.0)
nmf
$(1.1)
nmf
16
* See the definition of these non-GAAP financial measures on
page 13 of this presentation.
1
The constant currency revenue amount for Q4’13 is a non-GAAP
number that reflects what revenues in that quarter would have
been had the Company applied the foreign currency exchange
rates it used for determining its revenues in Q4’12.
Note: nmf denotes “not meaningful” |
 Q4 FY 2013
Segment Highlights Breast Health (unaudited)
Breast Health revenues represent 38% of total revenues and 28% of total product revenues in
Q4’13 –
On
a
constant
currency
basis,
Breast
Health
revenues
would
have
increased
to
$233.9M¹
,
or
1.6%,
compared
to
Q4’12
GAAP costs and expenses include:
•
Stock-based compensation of $3.9M, $4.6M and $4.3M in Q4’13, Q4’12 and
Q3’13, respectively Non-GAAP* costs and expenses primarily exclude:
•
Amortization of intangible assets of $5.9M, $6.6M and $6.0M in Q4’13, Q4’12 and
Q3’13, respectively –
In Q4’13, $4.1M was in COGS and $1.8M in OpEx
–
In Q4‘12, $4.6M was in COGS and $2.0M in OpEx
–
In Q3’13, $4.1M was in COGS and $1.9M in OpEx
•
Litigation benefit of $5.7M in Q4’13
•
Restructuring and divestiture charges of $1.9M, $1.9M and $2.8M in Q4’13, Q4’12 and
Q3’13, respectively •
Acquisition and integration-related costs of $0.5M and $0.4M in Q4’13 and Q3’13,
respectively –
In Q4’13, $0.4M was in COGS and $0.1M in OpEx
–
In Q3’13, $0.3M was in COGS and $0.1M in OpEx
•
Impairment of goodwill of $5.8M in Q4’12
•
Contingent consideration of $3.4M in Q4’12
•
Impairment of intangible asset of $1.7M in Q3’13 (COGS)
Mammography, Breast Biopsy, MRI Coils, and
MammoSite
GAAP
GAAP
$s in millions
Q4’13
Q4’12
Change
Q3’13
Change
Revenues
$234.2
$230.3
1.7%
$230.0
1.8%
Gross Margins
52.4%
49.9%
250 bps
49.7%
270 bps
Operating Income
$70.0
$40.9
71.2%
$53.2
31.6%
17
* See the definition of these non-GAAP financial measures on
page 13 of this presentation.
1
The constant currency revenue amount for Q4’13 is a non-GAAP
number that reflects what revenues in that quarter would
have been had the Company applied the foreign currency
exchange rates it used for determining its revenues in Q4’12.
|
 Q4 FY 2013
Segment Highlights GYN Surgical (unaudited)
GYN Surgical revenues represent 12% of total revenues and 15% of
total product revenues in Q4’13
–
On a constant currency basis, GYN Surgical revenues would have decreased to $76.9M¹, or (3.5)%, compared to Q4’12
GAAP and non-GAAP costs and expenses include:
•
Stock-based compensation of $0.8M, $1.1M and $0.8M in Q4’13, Q4’12 and
Q3’13, respectively Non-GAAP* costs and expenses primarily exclude:
•
Amortization of intangible assets of $23.5M, $23.6M and $24.3M in Q4’13, Q4’12 and
Q3’13, respectively –
In Q4’13, $18.5M was in COGS and $5.0M in OpEx
–
In Q4‘12, $17.8M was in COGS and $5.8M in OpEx
–
In Q3’13, $18.5M was in COGS and $5.8M in OpEx
•
Restructuring and divestiture charges of $0.4M and $0.4M in Q4’13 and Q3’13,
respectively •
Contingent consideration of $4.1M, and $0.5M in Q4’12 and Q3’13, respectively
•
In-process research and development of $4.5M in Q4’12
NovaSure and MyoSure
GAAP
GAAP
$s in millions
Q4’13
Q4’12
Change
Q3’13
Change
Revenues
$76.7
$79.7
(3.8)%
$75.8
1.1%
Gross Margins
55.5%
58.6%
(310) bps
56.8%
(130) bps
Operating Income (Loss)
$10.5
$(1.2)
nmf
$6.3
67.8%
18
* See the definition of these non-GAAP financial measures on
page 13 of this presentation.
1
The
constant
currency
revenue
amount
for
Q4’13is
a
non-GAAP
number that reflects what revenues in that quarter would have
been had the Company applied the foreign currency exchange
rates it used for determining its revenues in Q4’12.
Note: nmf denotes “not meaningful” |
 Q4 FY 2013
Segment Highlights Skeletal (unaudited)
Skeletal revenues represent 3% of total revenues and 3% of total
product revenues in Q4’13
–
On a constant currency basis, Skeletal revenues would have decreased to
$21.1M¹, or (15.9)%, compared to Q4’12
GAAP costs and expenses include:
•
Stock-based compensation of $0.4M, $0.5M and $0.4M in Q4’13, Q4’12 and
Q3’13, respectively Non-GAAP* costs and expenses primarily exclude
•
Restructuring and divestiture charges of $3.4M and $0.4M in Q4’13 and Q3’13,
respectively Osteoporosis Assessment and Mini C-Arm
GAAP
GAAP
$s in millions
Q4’13
Q4’12
Change
Q3’13
Change
Revenues
$21.2
$25.1
(15.3)%
$22.9
(7.1)%
Gross Margins
44.2%
43.9%
30 bps
45.0%
(80) bps
Operating (Loss) Income
$(1.4)
$2.6
nmf
$2.8
nmf
19
* See the definition of these non-GAAP financial measures
on page 13 of this presentation.
1
The constant currency revenue amount for Q4’13 is a non-
GAAP number that reflects what revenues in that quarter
would have been had the Company applied the foreign
currency exchange rates it used for determining its
revenues in Q4’12.
Note: nmf denotes “not meaningful” |
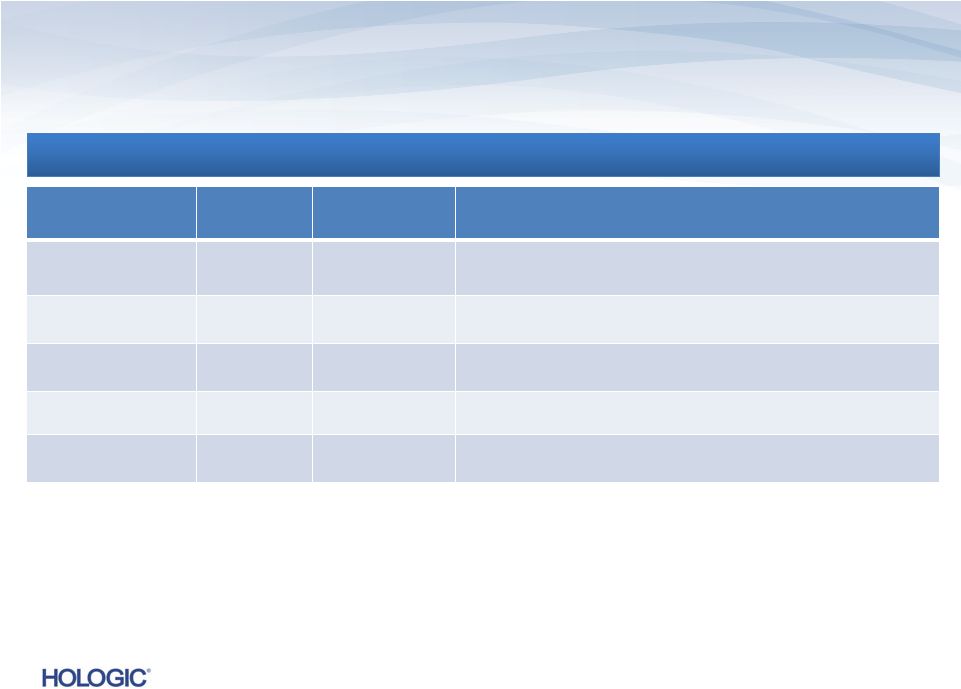
 20
The Company’s guidance includes current operations, including revenues from its
approved/cleared products and its recently
acquired
businesses.
This
guidance
does
not
include
any
stock
repurchases,
acquisitions,
divestitures
or
additional voluntary debt payments that may occur during fiscal 2014.
Hologic may not generate expected revenues and may incur expenses or charges, realize income
or gains, or execute transactions in fiscal 2014 that could cause actual results to
vary from the guidance above. In addition, the Company is continuing to monitor the
effects of the U.S., European and general worldwide economic and regulatory conditions
and related uncertainties, including the implementation of healthcare cost containment
measures and healthcare reform legislation, as well as foreign currency fluctuations,
which, along with other uncertainties facing the Company’s business including
those referenced elsewhere herein and its filings with the Securities and Exchange
Commission, could adversely affect anticipated results.
Future Non-GAAP Adjustments:
Future GAAP EPS may be affected by changes in ongoing assumptions and judgments relating to
the Company’s acquired businesses, and may also be affected by nonrecurring,
unusual or unanticipated charges, expenses or gains, all of which are excluded in the
calculation of non-GAAP EPS as described in this presentation. It is therefore not
practicable to reconcile non-GAAP EPS guidance to the most comparable GAAP measure.
FINANCIAL GUIDANCE |
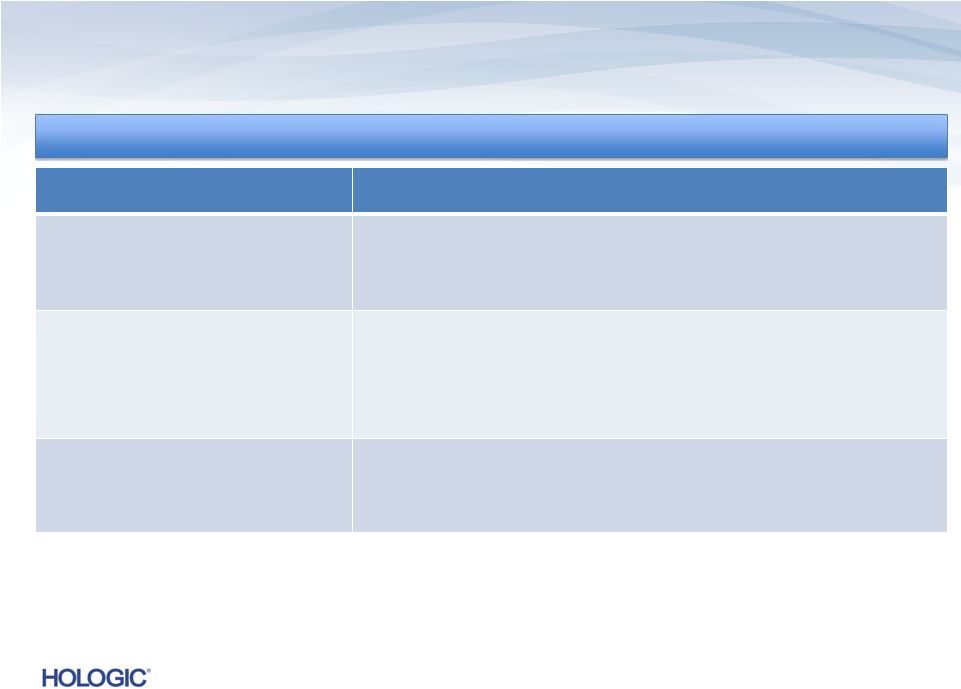
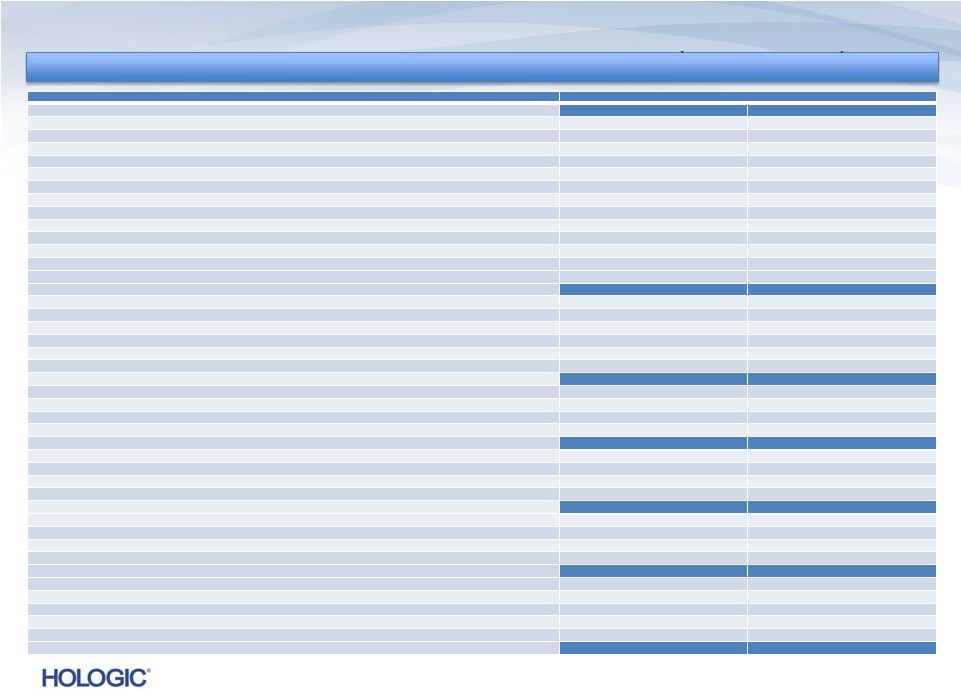
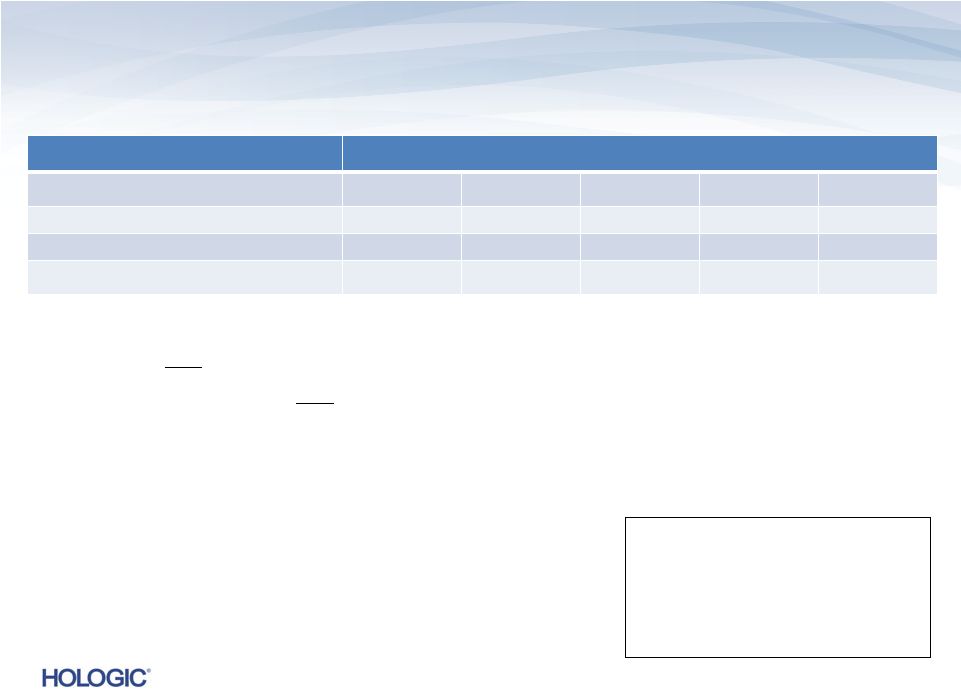
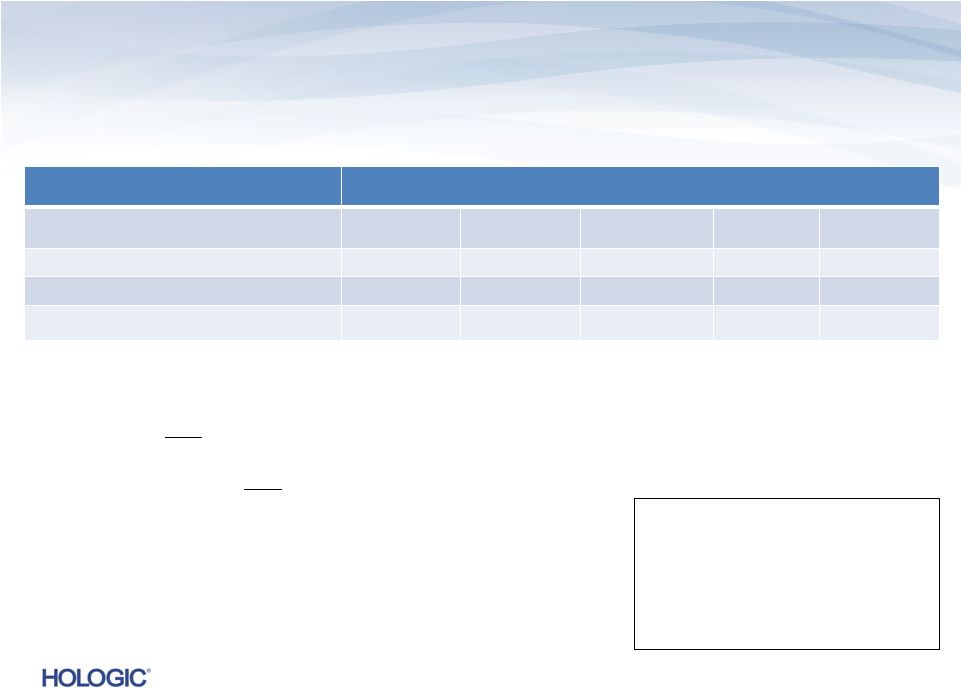
 Non-GAAP
Guidance for Q1 FY 2014 $s in millions
$s in millions
(except EPS)
(except EPS)
Q1 2013
Q1 2013
Actual
Actual
Q1 2014
Q1 2014
Guidance*
Guidance*
Commentary
Commentary
(compared to Q1 2013)
(compared to Q1 2013)
Revenues*
$644.6
$600 -
$610
We expect a decline in reported revenues of 5% to 7% and a pro forma decline of 3% to 5% (pro
forma excludes Lifecodes revenues of $12.6 million).
Gross margins*
62.5%
61.5% -
62.0%
We
expect
non-GAAP
gross
margins
to
be
lower
as
a
result
of
lower
revenues
and
a
shift
in
product mix, including lower sales of consumable products and higher sales of mammography
systems.
Operating expenses*
$198.3
$195 -
$200
We expect non-GAAP operating expenses to decrease primarily as a result of recent
cost-cutting measuresand
completion
of
Gen-Probe
integration,
offset
by
an
estimated
$5
-
$6
million
for
the
medical device excise tax.
Interest expense*
$56.4
~ $50
Includes cash and non-cash interest on our Senior Notes, Term Loans and convertible
debt. EPS*
$0.38
$0.30 -
$0.31
We expect non-GAAP EPS to be lower primarily as a result of lower revenues. This includes
incremental reductions in EPS of $0.01 from the impact of the medical device excise
tax and $0.01 from an increase in the expected annual effective tax rate.
Quarter ending December 28, 2013
Quarter ending December 28, 2013
21
NOTE: Guidance assumes constant foreign currency rates with Q4’13.
NOTE: For Q1’14, we estimate diluted shares outstanding of approximately 275 million and
a 34% annual effective tax rate. * See the definition of non-GAAP financial measures
on page 13 and the discussion of future non-GAAP adjustments on page 20 of this presentation. |
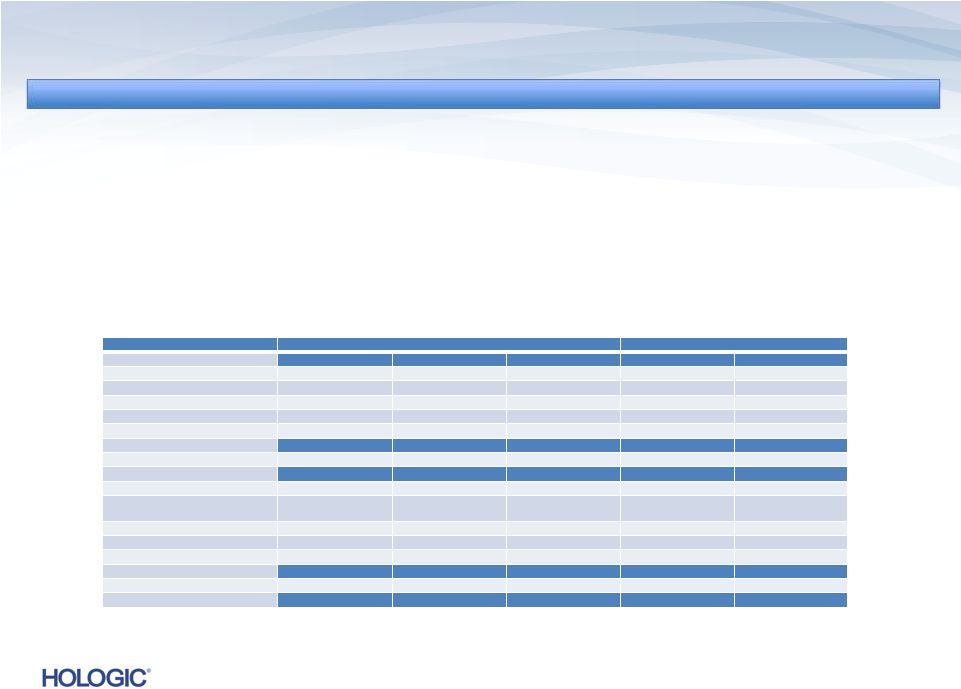
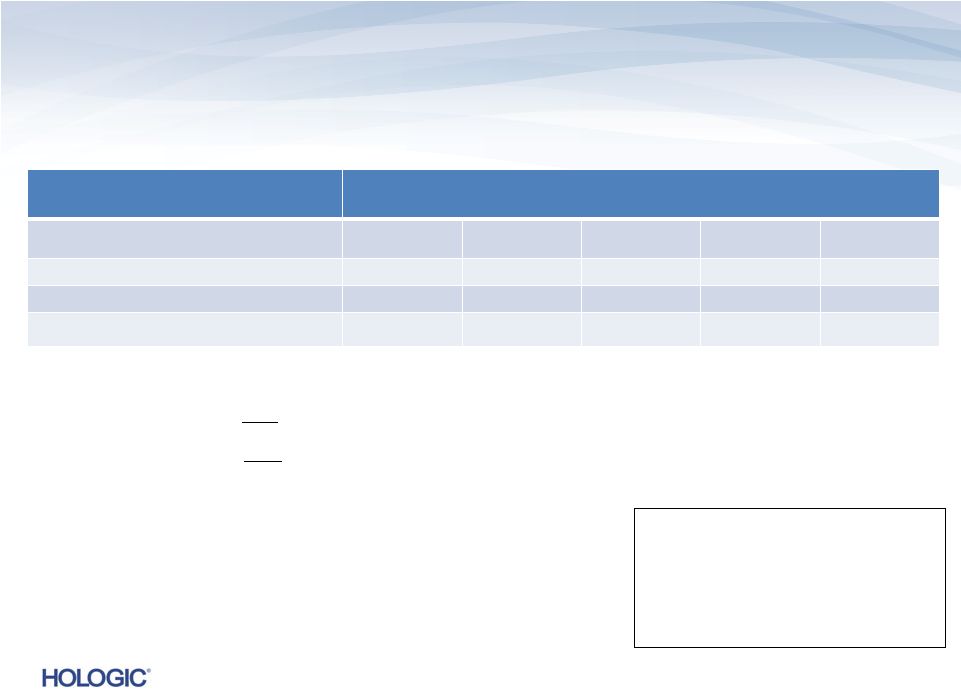
 Non-GAAP
Guidance for FY 2014 $s in millions
$s in millions
(except EPS)
(except EPS)
Fiscal 2013
Fiscal 2013
Actual
Actual
Fiscal 2014
Fiscal 2014
Guidance
Guidance
Commentary
Commentary
(compared to Fiscal 2013)
(compared to Fiscal 2013)
Revenues*
$2,512.0
$2,425 -
$2,475
We expect a decline in reported revenues of 1% to 3%. On a pro forma basis, adjusting for
Lifecodes revenues of $23 million, total revenues are expected to be flat to down
2%. Gross margins*
62.2%
61.5% -
62.0%
We
expect
non-GAAP
gross
margins
to
be
lower
as
a
result
of
lower
revenues
and
a
shift
in
product mix, including lower sales of consumable products and higher sales of
mammography systems.
Operating
expenses*
$753.1
$750 -
$770
We expect non-GAAP operating expenses to increase modestly as a result of recent
cost-cutting measures and completion of Gen-Probe integration, offset by an
increase in variable compensation.
In
addition,
FY
2014
includes
an
estimated
$21
-
$22
million
for
the
medical
device
excise tax.
Interest expense*
$220.9
~ $190
Includes cash and non-cash interest on our Senior Notes, Term Loans and convertible
debt. EPS*
$1.50
$1.32 -
$1.38
We expect non-GAAP EPS to be lower primarily as a result of lower revenues. This includes
incremental
reductions
of
$0.04
from
an
increase
in
the
expected
annual
effective
tax
rate
and
$0.02 from the impact of the medical device excise tax.
Year ending September 27, 2014
Year ending September 27, 2014
22
NOTE: Guidance assumes constant foreign currency rates with Q4’13.
NOTE: For Fiscal 2014, we estimate diluted shares outstanding of approximately 278 million and
a 34% annual effective tax rate. * See the definition of non-GAAP financial measures on page 13 and the discussion of
future non-GAAP adjustments on page 20 of this presentation. |
 Q4 FY 2013 and
Subsequent Events Summary •
Q4 FY 2013 Highlights:
–
Revenues in line with and EPS exceeding guidance
–
Appointment of Jack Cumming as President and Chief Executive Officer (July 18)
–
Term B refinancing, reducing interest rate by 75 basis points and increasing flexibility to
return capital to shareholders; also voluntarily prepaid $200 million of the Term B
(August 2)
–
Announced FDA approval of Aptima HPV on Panther (July 23)
•
Subsequent Events:
–
AuntMinnie.com named digital breast tomosynthesis the “Hottest Clinical
Procedure” for the fourth consecutive year (October 30)
–
Voluntarily prepaid additional $100 million on Term Loan B (October 31)
–
Announced
FDA
approval
of
Aptima
HPV
16
18/45
genotype
assay
for
use
on
Panther
System (November 7)
–
Announced Board of Directors authorized a $250 million, three-year stock repurchase
program (November 11) |
 |