Attached files
| file | filename |
|---|---|
| EX-5.1 - EX-5.1 - Associated Materials Group, Inc. | d562216dex51.htm |
| EX-23.2 - EX-23.2 - Associated Materials Group, Inc. | d562216dex232.htm |
Table of Contents
As filed with the Securities and Exchange Commission on November 15, 2013
Registration No. 333-189958
UNITED STATES
SECURITIES AND EXCHANGE COMMISSION
Washington, D.C. 20549
Amendment No. 3
to
FORM S-1
REGISTRATION STATEMENT
UNDER
THE SECURITIES ACT OF 1933
Associated Materials Group, Inc.
(Exact name of registrant as specified in its charter)
| Delaware (State or other jurisdiction of incorporation or organization) |
3089 (Primary Standard Industrial Classification Code Number) |
27-3440252 (I.R.S. Employer |
3773 State Road
Cuyahoga Falls, Ohio 44223
(330) 929-1811
(Address, including zip code, and telephone number, including area code, of registrant’s principal executive offices)
Jerry W. Burris
President and Chief Executive Officer
Associated Materials Group, Inc.
3773 State Road
Cuyahoga Falls, Ohio 44223
(330) 929-1811
(Name, address, including zip code, and telephone number, including area code, of agent for service)
With copies to:
| William B. Brentani Daniel N. Webb Simpson Thacher & Bartlett LLP 2475 Hanover Street Palo Alto, California 94304 Tel: (650) 251-5000 Fax: (650) 251-5002 |
William M. Hartnett John A. Tripodoro Douglas S. Horowitz Cahill Gordon & Reindel LLP Eighty Pine Street New York, New York 10005 Tel: (212) 701-3000 Fax: (212) 269-5420 |
Approximate date of commencement of proposed sale to the public: As soon as practicable after the effective date of this registration statement.
If any of the securities being registered on this Form are to be offered on a delayed or continuous basis pursuant to Rule 415 under the Securities Act of 1933 check the following box. ¨
If this Form is filed to register additional securities for an offering pursuant to Rule 462(b) under the Securities Act, please check the following box and list the Securities Act registration statement number of the earlier effective registration statement for the same offering. ¨
If this Form is a post-effective amendment filed pursuant to Rule 462(c) under the Securities Act, check the following box and list the Securities Act registration statement number of the earlier effective registration statement for the same offering. ¨
If this Form is a post-effective amendment filed pursuant to Rule 462(d) under the Securities Act, check the following box and list the Securities Act registration statement number of the earlier effective registration statement for the same offering. ¨
Indicate by check mark whether the registrant is a large accelerated filer, an accelerated filer, a non-accelerated filer, or a smaller reporting company. See the definition of “large accelerated filer,” “accelerated filer” and “smaller reporting company” in Rule 12b-2 of the Exchange Act.
| Large accelerated filer | ¨ | Accelerated filer | ¨ | |||||
| Non-accelerated filer | x | (Do not check if a smaller reporting company) | Smaller reporting company | ¨ | ||||
The Registrant hereby amends this Registration Statement on such date or dates as may be necessary to delay its effective date until the Registrant shall file a further amendment which specifically states that this Registration Statement shall thereafter become effective in accordance with Section 8(a) of the Securities Act of 1933 or until the Registration Statement shall become effective on such date as the Commission, acting pursuant to said Section 8(a), may determine.
Table of Contents
The information in this preliminary prospectus is not complete and may be changed. These securities may not be sold until the registration statement filed with the Securities and Exchange Commission is effective. This preliminary prospectus is not an offer to sell nor does it seek an offer to buy these securities in any jurisdiction where the offer or sale is not permitted.
Subject to Completion. Dated November 15, 2013.
Prospectus
Shares

Associated Materials Group, Inc.
Common Stock
This is an initial public offering of shares of common stock of Associated Materials Group, Inc. All of the shares of common stock are being sold by us.
Prior to this offering, there has been no public market for our shares. We estimate the initial public offering price per share will be between $ and $ . We intend to apply to have our shares listed on the New York Stock Exchange (the “NYSE”) or the Nasdaq Global Market (the “Nasdaq”) under the symbol “ .”
After the completion of this offering, certain investment funds affiliated with Hellman & Friedman LLC (the “H&F Investors”) will continue to beneficially own a majority of the voting power of all outstanding shares of our common stock. As a result, we will be a “controlled company” within the meaning of the corporate governance standards of the NYSE or Nasdaq, as applicable. See “Principal Stockholders.”
See “Risk Factors” on page 19 to read about factors you should consider before buying shares of our common stock.
Neither the Securities and Exchange Commission nor any other regulatory body has approved or disapproved of these securities or passed upon the accuracy or adequacy of this prospectus. Any representation to the contrary is a criminal offense.
| Per Share | Total | |||||||
| Initial public offering price |
$ | $ | ||||||
| Underwriting discount(1) |
$ | $ | ||||||
| Proceeds, before expenses, to us |
$ | $ | ||||||
| (1) | In addition, upon completion of this offering, we will pay up to $ for certain financial consulting services to a broker-dealer that is not part of the underwriting syndicate. See “Underwriting.” |
The underwriters have the option, for a period of 30 days from the date of this prospectus, to purchase up to an additional shares from us at the initial public offering price less the underwriting discount.
The underwriters expect to deliver the shares against payment in New York, New York on , 2013.
| Goldman, Sachs & Co. | Barclays | UBS Investment Bank |
| Deutsche Bank Securities | ||||
Prospectus dated , 2013.
Table of Contents


Table of Contents
| Page | ||||
| 1 | ||||
| 19 | ||||
| 36 | ||||
| 38 | ||||
| 39 | ||||
| 40 | ||||
| 42 | ||||
| 44 | ||||
| Management’s Discussion and Analysis of Financial Condition and Results of Operations |
46 | |||
| 73 | ||||
| 89 | ||||
| 96 | ||||
| 118 | ||||
| 123 | ||||
| 125 | ||||
| 129 | ||||
| 138 | ||||
| Certain U.S. Federal Income and Estate Tax Consequences to Non-U.S. Holders |
141 | |||
| 144 | ||||
| 149 | ||||
| 149 | ||||
| 149 | ||||
| F-1 | ||||
Through and including , 2013 (the 25th day after the date of this prospectus), all dealers effecting transactions in these securities, whether or not participating in this offering, may be required to deliver a prospectus. This is in addition to a dealer’s obligation to deliver a prospectus when acting as an underwriter and with respect to an unsold allotment or subscription.
We and the underwriters have not authorized anyone to provide any information or to make any representations other than those contained in this prospectus or in any free writing prospectuses we have prepared. We and the underwriters take no responsibility for, and can provide no assurance as to the reliability of, any other information that others may give you. This prospectus is an offer to sell only the shares offered hereby, but only under circumstances and in jurisdictions where it is lawful to do so. The information contained in this prospectus is current only as of its date.
i
Table of Contents
For investors outside the United States: We and the underwriters have not done anything that would permit a public offering of the shares of our common stock or possession or distribution of this prospectus in any jurisdiction where action for that purpose is required, other than in the United States. Persons outside the United States who come into possession of this prospectus must inform themselves about, and observe any restrictions relating to, the offering of the shares of common stock and the distribution of this prospectus outside of the United States.
Trademarks and Trade Names
We own or have rights to trademarks and trade names that we use in conjunction with the operation of our business. In addition, our name, logo and website name and address are our trademarks or service marks. Some of the more important trademarks that we use include Alside®, Revere®, Gentek®, Alpine®, Alpine WindowsTM, CenterLock®, Charter Oak®, Color Clear Through®, ColorConnect®, Excalibur®, Performance SeriesTM, Preservation®, TriBeamTM, Prodigy®, UltraGuard® and UltraMaxx®. This prospectus contains additional trademarks, trade names and service marks of other companies. We do not intend our use or display of other companies’ trademarks, trade names or service marks to imply relationships with, or endorsement or sponsorship of us by, these other companies.
Market, Industry and Other Data
This prospectus contains statistical data that we obtained from industry publications and reports. These publications generally indicate that they have obtained their information from sources believed to be reliable.
ii
Table of Contents
This summary highlights information contained in greater detail elsewhere in this prospectus and does not contain all of the information that you should consider in making your investment decision. Before investing in our common stock, you should carefully read this entire prospectus, including our financial statements and the related notes included elsewhere in this prospectus and the information set forth under “Risk Factors” and “Management’s Discussion and Analysis of Financial Condition and Results of Operations.” Unless otherwise indicated in this prospectus, “Associated Materials Group, Inc.,” “we,” “us,” “our” and “our company” refer to Associated Materials Group, Inc. and, where appropriate, its subsidiaries. “Holdings” refers to our wholly owned direct subsidiary, Associated Materials Incorporated, and “Associated Materials” refers to Holdings’ wholly owned direct subsidiary, Associated Materials, LLC, and, where appropriate, its subsidiaries.
Overview
We are a leading, vertically integrated manufacturer and distributor of exterior residential building products in the United States and Canada. We produce a comprehensive offering of exterior building products, including vinyl windows, vinyl siding, vinyl railing and fencing, aluminum trim coil, aluminum and steel siding and related accessories, which we produce at our 11 manufacturing facilities. We also sell complementary products that are manufactured by third parties, such as roofing materials, cladding materials, insulation, exterior doors, equipment and tools, and provide installation services. We distribute these products through our extensive dual-distribution network to over 50,000 professional exterior contractors, builders and dealers, whom we refer to as our “contractor customers.” This dual-distribution network consists of 124 company-operated supply centers, through which we sell directly to our contractor customers, and our direct sales channel, through which we sell to more than 275 independent distributors, dealers and national account customers. For the nine months ended September 28, 2013 and the year ended December 29, 2012, approximately 74% and 75%, respectively, of our net sales were generated through our company-operated supply centers, and 26% and 25%, respectively, of our net sales were generated through our direct sales channel. The products we sell are generally marketed under our brand names, such as Alside®, Revere®, Gentek®, UltraGuard® and Preservation®. Our product sales of vinyl windows, vinyl siding, metal products and third-party manufactured products comprised approximately 31%, 20%, 15% and 27%, respectively, of our net sales for the year ended December 29, 2012. In addition, many of our supply centers also offer full-service product installation of our window, siding and third-party products through our Installed Sales Solutions (“ISS”) group. Our ISS group provides a turn-key solution for remodeling dealers and builders who benefit from purchasing bundled products and installation from a single source, allowing them to focus on generating new business. For the year ended December 29, 2012, we had net sales of $1,142.5 million, Adjusted EBITDA of $96.4 million and a net loss of $38.4 million. For the nine months ended September 28, 2013, we had net sales of $873.5 million, Adjusted EBITDA of $70.4 million, and a net loss of $32.0 million. For the definition of Adjusted EBITDA and a presentation of net income (loss) calculated in accordance with generally accepted accounting principles (“GAAP”), and reconciliation of Adjusted EBITDA to net income (loss), see “—Summary Historical Condensed Consolidated Financial Data” and “—Adjusted EBITDA.” Adjusted EBITDA is a non-GAAP financial measure and should not be considered as a substitute for other measures of liquidity or financial performance reported in accordance with GAAP.
We estimate that, for the year ended December 29, 2012, approximately 70% of our net sales were generated in the residential repair and remodeling (“R&R”) market and approximately 30% of our net sales were generated in the residential new construction market. We believe that our focus on the R&R market provides us with a more attractive market than residential new construction due to the relative stability in demand, superior competitive dynamics and higher profit margins available in R&R.
1
Table of Contents
Our Competitive Strengths
We believe that we are well-positioned in our industry, and we expect to utilize our strengths to capture additional market share from our competitors. Our key competitive strengths include:
Leading Market Position
We are one of the largest exterior building products companies focused exclusively in the U.S. and Canadian markets. We believe, based on industry data and our estimates, that we hold leading market positions within the North American exterior residential building products market, including top five positions in the vinyl windows and vinyl siding segments, and that our market position is stronger within the R&R market in the geographies we serve. We believe that we are able to utilize our scale to service larger regional and national accounts that many of our competitors either cannot cover or can only do so by relying on a series of multiple independent distributors.
Differentiated Dual-Distribution Network
Our distribution strategy successfully combines a network of company-operated supply centers with a complementary network of independent distributors and dealers. We believe we are the only major vinyl window and siding manufacturer that primarily markets products to contractors through company-operated supply centers. We have operated with a dual-distribution strategy since 1952, and we believe there are significant barriers that make it difficult for our competitors to replicate this strategy, namely the capital costs of building a network of company-operated supply centers and the complexity of maintaining existing relationships with independent distributors and dealers while simultaneously operating a supply center network.
| Ÿ | Company-Operated Supply Centers. We believe that our network of 124 U.S. and Canadian company-operated supply centers offers a superior distribution channel compared to the traditional network of third-party distributors and dealers used by our major competitors. In contrast to our competitors, who only utilize third-party distributors, we have built dedicated longstanding relationships directly with our contractor customers through our supply centers. In addition, we believe that distributing our products through our vertically integrated network of company-operated supply centers provides a compelling value proposition for our contractor customers through (1) comprehensive service offerings (including marketing and sales support, aftermarket service and private label and customized offerings), (2) integrated logistics between our manufacturing and distribution facilities (driving product availability and fulfillment) and (3) “one-stop” shopping. In addition, we believe that our supply centers facilitate innovation by allowing us to directly monitor developments in local customer preferences and to bring products to market faster. We also believe that our supply centers have played a critical role in helping us to establish our more than 430 person industry-leading sales force. |
| Ÿ | Direct Sales Channel. We believe that our strength in selling to independent distributors and dealers provides us with operational flexibility because it allows us to further penetrate markets and expand our geographic reach without requiring us to deploy the resources to establish a company-operated supply center by offering different brands within a given market through our direct sales channel. This reach and our vertical integration allow us to service larger customers with a broader geographic scope, many of whom cannot be serviced by local and regional competitors that lack geographic coverage. |
Entrenched Customer Relationships
We believe that we are a deeply integrated partner to our customers. We believe we are a critical part of our customers’ sales process and are integrated with our customers’ work flow given the
2
Table of Contents
services we provide, including marketing support, sales training, fulfillment, lead generation and, for certain larger customers, private label marketing services. We are able to provide our customers with all of their essential marketing needs because of the depth of our value-added marketing and service offerings. We believe our customer integration has led to longstanding relationships, high “share of wallet” and strong customer retention. For example, more than 95% of our independent distributor and dealer customers that generated more than $50,000 of annual sales in 2010 or 2011 were also our customers in 2012. Additionally, for our top 100 U.S. supply center customers, the average length of our relationship is nine years.
Comprehensive Product and Service Offering
We believe that our broad product offering is a key advantage relative to competitors who focus on a limited number of products. Furthermore, we offer broad product lines, ranging from entry-level economy products to premium products, including many products that have earned the highest ENERGY STAR® rating. All of our windows for the R&R market are made to order and are custom manufactured to existing window openings. We are in the process of a significant enhancement to our window platform to be launched in 2014, which we believe will result in increased energy efficiency, enhanced aesthetics and additional features and benefits. We utilize our supply center distribution base to sell complementary products to our core window and siding product offerings, such as roofing and insulation products. We believe our contractor customers often install more than one product type and prefer to purchase multiple products from a single source, and we aim to offer a one-stop solution for these customers. In total, we sell more than 2,000 products, and we believe our longstanding commitment to product innovation will help us continue to drive the expansion of our product offering.
We believe our brands are known for quality and durability in the residential building products industry. Our multi-brand portfolio allows us to offer various brands to contractors within a local market, which in turn allows local contractors to differentiate themselves to the end consumer.
We combine this strong product and brand portfolio with outstanding service offerings, which we believe differentiates us and helps us strengthen our customer relationships. Whether through lead generation, marketing materials, product delivery, installation support or private label programs, our service offerings allow our contractor customers to generate new business, differentiate themselves to end consumers and efficiently manage their installation resources.
Superior, Vertically Integrated Operating Model
Our operations, from manufacturing our own vinyl extrusions and in-sourcing our insulated glass units, to distributing our products through our network of 124 company-operated supply centers, provide us with a level of vertical integration that we believe differentiates us within the building products industry. We believe our vertically integrated platform offers us intimate knowledge of our customer base, enables us to meet their evolving product needs and facilitates superior service and quality control. We believe our vertically integrated operations provide us with a cost advantage over our non-vertically integrated competitors, given that we can retain the profit margins that would otherwise be earned by third-party suppliers or distributors.
Attractive Financial Model
We run a capital-efficient business, requiring relatively modest annual capital investment and resulting in strong returns on the tangible capital employed in our operations. We believe these dynamics, combined with a diverse customer base, a geographically diverse set of operations and a focus on the R&R market, result in sustainable earnings and attractive returns on capital. As evidence, based on an analysis of public filings, we were able to maintain, on average, more attractive returns on
3
Table of Contents
capital and more stable margins during the 2007 through 2012 economic cycle than our peers, as a group.
Experienced Management Team
Beginning in the third quarter of 2011, we added a highly experienced executive management team with a track record of operational excellence to the extensive industry experience of our organization. Our Chief Executive Officer, Jerry Burris, spent over 20 years in various operating roles at General Electric Company, and most recently served as President of Precision Components at Barnes Group Inc. Other members of our senior leadership team bring operating experience from American Standard Companies Inc., Barnes Group Inc., Danaher Corp., General Electric Company, Pernod Ricard SA, Rexnord Corp., Smith & Nephew plc and United Technologies Corp., among other firms. The new additions to our management team complement a team of seasoned building materials industry and Associated Materials veterans. We believe this combination of blue-chip company executives coupled with building materials industry veterans positions us to deliver on our strategic imperatives.
Our Strategy
We are committed to enhancing our customers’ experience by providing high quality products and excellent service, while profitably growing our business. We believe that our longstanding customer relationships are among our most critical assets. Our objective is to grow these existing relationships and to build new relationships by partnering with our contractor customers. By providing customized sales solutions through a dedicated sales, service and fulfillment platform, we seek to enable our customers to continue to grow their market share. We believe this strategy is critical to our positioning in our market and will allow us to grow our market share over time. Our leadership team is committed to delivering sustainable growth while maintaining a focus on improving profitability by executing on predictable, repeatable processes. With these processes intact, we believe we have significant room to expand our geographic footprint, grow our market share and enhance operating margins as our end markets recover.
Capitalize on Residential Recovery and Secular Trends
We believe that the market for vinyl-related building products, specifically windows and siding, is poised for growth.
| Ÿ | Favorable Long-Term Demand Drivers. We expect population growth, an aging housing stock and general economic growth to drive underlying demand for building products. Population growth and household formation are important drivers for both new home construction and R&R spending, requiring the construction of new homes and the alteration and expansion of existing homes. According to the American Housing Survey by the U.S. Census Bureau and the U.S. Department of Housing and Urban Development, more than 67% of the current U.S. housing stock was built before 1980 and the median estimated home age has increased from 23 years in 1985 to 37 years in 2011. |
| Ÿ | Recovery in Our End Markets. We believe that many repair and remodel decisions have been deferred since the global financial crisis began, creating substantial pent-up demand. Based on our estimates and industry data, we believe that the average amount of time that passes before consumers replace their existing windows and siding has increased by over 40% versus the rate of replacement prior to the financial crisis. We also believe that R&R spending has historically lagged new home construction spending. We expect that a more prolonged recovery in R&R spending will be driven by increasing consumer confidence, falling |
4
Table of Contents
| unemployment rates and increasing home equity values. The Leading Indicator of Remodeling Activity provided by the Joint Center for Housing Studies at Harvard University expects 19.7% and 19.8% year-over-year increases in home improvement spending for the third and fourth quarters of 2013. Additionally, we believe new residential construction will grow rapidly over the next several years as housing starts improve to rates that are more consistent with historical levels. According to the U.S. Census Bureau, seasonally adjusted single- and multi-family housing starts in 2012 were 780,000 compared to a 50-year average of 1.5 million. |
| Ÿ | Energy Efficiency. We believe that there is strong and growing demand for energy efficient, “green” building products. We expect to benefit from this increasing demand for energy efficient building products, as many of our products meet energy efficiency standards, including many of our window product lines that have earned the ENERGY STAR® rating. |
| Ÿ | Continued Penetration of Vinyl Products. We believe our focus on vinyl products will further drive our market share in the window and siding markets. Vinyl has greater durability, requires less maintenance and provides greater energy efficiency than many competing materials. In addition, we believe vinyl products have a price advantage over other material types. As a result, vinyl products have gained substantial share in the window and siding markets over the last decade and are expected to be a preferred material going forward. |
Drive Incremental Growth from Existing Stores
We believe that we can grow our business by expanding sales to our existing customers and attracting new customers with our high quality products and services. Our growth is further enhanced by our demonstrated ability to increase the number of products that we sell to each customer, for example by selling siding to customers who previously only purchased windows, and the continued rollout of our ISS offering, which enables our customers to expand their geographic presence without increasing their installer base. We believe our product and service offerings, coupled with both our efforts to drive sales force and operating excellence and our investment in new sales representatives, will enable us to expand our customer base and increase our market share.
Expand Our Distribution Network
We believe that we have considerable room to expand our geographic coverage and intend to grow our network of company-operated supply centers through the creation and acquisition of new supply centers. We have added supply centers in six of the last nine years and have added two company-operated supply centers in the first nine months of 2013. We believe our ability to add company-operated supply centers while effectively maintaining our relationship with third-party distributors differentiates us from our competitors. We believe there is significant market capacity for additional supply centers: a company-commissioned study suggested that we have the opportunity to add more than 200 locations to our existing supply center network, which would more than double our current base of supply centers. In addition, in areas in which we believe an opportunity for expansion exists but where we do not intend to open new company-operated supply centers, we will selectively pursue additional independent distributor and dealer relationships to drive additional sales.
Innovate and Expand Our Product Portfolio
We intend to expand our product portfolio through product innovation. We plan to capitalize on our vinyl window and siding manufacturing expertise by continuing to develop innovative and complementary new products that offer long-term performance, cost, aesthetic and other competitive advantages. We believe that our vertically integrated operating model and strong customer relationships provide us with valuable insights into the latest product attributes that appeal to
5
Table of Contents
customers. We are currently developing a new window platform designed not only to cost effectively increase the energy efficiency of our product line in accordance with ENERGY STAR® Version 6.0 standards, but also to increase our range of window products that we offer.
In addition to investing in new manufactured products, we will continue to selectively increase the range of third-party manufactured products that we sell through our company-operated supply centers. For example, our roofing products were offered at 25 of our locations at the beginning of 2008 and are now available at 74 of our 124 company-operated supply centers. We believe there are numerous other opportunities to provide additional exterior building products through our distribution network.
Drive Profitable Growth and Expand Margins
Over the past two years, we have focused on establishing an efficient operating platform in order to facilitate margin expansion and profitable growth. Following the addition of several key members to our management team, we developed and began implementing the Associated Materials Enterprise System (“AMES”). We believe that AMES positions us to significantly increase the efficiency of both our manufacturing and distribution operations. Our leadership team is focused on implementing predictable and repeatable processes, with the goal of more efficiently providing a broad range of high quality products with shorter lead times. We believe that these initiatives, combined with a substantially fixed cost base, should allow us to expand our margins as our revenues increase.
Summary of Risk Factors
Our business is subject to numerous risks, which are described in the section entitled “Risk Factors.” You should carefully consider these risks before making an investment. In particular, the following considerations, among others, may offset our competitive strengths or have a negative effect on our business strategy, which could cause a decline in the price of our common stock and result in a loss of all or a portion of your investment:
| Ÿ | conditions in the housing market, consumer credit market and economic conditions generally; |
| Ÿ | disruption in the financial markets and the inability to timely access financing on acceptable terms; |
| Ÿ | high level of competition in our industry and the impact of competitive pressures; |
| Ÿ | our substantial fixed costs; |
| Ÿ | delays in the development of new or improved products or our inability to successfully develop new or improved products; |
| Ÿ | increases in raw material costs and availability of raw materials and finished goods; |
| Ÿ | consolidation of our customers; |
| Ÿ | our substantial level of indebtedness; |
| Ÿ | union activity and work stoppages at our facilities or the facilities of our suppliers; |
| Ÿ | our ability to continuously improve organizational productivity and global supply chain efficiency and flexibility; and |
| Ÿ | the other factors set forth in the section entitled “Risk Factors.” |
6
Table of Contents
Our History
Associated Materials was founded in 1947 when it first introduced residential aluminum siding under the Alside® name. We were formed in the State of Delaware in September 2010. In October 2010, the H&F Investors made cash contributions in exchange for shares of common stock in Carey Investment Holdings Corp. (now known as Associated Materials Group, Inc.). As a result of their cash contributions, the H&F Investors acquired control of a majority of the voting power of all outstanding shares of our common stock. Before giving effect to this offering, the H&F Investors owned approximately 97% of our common stock. On July 9, 2013, we changed our name to “Associated Materials Group, Inc.”
Tax Receivable Agreement
Upon the closing of this offering, we intend to enter into a tax receivable agreement with each holder of our common stock as of immediately prior to the completion of this offering (the “Pre-IPO Stockholders”). This tax receivable agreement will generally provide for the payment by us to the Pre-IPO Stockholders of 85% of the amount of cash savings, if any, in U.S. federal, state and local income tax that we realize as a result of the following (the “TRA Attributes”): (1) net operating loss (“NOL”) carryovers from periods (or portions thereof) ending before December 30, 2012, (2) deductible expenses attributable to the transactions related to this offering and (3) deductions, if any, arising from or attributable to payments under this tax receivable agreement, including any imputed interest. See “Certain Relationships and Related Party Transactions—Tax Receivable Agreement.”
7
Table of Contents
Organizational Structure
We and Holdings are holding companies with no material direct operations. As a result, we and Holdings are dependent on loans, dividends and other payments from Associated Materials, LLC and its subsidiaries to generate the funds necessary to meet our financial obligations. The following diagram illustrates our organizational structure after giving effect to the consummation of this offering and the use of proceeds of this offering as described under “Use of Proceeds”.
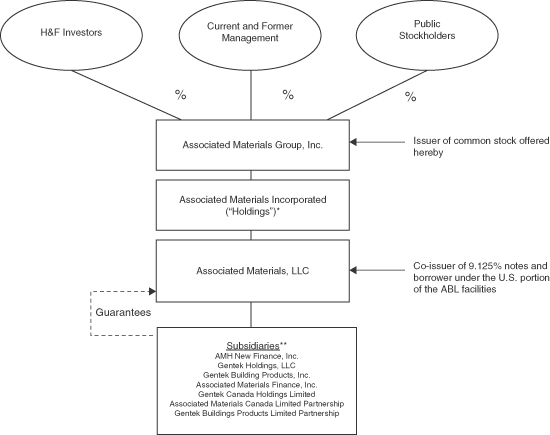
| * | Holdings is a guarantor of our ABL facilities (as defined below). |
| ** | AMH New Finance, Inc. is a co-issuer of the 9.125% notes (as defined below). AMH New Finance, Inc. is a guarantor of our ABL facilities, which are comprised of a $141.5 million U.S. facility and a $71.5 million Canadian facility. Gentek Holdings, LLC is a guarantor of the 9.125% notes, a borrower under the U.S. portion of our ABL facilities and a guarantor of our ABL facilities, and Gentek Building Products, Inc. is also a guarantor of the 9.125% notes, a borrower under the U.S. portion of our ABL facilities and a guarantor of our ABL facilities. The other subsidiaries are borrowers or guarantors under the Canadian portion of our ABL facilities, but none is a guarantor of the 9.125% notes or a borrower or guarantor under the U.S. portion of our ABL facilities. In addition, Associated Materials Finance, Inc. is not a borrower or guarantor under our ABL facilities. |
Our Sponsor
Hellman & Friedman LLC (“H&F”) is a leading private equity firm with offices in San Francisco, London and New York. Since its founding in 1984, H&F has raised and, through its affiliated funds,
8
Table of Contents
managed, over $25 billion of committed capital and has invested in over 75 companies. The firm focuses on investing in superior business franchises and serving as a value-added partner to management in select industries including energy & industrials, internet & digital media, software, business & marketing services, financial services, insurance, media and healthcare. After the completion of this offering, the H&F Investors will own approximately % of the total voting power of our common stock, or approximately % if the underwriters exercise in full their option to purchase additional shares. For a discussion of certain risks, potential conflicts and other matters associated with the H&F Investors’ control, see “Risk Factors—Risks Relating to Our Business—We are controlled by the H&F Investors, whose interests may be different than the interests of other holders of our securities” and “Description of Capital Stock.”
Corporate Information
Our principal executive offices are located at 3773 State Road, Cuyahoga Falls, Ohio 44223. Our telephone number is (330) 929-1811. Our website address is www.associatedmaterials.com. Information contained on, or that can be accessed through, our website does not constitute part of this prospectus, and inclusions of our website address in this prospectus are inactive textual references only.
9
Table of Contents
The Offering
| Common stock offered by us |
shares | |
| Common stock to be outstanding immediately after |
shares | |
| Option to purchase additional shares of common |
The underwriters have been granted an option to purchase up to additional shares of common stock from us at any time within 30 days from the date of this prospectus. | |
| Use of proceeds |
We estimate that the net proceeds to us from this offering, after deducting underwriting discounts and commissions and estimated offering expenses payable by us, will be approximately $ million, based on the assumed initial public offering price of $ per share, which is the midpoint of the price range set forth on the front cover of this prospectus.
We intend to use net proceeds received by us from this offering to redeem $ million in aggregate principal amount of our 9.125% Senior Notes due 2017 (the “9.125% notes”), plus accrued interest thereon, and to pay approximately $ million of redemption premium pursuant to provisions of the indenture governing our 9.125% notes (the “Indenture”). To the extent we raise more proceeds in this offering than currently estimated, we will use such proceeds for general corporate purposes. To the extent we raise less proceeds in this offering than currently estimated, we will reduce the amount of the 9.125% notes that will be redeemed. See “Use of Proceeds.” | |
| Dividend policy |
We do not intend to pay dividends on our common stock in the foreseeable future. Our ability to pay dividends on our common stock is limited by the covenants of our senior secured asset-based revolving credit facilities (the “ABL facilities”) and the Indenture and may be further restricted by the terms of any future debt or preferred securities. See “Dividend Policy” and “Description of Indebtedness.” | |
| Controlled company |
After the completion of this offering, the H&F Investors will continue to control a majority of the voting power of our outstanding common stock. As a result, we will be a “controlled company” within the meaning of the NYSE or Nasdaq, as applicable, corporate governance standards. | |
10
Table of Contents
| Proposed NYSE or Nasdaq, as applicable, |
“ .” | |
The number of shares of our common stock to be outstanding immediately after this offering is based on 55,777,894 shares outstanding as of September 28, 2013 and excludes:
| Ÿ | shares of common stock issuable upon the exercise of outstanding options with a weighted-average exercise price of $ per share; |
| Ÿ | shares of common stock available for future grant under the Associated Materials Group, Inc. 2010 Stock Incentive Plan (the “2010 Plan”); and |
| Ÿ | shares of common stock available for future grant under the Associated Materials Group, Inc. 2013 Stock Incentive Plan (the “2013 Plan”), which will become effective in connection with the closing of this offering. |
Except as otherwise indicated, all information in this prospectus assumes:
| Ÿ | a -for- stock split effective on , 2013; |
| Ÿ | no exercise of options subsequent to September 28, 2013; |
| Ÿ | no exercise by the underwriters of their option to purchase up to additional shares of common stock from us; and |
| Ÿ | the filing and effectiveness of our amended and restated certificate of incorporation and the effectiveness of our amended and restated bylaws in connection with the closing of this offering. |
11
Table of Contents
Summary Historical Condensed Consolidated Financial Data
The following table sets forth our summary financial data for the periods presented. Our fiscal year consists of a 52/53 week period ending on the Saturday closest to December 31st. For fiscal years 2010, 2011 and 2012, our fiscal years were comprised of the 52 weeks ended January 1, 2011, December 31, 2011 and December 29, 2012, respectively. In October 2010, we completed the Merger, whereupon Associated Materials became our indirect wholly owned subsidiary.
Our results of operations prior to the date of the Merger are presented as the results of the Predecessor, which include the results of our then existing direct and indirect parent companies, Associated Materials Holdings, LLC, AMH Holdings, LLC and AMH Holdings II, Inc. See “Management’s Discussion and Analysis of Financial Condition and Results of Operations—The Merger” for a discussion of the Merger. The results of operations from and after the Merger are presented as the results of the Successor. The statement of operations data set forth below for the predecessor period January 3, 2010 to October 12, 2010, the successor period October 13, 2010 to January 1, 2011 and the years ended December 31, 2011 and December 29, 2012 are derived from our audited consolidated financial statements that are included elsewhere in this prospectus. The statement of operations data set forth below for the nine months ended September 29, 2012 and September 28, 2013, respectively, and the balance sheet data as of September 28, 2013 are derived from our unaudited condensed consolidated financial statements that are included elsewhere in this prospectus. The unaudited condensed consolidated financial statements were prepared on a basis consistent with our audited consolidated financial statements. The historical results presented below are not necessarily indicative of financial results to be achieved in future periods.
The summary historical condensed consolidated financial data set forth below should be read in conjunction with “Capitalization,” “Management’s Discussion and Analysis of Financial Condition and Results of Operations” and our audited consolidated financial statements and unaudited consolidated condensed financial statements and the related notes included elsewhere in this prospectus.
| Successor | Predecessor | |||||||||||||||||||||||||
| Nine Months Ended | Year Ended | October 13, 2010 to January 1, 2011 |
January 3, 2010 to October 12, 2010 |
|||||||||||||||||||||||
| September 28, 2013 |
September 29, 2012 |
December 29, 2012 |
December 31, 2011 |
|||||||||||||||||||||||
| (in thousands, except share and per share data) |
||||||||||||||||||||||||||
| Statement of Operations Data: |
||||||||||||||||||||||||||
| Net sales(1) |
$ | 873,464 | $ | 852,379 | $ | 1,142,521 | $ | 1,159,515 | $ | 269,249 | $ | 897,938 | ||||||||||||||
| Cost of sales |
664,569 | 648,975 | 859,617 | 894,333 | 222,737 | 658,509 | ||||||||||||||||||||
|
|
|
|
|
|
|
|
|
|
|
|
|
|||||||||||||||
| Gross profit |
208,895 | 203,404 | 282,904 | 265,182 | 46,512 | 239,429 | ||||||||||||||||||||
| Selling, general and administrative expenses |
176,753 | 178,463 | 240,027 | 247,278 | 53,543 | 159,448 | ||||||||||||||||||||
| Impairment of goodwill(2) |
— | — | — | 84,253 | — | — | ||||||||||||||||||||
| Impairment of other intangible assets(2) |
— | — | — | 79,894 | — | — | ||||||||||||||||||||
| Merger costs |
— | — | — | 585 | 7,411 | 102,661 | ||||||||||||||||||||
| Manufacturing restructuring costs |
— | — | — | 228 | — | — | ||||||||||||||||||||
|
|
|
|
|
|
|
|
|
|
|
|
|
|||||||||||||||
| Income (loss) from operations |
32,142 | 24,941 | 42,877 | (147,056 | ) | (14,442 | ) | (22,680 | ) | |||||||||||||||||
| Interest expense, net |
59,554 | 56,688 | 75,508 | 75,731 | 16,125 | 58,759 | ||||||||||||||||||||
| Net loss (gain) on debt extinguishments |
— | — | — | — | 25,129 | (15,201 | ) | |||||||||||||||||||
| Foreign currency loss (gain) |
555 | 220 | 119 | 438 | 771 | (184 | ) | |||||||||||||||||||
|
|
|
|
|
|
|
|
|
|
|
|
|
|||||||||||||||
| Loss before income taxes |
(27,967 | ) | (31,967 | ) | (32,750 | ) | (223,225 | ) | (56,467 | ) | (66,054 | ) | ||||||||||||||
| Income tax expense (benefit) |
4,015 | 4,991 | 5,605 | (20,434 | ) | 8,553 | 5,220 | |||||||||||||||||||
|
|
|
|
|
|
|
|
|
|
|
|
|
|||||||||||||||
| Net loss |
$ | (31,982 | ) | $ | (36,958 | ) | $ | (38,355 | ) | $ | (202,791 | ) | $ | (65,020 | ) | $ | (71,274 | ) | ||||||||
|
|
|
|
|
|
|
|
|
|
|
|
|
|||||||||||||||
12
Table of Contents
| Successor | Predecessor | |||||||||||||||||||||||||
| Nine Months Ended | Year Ended | October 13, 2010 to January 1, 2011 |
January 3, 2010 to October 12, 2010 |
|||||||||||||||||||||||
| September 28, 2013 |
September 29, 2012 |
December 29, 2012 |
December 31, 2011 |
|||||||||||||||||||||||
| (in thousands, except share and per share data) |
||||||||||||||||||||||||||
| Per Share Data: |
||||||||||||||||||||||||||
| Loss per share (basic and diluted) |
$ | (0.57) | $ | (0.66) | $ | (0.69 | ) | $ | (3.67 | ) | $ | (1.19 | ) | $ | (41.41 | ) | ||||||||||
|
|
|
|
|
|
|
|
|
|
|
|
|
|||||||||||||||
| Weighted average shares outstanding (basic and diluted) |
55,664,994 | 55,638,894 | 55,642,894 | 55,290,857 | 54,860,707 | 1,721,076 | ||||||||||||||||||||
| Pro Forma Per Share Data: |
||||||||||||||||||||||||||
| (Loss) income per share (basic and diluted)(3)(4) |
||||||||||||||||||||||||||
|
|
|
|
|
|||||||||||||||||||||||
| Weighted average shares outstanding (basic and diluted) |
||||||||||||||||||||||||||
| Other Financial Data: |
||||||||||||||||||||||||||
| Adjusted EBITDA(5) |
$ | 70,360 | $ | 69,334 | $ | 96,397 | $ | 87,321 | $ | 30,583 | $ | 102,656 | ||||||||||||||
| Capital expenditures |
(8,899 | ) | (3,720 | ) | (5,371 | ) | (15,447 | ) | (5,160 | ) | (10,302 | ) | ||||||||||||||
| As of September 28, 2013 | ||||||
| Actual | Pro Forma(4)(7) | |||||
| (in thousands) | ||||||
| Balance Sheet Data: |
||||||
| Cash and cash equivalents |
$ | 10,204 | ||||
| Working capital(6) |
123,005 | |||||
| Total assets |
1,530,147 | |||||
| Total debt |
836,523 | |||||
| Stockholders’ equity |
190,966 | |||||
| (1) | The following table presents a summary of net sales by principal product offering: |
| Successor | Predecessor | |||||||||||||||||||||||||
| Nine Months Ended | Year Ended | October 13, 2010 to January 1, 2011 |
January 3, 2010 to October 12, 2010 |
|||||||||||||||||||||||
| September 28, 2013 |
September 29, 2012 |
December 29, 2012 |
December 31, 2011 |
|||||||||||||||||||||||
| (in thousands) |
||||||||||||||||||||||||||
| Vinyl windows |
$ | 271,063 | $ | 261,201 | $ | 357,267 | $ | 362,570 | $ | 118,778 | $ | 316,102 | ||||||||||||||
| Vinyl siding products |
165,317 | 175,340 | 227,374 | 224,388 | 41,504 | 181,904 | ||||||||||||||||||||
| Metal products |
128,129 | 133,923 | 174,111 | 178,398 | 35,226 | 147,321 | ||||||||||||||||||||
| Third-party manufactured products |
235,758 | 223,794 | 302,966 | 320,852 | 55,511 | 196,587 | ||||||||||||||||||||
| Other products and services |
73,197 | 58,121 | 80,803 | 73,307 | 18,230 | 56,024 | ||||||||||||||||||||
|
|
|
|
|
|
|
|
|
|
|
|
|
|||||||||||||||
| Total |
$ | 873,464 | $ | 852,379 | $ | 1,142,521 | $ | 1,159,515 | $ | 269,249 | $ | 897,938 | ||||||||||||||
|
|
|
|
|
|
|
|
|
|
|
|
|
|||||||||||||||
| (2) | See footnote (a) to the table under “—Adjusted EBITDA.” |
| (3) | Reflects the reduction of interest expense and amortization of debt issuance costs as a result of the redemption of $ million in aggregate principal amount of the 9.125% notes with net proceeds received by us from this offering. |
| (4) | Reflects (a) a –for– stock split, (b) the sale by us of approximately shares of our common stock in this offering and (c) the estimated net proceeds to us from this offering, after deducting underwriting discounts and commissions and estimated offering expenses payable by us, of approximately $ million, based on the assumed initial public offering price of $ per share, which is the midpoint of the price range set forth on the front cover of this prospectus. |
| (5) | For a discussion and reconciliation of this non-GAAP financial measure to net loss, see “—Adjusted EBITDA”. |
| (6) | Working capital is defined as current assets minus current liabilities. |
| (7) | Total assets reflects the write-off of approximately $ million of debt issuance costs attributable to the redemption of $ million in aggregate principal amount of the 9.125% notes with net proceeds received by us from this offering. Total debt reflects the application of the estimated net proceeds received by us from the offering to redeem $ million in aggregate principal amount of the 9.125% notes and to pay a related redemption premium and accrued interest thereon. Additional paid-in capital on a pro forma as adjusted basis is reduced as a result of the recognition of a liability equal to the total estimated payments to be made under the tax receivable agreement. Assuming that all payments required to be made under the tax receivable agreement are made on the date that the applicable tax returns are required to be filed (without extension), the total estimated amount of such payments is approximately $ million as of December 30, 2012. |
13
Table of Contents
Adjusted EBITDA
EBITDA is calculated as net income plus interest, taxes, depreciation and amortization. Adjusted EBITDA is defined as EBITDA adjusted to reflect certain adjustments (other than run-rate cost savings) that are used in calculating covenant compliance under the amended and restated revolving credit agreement governing our ABL facilities (the “Amended and Restated Revolving Credit Agreement”) and the Indenture. We consider EBITDA and Adjusted EBITDA to be important indicators of our operational strength and performance of our business. We have included Adjusted EBITDA because it is a key financial measure used by our management to (i) assess our ability to service our debt or incur debt and meet our capital expenditure requirements; (ii) internally measure our operating performance; and (iii) determine our incentive compensation programs. EBITDA and Adjusted EBITDA are not measures determined in accordance with GAAP and should not be considered as an alternative to, or more meaningful than, net income (as determined in accordance with GAAP) as a measure of our operating results or net cash provided by operating activities (as determined in accordance with GAAP) as a measure of our liquidity. Adjusted EBITDA as presented by us may not be comparable to similarly titled measures reported by other companies.
The reconciliation of our net loss to EBITDA and Adjusted EBITDA is as follows:
| Successor | Predecessor | |||||||||||||||||||||||||
| Nine Months Ended | Year Ended | October 13, 2010 to January 1, 2011 |
January 3, 2010 to October 12, 2010 |
|||||||||||||||||||||||
| September 28, 2013 |
September 29, 2012 |
December 29, 2012 |
December 31, 2011 |
|||||||||||||||||||||||
| (in thousands) |
||||||||||||||||||||||||||
| Net loss |
$ | (31,982 | ) | $ | (36,958 | ) | $ | (38,355 | ) | $ | (202,791 | ) | $ | (65,020 | ) | $ | (71,274 | ) | ||||||||
| Interest expense, net |
59,554 | 56,688 | 75,508 | 75,731 | 16,125 | 58,759 | ||||||||||||||||||||
| Income tax expense (benefit) |
4,015 | 4,991 | 5,605 | (20,434 | ) | 8,553 | 5,220 | |||||||||||||||||||
| Depreciation and amortization |
32,617 | 39,402 | 50,678 | 51,326 | 10,498 | 17,582 | ||||||||||||||||||||
|
|
|
|
|
|
|
|
|
|
|
|
|
|||||||||||||||
| EBITDA |
64,204 | 64,123 | 93,436 | (96,168 | ) | (29,844 | ) | 10,287 | ||||||||||||||||||
| Impairment of goodwill and other intangible assets(a) |
— | — | — | 164,147 | — | — | ||||||||||||||||||||
| Merger costs(b) |
— | — | — | 585 | 7,411 | 103,467 | ||||||||||||||||||||
| Loss (gain) on debt extinguishments(c) |
— | — | — | — | 25,129 | (15,201 | ) | |||||||||||||||||||
| Purchase accounting related adjustments(d) |
(2,892 | ) | (2,889 | ) | (3,872 | ) | (3,786 | ) | 21,427 | — | ||||||||||||||||
| Restructuring costs(e) |
— | — | — | 228 | — | 88 | ||||||||||||||||||||
| Loss (gain) on disposal or write-offs of assets(f) |
93 | (17 | ) | (12 | ) | 215 | 1,230 | 43 | ||||||||||||||||||
| Executive officer separation and hiring costs(g) |
1,193 | 2,921 | 3,366 | 6,706 | 1,397 | — | ||||||||||||||||||||
| Stock-based compensation expense(h) |
123 | 82 | 96 | 709 | — | — | ||||||||||||||||||||
| Non-cash expense (benefit) adjustments(i) |
— | 2,579 | (3,300 | ) | 7,574 | — | — | |||||||||||||||||||
| Other normalizing and unusual items(j) |
7,084 | 2,315 | 6,564 | 6,673 | 3,062 | 4,156 | ||||||||||||||||||||
| Foreign currency loss (gain)(k) |
555 | 220 | 119 | 438 | 771 | (184 | ) | |||||||||||||||||||
|
|
|
|
|
|
|
|
|
|
|
|
|
|||||||||||||||
| Adjusted EBITDA(l) |
$ | 70,360 | $ | 69,334 | $ | 96,397 | $ | 87,321 | $ | 30,583 | $ | 102,656 | ||||||||||||||
|
|
|
|
|
|
|
|
|
|
|
|
|
|||||||||||||||
| (a) | We review goodwill and other intangible assets with indefinite lives for impairment on an annual basis, or more frequently if events or circumstances change that would impact the value of these assets. During the third quarter of 2011, the weaker economic conditions and lower results of operations resulted in management changing our outlook and lowering our forecast used for our discounted cash flow analysis. As a result of the lower management projections for operating results and the calculated lower per share equity value, we believed that we had an indicator of impairment and performed |
14
Table of Contents
| interim impairment testing on goodwill and indefinite lived intangibles as of September 3, 2011 resulting in impairment charges of $84.3 million during the fourth quarter of 2011 and $72.2 million during the third quarter of 2011, respectively. |
| In addition to the interim impairment testing, we performed our annual impairment test on goodwill and indefinite lived intangibles in the fourth quarter of 2011. We had revised our forecasts downward after the date of the interim impairment testing based on our annual budgeting process which resulted in an additional impairment charge related to indefinite lived intangibles of $7.7 million. No additional impairment charges were required as a result of the annual impairment test of goodwill for 2011. |
| (b) | Represents the following: |
| Successor | Predecessor | |||||||||||||||||||||||||
| Nine Months Ended | Year Ended | October 13, 2010 to January 1, 2011 |
January 3, 2010 to October 12, 2010 |
|||||||||||||||||||||||
| September 29, 2013 |
September 29, 2012 |
December 29, 2012 |
December 31, 2011 |
|||||||||||||||||||||||
| (in thousands) |
||||||||||||||||||||||||||
| Transaction costs(i) |
$ | — | $ | — | $ | — | $ | 585 | $ | 7,411 | $ | 38,416 | ||||||||||||||
| Transaction bonuses(ii) |
— | — | — | — | — | 26,231 | ||||||||||||||||||||
| Stock option compensation(iii) |
— | — | — | — | — | 38,014 | ||||||||||||||||||||
| Stock warrants expense(iv) |
— | — | — | — | — | 806 | ||||||||||||||||||||
|
|
|
|
|
|
|
|
|
|
|
|
|
|||||||||||||||
| Total |
$ | — | $ | — | $ | — | $ | 585 | $ | 7,411 | $ | 103,467 | ||||||||||||||
|
|
|
|
|
|
|
|
|
|
|
|
|
|||||||||||||||
| (i) | Predecessor expenses include investment banking, legal and other expenses, including $16.2 million of expense accrued and paid to affiliates of Investcorp International Inc. and Harvest Partners, L.P. (“Harvest Partners”) in connection with the amended and restated management agreement with Harvest Partners. Successor expenses primarily include fees paid on behalf of Merger Sub related to due diligence activities. |
| (ii) | Represents transaction bonuses paid to senior management and certain employees in connection with the Merger. |
| (iii) | Represents stock option compensation expense recognized as a result of the modification of certain stock option awards in connection with the Merger and the fair value of an in-the-money stock option award granted immediately prior to the Merger. |
| (iv) | Represents expense for stock warrants, which were redeemed for cash in connection with the Merger. The expense associated with the stock warrants has been recognized in our results of operations as a reduction in net sales in accordance with Financial Accounting Standards Board (“FASB”) Accounting Standards Codification (“ASC”) 505-50, Equity-Based Payments to Non-Employees. |
| (c) | Expenses recorded by the Predecessor for the period ended October 12, 2010 include the write-off of an accrual for all future interest payments on the 20% Senior Notes due 2014 (the “20% notes”) outstanding before the Merger, partially offset with the write-off of deferred financing fees associated with our prior asset-based credit facility (the “prior ABL facility”), which was recorded during the year ended January 2, 2010, in accordance with FASB ASC 470-60, Troubled Debt Restructurings by Debtors. Expenses recorded by the Successor include the loss on the extinguishment of the 9.875% notes and the 11.25% notes totaling $13.6 million and fees of $11.5 million related to an interim financing facility, which was negotiated, but ultimately not utilized, in conjunction with the financing for the Merger. |
15
Table of Contents
| (d) | Represents the following: |
| Successor | Predecessor | |||||||||||||||||||||||||
| Nine Months Ended | Year Ended | October 13, 2010 to January 1, 2011 |
January 3, 2010 to October 12, 2010 |
|||||||||||||||||||||||
| September 28, 2013 |
September 29, 2012 |
December 29, 2012 |
December 31, 2011 |
|||||||||||||||||||||||
| (in thousands) |
||||||||||||||||||||||||||
| Pension expense adjustment(i) |
$ | (1,999 | ) | $ | (2,015 | ) | $ | (2,689 | ) | $ | (2,694 | ) | $ | (589 | ) | $ | — | |||||||||
| Amortization related to fair value adjustment of leased facilities(ii) |
(344 | ) | (338 | ) | (448 | ) | (456 | ) | (95 | ) | — | |||||||||||||||
| Amortization related to warranty liabilities(iii) |
(549 | ) | (536 | ) | (735 | ) | (736 | ) | (153 | ) | — | |||||||||||||||
| Inventory adjustment related to the Merger(iv) |
— | — | — | — | 22,264 | — | ||||||||||||||||||||
| Inventory adjustment related to supply center acquisition(v) |
— | — | — | 100 | — | — | ||||||||||||||||||||
|
|
|
|
|
|
|
|
|
|
|
|
|
|||||||||||||||
| Total |
$ | (2,892 | ) | $ | (2,889 | ) | $ | (3,872 | ) | $ | (3,786 | ) | $ | 21,427 | $ | — | ||||||||||
|
|
|
|
|
|
|
|
|
|
|
|
|
|||||||||||||||
| (i) | Represents the elimination of the impact of reduced pension expense as a result of purchase accounting adjustments associated with the Merger. |
| (ii) | Represents the elimination of the impact of amortization related to net liabilities recorded in purchase accounting for the fair value of our leased facilities as a result of the Merger. |
| (iii) | Represents the elimination of the impact of amortization related to net liabilities recorded in purchase accounting for the fair value of warranty liabilities as a result of the Merger. |
| (iv) | Represents $23.1 million of amortization for the step-up in basis of inventory, partially offset by $0.8 million of other purchase accounting related adjustments to inventory included in cost of sales. |
| (v) | Represents the adjustment to inventory that was acquired as part of the supply center acquisition completed during the second quarter of 2011. |
| (e) | Represents manufacturing restructuring charges of $0.2 million during the year ended December 31, 2011 and legal and accounting fees of $0.1 million in connection with tax restructuring projects during the predecessor period ended October 12, 2010. During 2008, we relocated a portion of our vinyl siding production from Ennis, Texas to West Salem, Ohio and Burlington, Ontario. In connection with this change, during 2009, we discontinued the use of the warehouse facility adjacent to the Ennis manufacturing plant and recorded lease costs associated with our discontinued use of the warehouse facility adjacent to the Ennis manufacturing plant. During the second quarter of 2011, we recognized a charge of $0.2 million within selling, general and administrative expenses as a result of re-measuring the restructuring liability related to the discontinued use of the warehouse facility adjacent to our Ennis manufacturing plant. |
| (f) | Represents loss (gain) on disposals or write-offs of assets principally including $0.2 million for loss on sale of fixed assets during the year ended December 31, 2011 and $1.2 million of loss incurred during the successor period ended January 1, 2011 related to issues with a new product line, and the ultimate discontinuation of the product line by the Successor. |
| (g) | Represents separation and hiring costs, including payroll taxes and certain benefits, as follows: |
| (i) | Separation and hiring costs of $1.2 million were incurred during the nine months ended September 28, 2013, primarily related to make-whole payments to Mr. Burris, our President and Chief Executive Officer, and Mr. Morrisroe, our Senior Vice President and Chief Financial Officer. Pursuant to their respective employment agreements, these payments provide compensation to offset losses recognized on the sale of their respective residences to relocate near our corporate headquarters. |
| (ii) | Separation and hiring costs, including payroll taxes and certain benefits, and professional fees of $3.4 million during the year ended December 29, 2012 related to the hirings of Mr. Nagle, our President, AMI Distribution, and Mr. Morrisroe, the termination of Mr. Graham, our former Senior Vice President, Chief Financial Officer and Secretary in February 2012, the termination of Mr. Haumesser, our former Senior Vice President of Human Resources in April 2012, and the hiring of Mr. Kenyon, our Senior Vice President and Chief Human Resources Officer in June 2012. $2.9 million of such costs was incurred in the nine months ended September 28, 2012. |
| (iii) | Separation and hiring costs, including payroll taxes and certain benefits, and professional fees of $6.7 million during the year ended December 31, 2011 related to the terminations of Mr. Chieffe, our former President and Chief Executive Officer, and Mr. Arthur, our former Senior Vice President of Operations, in June 2011, the hiring of |
16
Table of Contents
| Mr. Snyder, our former Interim Chief Executive Officer, in June 2011, the hiring of Mr. Gaydos, our Senior Vice President of Operations in August 2011, and the hiring of Mr. Burris in September 2011. |
| (iv) | Separation costs, including payroll taxes and certain benefits, of $1.4 million in the successor period ended January 1, 2011 related to the termination of Mr. Franco, our former President of AMI Distribution. |
| (h) | Represents stock-based compensation related to restricted shares issued to certain of our directors and officers. |
| (i) | Represents the non-cash provision for warranties greater (less) than claims paid. |
| (j) | Represents the following: |
| Successor | Predecessor | |||||||||||||||||||||||||
| Nine Months Ended | Year Ended | October 13, 2010 to January 1, 2011 |
January 3, 2010 to October 12, 2010 |
|||||||||||||||||||||||
| September 28, 2013 |
September 29, 2012 |
December 29, 2012 |
December 31, 2011 |
|||||||||||||||||||||||
| (in thousands) |
||||||||||||||||||||||||||
| Professional fees(i) |
$ | 6,556 | $ | 1,011 | $ | 1,342 | $ | 3,271 | $ | 2,973 | $ | 2,734 | ||||||||||||||
| Discontinued inventory expense(ii) |
— | — | — | 1,066 | — | — | ||||||||||||||||||||
| Accretion on lease liability(iii) |
394 | 399 | 545 | 498 | 89 | 296 | ||||||||||||||||||||
| Excess severance costs(iv) |
65 | 170 | 170 | 590 | — | 389 | ||||||||||||||||||||
| Operating lease termination penalty(v) |
— | — | — | 773 | — | — | ||||||||||||||||||||
| Insurance claim payment in dispute(vi) |
(200 | ) | — | 330 | — | — | — | |||||||||||||||||||
| Excess legal expense(vii) |
202 | 641 | 4,044 | 362 | — | — | ||||||||||||||||||||
| Management fees(viii) |
— | — | — | — | — | 681 | ||||||||||||||||||||
| Bank audit fees(ix) |
67 | 94 | 133 | 113 | — | 56 | ||||||||||||||||||||
|
|
|
|
|
|
|
|
|
|
|
|
|
|||||||||||||||
| Total |
$ | 7,084 | $ | 2,315 | $ | 6,564 | $ | 6,673 | $ | 3,062 | $ | 4,156 | ||||||||||||||
|
|
|
|
|
|
|
|
|
|
|
|
|
|||||||||||||||
| (i) | Represents management’s estimate of unusual consulting and advisory fees primarily associated with cost savings and other strategic initiatives. Included in these fees are costs of $2.2 million associated with this offering. |
| (ii) | Represents management’s estimate of unusual inventory obsolescence recorded related to a new window product launch and an inventory write-off related to a process change. |
| (iii) | Represents accretion on the liability recorded at present value for future lease costs in connection with our warehouse facility adjacent to the Ennis manufacturing plant, which we discontinued using during 2009. |
| (iv) | Represents management’s estimates for excess severance expense due primarily to unusual changes within senior management. |
| (v) | Represents the excess of cash paid over the estimated fair values of purchased equipment previously leased. |
| (vi) | Represents an unusual insurance claim paid by us, which is in dispute with our insurance carrier. |
| (vii) | Represents excess legal expense incurred in connection with the defense of actions filed by plaintiffs and a putative nationwide class of homeowners regarding certain warranty related claims related to steel and aluminum siding. See Note 18 to the audited consolidated financial statements included elsewhere in this prospectus. |
| (viii) | Represents annual management fees paid to Harvest Partners before the Merger. |
| (ix) | Represents bank audit fees incurred under our current ABL facilities and our prior ABL facility. |
| (k) | Represents foreign currency (gain) loss recognized in the income statement, including loss (gain) on foreign currency exchange hedging agreements. |
17
Table of Contents
| (l) | Does not include adjustments for “run-rate” cost saving as allowed by the terms of the Indenture and our ABL facilities. Run-rate cost savings adjustments include the following: |
| Successor | Predecessor | |||||||||||||||||||||||||
| Nine Months Ended | Year Ended | October 13, 2010 to January 1, 2011 |
January 3, 2010 to October 12, 2010 |
|||||||||||||||||||||||
| September 28, 2013 |
September 29, 2012 |
December 29, 2012 |
December 31, 2011 |
|||||||||||||||||||||||
| (in thousands) |
||||||||||||||||||||||||||
| Run-rate cost savings(i) |
$ | — | $ | — | $ | 10,711 | $ | 9,449 | $ | — | $ | — | ||||||||||||||
| Insourcing glass production savings(ii) |
— | — | — | — | — | 462 | ||||||||||||||||||||
| Procurement savings(iii) |
— | — | — | — | — | 141 | ||||||||||||||||||||
|
|
|
|
|
|
|
|
|
|
|
|
|
|||||||||||||||
| Total |
$ | — | $ | — | $ | 10,771 | $ | 9,449 | $ | — | $ | 603 | ||||||||||||||
|
|
|
|
|
|
|
|
|
|
|
|
|
|||||||||||||||
| (i) | Represents our estimate of run-rate cost savings related to actions taken or to be taken within 12 months after the consummation of any acquisition, amalgamation, merger or operational change and prior to or during such period, calculated on a pro forma basis as though such cost savings had been realized on the first day of the period for which Adjusted EBITDA is being calculated, net of the amount of actual benefits realized during such period from such actions and net of the further adjustments required by the ABL facilities and the Indenture, as described below. Run-rate cost savings include actions around operational and engineering improvements, procurement savings and reductions in selling, general and administrative expenses. The run-rate cost savings were estimated to be approximately $13 million and $17 million for the years ended December 29, 2012 and December 31, 2011, respectively. Our ABL facilities and the Indenture permit us to include run-rate cost savings in our calculation of Adjusted EBITDA in an amount, taken together with the amount of certain restructuring costs, up to 10% of Consolidated EBITDA, as defined in such debt instruments. As such, only $10.7 million of the approximately $13 million of run-rate cost savings for 2012 and $9.4 million of the approximately $17 million of run-rate cost savings for 2011 were included in the calculation of Adjusted EBITDA under the ABL facilities and the Indenture for 2012 and 2011, respectively. |
| (ii) | Represents management’s estimates of cost savings that could have resulted from producing glass in-house at our Cuyahoga Falls, Ohio window facility had such production started on January 4, 2009. |
| (iii) | Represents management’s estimate of cost savings that could have resulted from entering into our leveraged procurement program with an outside consulting firm had such program been entered into on January 4, 2009. |
18
Table of Contents
Investing in our common stock involves a high degree of risk. You should carefully consider the following risk factors, as well as other information in this prospectus, before deciding whether to invest in shares of our common stock. The occurrence of any of the events described below could harm our business, financial condition, results of operations and growth prospects. In such an event, the trading price of our common stock may decline and you may lose all or part of your investment.
Risks Related to Our Business
Conditions in the housing market, consumer credit market and economic conditions generally could adversely affect demand for our products.
Our business is largely dependent on home improvement (including repair and remodeling) and new home construction activity levels in the United States and Canada. Adverse conditions in, or sustained uncertainty about, our industry or the overall economy (including inflation, deflation, interest rates, availability and cost of capital, consumer spending rates, energy availability and costs and the effects of governmental initiatives to manage economic conditions) could adversely impact consumer confidence, causing our customers to delay purchasing or determine not to purchase home improvement products and services. High unemployment, low consumer confidence, declining home prices, increased mortgage rates and tightened credit markets may limit the ability of consumers to purchase homes or to finance home improvements and may negatively affect investments in existing homes in the form of renovations and home improvements. These industry conditions and general economic conditions may have an adverse impact on our business, financial condition and results of operations.
Our focus within the building products industry amplifies the risks inherent in a general economic downturn. The impact of this weakness on our net sales, net income and margins will be determined by many factors, including industry capacity, industry pricing and our ability to implement our business plan.
Disruption in the financial markets could negatively affect us as well as our customers and suppliers, and the inability to access financing on terms and at a time acceptable to us for any reason could have a material adverse effect on our financial condition, results of operations and liquidity.
Along with our customers and suppliers, we rely on stable and efficient financial markets. Availability of financing depends on the lending practices of financial institutions, financial and credit markets, government policies and economic conditions, all of which are beyond our control. The credit markets and the financial services industry have experienced significant volatility and disruption, characterized by limitations on credit availability, persistently high unemployment rates in the United States, weakness in many real estate markets, global economic turmoil and growing debt loads for many governments. These adverse economic conditions and disrupted financial markets could compromise the financial condition of our customers and suppliers. Customers may not be able to pay, or may delay payment of, accounts receivable due to liquidity and financial performance issues or concerns affecting them or due to their inability to secure financing. Suppliers may modify, delay or cancel projects and reduce their levels of business with us. In addition, the weak credit markets may also impact the ability of the end consumer to obtain any needed financing to purchase our products, resulting in a reduction in overall demand, and consequently negatively impact our sales levels. Further volatility and disruption in the financial markets could adversely affect our ability to refinance indebtedness when required and have a material adverse effect on our financial condition, results of operations and liquidity.
19
Table of Contents
Our industry is highly competitive, and competitive pressures could have an adverse effect on us.
The markets for our products and services are highly competitive. We seek to distinguish ourselves from other suppliers of residential building products and to sustain our profitability through a business strategy focused on increasing sales at existing supply centers, selectively expanding our supply center network, increasing sales through independent specialty distributor customers, developing innovative new products, expanding sales of third-party manufactured products through our supply center network and driving operational excellence by reducing costs and increasing customer service levels. We believe that competition in the industry is based on price, product and service quality, customer service and product features. Sustained increases in competitive pressures could have an adverse effect on results of operations and negatively impact sales and margins.
We have substantial fixed costs and, as a result, operating income is sensitive to changes in net sales.
We operate with significant operating and financial leverage. Significant portions of our manufacturing costs and selling, general and administrative expenses are fixed costs that neither increase nor decrease proportionately with sales. In addition, a significant portion of our interest expense is fixed. There can be no assurance that we would be able to further reduce our fixed costs in response to a decline in net sales. As a result, a decline in our net sales could result in a higher percentage decline in our income from operations.
We may not successfully develop new products or improve existing products, and we may experience delays in the development of new products.
Our success depends on meeting customer needs, and one of the ways in which we meet customer needs is through new product development. We aim to introduce products and new or improved production processes proactively to offset obsolescence and decreases in sales of existing products. As materials technology for exterior residential building products advances, we will be expected to upgrade and adapt our existing products and production processes and introduce new products in order to continue to provide products incorporating the latest commercial innovations and meet customer expectations. We are currently working on an important update to one of our most popular window platforms. If this update fails to gain commercial acceptance, we may suffer a decline in our competitive position.
While we devote significant attention to the development of new products, we may not be successful in new product development, and our new products may not meet customer expectations or be commercially successful. To the extent we are not able to successfully develop new products, our future sales could be harmed. In addition, interruptions or delays in the development of new products and new or improved production processes could have an adverse effect on our business, financial condition and results of operations.
Increases in raw material costs and interruptions in the availability of raw materials and finished goods could adversely affect our profit margins.
The principal raw materials used by us are vinyl resin, aluminum, steel, resin stabilizers and pigments, glass, window hardware and packaging materials, all of which have historically been subject to price changes. Raw material pricing on certain of our key commodities has fluctuated significantly over the past several years, but has generally increased, and we expect raw material prices to continue to increase. In response, we have announced price increases over the past several years on certain of our product offerings to offset inflation in raw materials and continually monitor market conditions for price changes as warranted. Our ability to maintain gross margin levels on our products
20
Table of Contents
during periods of rising raw material costs depends on our ability to obtain increases in the selling price of our products. Furthermore, the results of operations for individual quarters can and have been negatively impacted by a delay between the timing of raw material cost increases and price increases on our products. There can be no assurance that we will be able to maintain the selling price increases already implemented or achieve any future price increases.
Additionally, we rely on our suppliers for deliveries of raw materials and finished goods. If any of our suppliers were unable to deliver raw materials or finished goods to us for an extended period of time, we may not be able to procure the required raw materials or finished goods through other suppliers without incurring an adverse impact on our operations. Even if acceptable alternatives were found, the process of locating and securing such alternatives might be disruptive to our business, and any such alternatives could result in increased costs for us. Extended unavailability of necessary raw materials or finished goods could cause us to cease manufacturing or distributing one or more of our products for an extended period of time.
Consolidation of our customers could adversely affect our business, financial condition and results of operations.
Though larger customers can offer efficiencies and unique product opportunities, consolidation increases their size and importance to our business. These larger customers can make significant changes in their volume of purchases and seek price reductions. Consolidation could adversely affect our margins and profitability, particularly if we were to lose a significant customer. In 2010, 2011 and 2012, sales to one customer and its licensees represented approximately 14%, 13% and 13% of total net sales, respectively. The loss of a substantial portion of sales to this customer could have a material adverse effect on our business, financial condition and results of operations.
Our substantial level of indebtedness could adversely affect our financial condition.
We have a substantial amount of indebtedness, which requires significant interest payments. As of September 28, 2013, we would have had $ million of indebtedness after giving effect to the use of proceeds of this offering and the issuance by us of $100.0 million of additional 9.125% notes in May 2013.
Our substantial level of indebtedness could have important consequences, including the following:
| Ÿ | We must use a substantial portion of our cash flow from operations to pay interest and principal on our ABL facilities and 9.125% notes and other indebtedness, which reduces funds available to us for other purposes, such as working capital, capital expenditures, other general corporate purposes and potential acquisitions; |
| Ÿ | our ability to refinance such indebtedness or to obtain additional financing for working capital, capital expenditures, acquisitions or general corporate purposes may be impaired; |
| Ÿ | we are exposed to fluctuations in interest rates because the ABL facilities have a variable rate of interest; |
| Ÿ | our leverage may be greater than that of some of our competitors, which may put us at a competitive disadvantage and reduce our flexibility in responding to current and changing industry and financial market conditions; |
| Ÿ | we may be more vulnerable to economic downturns and adverse developments in our business; and |
| Ÿ | we may be unable to comply with financial and other restrictive covenants in the ABL facilities, the Indenture and other debt instruments, as applicable, some of which require the obligor to |
21
Table of Contents
| maintain specified financial ratios and limit our ability to incur additional debt and sell assets, which could result in an event of default that, if not cured or waived, would have an adverse effect on our business and prospects and could result in bankruptcy. |
Our ability to access funding under the ABL facilities depends upon, among other things, the absence of a default under the ABL facilities, including any default arising from a failure to comply with the related covenants. If we are unable to comply with our covenants under the ABL facilities, our liquidity may be adversely affected.
Our ability to meet expenses, to remain in compliance with our covenants under our debt instruments and to make future principal and interest payments in respect of our debt depends on, among other things, our operating performance, competitive developments and financial market conditions, all of which are significantly affected by financial, business, economic and other factors. We are not able to control many of these factors. If industry and economic conditions deteriorate, our cash flow may not be sufficient to allow us to pay principal and interest on our debt and meet our other obligations.
Increases in union organizing activity and work stoppages at our facilities or the facilities of our suppliers could delay or impede our production, reduce sales of our products and increase our costs.
Our financial performance is affected by the cost of labor. As of September 28, 2013, approximately 20% of our employees were represented by labor unions. We are subject to the risk that strikes or other types of conflicts with personnel may arise or that we may become a subject of union organizing activity. Furthermore, some of our direct and indirect suppliers have unionized work forces. Strikes, work stoppages or slowdowns experienced by these suppliers could result in slowdowns or closures of facilities where components of our products are manufactured. Any interruption in the production or delivery of our products could reduce sales of our products and increase our costs.
Risks associated with our ability to continuously improve organizational productivity and supply chain efficiency and flexibility could adversely affect our business, either in an environment of potentially declining market demand or one that is volatile or resurging.
We need to continually evaluate our organizational productivity and supply chains and assess opportunities to reduce costs and assets. We must also enhance quality, speed and flexibility to meet changing and uncertain market conditions. Our success also depends in part on refining our cost structure and supply chains to promote a consistently flexible and low cost supply chain that can respond to market pressures to protect profitability and cash flow or ramp up quickly to effectively meet demand. Failure to achieve the desired level of quality, capacity or cost reductions could impair our results of operations. Despite proactive efforts to control costs and improve production in our facilities, competition could still result in lower operating margins and profitability.
Our business is seasonal and can be affected by inclement weather conditions, which could affect the timing of the demand for our products and reduce profit margins and adversely affect our financial condition when such conditions exist.
Because most of our building products are intended for exterior use, sales and operating profits tend to be lower during periods of inclement weather. Weather conditions in the first quarter of each calendar year usually result in that quarter producing significantly less net sales and net cash flows from operations than in any other period of the year. Consequently, we have historically had losses or small profits in the first quarter and reduced profits from operations in the fourth quarter of each calendar year. To meet seasonal cash flow needs during the periods of reduced sales and net cash
22
Table of Contents
flows from operations, we have typically utilized our revolving credit facilities and repay such borrowings in periods of higher cash flow. We typically generate the majority of our cash flow in the third and fourth quarters. Our inability to meet our seasonal cash flow needs because of inclement weather conditions or any other reason could have a material adverse effect on our financial condition and results of operations.
We have a history of operating losses and may not maintain profitability in the future.
We have not been consistently profitable on a quarterly or annual basis. We experienced net losses of $202.8 million, $38.4 million and $32.0 million in 2011, 2012 and the nine months ended September 28, 2013, respectively. As of September 28, 2013, our accumulated deficit was $338.2 million. We may not be able to sustain or increase our growth or profitability in the future. In addition, following the completion of this offering, we expect that our general and administrative expenses will increase due to the additional operational and reporting costs associated with being a public company. As a result of these increased expenditures and expenses, we will need to generate and sustain increased revenue to achieve future profitability expectations. We may incur significant losses in the future for a number of reasons, including the other risks and uncertainties described in this prospectus. Additionally, we may encounter unforeseen operating expenses, difficulties, complications, delays and other unknown factors that may result in losses in future periods. If these losses exceed our expectations or our growth expectations are not met in future periods, our financial performance will be affected adversely.
Our failure to attract and retain qualified personnel could adversely affect our business.
Our success depends in part on the efforts and abilities of our senior management and key employees. Their motivation, skills, experience and industry contacts significantly benefit our operations and administration. The failure to attract, motivate and retain members of our senior management and key employees could have a negative effect on our results of operations. In particular, the departure of members of our senior management could cause us to lose customers and reduce our net sales, lead to employee morale problems and the loss of key employees or cause production disruptions.
We may be able to incur more indebtedness, in which case the risks associated with our substantial leverage, including our ability to service our indebtedness, would increase.
The ABL facilities and the Indenture permit, subject to specified conditions and limitations, the incurrence of a significant amount of additional indebtedness. As of September 28, 2013, we would have been able to incur an additional $212.0 million of indebtedness under the ABL facilities, without giving effect to outstanding letters of credit or borrowing base limitations. If we incur additional debt, the risks associated with this substantial leverage and the ability to service such debt would increase.
The Indenture and the ABL facilities impose significant operating and financial restrictions on us.
The Indenture and the ABL facilities, as applicable, impose, and the terms of any future debt may impose, significant operating and financial restrictions on us. These restrictions, among other things, limit our ability and that of our subsidiaries to:
| Ÿ | pay dividends or distributions, repurchase equity, prepay junior debt and make certain investments; |
| Ÿ | incur additional debt or issue certain disqualified stock and preferred stock; |
| Ÿ | sell or otherwise dispose of assets, including capital stock of subsidiaries; |
23
Table of Contents
| Ÿ | incur liens on assets; |
| Ÿ | merge or consolidate with another company or sell all or substantially all assets; |
| Ÿ | enter into transactions with affiliates; and |
| Ÿ | enter into agreements that would restrict the ability of our subsidiaries to pay dividends or make other payments to us. |
In addition, as discussed under “Description of Indebtedness,” if our borrowing availability under the ABL facilities is below specified levels, we will be subject to compliance with a fixed charge coverage ratio. We were in compliance with our debt covenants as of September 28, 2013.
All of these covenants may adversely affect our ability to finance our operations, meet or otherwise address our capital needs, pursue business opportunities, react to market conditions or otherwise restrict activities or business plans. A breach of any of these covenants could result in a default in respect of the related indebtedness. If a default occurs, the relevant lenders could elect to declare the indebtedness, together with accrued interest and other fees, to be immediately due and payable and proceed against any collateral securing that indebtedness. If repayment of our indebtedness is accelerated as a result of such default, we cannot provide any assurance that we would have sufficient assets or access to credit to repay such indebtedness.
The obligations under the Indenture and the ABL facilities are secured by substantially all of the assets of our operating subsidiaries, including a pledge of the capital stock of such subsidiaries.
The obligations of our operating subsidiaries under the Indenture and the ABL facilities are secured by a security interest in substantially all of the present and future property and assets of such subsidiaries, including a security interest in the capital stock of such subsidiaries. If we were in default under the Indenture or the ABL facilities, the holders of the 9.125% notes or the lenders under the ABL facilities may foreclose on their collateral security under the Indenture and the ABL facilities, including substantially all of the assets of our operating subsidiaries as well as the capital stock of such operating subsidiaries. In any such event, it is possible that there would be no or limited assets remaining. See “Description of Indebtedness.”
We have significant goodwill and other intangible assets, which if impaired, could require us to incur significant charges.
As of September 28, 2013, we had $477.5 million of goodwill and $575.2 million of other intangible assets. The value of these assets is dependent, among other things, upon our future expected operating results. We are required to test for impairment of these assets annually or when factors indicating impairment are present, which could result in a write down of all or a significant portion of these assets. Any future write down of goodwill and other intangible assets could have an adverse effect on our financial condition and on the results of operations for the period in which the impairment charge is incurred.
The future recognition of our deferred tax assets is uncertain, and assumptions used to determine the amount of our deferred tax asset valuation allowance are subject to revision based on changes in tax laws and variances between future expected operating performance and actual results.
Our inability to realize deferred tax assets may have an adverse effect on our consolidated results of operations and financial condition. We recognize deferred tax assets and liabilities for the future tax consequences related to differences between the financial statement carrying amounts of existing assets and liabilities and their respective tax bases. We evaluate our deferred tax assets for recoverability based on available evidence, including assumptions about future profitability.
24
Table of Contents
Our valuation allowance is estimated based on the uncertainty of the future realization of deferred tax assets. This reflects our assessment that a portion of our deferred tax assets could expire unused if we are unable to generate taxable income in the future sufficient to utilize them or we enter into one or more transactions that limit our ability to realize all of our deferred tax assets. The assumptions used to make this determination are subject to revision based on changes in tax laws or variances between our future expected operating performance and actual results. As a result, significant judgment is required in assessing the possible need for a deferred tax asset valuation allowance. If we determine that we would not be able to realize an additional portion of the deferred tax assets in the future, we would further reduce our deferred tax asset through a charge to earnings in the period in which the determination was made. A reduction in the deferred tax asset related to existing NOLs may also result in a reduction of the payable related to the tax receivable agreement, which would result in income recognized in the period in which the determination is made. Any such net charge could have an adverse effect on our consolidated results of operations and financial condition.
We are subject to foreign exchange risk as a result of exposures to changes in currency exchange rates between the U.S. and Canada.
We are exposed to exchange rate fluctuations between the Canadian dollar and U.S. dollar. We realize revenues from sales made through our Canadian distribution centers in Canadian dollars. The exchange rate of the Canadian dollar to the U.S. dollar has been at or near historic highs in recent years. In the event that the Canadian dollar weakens in comparison to the U.S. dollar, earnings generated from Canadian operations will translate into reduced earnings in our consolidated statements of comprehensive loss reported in U.S. dollars. In addition, our Canadian subsidiary also records certain accounts receivable and accounts payable, which are denominated in U.S. dollars. Foreign currency transactional gains and losses are realized upon settlement of these assets and obligations. For more information, please see “Management’s Discussion and Analysis of Financial Condition and Results of Operations—Quantitative and Qualitative Disclosures About Market Risk—Foreign Currency Exchange Rate Risk.”
We are controlled by the H&F Investors, whose interests may be different than the interests of other holders of our securities.
Upon the completion of this offering, the H&F Investors will control approximately % of the total voting power of our common stock, or approximately % if the underwriters exercise in full their option to purchase additional shares, and will have the ability to designate a majority of the members of our board of directors. The H&F Investors are able to control actions to be taken by us, including future issuances of our common stock or other securities, the payment of dividends, if any, on our common stock, amendments to our organizational documents and the approval of significant corporate transactions, including mergers, sales of substantially all of our assets, distributions of our assets, the incurrence of indebtedness and any incurrence of liens on our assets. The interests of the H&F Investors may be materially different than the interests of our other stakeholders. In addition, the H&F Investors may have an interest in pursuing acquisitions, divestitures and other transactions that, in their judgment, could enhance their investment, even though such transactions might involve risks to you. For example, the H&F Investors may cause us to take actions or pursue strategies that could impact our ability to make payments under the Indenture and the ABL facilities or that cause a change of control. In addition, to the extent permitted by the Indenture and the ABL facilities, the H&F Investors may cause us to pay dividends rather than make capital expenditures or repay debt. The H&F Investors are in the business of making investments in companies and may from time to time acquire and hold interests in businesses that compete directly or indirectly with us. Our amended and restated certificate of incorporation will provide that none of the H&F Investors, any of their affiliates or any director who is not employed by us (including any non-employee director who serves as one of our officers in both his director and officer capacities) or his or her affiliates will have any duty to refrain
25
Table of Contents
from engaging, directly or indirectly, in the same business activities or similar business activities or lines of business in which we operate. The H&F Investors also may pursue acquisition opportunities that may be complementary to our business, and, as a result, those acquisition opportunities may not be available to us. So long as the H&F Investors continue to own a significant amount of our combined voting power, even if such amount is less than 50%, they will continue to be able to strongly influence or effectively control our decisions and, so long as the H&F Investors continue to own shares of our outstanding common stock, designate individuals to our board of directors pursuant to a stockholders agreement (the “Stockholders Agreement”) entered into in connection with the Merger on October 13, 2010 by and among us, Holdings, Associated Materials, the H&F Investors and each member of our management and board of directors that held shares of our common stock or options at that date (the “Management Investors”). See “Certain Relationships and Related Party Transactions—Stockholders Agreement.” In addition, the H&F Investors will be able to determine the outcome of all matters requiring stockholder approval and will be able to cause or prevent a change of control of our company or a change in the composition of our board of directors and could preclude any unsolicited acquisition of our company. The concentration of ownership could deprive you of an opportunity to receive a premium for your shares of common stock as part of a sale of our company and ultimately might affect the market price of our common stock.
We will be required to pay our Pre-IPO Stockholders for certain tax benefits, including net operating loss carryovers, we may claim, and the amounts we may pay could be substantial.
Immediately prior to the completion of this offering, we intend to enter into a tax receivable agreement with our Pre-IPO Stockholders. This tax receivable agreement will generally provide for the payment by us to the Pre-IPO Stockholders of 85% of the amount of cash savings, if any, in U.S. federal, state and local income tax that we realize as a result of the TRA Attributes. See “Certain Relationships and Related Party Transactions—Tax Receivable Agreement.”
The amount and timing of any payments under the tax receivable agreement will vary depending upon a number of factors, including the amount and timing of the taxable income we generate in the future and the tax rate then applicable and our use of NOL carryovers.
The payments we will be required to make under the tax receivable agreement could be substantial. We expect that, as a result of the amount of the NOL carryovers from prior periods (or portions thereof), assuming no material changes in the relevant tax law and that we earn sufficient taxable income to realize in full the potential tax benefit described above, future payments under the tax receivable agreement, in respect of the NOL carryovers, could be up to approximately $ million in the aggregate and would be paid within the next years, assuming that utilization of such tax attributes is not subject to limitation under Section 382 of the Code as the result of an “ownership change” (within the meaning of Section 382 of the Code) of Associated Materials Group, Inc. These amounts reflect only the cash savings attributable to current tax attributes resulting from the NOL carryovers. It is possible that future transactions or events could increase or decrease the actual tax benefits realized and the corresponding tax receivable agreement payments from these tax attributes. We are currently unable to estimate the amount of payments under the tax receivable agreement in respect of deductible expenses attributable to the transactions related to this offering or deductions arising from or attributable to payments under this tax receivable agreement if any.
The Pre-IPO Stockholders will not reimburse us for any payments previously made if such benefits are subsequently disallowed, however, any excess payments made to the Pre-IPO Stockholders will be netted against payments otherwise to be made, if any, after our determination of such excess. As a result, in such circumstances, we could make payments under the tax receivable agreement that are greater than our actual cash tax savings and may not be able to recoup those payments, which could adversely affect our liquidity.
26
Table of Contents
Because we are a holding company with no operations of our own, our ability to make payments under the tax receivable agreement is dependent on the ability of our subsidiaries to make distributions to us. We expect any such distributions to be funded by net cash provided by operating activities, if any, borrowing capacity under the ABL facilities and current cash and cash equivalents. The ABL facilities and the indenture governing the 9.125% notes may restrict the ability of our subsidiaries to make distributions to us, which could affect our ability to make payments under the tax receivable agreement. Associated Materials Group, Inc. is not subject to the restrictions of the ABL facilities or the 9.125% notes. To the extent that we are unable to make payments under the tax receivable agreement as a result of limitations imposed by any debt instruments to which we or any of our subsidiaries is a party, such payments will be deferred and will accrue interest at a rate of LIBOR plus basis points until paid. To the extent that we are unable to make payments under the tax receivable agreement for any other reason, such payments will be deferred and will accrue interest at a rate of LIBOR plus basis points until paid. In either case, our inability to make payments under the tax receivable agreement could adversely affect our results of operations and could also affect our liquidity in periods in which such payments are made.
In certain cases, payments under the tax receivable agreement to our Pre-IPO Stockholders may be accelerated and/or significantly exceed the actual benefits we realize in respect of the tax attributes subject to the tax receivable agreement. We have the right to terminate the tax receivable agreement early, in which case, our payment and other obligations under the tax receivable agreement will be accelerated and we would be required to make an immediate payment equal to the present value of the anticipated future tax benefits, which upfront payment may be made years in advance of the actual realization of such future benefits. Such payments could be substantial and, because they will be based on certain assumptions, could exceed our actual cash tax savings from the TRA Attributes. In these situations, our obligations under the tax receivable agreement could have a substantial negative impact on our liquidity and could have the effect of delaying, deferring or preventing certain mergers, asset sales, other forms of business combinations or other changes of control. We may not have sufficient cash available or be able to finance our obligations under the tax receivable agreement.
In addition, the tax receivable agreement provides that, upon certain change of control transactions, our or our successor’s obligations with respect to the TRA Attributes would be based on certain assumptions, including that we or our successor would have sufficient taxable income to fully utilize the NOL carryovers covered by the tax receivable agreement. As a result, upon a change of control, we may be required to make payments under the tax receivable agreement that are greater than or less than the specified percentage of our actual cash tax savings.
We could face potential product liability claims relating to products we manufacture or distribute.
We face a business risk of exposure to product liability claims in the event that the use of our products is alleged to have resulted in injury or other adverse effects. We currently maintain product liability insurance coverage, but we may not be able to obtain such insurance on acceptable terms in the future, if at all, or any such insurance may not provide adequate coverage against potential claims. Product liability claims can be expensive to defend and can divert management and other personnel for months or years regardless of the ultimate outcome. An unsuccessful product liability defense could have an adverse effect on our business, financial condition, results of operations or business prospects or ability to make payments on our indebtedness when due.
We rely on a variety of intellectual property rights. Any threat to, or impairment of, these rights could cause us to incur costs to defend these rights.
As a company that manufactures and markets branded products, we rely heavily on trademark and service mark protection to protect our brands. We also have issued patents and rely on trade secret and copyright protection for certain of our technologies. These protections may not adequately
27
Table of Contents
safeguard our intellectual property, and we may incur significant costs to defend our intellectual property rights, which may harm our operating results. There is a risk that third parties, including our current competitors, will infringe on our intellectual property rights, in which case we would have to defend these rights. There is also a risk that third parties, including our current competitors, will claim that our products infringe on their intellectual property rights. These third parties may bring infringement claims against us or our customers, which may harm our operating results.
Increases in freight costs could cause our cost of products sold to increase and net income to decrease.
Increases in freight costs can negatively impact our cost to deliver our products to our company-operated supply centers and customers and thus increase our cost of products sold. Freight costs are strongly correlated to oil prices, and increases in fuel prices, surcharges and other factors have increased freight costs and may continue to increase freight costs in the future. As we incur substantial freight costs to transport materials and components from our suppliers and to deliver finished products to our company-operated supply centers and customers, an increase in freight costs could increase our operating costs, which we may be unable to pass to our customers. If we are unable to increase the selling price of our products to our customers to cover any increases in freight costs, our net income may be adversely affected.
We may incur significant, unanticipated warranty claims.
Consistent with industry practice, we provide to homeowners limited warranties on certain products. Warranties are provided for varying lengths of time, from the date of purchase up to and including lifetime. Warranties cover product failures such as seal failures for windows and fading and peeling for siding products, as well as manufacturing defects. Warranty reserves are established annually based on management’s estimates of future warranty costs, which are primarily based on a third-party actuarial review of historical trends and sales of products to which such costs relate. To the extent that our estimates are inaccurate and we do not have adequate warranty reserves, our liability for warranty payments could have a material impact on our financial condition and results of operations.
Potential liabilities and costs from litigation could adversely affect our business, financial condition and results of operations.
We are, from time to time, involved in various claims, litigation matters and regulatory proceedings that arise in the ordinary course of our business and that could have a material adverse effect on us. These matters may include contract disputes, personal injury claims, warranty disputes, environmental claims or proceedings, other tort claims, employment and tax matters and other proceedings and litigation, including class actions.
Increasingly, home builders, including our customers, are subject to construction defect and home warranty claims in the ordinary course of their business. Our contractual arrangements with these customers typically include an agreement to indemnify them against liability for the performance of our products or services or the performance of other products that we install. These claims, often asserted several years after completion of construction, frequently result in lawsuits against the home builders and many of their subcontractors and suppliers, including us, requiring us to incur defense costs even when our products or services may not be the principal basis for the claims.
We are currently a defendant in actions filed, whereby the plaintiffs, a number of individuals and a putative nationwide class of owners of steel and aluminum siding products manufactured by us, assert a breach of express and implied warranty, along with related causes of action, claiming that an unspecified defect in the siding causes paint to peel off the metal and that we have failed adequately to honor their warranty obligations to repair, replace or refinish the defective siding (collectively, the “Steel Peel”
28
Table of Contents
litigation). Plaintiffs seek unspecified actual and punitive damages, restitution of monies paid to the defendants and an injunction against the claimed unlawful practices, together with attorneys’ fees, costs and interest. On February 13, 2013, we entered into a Settlement Agreement and Release of Claims (the “Settlement”) with the named plaintiffs. The Settlement was preliminarily approved by the Court on March 5, 2013. On August 1, 2013 following a fairness hearing the Court issued a final judgment and order approving the Settlement (“Final Judgment and Order”). The Settlement became effective on September 2, 2013 when the time period for appealing the Final Judgment and Order ended.
Although we intend to defend all claims and litigation matters vigorously, given the inherently unpredictable nature of claims and litigation, we cannot predict with certainty the outcome or effect of any claim or litigation matter, and there can be no assurance as to the ultimate outcome of any such matter.
We maintain insurance against some, but not all, of these risks of loss resulting from claims and litigation. We may elect not to obtain insurance if we believe the cost of available insurance is excessive relative to the risks presented. The levels of insurance we maintain may not be adequate to fully cover any and all losses or liabilities. If any significant accident, judgment, claim or other event is not fully insured or indemnified against, it could have a material adverse impact on our business, financial condition and results of operations.
We are subject to various environmental statutes and regulations, which may result in significant costs and liabilities.
Our operations are subject to various U.S. and Canadian environmental statutes and regulations, including those relating to: materials used in our products and operations; discharge of pollutants into the air, water and soil; treatment, transport, storage and disposal of solid and hazardous wastes and remediation of soil and groundwater contamination. Such laws and regulations may also impact the cost and availability of materials used in manufacturing our products. Our facilities are subject to investigations by governmental regulators, which occur from time to time. While our management does not currently expect the costs of compliance with environmental requirements to increase materially, future expenditures may increase as compliance standards and technology change.
Also, we cannot be certain that we have identified all environmental matters giving rise to potential liability. Our past use of hazardous materials, releases of hazardous substances at or from currently or formerly owned or operated properties, newly discovered contamination at any of our current or formerly owned or operated properties or at off-site locations such as waste treatment or disposal facilities, more stringent future environmental requirements (or stricter enforcement of existing requirements) or our inability to enforce indemnification agreements could result in increased expenditures or liabilities, which could have an adverse effect on our business and financial condition. For further details regarding environmental matters giving rise to potential liability, see “Business—Legal Proceedings.”
Legislative or regulatory initiatives related to global warming / climate change concerns may negatively impact our business.
Recently, there has been an increasing focus on global climate change, including increased attention from regulatory agencies and legislative bodies. This increased focus may lead to new initiatives directed at regulating an unspecified array of environmental matters. Legislative, regulatory or other efforts in the U.S. to combat climate change could result in future increases in taxes and the cost of raw materials, transportation and utilities for us and our suppliers, which would result in higher operating costs for us. However, our management is unable to predict at this time the potential effects, if any, that any future environmental initiatives may have on our business.
Additionally, the recent legislative and regulatory responses related to climate change could create financial risk. Many governing bodies have been considering various forms of legislation related to
29
Table of Contents
greenhouse gas emissions. Increased public awareness and concern may result in more laws and regulations requiring reductions in or mitigation of the emission of greenhouse gases. Our facilities may be subject to regulation under climate change policies introduced within the next few years. There is a possibility that, when and if enacted, the final form of such legislation could increase our costs of compliance with environmental laws. If we are unable to recover all costs related to complying with climate change regulatory requirements, it could have a material adverse effect on our results of operations.
Declining returns in the investment portfolio of our defined benefit pension plans and changes in actuarial assumptions could increase the volatility in our pension expense and require us to increase cash contributions to the plans.
We sponsor a number of defined benefit pension plans for our employees in the U.S. and Canada. Pension expense for the defined benefit pension plans sponsored by us is determined based upon a number of actuarial assumptions, including expected long-term rates of return on assets and discount rates. The use of these assumptions makes our pension expense and cash contributions subject to year-to-year volatility. Declines in market conditions, changes in pension law and uncertainties regarding significant assumptions used in the actuarial valuations can have a material impact on future required contributions to our pension plans and could result in additional charges to equity and an increase in future pension expense and cash contributions.
We may not be able to consummate and effectively integrate future acquisitions, if any.
We may from time to time engage in strategic acquisitions if we determine that they will provide future financial and operational benefits. Successful completion of any strategic transaction depends on a number of factors that are not entirely within our control, including our ability to negotiate acceptable terms, conclude satisfactory agreements and obtain all necessary regulatory approvals. In addition, our ability to effectively integrate any potential acquisitions into our existing business and culture may not be successful, which could jeopardize future operational performance for the combined businesses.
Failure of certain of our technology could disrupt our operations and adversely affect our financial condition.
We rely on certain information technology systems to process, transmit, store, and protect electronic information. Furthermore, communications between our personnel, customers, and suppliers is largely dependent on information technology. Our information technology systems could be interrupted as a result of events that may be beyond our control, including, but not limited to, natural disasters, terrorist attacks, cyber attacks, telecommunications failures, additional security issues, and other technology failures. Our technology and information security processes and disaster recovery plans may not be adequate or implemented properly to ensure that our operations are not disrupted. In addition, while our information technology systems are current, underinvestment in our technology solutions as technology advances could result in disruptions in our business.
Risks Related to this Offering and Ownership of Our Common Stock
No market currently exists for our common stock, and an active, liquid trading market for our common stock may not develop, which may cause our common stock to trade at a discount from the initial offering price and make it difficult for you to sell the common stock you purchase.
Prior to this offering, there has not been a public market for our common stock. We cannot predict the extent to which investor interest in us will lead to the development of a trading market on the NYSE or Nasdaq, as applicable, or otherwise or how active and liquid that market may become. If an active and liquid trading market does not develop or continue, you may have difficulty selling any shares of our common stock that you purchase. The initial public offering price for the shares will be determined
30
Table of Contents
by negotiations between us and the underwriters and may not be indicative of prices that will prevail in the open market following this offering. The market price of our common stock may decline below the initial offering price, and you may not be able to sell your shares of our common stock at or above the price you paid in this offering, or at all.
You will incur immediate dilution in the net tangible book value of the shares you purchase in this offering.
The initial public offering price of our common stock will be higher than the net tangible book value per share of outstanding common stock prior to completion of this offering. Based on our net tangible book value as of September 28, 2013 and upon the issuance and sale of shares of common stock by us at an assumed initial public offering price of $ per share, which is the midpoint of the price range set forth on the front cover of this prospectus, if you purchase our common stock in this offering, you will suffer immediate dilution of approximately $ per share in net tangible book value. Dilution is the amount by which the offering price paid by purchasers of our common stock in this offering will exceed the pro forma net tangible book value per share of our common stock upon completion of this offering. A total of shares of common stock have been reserved for future issuance under the 2013 Plan. You may experience additional dilution upon future equity issuances or the exercise of stock options to purchase common stock granted to our directors, officers and employees under our current and future stock incentive plans, including the 2013 Plan. See “Dilution.”
Our stock price may change significantly following this offering, and you may not be able to resell shares of our common stock at or above the price you paid or at all, and you could lose all or part of your investment as a result.
The trading price of our common stock is likely to be volatile. The stock market has experienced extreme volatility. This volatility often has been unrelated or disproportionate to the operating performance of particular companies. We and the underwriters will negotiate to determine the initial public offering price. You may not be able to resell your shares at or above the initial public offering price due to a number of factors such as those listed in “—Risks Related to Our Business” and the following:
| Ÿ | results of operations that vary from the expectations of securities analysts and investors; |
| Ÿ | results of operations that vary from those of our competitors; |
| Ÿ | changes in expectations as to our future financial performance, including financial estimates and investment recommendations by securities analysts and investors; |
| Ÿ | declines in the market prices of stocks generally; |
| Ÿ | strategic actions by us or our competitors; |
| Ÿ | announcements by us or our competitors of significant contracts, new products, acquisitions, joint marketing relationships, joint ventures, other strategic relationships or capital commitments; |
| Ÿ | changes in general economic or market conditions or trends in our industry or markets; |
| Ÿ | changes in business or regulatory conditions; |
| Ÿ | future sales of our common stock or other securities; |
| Ÿ | investor perceptions of the investment opportunity associated with our common stock relative to other investment alternatives; |
| Ÿ | the public’s response to press releases or other public announcements by us or third parties, including our filings with the Securities and Exchange Commission (the “SEC”); |
| Ÿ | announcements relating to litigation; |
31
Table of Contents
| Ÿ | guidance, if any, that we provide to the public, any changes in this guidance or our failure to meet this guidance; |
| Ÿ | the development and sustainability of an active trading market for our stock; |
| Ÿ | changes in accounting principles; and |
| Ÿ | other events or factors, including those resulting from natural disasters, war, acts of terrorism or responses to these events. |
These broad market and industry fluctuations may adversely affect the market price of our common stock, regardless of our actual operating performance. In addition, price volatility may be greater if the public float and trading volume of our common stock are low.
In the past, following periods of market volatility, stockholders have instituted securities class action litigation. If we were involved in securities litigation, it could have a substantial cost and divert resources and the attention of executive management from our business regardless of the outcome of such litigation.
We are a holding company with no operations and rely on our operating subsidiaries to provide us with funds necessary to meet our financial obligations.
We are a holding company with no material direct operations. Our principal assets are the shares of common stock we hold in Holdings. Holdings wholly owns Associated Materials, LLC, which owns our operating assets. As a result, we are dependent on loans, dividends and other payments from Associated Materials, LLC to generate the funds necessary to meet our financial obligations. Associated Materials, LLC is legally distinct from us and may be prohibited or restricted from paying dividends or otherwise making funds available to us under certain conditions. If we are unable to obtain funds from Associated Materials, LLC, we may be unable to meet our financial obligations.
We currently do not intend to pay dividends on our common stock and, as a result, your only opportunity to achieve a return on your investment is if the price of our common stock appreciates.
We currently do not expect to declare or pay dividends on our common stock in the foreseeable future. Instead, we anticipate that all of our earnings in the foreseeable future will be used to provide working capital, to support our operations and to finance the growth and development of our business. Any determination to declare or pay dividends in the future will be at the discretion of our board of directors, subject to applicable laws and dependent upon a number of factors, including our earnings, capital requirements and overall financial conditions. In addition, our ability to pay dividends on our common stock is currently limited by the covenants of our ABL facilities and 9.125% notes and may be further restricted by the terms of any future debt or preferred securities. Accordingly, your only opportunity to achieve a return on your investment in our company may be if the market price of our common stock appreciates and you sell your shares at a profit. The market price for our common stock may never exceed, and may fall below, the price that you pay for such common stock.
If securities analysts do not publish research or reports about our business or if they downgrade our stock or our sector, our stock price and trading volume could decline.
The trading market for our common stock will rely in part on the research and reports that industry or financial analysts publish about us or our business or industry. We do not control these analysts. Furthermore, if one or more of the analysts who do cover us downgrade our stock or our industry, or the stock of any of our competitors, or publish inaccurate or unfavorable research about our business or industry, the price of our stock could decline. If one or more of these analysts ceases coverage of us or fails to publish reports on us regularly, we could lose visibility in the market, which in turn could cause our stock price or trading volume to decline.
32
Table of Contents
Future sales, or the perception of future sales, by us or our existing stockholders in the public market following this offering could cause the market price for our common stock to decline.
After this offering, the sale of shares of our common stock in the public market, or the perception that such sales could occur, could harm the prevailing market price of shares of our common stock. These sales, or the possibility that these sales may occur, also might make it more difficult for us to sell equity securities in the future at a time and at a price that we deem appropriate.
Upon consummation of this offering, we will have a total of shares of common stock outstanding. All shares sold in this offering will be freely tradable without restriction or further registration under the Securities Act of 1933, as amended (the “Securities Act”), except that any shares held by our affiliates, as that term is defined under Rule 144 of the Securities Act (“Rule 144”), including our directors, executive officers and other affiliates (including affiliates of the H&F Investors) may be sold only in compliance with the limitations described in “Shares Eligible for Future Sale.”
The shares held by the H&F Investors and certain of our directors, officers and employees immediately following the consummation of this offering will represent approximately % of our total outstanding shares of common stock following this offering, based on the number of shares outstanding as of September 28, 2013. Such shares will be “restricted securities” within the meaning of Rule 144 and subject to certain restrictions on resale following the consummation of this offering. Restricted securities may be sold in the public market only if they are registered under the Securities Act or are sold pursuant to an exemption from registration such as Rule 144, as described in “Shares Eligible for Future Sale.”
In connection with this offering, we, our directors and executive officers, and holders of substantially all of our common stock prior to this offering have each agreed with the underwriters, subject to certain exceptions, not to dispose of or hedge any of our or their common stock or securities convertible into or exchangeable for shares of common stock during the period from the date of this prospectus continuing through the date 180 days after the date of this prospectus, except with the prior written consent of the representatives of the underwriters. See “Underwriting” for a description of these lock-up agreements.
Upon the expiration of the contractual lock-up agreements pertaining to this offering, up to an additional shares will be eligible for sale in the public market, of which are held by directors, executive officers and other affiliates and will be subject to volume, manner of sale and other limitations under Rule 144. Following completion of this offering, shares covered by registration rights would represent approximately % of our outstanding common stock (or %, if the underwriters exercise in full their option to purchase additional shares). Registration of any of these outstanding shares of common stock would result in such shares becoming freely tradable without compliance with Rule 144 upon effectiveness of the registration statement. See “Shares Eligible for Future Sale.”
As restrictions on resale end or if these stockholders exercise their registration rights, the market price of our shares of common stock could drop significantly if the holders of these shares sell them or are perceived by the market as intending to sell them. These factors could also make it more difficult for us to raise additional funds through future offerings of our shares of common stock or other securities.
In addition, the shares of our common stock reserved for future issuance under the 2013 Plan will become eligible for sale in the public market once those shares are issued, subject to provisions relating to various vesting agreements, lock-up agreements and Rule 144, as applicable. A total of shares of common stock have been reserved for future issuance under the 2013 Plan.
In the future, we may also issue our securities in connection with investments or acquisitions. The amount of shares of our common stock issued in connection with an investment or acquisition could constitute a material portion of our then-outstanding shares of our common stock. Any issuance of additional securities in connection with investments or acquisitions may result in additional dilution to you.
33
Table of Contents
Provisions in our organizational documents could delay or prevent a change of control.
Certain provisions of our amended and restated articles of incorporation and amended and restated bylaws may have the effect of delaying or preventing a merger, acquisition, tender offer, takeover attempt or other change of control transaction that a stockholder might consider to be in its best interest, including attempts that might result in a premium over the market price of our common stock.
These provisions provide for, among other things:
| Ÿ | a classified board of directors with staggered three-year terms; |
| Ÿ | the ability of our board of directors to issue one or more series of preferred stock with voting or other rights or preferences that could have the effect of impeding the success of an attempt to acquire us or otherwise effect a change of control; |
| Ÿ | advance notice for nominations of directors by stockholders and for stockholders to include matters to be considered at stockholder meetings; |
| Ÿ | the right of the H&F Investors and certain of their affiliates, determined in proportion to collective ownership of our common stock, to nominate up to a certain percentage of the members of our board of directors; |
| Ÿ | certain limitations on convening special stockholder meetings; and |
| Ÿ | that certain provisions of our amended and restated articles of incorporation and amended and restated bylaws may be amended only by the affirmative vote of the holders of at least two-thirds in voting power of all the then-outstanding shares of our stock entitled to vote thereon, voting together as a single class, if the H&F Investors and certain of their affiliates beneficially own, in the aggregate, less than 40% in voting power of our stock entitled to vote generally in the election of directors. |
These provisions could make it more difficult for a third party to acquire us, even if the third-party’s offer may be considered beneficial by many of our stockholders. As a result, our stockholders may be limited in their ability to obtain a premium for their shares. See “Description of Capital Stock.”
We will be a “controlled company” within the meaning of the applicable stock exchange rules and the rules of the SEC. As a result, we will qualify for, and intend to rely on, exemptions from certain corporate governance requirements that provide protection to stockholders of other companies.
After completion of this offering, the H&F Investors will continue to control a majority of the voting power of our outstanding common stock. As a result, we will be a “controlled company” within the meaning of the corporate governance standards of the NYSE or Nasdaq, as applicable. Under these rules, a company of which more than 50% of the voting power is held by an individual, group or another company is a “controlled company” and may elect not to comply with certain corporate governance requirements, including:
| Ÿ | the requirement that a majority of our board of directors consist of “independent directors” as defined under the rules of the NYSE or Nasdaq, as applicable; |
| Ÿ | the requirement that we have a compensation committee that is composed entirely of independent directors with a written charter addressing the committee’s purpose and responsibilities; |
| Ÿ | the requirement that we have a nominating and corporate governance committee that is composed entirely of independent directors with a written charter addressing the committee’s purpose and responsibilities; and |
34
Table of Contents
| Ÿ | the requirement for an annual performance evaluation of the compensation and nominating and corporate governance committees. |
Following this offering, we intend to utilize these exemptions. As a result, we will not have a majority of independent directors, our nominating/corporate governance committee, if any, and compensation committee will not consist entirely of independent directors and such committees will not be subject to annual performance evaluations. Accordingly, you will not have the same protections afforded to stockholders of companies that are subject to all of the corporate governance requirements of the NYSE or Nasdaq, as applicable.
In addition, on June 20, 2012, the SEC passed final rules implementing provisions of the Dodd-Frank Wall Street Reform and Consumer Protection Act of 2010 pertaining to compensation committee independence and the role and disclosure of compensation consultants and other advisers to the compensation committee. The SEC’s rules directed each of the national securities exchanges (including the NYSE or Nasdaq, as applicable, on which we have applied to list our common stock) to develop listing standards requiring, among other things, that:
| Ÿ | compensation committees be composed of fully independent directors, as determined pursuant to new independence requirements; |
| Ÿ | compensation committees be explicitly charged with hiring and overseeing compensation consultants, legal counsel and other committee advisors; and |
| Ÿ | compensation committees be required to consider, when engaging compensation consultants, legal counsel or other advisors, certain independence factors, including factors that examine the relationship between the consultant or advisor’s employer and us. |
On January 11, 2013, the SEC approved the proposed listing standards of the national securities exchanges. As a “controlled company,” we will not be subject to these compensation committee independence requirements.
We may be unsuccessful in implementing required internal controls over financial reporting.
We are not currently required to comply with the SEC’s rules implementing Section 404 of the Sarbanes-Oxley Act of 2002, and are therefore not required to make a formal assessment of the effectiveness of our internal controls over financial reporting for that purpose. Upon becoming a public company, we will be required to disclose changes made in our internal controls and procedures on a quarterly basis. However, our independent registered public accounting firm will not be required to formally attest to the effectiveness of our internal control over financial reporting pursuant to Section 404 until the year following our first annual report required to be filed with the SEC. At such time, our independent registered public accounting firm may issue a report that is adverse if it is not satisfied with the level at which our controls are documented, designed or operating.
We cannot provide any assurance that significant deficiencies or material weaknesses in our internal control over financial reporting will not be identified in the future. If we fail to remediate any significant deficiencies or material weaknesses that may be identified in the future, or encounter problems or delays in the implementation of internal controls over financial reporting, we may be unable to conclude that our internal controls over financial reporting are effective. Any failure to develop or maintain effective controls or any difficulties encountered in our implementation of our internal controls over financial reporting could result in material misstatements that are not prevented or detected on a timely basis, which could potentially subject us to sanctions or investigations by the SEC or other regulatory authorities. Ineffective internal controls could cause investors to lose confidence in us and the reliability of our financial statements and cause a decline in the price of our common stock.
35
Table of Contents
SPECIAL NOTE REGARDING FORWARD-LOOKING STATEMENTS
All statements (other than statements of historical facts) in this prospectus regarding the prospects of the industry and our prospects, plans, financial position and business strategy may constitute forward-looking statements. In addition, forward-looking statements generally can be identified by the use of forward-looking terminology such as “may,” “should,” “expect,” “intend,” “will,” “estimate,” “anticipate,” “believe,” “predict,” “potential” or “continue” or the negatives of these terms or variations of them or similar terminology. Although we believe that the expectations reflected in these forward-looking statements are reasonable, we cannot provide any assurance that these expectations will prove to be correct. Such statements reflect the current views of our management with respect to our operations, results of operations and future financial performance. The following factors are among those that may cause actual results to differ materially from the forward-looking statements:
| Ÿ | declines in remodeling and home building industries, economic conditions and changes in interest rates, foreign currency exchange rates and other conditions; |
| Ÿ | deteriorations in availability of consumer credit, employment trends, levels of consumer confidence and spending and consumer preferences; |
| Ÿ | increases in competition from other manufacturers of vinyl and metal exterior residential building products as well as alternative building products; |
| Ÿ | our substantial fixed costs; |
| Ÿ | delays in the development of new or improved products or our inability to successfully develop new or improved products; |
| Ÿ | changes in raw material costs and availability of raw materials and finished goods; |
| Ÿ | consolidation of our customers; |
| Ÿ | our substantial level of indebtedness; |
| Ÿ | increases in union organizing activity; |
| Ÿ | our ability to continuously improve organizational productivity and global supply chain efficiency and flexibility; |
| Ÿ | changes in weather conditions; |
| Ÿ | our history of operating losses; |
| Ÿ | limitations on our NOLs and payments under the tax receivable agreement to our current stockholders; |
| Ÿ | our ability to attract and retain qualified personnel; |
| Ÿ | increases in our indebtedness; |
| Ÿ | our ability to comply with certain financial covenants in the Indenture and ABL facilities and the restrictions such indentures impose on our ability to operate our business; |
| Ÿ | in the event of a default under the Indenture or the ABL facilities, the ability of creditors under the Indenture and ABL facilities to foreclose on the capital stock of our operating subsidiaries; |
| Ÿ | any impairment of goodwill or other intangible assets; |
| Ÿ | future recognition of our deferred tax assets; |
| Ÿ | increases in mortgage rates, changes in mortgage interest deductions and the reduced availability of financing; |
| Ÿ | our exposure to foreign currency exchange risk; and |
| Ÿ | our control by the H&F Investors. |
36
Table of Contents
The preceding list is not intended to be an exhaustive list of all of our forward-looking statements. The forward-looking statements are based on our beliefs, assumptions and expectations of future performance, taking into account the information currently available to us. These statements are only predictions based upon our current expectations and projections about future events. There are important factors that could cause our actual results, level of activity, performance or achievements to differ materially from the results, level of activity, performance or achievements expressed or implied by the forward-looking statements. Other sections of this prospectus may include additional factors that could adversely impact our business and financial performance. Moreover, we operate in a very competitive and rapidly changing environment. New risks emerge from time to time and it is not possible for our management to predict all risks, nor can we assess the impact of all factors on our business or the extent to which any factor, or combination of factors, may cause actual results to differ materially from those contained in any forward-looking statements we may make. Before investing in our common stock, investors should be aware that the occurrence of the events described under the caption “Risk Factors” and elsewhere in this prospectus could have a material adverse effect on our business, results of operations and financial condition.
You should not rely upon forward-looking statements as predictions of future events. Although we believe that the expectations reflected in the forward-looking statements are reasonable, we cannot guarantee that the future results, levels of activity, performance and events and circumstances reflected in the forward-looking statements will be achieved or occur. Except as required by law, we undertake no obligation to update publicly any forward-looking statements for any reason after the date of this prospectus to conform these statements to actual results or to changes in our expectations.
37
Table of Contents
We estimate that we will receive net proceeds of approximately $ million from the sale of shares of our common stock in this offering, based on an assumed initial public offering price of $ per share, which is the midpoint of the price range set forth on the front cover of this prospectus, and after deducting the underwriting discounts and commissions and estimated offering expenses.
We intend to use net proceeds from this offering to redeem $ million in aggregate principal amount of the 9.125% notes and to pay approximately $ million of redemption premium, plus accrued interest thereon, pursuant to provisions in the Indenture. As of September 28, 2013, $830.0 million aggregate principal amount of the 9.125% notes was outstanding. The 9.125% notes mature on November 1, 2017 and have an interest rate of 9.125%. See “Description of Indebtedness.” We intend to use the remainder of the net proceeds from this offering for general corporate purposes. On May 1, 2013, Associated Materials and AMH New Finance, Inc. issued and sold $100.0 million in aggregate principal amount of additional 9.125% notes (the “new notes”) at an issue price of 106.00% of the principal amount of the new notes in a private placement. We used the net proceeds of the offering to repay outstanding borrowings under our ABL facilities, including the prepayment and termination of our existing tranche B revolving credit commitments, thereby reducing our total credit commitment by $12.0 million to $213.0 million, and for other general corporate purposes.
To the extent we raise more proceeds in this offering than currently estimated, we will use such proceeds for general corporate purposes. To the extent we raise less in this offering than currently estimated, we may, if necessary, reduce the amount of the 9.125% notes that will be redeemed.
A $1.00 increase (decrease) in the assumed initial public offering price of $ per share, based on the midpoint of the price range set forth on the front cover of this prospectus, would increase (decrease) the net proceeds to us from this offering by $ million, assuming the number of shares offered by us, as set forth on the front cover of this prospectus, remains the same and after deducting the underwriting discounts and commissions and estimated offering expenses payable by us. An increase (decrease) of 100,000 shares from the expected number of shares to be sold by us in this offering, assuming no change in the assumed initial public offering price per share, which is the midpoint of the price range set forth on the front cover of this prospectus, would increase (decrease) our net proceeds from this offering by $ million.
Certain of the underwriters and/or their affiliates hold a position in our 9.125% notes and, in connection with the redemption of the 9.125% notes with proceeds from this offering, will receive a pro rata portion of the net proceeds of this offering.
38
Table of Contents
We have never declared or paid any dividends on our common stock and do not expect to declare or pay any dividends on our common stock in the foreseeable future. Instead, we anticipate that all of our earnings in the foreseeable future will be used to provide working capital, to support our operations, to finance the growth and development of our business and to reduce our net debt. Any determination to declare or pay dividends in the future will be at the discretion of our board of directors, subject to applicable laws, and will be dependent on a number of factors, including our earnings, capital requirements and overall financial condition. In addition, our ability to pay dividends on our common stock is limited by the covenants of our ABL facilities and the terms of the indenture governing the 9.125% notes and may be further restricted by the terms of any future debt or preferred securities. See “Description of Indebtedness” for more information about our ABL facilities and the indenture governing the 9.125% notes.
39
Table of Contents
The following table sets forth our cash and cash equivalents and capitalization as of September 28, 2013:
| Ÿ | on an actual basis; and |
| Ÿ | on a pro forma as adjusted basis, giving effect to (1) the sale by us of approximately shares of our common stock in this offering based on an assumed initial public offering price of $ per share, which is the midpoint of the price range set forth on the front cover of this prospectus, after deducting the estimated underwriting discounts and commissions and estimated offering expenses payable by us, (2) the application of the estimated net proceeds from the offering to redeem $ million in aggregate principal amount of the 9.125% notes and to pay a related redemption premium and accrued interest thereon, as described in “Use of Proceeds,” (3) the filing and effectiveness of our amended and restated certificate of incorporation and the effectiveness of our amended and restated bylaws in connection with the closing of this offering and (4) entry into a tax receivable agreement with our Pre-IPO Stockholders. |
You should read this table together with “Selected Consolidated Financial Data” and “Management’s Discussion and Analysis of Financial Condition and Results of Operations” and our financial statements and the related notes appearing elsewhere in this prospectus.
| As of September 28, 2013 | ||||||||
| Actual | Pro Forma As Adjusted(1) |
|||||||
| (in thousands, except share data) | ||||||||
| Cash and cash equivalents |
$ | 10,204 | $ | |||||
|
|
|
|
|
|||||
| Long-term debt, including current portion of long-term debt: |
||||||||
| ABL facilities(2) |
$ | 1,000 | $ | 1,000 | ||||
| 9.125% notes |
835,523 | |||||||
| Other long-term debt |
— | — | ||||||
|
|
|
|
|
|||||
| Total debt, including current portion |
836,523 | |||||||
| Stockholders’ equity: |
||||||||
| Common stock, $0.01 par value; 200,000,000 shares authorized, 55,777,894 shares issued and outstanding, actual; shares authorized, shares issued and outstanding, as adjusted |
557 | |||||||
| Preferred stock, $0.01 par value; 5,000,000 shares authorized, no shares issued and outstanding, actual; shares authorized, no shares issued and outstanding, as adjusted |
— | — | ||||||
| Additional paid-in capital(3) |
554,770 | |||||||
| Accumulated deficit |
(338,148 | ) | ||||||
| Accumulated other comprehensive loss |
(26,213 | ) | ||||||
| Total stockholders’ equity |
190,966 | |||||||
|
|
|
|
|
|||||
| Total capitalization |
$ | 1,027,989 | $ | |||||
|
|
|
|
|
|||||
| (1) | A $1.00 increase or decrease in an assumed initial public offering price of $ per share, which is the midpoint of the price range set forth on the front cover of this prospectus, would increase or decrease, as applicable, cash and cash equivalents, additional paid-in capital, total stockholders’ equity and total capitalization by $ , assuming the number of shares offered by us, as set forth on the front cover of this prospectus, remains the same and after deducting assumed underwriting discounts and commissions and the estimated offering expenses payable by us. An |
40
Table of Contents
| increase or decrease of 100,000 shares in the number of shares sold in this offering by us would increase or decrease, as applicable, cash and cash equivalents, additional paid-in capital, total stockholders’ equity and total capitalization by $ , assuming an initial public offering price of $ per share, which is the midpoint of the price range set forth on the front cover of this prospectus, and after deducting assumed underwriting discounts and commissions and the estimated offering expenses payable by us. |
| (2) | Borrowings of up to $124.3 million were available as of September 28, 2013 under the U.S. tranche and up to $57.7 million are available under the Canadian tranche of the ABL facilities after giving effect to the amendments to the ABL facilities in April 2013 and outstanding letters of credit and borrowing base limitations as of such date. |
| (3) | Additional paid-in capital on a pro forma as adjusted basis is reduced as a result of the recognition of a liability equal to the total estimated payments to be made under the tax receivable agreement. Assuming that all payments required to be made under the tax receivable agreement are made on the date that the applicable tax returns are required to be filed (without extension), the total estimated amount of such payments is approximately $ as of December 30, 2012. |
The number of shares of our common stock to be outstanding immediately after this offering is based on 55,777,894 shares outstanding as of September 28, 2013 and excludes:
| Ÿ | shares of common stock issuable upon the exercise of outstanding options with a weighted-average exercise price of $ per share; |
| Ÿ | shares of common stock available for future grant under 2010 Plan; and |
| Ÿ | shares of common stock available for future grant under 2013 Plan, which we expect to be effective prior to the closing of this offering. |
41
Table of Contents
If you invest in our common stock in this offering, your ownership interest in us will be diluted to the extent of the difference between the initial public offering price per share of our common stock and the net tangible book value per share of our common stock as adjusted to give effect to this offering. Dilution results from the fact that the per share offering price of the common stock is substantially in excess of the book value per share attributable to the shares of common stock held by existing stockholders.
Our net tangible book deficit as of September 28, 2013 was approximately $861.7 million, or $ per share. We calculate net tangible book value per share by taking the amount of our total tangible assets, reduced by the amount of our total liabilities, and then dividing that amount by the total number of shares of common stock outstanding.
After giving effect to our sale of the shares in this offering at an assumed initial public offering price of $ per share, which is the midpoint of the price range set forth on the front cover of this prospectus, and after deducting estimated underwriting discounts and commissions and offering expenses payable by us, our net tangible book value as adjusted to give effect to this offering on September 28, 2013 would have been $ million, or $ per share. This amount represents an immediate increase in net tangible book value of $ per share to existing stockholders and an immediate and substantial dilution in net tangible book value of $ per share to new investors purchasing shares in this offering at the assumed initial public offering price.
The following table illustrates this dilution on a per share basis:
| Assumed initial public offering price per share |
$ | |||||||
| Net tangible book value per share as of September 28, 2013 |
$ | |||||||
| Increase in net tangible book value per share attributable to new investors purchasing shares in this offering |
||||||||
|
|
|
|||||||
| Net tangible book value per share as adjusted to give effect to this offering |
||||||||
|
|
|
|||||||
| Dilution per share to new investors in this offering |
$ | |||||||
|
|
|
Dilution is determined by subtracting net tangible book value per share of common stock as adjusted to give effect to this offering, from the initial public offering price per share of common stock.
Assuming the number of shares offered by us, as set forth on the front cover of this prospectus, remains the same, after deducting estimated underwriting discounts and commissions and offering expenses payable by us, a $1.00 increase or decrease in the assumed initial public offering price of $ per share, which is the midpoint of the price range set forth on the front cover of this prospectus, would increase or decrease the net tangible book value attributable to new investors purchasing shares in this offering by $ per share and the dilution to new investors by $ per share and increase or decrease the net tangible book value per share, as adjusted to give effect to this offering, by $ per share.
The following table summarizes, as of September 28, 2013, the differences between the number of shares purchased from us, the total consideration paid to us, and the average price per share paid by existing stockholders and by new investors. As the table shows, new investors purchasing shares in this offering will pay an average price per share substantially higher than our existing stockholders paid. The table below is based on shares of common stock outstanding immediately after the consummation of this offering and does not give effect to the shares of common stock reserved for future issuance under the 2013 Plan. A total of shares of common stock has been reserved for
42
Table of Contents
future issuance under the 2013 Plan. The table below assumes an initial public offering price of $ per share, which is the midpoint of the price range set forth on the front cover of this prospectus, for shares purchased in this offering and excludes underwriting discounts and commissions and estimated offering expenses payable by us:
| Shares Purchased | Total Consideration | Average Price Per Share |
||||||||||||||||
| Number | Percent | Amount | Percent | |||||||||||||||
| (millions) | ||||||||||||||||||
| Existing stockholders |
% | $ | 553.5 | % | $ | |||||||||||||
| New investors |
||||||||||||||||||
|
|
|
|
|
|
|
|
|
|
||||||||||
| Total |
% | $ | % | $ | ||||||||||||||
|
|
|
|
|
|
|
|
|
|
||||||||||
If the underwriters were to fully exercise the underwriters’ option to purchase additional shares of our common stock, the percentage of shares of our common stock held by existing stockholders who are directors, officers or affiliated persons would be % and the percentage of shares of our common stock held by new investors would be %.
Assuming the number of shares offered by us, as set forth on the front cover of this prospectus, remains the same, after deducting estimated underwriting discounts and commissions and offering expenses payable by us, a $1.00 increase or decrease in the assumed initial public offering price of $ per share, which is the midpoint of the price range set forth on the front cover of this prospectus, would increase or decrease total consideration paid by new investors and total consideration paid by all stockholders by approximately $ million.
43
Table of Contents
SELECTED CONSOLIDATED FINANCIAL DATA
The following table sets forth our summary financial data for the periods presented. Our fiscal year consists of a 52/53 week period ending on the Saturday closest to December 31st. For 2012, 2011, 2010 and 2009, our fiscal years were comprised of the 52 weeks ended December 29, 2012, December 31, 2011, January 1, 2011 and January 2, 2010, respectively. Our 2008 fiscal year was comprised of the 53 weeks ended January 3, 2009.
Our results of operations prior to the date of the Merger are presented as the results of the Predecessor, which include the results of our then existing direct and indirect parent companies, Associated Materials Holdings, LLC, AMH Holdings, LLC and AMH Holdings II, Inc. See “Management’s Discussion and Analysis of Financial Condition and Results of Operations—The Merger.” The results of operations from and after the Merger are presented as the results of the Successor. The statement of operations data set forth below for the predecessor period January 3, 2010 to October 12, 2010, the successor period October 13, 2010 to January 1, 2011 and the years ended December 31, 2011 and December 29, 2012 and the balance sheet data as of December 31, 2011 and December 29, 2012 are derived from our audited consolidated financial statements that are included elsewhere in this prospectus. The statement of operations data set forth below for the nine months ended September 29, 2012 and September 28, 2013 and the balance sheet data as of September 28, 2013 are derived from our unaudited condensed consolidated financial statements that are included elsewhere in this prospectus. The statement of operations data set forth below for the years ended January 3, 2009 and January 2, 2010 and the balance sheet data as of January 3, 2009, January 2, 2010, October 12, 2010 and January 1, 2011 are derived from our audited consolidated financial statements that are not included in this prospectus. The balance sheet data as of September 29, 2012 are derived from our unaudited condensed consolidated financial statements that are not included in this prospectus. The unaudited condensed consolidated financial statements were prepared on a basis consistent with our audited consolidated financial statements. The historical results presented below are not necessarily indicative of financial results to be achieved in future periods.
44
Table of Contents
This summary financial data should be read in conjunction with “Capitalization,” “Management’s Discussion and Analysis of Financial Condition and Results of Operations” and our audited consolidated financial statements and unaudited consolidated condensed financial statements and the related notes included elsewhere in this prospectus.
| Successor | Predecessor | |||||||||||||||||||||||||||||||||
| Nine Months Ended | Year Ended | October 13, 2010 to January 1, 2011 |
January 3, 2010 to October 12, 2010 |
Year Ended | ||||||||||||||||||||||||||||||
| September 28, 2013 |
September 29, 2012 |
December 29, 2012 |
December 31, 2011 |
January 2, 2010 |
January 3, 2009 |
|||||||||||||||||||||||||||||
| (in thousands, except share and per share data) |
||||||||||||||||||||||||||||||||||
| Statement of Operations Data: |
||||||||||||||||||||||||||||||||||
| Net sales |
$ | 873,464 | $ | 852,379 | $ | 1,142,521 | $ | 1,159,515 | $ | 269,249 | $ | 897,938 | $ | 1,046,107 | $ | 1,133,956 | ||||||||||||||||||
| Cost of sales |
664,569 | 648,975 | 859,617 | 894,333 | 222,737 | 658,509 | 765,691 | 859,107 | ||||||||||||||||||||||||||
|
|
|
|
|
|
|
|
|
|
|
|
|
|
|
|
|
|||||||||||||||||||
| Gross profit |
208,895 | 203,404 | 282,904 | 265,182 | 46,512 | 239,429 | 280,416 | 274,849 | ||||||||||||||||||||||||||
| Selling, general and administrative expenses |
176,753 | 178,463 | 240,027 | 247,278 | 53,543 | 159,448 | 204,610 | 212,025 | ||||||||||||||||||||||||||
| Impairment of goodwill |
— | — | — | 84,253 | — | — | — | — | ||||||||||||||||||||||||||
| Impairment of other intangible assets |
— | — | — | 79,894 | — | — | — | — | ||||||||||||||||||||||||||
| Merger costs |
— | — | — | 585 | 7,411 | 102,661 | — | — | ||||||||||||||||||||||||||
| Manufacturing restructuring costs |
— | — | — | 228 | — | — | 5,255 | 1,783 | ||||||||||||||||||||||||||
|
|
|
|
|
|
|
|
|
|
|
|
|
|
|
|
|
|||||||||||||||||||
| Income (loss) from operations |
32,142 | 24,941 | 42,877 | (147,056 | ) | (14,442 | ) | (22,680 | ) | 70,551 | 61,041 | |||||||||||||||||||||||
| Interest expense, net |
59,554 | 56,688 | 75,508 | 75,731 | 16,125 | 58,759 | 77,352 | 82,567 | ||||||||||||||||||||||||||
| Net loss (gain) on debt extinguishments |
— | — | — | — | 25,129 | (15,201 | ) | (29,665 | ) | — | ||||||||||||||||||||||||
| Foreign currency loss (gain) |
555 | 220 | 119 | 438 | 771 | (184 | ) | (184 | ) | 1,809 | ||||||||||||||||||||||||
|
|
|
|
|
|
|
|
|
|
|
|
|
|
|
|
|
|||||||||||||||||||
| (Loss) income before income taxes |
(27,967 | ) | (31,967 | ) | (32,750 | ) | (223,225 | ) | (56,467 | ) | (66,054 | ) | 23,048 | (23,335 | ) | |||||||||||||||||||
| Income tax expense (benefit) |
4,015 | 4,991 | 5,605 | (20,434 | ) | 8,553 | 5,220 | 2,390 | 53,062 | |||||||||||||||||||||||||
|
|
|
|
|
|
|
|
|
|
|
|
|
|
|
|
|
|||||||||||||||||||
| Net (loss) income |
$ | (31,982 | ) | $ | (36,958 | ) | $ | (38,355 | ) | $ | (202,791 | ) | $ | (65,020 | ) | $ | (71,274 | ) | $ | 20,658 | $ | (76,397 | ) | |||||||||||
|
|
|
|
|
|
|
|
|
|
|
|
|
|
|
|
|
|||||||||||||||||||
| Per Share Data: |
||||||||||||||||||||||||||||||||||
| Loss per share (basic and diluted) |
$ | (0.57 | ) | $ | (0.66 | ) | $ | (0.69 | ) | $ | (3.67 | ) | $ | (1.19 | ) | $ | (41.41 | ) | N/A | N/A | ||||||||||||||
| Weighted average shares outstanding (basic and diluted) |
55,664,994 | 55,638,894 | 55,642,894 | 55,290,857 | 54,860,707 | 1,721,076 | N/A | N/A | ||||||||||||||||||||||||||
| Successor | Predecessor | |||||||||||||||||||||||||||||
| September 28, 2013 |
September 29, 2012 |
December 29, 2012 |
December 31, 2011 |
January 1, 2011 |
January 2, 2010 |
January 3, 2009 |
||||||||||||||||||||||||
| (in thousands) |
||||||||||||||||||||||||||||||
| Balance Sheet Data (end of period): |
||||||||||||||||||||||||||||||
| Cash and cash equivalents |
$ | 10,204 | $ | 9,659 | $ | 9,594 | $ | 11,374 | $ | 13,789 | $ | 55,905 | $ | 6,709 | ||||||||||||||||
| Working capital |
123,005 | 116,718 | 110,367 | 104,046 | 98,694 | 139,334 | 172,857 | |||||||||||||||||||||||
| Total assets |
1,530,147 | 1,568,723 | 1,482,284 | 1,521,168 | 1,755,904 | 762,129 | 752,466 | |||||||||||||||||||||||
| Total debt |
836,523 | 820,126 | 808,205 | 804,000 | 788,000 | 675,360 | 745,762 | |||||||||||||||||||||||
| Stockholders’ (deficit) equity |
190,966 | 246,802 | 231,055 | 270,464 | 498,477 | (325,205 | ) | (356,866 | ) | |||||||||||||||||||||
45
Table of Contents
MANAGEMENT’S DISCUSSION AND ANALYSIS
OF FINANCIAL CONDITION AND RESULTS OF OPERATIONS
The following discussion and analysis of our financial condition and results of operations should be read together with the section titled “Selected Consolidated Financial Data” and our audited and unaudited consolidated financial statements and related notes thereto included elsewhere in this prospectus. This discussion may contain forward-looking statements based upon current expectations that involve risks and uncertainties. Our actual results may differ materially from those anticipated in these forward-looking statements as a result of various factors, including those set forth under “Risk Factors” or in other sections of this prospectus.
Overview
We are a leading, vertically integrated manufacturer and distributor of exterior residential building products in the United States and Canada. We produce a comprehensive offering of exterior building products, including vinyl windows, vinyl siding, vinyl railing and fencing, aluminum trim coil, aluminum and steel siding and related accessories, which we produce at our 11 manufacturing facilities. We also sell complementary products that are manufactured by third parties, such as roofing materials, cladding materials, insulation, exterior doors and equipment and tools, and provide installation services. We distribute these products through our extensive dual-distribution network to over 50,000 professional exterior contractors, builders and dealers, whom we refer to as our “contractor customers.” This dual-distribution network consists of 124 company-operated supply centers, through which we sell directly to our contractor customers, and our direct sales channel. Through our direct sales channel we sell to more than 275 independent distributors, dealers and national account customers. The products we sell are generally marketed under our brand names, such as Alside®, Revere®, Gentek®, UltraGuard® and Preservation®.
Because our exterior residential building products are consumer durable goods, our sales are impacted by, among other things, the availability of consumer credit, consumer interest rates, employment trends, changes in levels of consumer confidence and national and regional trends in the housing market. Our sales are also affected by changes in consumer preferences with respect to types of building products. Overall, we believe the long-term fundamentals for the building products industry remain strong, as homes continue to get older, pent-up demand in the residential repair and remodeling (“R&R”) market normalizes, household formation is expected to be strong, demand for energy efficiency products continues and vinyl remains an optimal material for exterior window and siding solutions, all of which we believe bodes well for the demand for our products in the future.
Our net sales for the nine months ended September 28, 2013 were $873.5 million, representing an increase of 2.5% from the same period in 2012. The increase in sales dollars was primarily driven by strong demand in the new construction market and improvement in the R&R market. Vinyl windows, vinyl siding, metal products and third-party manufactured products comprised approximately 31%, 19%, 15% and 27%, respectively, of our net sales for the nine months ended September 28, 2013, compared to approximately 31%, 21%, 16% and 26%, respectively, of our net sales for the nine months ended September 29, 2012. Vinyl windows, vinyl siding, metal products and third-party manufactured products comprised approximately 31%, 20%, 15% and 27%, respectively, of our net sales for the year ended December 29, 2012. We were able to improve our gross profit and reduce selling, general and administrative costs in both total dollars and as a percentage of sales. Our gross profit for the nine months ended September 28, 2013 was up $5.5 million, or 2.7%, compared to the same period in 2012 primarily due to higher sales volumes in our Installed Sales Solutions (“ISS”) business, vinyl windows and third-party manufactured products, decreases in the cost of certain materials and lower depreciation expense, partially offset by lower gross margins due to increased sales in our new construction business, an unfavorable shift in customer mix as well as investment in our workforce for new products.
46
Table of Contents
A significant portion of our selling, general and administrative expenses are fixed costs such as payroll and benefit costs for our supply center employees, corporate employees and sales representatives, the building lease costs of our supply centers and the warehouse at our Ennis location, delivery and sales vehicle costs, other administrative expenses and costs related to the operation of our supply centers and corporate office. Other than fixed costs, our selling, general and administrative expenses include incentives and commissions, marketing costs, certain delivery charges such as fuel costs incurred to deliver product to our customers, and customer sales rewards. Selling, general and administrative costs for the nine months ended September 28, 2013 decreased $1.7 million, compared to the same period in 2012. The improvement in our selling, general and administrative expenses were primarily due to decreased marketing related costs and lower bad debt expense, partially offset by costs associated with this offering and increased consulting fees related to corporate strategic initiatives.
Because most of our building products are intended for exterior use, sales tend to be lower during periods of inclement weather. Weather conditions in the first quarter of each calendar year usually result in that quarter producing significantly less net sales and net cash flows from operations than in any other period of the year. Consequently, we have historically had losses or small profits in the first quarter and reduced profits from operations in the fourth quarter of each calendar year. To meet seasonal cash flow needs during the periods of reduced sales and net cash flows from operations, we have typically utilized our revolving credit facilities and repay such borrowings in periods of higher cash flow. We typically generate the majority of our cash flow in the third and fourth quarters.
Management operates our business with the aim of achieving profitable growth and makes operating decisions and assesses the performance of the business based on financial and other measures that it believes provide important data regarding the business. Management primarily uses Adjusted EBITDA, a non-GAAP financial measure, along with GAAP measures of profitability, including gross profit, income from operations and net income, to measure operating performance. See “—Results of Operations.” In addition, management uses certain techniques related to our corporate strategy of expanding our network of company-operated supply centers to achieve profitable growth. As part of this growth strategy, management performs a trading area review to assess our ability to penetrate particular markets. Management assesses whether to open or acquire a new supply center in a given region based on local economic conditions, such as existing and expected growth rates in the region, unemployment rates and labor costs. Additionally, management reviews the competitive environment in the region and our existing market share in the particular region. Once management has decided to expand our presence in a given region, it then decides between opening a new “greenfield” location in that region or acquiring an existing store based on the number and quality of potential acquisition opportunities and the willingness of the owners of those businesses to sell. We typically target cash flows from operations to achieve a break-even rate within two years of opening a new “greenfield” or acquired supply center.
Our business is comprised of one reportable segment, which consists of the single business of manufacturing and distributing exterior residential building products. For financial information about our reportable segment as well as the geographic areas where we conduct business and long-lived assets by country, please see Note 19 to the audited consolidated financial statements included elsewhere in this prospectus.
47
Table of Contents
The Merger
On October 13, 2010, AMH Holdings II, Inc. (“AMH II”), our then indirect parent company, completed its merger (the “Acquisition Merger”) with Carey Acquisition Corp. (“Merger Sub”), pursuant to the terms of the Agreement and Plan of Merger, dated as of September 8, 2010 (“Merger Agreement”), among AMH Investment Holdings Corp. (the predecessor entity to Associated Materials Group, Inc.), Holdings, Merger Sub, a wholly owned direct subsidiary of Holdings, and AMH II, with AMH II surviving such merger as a wholly owned direct subsidiary of Holdings. After a series of additional mergers (together with the Acquisition Merger, the “Merger”), AMH II merged with and into Associated Materials, with Associated Materials surviving such merger as a wholly owned direct subsidiary of Holdings. As a result of the Merger, Associated Materials is now an indirect wholly owned subsidiary of Associated Materials Group, Inc. Approximately 97% of Associated Materials Group, Inc.’s capital stock is owned by the H&F Investors.
Upon consummation of the Merger, the holders of AMH II equity (including “in-the-money” stock options and warrants outstanding immediately prior to the consummation of the Acquisition Merger), received consideration consisting of approximately $600 million in cash, less (1) $16.2 million paid to affiliates of Harvest Partners and Investcorp in accordance with the management services agreement with Harvest Partners and (2) $26.2 million of transaction bonuses paid to senior management and certain other employees in connection with the Merger. Immediately prior to the consummation of the Merger, all outstanding shares of AMH II preferred stock were converted into shares of AMH II common stock.
In connection with the consummation of the Merger, we repaid and terminated our prior asset-based credit facility (“prior ABL facility”) and repaid our 20% Senior Notes due 2014 (“20% notes”). In addition, we called and discharged our obligations under the indentures governing the 9.875% Senior Secured Second Lien Notes due 2016 (“9.875% notes”) and the 11.25% Senior Discount Notes due 2014 (“11.25% notes”).
The Merger and the repayment of the 9.875% notes, the 11.25% notes and the 20% notes and related expenses were financed with (1) $553.5 million in cash contributed by AMH Investment Holdings Corp. (which included $8.5 million invested by management), (2) the issuance of $730.0 million of 9.125% notes, (3) $73.0 million in cash drawn under the ABL facilities and (4) $45.9 million of cash from our balance sheet.
Results of Operations
Our results of operations, along with the results of our then existing direct and indirect parent companies, Associated Materials Holdings, LLC, AMH Holdings, LLC and AMH Holdings II, Inc., prior to the date of the Merger are presented as the results of the predecessor (“Predecessor”). The results of operations, including the Merger and results thereafter, are presented as the results of the successor (“Successor”).
48
Table of Contents
The following table sets forth for the periods indicated our results of operations:
| Successor | Predecessor | |||||||||||||||||||||||||||||||||||||||||||||||||
| Nine Months Ended | Year Ended | October 13, 2010 to January 1, 2011 |
January 3, 2010 to October 12, 2010 |
|||||||||||||||||||||||||||||||||||||||||||||||
| September 28, 2013 |
September 29, 2012 |
December 29, 2012 |
December 31, 2011 |
|||||||||||||||||||||||||||||||||||||||||||||||
| $ | % of Net Sales |
$ | % of Net Sales |
$ | % of Net Sales |
$ | % of Net Sales |
$ | % of Net Sales |
$ | % of Net Sales |
|||||||||||||||||||||||||||||||||||||||
| (dollars in thousands) |
||||||||||||||||||||||||||||||||||||||||||||||||||
| Net sales(1) |
$ | 873,464 | 100 | % | $ | 852,379 | 100 | % | $ | 1,142,521 | 100.0 | % | $ | 1,159,515 | 100.0 | % | $ | 269,249 | 100.0 | % | $ | 897,938 | 100.0 | % | ||||||||||||||||||||||||||
| Gross profit |
208,895 | 23.9 | % | 203,404 | 23.9 | % | 282,904 | 24.8 | % | 265,182 | 22.9 | % | 46,512 | 17.3 | % | 239,429 | 26.7 | % | ||||||||||||||||||||||||||||||||
| Selling, general and administrative expenses |
176,753 | 20.2 | % | 178,463 | 20.9 | % | 240,027 | 21.0 | % | 247,278 | 21.3 | % | 53,543 | 19.9 | % | 159,448 | 17.8 | % | ||||||||||||||||||||||||||||||||
| Impairment of goodwill |
— | — | — | — | — | — | 84,253 | 7.3 | % | — | — | — | — | |||||||||||||||||||||||||||||||||||||
| Impairment of other intangible assets |
— | — | — | — | — | — | 79,894 | 6.9 | % | — | — | — | — | |||||||||||||||||||||||||||||||||||||
| Merger costs |
— | — | — | — | — | — | 585 | 0.1 | % | 7,411 | 2.8 | % | 102,661 | 11.4 | % | |||||||||||||||||||||||||||||||||||
| Manufacturing restructuring costs |
— | — | — | — | — | — | 228 | — | — | — | — | — | ||||||||||||||||||||||||||||||||||||||
|
|
|
|
|
|
|
|
|
|
|
|
|
|||||||||||||||||||||||||||||||||||||||
| Income (loss) from operations |
32,142 | 3.7 | % | 24,941 | 2.9 | % | 42,877 | 3.8 | % | (147,056 | ) | (12.7 | )% | (14,442 | ) | (5.4 | )% | (22,680 | ) | (2.5 | )% | |||||||||||||||||||||||||||||
|
|
|
|
|
|
|
|
|
|
|
|
|
|||||||||||||||||||||||||||||||||||||||
| Interest expense, net |
59,554 | 56,688 | 75,508 | 75,731 | 16,125 | 58,759 | ||||||||||||||||||||||||||||||||||||||||||||
| (Loss) gain on debt extinguishment |
— | — | — | — | 25,129 | (15,201 | ) | |||||||||||||||||||||||||||||||||||||||||||
| Foreign currency loss (gain) |
555 | 220 | 119 | 438 | 771 | (184 | ) | |||||||||||||||||||||||||||||||||||||||||||
|
|
|
|
|
|
|
|
|
|
|
|
|
|||||||||||||||||||||||||||||||||||||||
| Loss before income taxes |
(27,967 | ) | (31,967 | ) | (32,750 | ) | (223,225 | ) | (56,467 | ) | (66,054 | ) | ||||||||||||||||||||||||||||||||||||||
| Income tax expense (benefit) |
4,015 | 4,991 | 5,605 | (20,434 | ) | 8,553 | 5,220 | |||||||||||||||||||||||||||||||||||||||||||
|
|
|
|
|
|
|
|
|
|
|
|
|
|||||||||||||||||||||||||||||||||||||||
| Net loss |
$ | (31,982 | ) | $ | (36,958 | ) | $ | (38,355 | ) | $ | (202,791 | ) | $ | (65,020 | ) | $ | (71,274 | ) | ||||||||||||||||||||||||||||||||
|
|
|
|
|
|
|
|
|
|
|
|
|
|||||||||||||||||||||||||||||||||||||||
| Other Data: |
||||||||||||||||||||||||||||||||||||||||||||||||||
| EBITDA(2) |
$ | 64,204 | $ | 64,123 | $ | 93,436 | $ | (96,168 | ) | $ | (29,844 | ) | $ | 10,287 | ||||||||||||||||||||||||||||||||||||
| Adjusted EBITDA(2) |
70,360 | 69,334 | 96,397 | 87,321 | 30,583 | 102,656 | ||||||||||||||||||||||||||||||||||||||||||||
| Depreciation and amortization |
32,617 | 39,402 | 50,678 | 51,326 | 10,498 | 17,582 | ||||||||||||||||||||||||||||||||||||||||||||
| Capital expenditures |
(8,899 | ) | (3,720 | ) | (5,371 | ) | (15,447 | ) | (5,160 | ) | (10,302 | ) | ||||||||||||||||||||||||||||||||||||||
| (1) | The following table presents a summary of net sales by principal product offering: |
| Successor | Predecessor | |||||||||||||||||||||||||
| Nine Months Ended | Year Ended | October 13, 2010 to January 1, 2011 |
January 3, 2010 to October 12, 2010 |
|||||||||||||||||||||||
| September 28, 2013 |
September 29, 2012 |
December 29, 2012 |
December 31, 2011 |
|||||||||||||||||||||||
| (in thousands) |
||||||||||||||||||||||||||
| Vinyl windows |
$ | 271,063 | $ | 261,201 | $ | 357,267 | $ | 362,570 | $ | 118,778 | $ | 316,102 | ||||||||||||||
| Vinyl siding products |
165,317 | 175,340 | 227,374 | 224,388 | 41,504 | 181,904 | ||||||||||||||||||||
| Metal products |
128,129 | 133,923 | 174,111 | 178,398 | 35,226 | 147,321 | ||||||||||||||||||||
| Third-party manufactured products |
235,758 | 223,794 | 302,966 | 320,852 | 55,511 | 196,587 | ||||||||||||||||||||
| Other products and services |
73,197 | 58,121 | 80,803 | 73,307 | 18,230 | 56,024 | ||||||||||||||||||||
|
|
|
|
|
|
|
|
|
|
|
|
|
|||||||||||||||
| Total |
$ | 873,464 | $ | 852,379 | $ | 1,142,521 | $ | 1,159,515 | $ | 269,249 | $ | 897,938 | ||||||||||||||
|
|
|
|
|
|
|
|
|
|
|
|
|
|||||||||||||||
| (2) | EBITDA is calculated as net income plus interest, taxes, depreciation and amortization. Adjusted EBITDA is defined as EBITDA adjusted to reflect certain adjustments (other than run-rate cost savings) that are used in calculating covenant compliance under the Amended and Restated Revolving Credit Agreement governing our ABL facilities and the Indenture. We consider EBITDA and Adjusted EBITDA to be important indicators of our operational strength and performance of our business. We have included Adjusted EBITDA because it is a key financial measure used by our management to (i) assess our ability to service our debt or incur debt and meet our capital expenditure requirements; (ii) internally measure our operating performance; and (iii) determine our incentive compensation programs. EBITDA and Adjusted EBITDA have not been prepared in accordance with GAAP. Adjusted EBITDA as presented by us may not be comparable to similarly titled measures reported by other companies. EBITDA and Adjusted EBITDA are not measures determined in accordance with GAAP and should not be considered as an alternative to, or more meaningful than, net income (as determined in accordance with GAAP) as a measure of our operating results or net cash provided by operating activities (as determined in accordance with GAAP) as a measure of our liquidity. |
49
Table of Contents
The reconciliation of our net loss to EBITDA and Adjusted EBITDA is as follows:
| Successor | Predecessor | |||||||||||||||||||||||||
| Nine Months Ended | Year Ended | October 13, 2010 to January 1, 2011 |
January 3, 2010 to October 12, 2010 |
|||||||||||||||||||||||
| September 28, 2013 |
September 29, 2012 |
December 29, 2012 |
December 31, 2011 |
|||||||||||||||||||||||
| (in thousands) |
||||||||||||||||||||||||||
| Net loss |
$ | (31,982 | ) | $ | (36,958 | ) | $ | (38,355 | ) | $ | (202,791 | ) | $ | (65,020 | ) | $ | (71,274 | ) | ||||||||
| Interest expense, net |
59,554 | 56,688 | 75,508 | 75,731 | 16,125 | 58,759 | ||||||||||||||||||||
| Income tax expense (benefit) |
4,015 | 4,991 | 5,605 | (20,434 | ) | 8,553 | 5,220 | |||||||||||||||||||
| Depreciation and amortization |
32,617 | 39,402 | 50,678 | 51,326 | 10,498 | 17,582 | ||||||||||||||||||||
|
|
|
|
|
|
|
|
|
|
|
|
|
|||||||||||||||
| EBITDA |
64,204 | 64,123 | 93,436 | (96,168 | ) | (29,844 | ) | 10,287 | ||||||||||||||||||
| Impairment of goodwill and other intangible assets(a) |
— | — | — | 164,147 | — | — | ||||||||||||||||||||
| Merger costs(b) |
— | — | — | 585 | 7,411 | 103,467 | ||||||||||||||||||||
| Loss (gain) on debt extinguishments(c) |
— | — | — | — | 25,129 | (15,201 | ) | |||||||||||||||||||
| Purchase accounting related adjustments(d) |
(2,892 | ) | (2,889 | ) | (3,872 | ) | (3,786 | ) | 21,427 | — | ||||||||||||||||
| Restructuring costs(e) |
— | — | — | 228 | — | 88 | ||||||||||||||||||||
| Loss (gain) on disposal or write-offs of assets(f) |
93 | (17 | ) | (12 | ) | 215 | 1,230 | 43 | ||||||||||||||||||
| Executive officer separation and hiring costs(g) |
1,193 | 2,921 | 3,366 | 6,706 | 1,397 | — | ||||||||||||||||||||
| Stock-based compensation expense(h) |
123 | 82 | 96 | 709 | — | — | ||||||||||||||||||||
| Non-cash expense (benefit) adjustments(i) |
— | 2,579 | (3,300 | ) | 7,574 | — | — | |||||||||||||||||||
| Other normalizing and unusual items(j) |
7,084 | 2,315 | 6,564 | 6,673 | 3,062 | 4,156 | ||||||||||||||||||||
| Foreign currency loss (gain)(k) |
555 | 220 | 119 | 438 | 771 | (184 | ) | |||||||||||||||||||
|
|
|
|
|
|
|
|
|
|
|
|
|
|||||||||||||||
| Adjusted EBITDA(l) |
$ | 70,360 | $ | 69,334 | $ | 96,397 | $ | 87,321 | $ | 30,583 | $ | 102,656 | ||||||||||||||
|
|
|
|
|
|
|
|
|
|
|
|
|
|||||||||||||||
| (a) | We review goodwill and other intangible assets with indefinite lives for impairment on an annual basis, or more frequently if events or circumstances change that would impact the value of these assets. During the third quarter of 2011, the weaker economic conditions and lower results of operations resulted in management changing our outlook and lowering our forecast used for our discounted cash flow analysis. As a result of the lower management projections for operating results and the calculated lower per share equity value, we believed that we had an indicator of impairment and performed interim impairment testing on goodwill and indefinite lived intangibles as of September 3, 2011 resulting in impairment charges of $84.3 million during the fourth quarter of 2011 and $72.2 million during the third quarter of 2011, respectively. |
| In addition to the interim impairment testing, we performed our annual impairment test on goodwill and indefinite lived intangibles in the fourth quarter of 2011. We had revised our forecasts downward after the date of the interim impairment testing based on our annual budgeting process which resulted in an additional impairment charge related to indefinite lived intangibles of $7.7 million. No additional impairment charges were required as a result of the annual impairment test of goodwill for 2011. |
| (b) | Represents the following: |
| Successor | Predecessor | |||||||||||||||||||||||||
| Nine Months Ended | Year Ended | October 13, 2010 to January 1, 2011 |
January 3, 2010 to October 12, 2010 |
|||||||||||||||||||||||
| September 28 2013 |
September 29, 2012 |
December 29, 2012 |
December 31, 2011 |
|||||||||||||||||||||||
| (in thousands) |
||||||||||||||||||||||||||
| Transaction costs(i) |
$ | — | $ | — | $ | — | $ | 585 | $ | 7,411 | $ | 38,416 | ||||||||||||||
| Transaction bonuses(ii) |
— | — | — | — | — | 26,231 | ||||||||||||||||||||
| Stock option compensation(iii) |
— | — | — | — | — | 38,014 | ||||||||||||||||||||
| Stock warrants expense(iv) |
— | — | — | — | — | 806 | ||||||||||||||||||||
|
|
|
|
|
|
|
|
|
|
|
|
|
|||||||||||||||
| Total |
$ | — | $ | — | $ | — | $ | 585 | $ | 7,411 | $ | 103,467 | ||||||||||||||
|
|
|
|
|
|
|
|
|
|
|
|
|
|||||||||||||||
| (i) | Predecessor expenses include investment banking, legal and other expenses, including $16.2 million of expense accrued and paid to affiliates of Investcorp International Inc. and Harvest Partners in connection with the amended and restated management agreement with Harvest Partners. Successor expenses primarily include fees paid on behalf of Merger Sub related to due diligence activities. |
50
Table of Contents
| (ii) | Represents transaction bonuses paid to senior management and certain employees in connection with the Merger. |
| (iii) | Represents stock option compensation expense recognized as a result of the modification of certain stock option awards in connection with the Merger and the fair value of an in-the-money stock option award granted immediately prior to the Merger. |
| (iv) | Represents expense for stock warrants, which were redeemed for cash in connection with the Merger. The expense associated with the stock warrants has been recognized in our results of operations as a reduction in net sales in accordance with Financial Accounting Standards Board (“FASB”) Accounting Standards Codification (“ASC”) 505-50, Equity-Based Payments to Non-Employees. |
| (c) | Expenses recorded by the Predecessor for the period ended October 12, 2010 include the write-off of an accrual for all future interest payments on the 20% notes outstanding before the Merger, partially offset with the write-off of deferred financing fees associated with the prior ABL facility, which was recorded during the year ended January 2, 2010, in accordance with FASB ASC 470-60, Troubled Debt Restructurings by Debtors. Expenses recorded by the Successor include the loss on the extinguishment of the 9.875% notes and the 11.25% notes totaling $13.6 million and fees of $11.5 million related to an interim financing facility, which was negotiated, but ultimately not utilized, in conjunction with the financing for the Merger. |
| (d) | Represents the following: |
| Successor | Predecessor | |||||||||||||||||||||||||
| Nine Months Ended | Year Ended | October 13, 2010 to January 1, 2011 |
January 3, 2010 to October 12, 2010 |
|||||||||||||||||||||||
| September 28, 2013 |
September 29, 2012 |
December 29, 2012 |
December 31, 2011 |
|||||||||||||||||||||||
| (in thousands) |
||||||||||||||||||||||||||
| Pension expense adjustment(i) |
$ | (1,999 | ) | $ | (2,015 | ) | $ | (2,689 | ) | $ | (2,694 | ) | $ | (589 | ) | $ | — | |||||||||
| Amortization related to fair value adjustment of leased facilities(ii) |
(344 | ) | (338 | ) | (448 | ) | (456 | ) | (95 | ) | — | |||||||||||||||
| Amortization related to warranty liabilities(iii) |
(549 | ) | (536 | ) | (735 | ) | (736 | ) | (153 | ) | — | |||||||||||||||
| Inventory adjustment related to Merger(iv) |
— | — | — | — | 22,264 | — | ||||||||||||||||||||
| Inventory adjustment related to supply center acquisition(v) |
|
— |
|
|
— |
|
— | 100 | — | — | ||||||||||||||||
|
|
|
|
|
|
|
|
|
|
|
|
|
|||||||||||||||
| Total |
$ | (2,892 | ) | $ | (2,889 | ) | $ | (3,872 | ) | $ | (3,786 | ) | $ | 21,427 | $ | — | ||||||||||
|
|
|
|
|
|
|
|
|
|
|
|
|
|||||||||||||||
| (i) | Represents the elimination of the impact of reduced pension expense as a result of purchase accounting adjustments associated with the Merger. |
| (ii) | Represents the elimination of the impact of amortization related to net liabilities recorded in purchase accounting for the fair value of our leased facilities as a result of the Merger. |
| (iii) | Represents the elimination of the impact of amortization related to net liabilities recorded in purchase accounting for the fair value of warranty liabilities as a result of the Merger. |
| (iv) | Represents $23.1 million of amortization for the step-up in basis of inventory, partially offset by $0.8 million of other purchase accounting related adjustments to inventory included in cost of sales. |
| (v) | Represents the adjustment to inventory that was acquired as part of the supply center acquisition completed during the second quarter of 2011. |
| (e) | Represents manufacturing restructuring charges of $0.2 million during the year ended December 31, 2011 and legal and accounting fees of $0.1 million in connection with tax restructuring projects during the predecessor period ended October 12, 2010. During 2008, we relocated a portion of our vinyl siding production from Ennis, Texas to West Salem, Ohio and Burlington, Ontario. In connection with this change, during 2009, we discontinued the use of the warehouse facility adjacent to the Ennis manufacturing plant and recorded lease costs associated with our discontinued use of the warehouse facility adjacent to the Ennis manufacturing plant. During the second quarter of 2011, we recognized a charge of $0.2 million within selling, general and administrative expenses as a result of re-measuring the restructuring liability related to the discontinued use of the warehouse facility adjacent to our Ennis manufacturing plant. |
| (f) | Represents loss (gain) on disposals or write-offs of assets principally including $0.2 million for loss on sale of fixed assets during the year ended December 31, 2011 and $1.2 million of loss incurred during the successor period ended January 1, 2011 related to issues with a new product line, and the ultimate discontinuation of the product line by the Successor. |
| (g) | Represents separation and hiring costs, including payroll taxes and certain benefits, as follows: |
| (i) | Separation and hiring costs of $1.2 million were incurred during the nine months ended September 28, 2013, primarily related to make-whole payments to Mr. Burris, our President and Chief Executive Officer, and Mr. Morrisroe, our Senior Vice President and Chief Financial Officer. Pursuant to their respective employment agreements, these payments provide compensation to offset losses recognized on the sale of their respective residences to relocate near our corporate headquarters. |
51
Table of Contents
| (ii) | Separation and hiring costs, including payroll taxes and certain benefits, and professional fees of $3.4 million during the year ended December 29, 2012 related to the hirings of Mr. Nagle, our President, AMI Distribution, and Mr. Morrisroe, the termination of Mr. Graham, our former Senior Vice President, Chief Financial Officer and Secretary in February 2012, the termination of Mr. Haumesser, our former Senior Vice President of Human Resources in April 2012, and the hiring of Mr. Kenyon, our Senior Vice President and Chief Human Resources Officer in June 2012. $2.9 million of such costs was incurred in the nine months ended September 28, 2012. |
| (iii) | Separation and hiring costs, including payroll taxes and certain benefits, and professional fees of $6.7 million during the year ended December 31, 2011 related to the terminations of Mr. Chieffe, our former President and Chief Executive Officer, and Mr. Arthur, our former Senior Vice President of Operations, in June 2011, the hiring of Mr. Snyder, our former Interim Chief Executive Officer, in June 2011, the hiring of Mr. Gaydos, our Senior Vice President of Operations in August 2011, and the hiring of Mr. Burris in September 2011. |
| (iv) | Separation costs, including payroll taxes and certain benefits, of $1.4 million in the successor period ended January 1, 2011 related to the termination of Mr. Franco, our former President of AMI Distribution. |
| (h) | Represents stock-based compensation related to restricted shares issued to certain of our directors and officers. |
| (i) | Represents the non-cash provision for warranties greater (less) than claims paid. |
| (j) | Represents the following: |
| Successor | Predecessor | |||||||||||||||||||||||||
| Nine Months Ended | Year Ended | October 13, 2010 to January 1, 2011 |
January 3, 2010 to October 12, 2010 |
|||||||||||||||||||||||
| September 28, 2013 |
September 29, 2012 |
December 29, 2012 |
December 31, 2011 |
|||||||||||||||||||||||
| (in thousands) |
||||||||||||||||||||||||||
| Professional fees(i) |
$ | 6,556 | $ | 1,011 | $ | 1,342 | $ | 3,271 | $ | 2,973 | $ | 2,734 | ||||||||||||||
| Discontinued inventory expense(ii) |
— | — | — | 1,066 | — | — | ||||||||||||||||||||
| Accretion on lease liability(iii) |
394 | 399 | 545 | 498 | 89 | 296 | ||||||||||||||||||||
| Excess severance costs(iv) |
65 | 170 | 170 | 590 | — | 389 | ||||||||||||||||||||
| Operating lease termination penalty(v) |
— | — | — | 773 | — | — | ||||||||||||||||||||
| Insurance claim payment in dispute(vi) |
(200 | ) | — | 330 | — | — | — | |||||||||||||||||||
| Excess legal expense(vii) |
202 | 641 | 4,044 | 362 | — | — | ||||||||||||||||||||
| Management fees(viii) |
— | — | — | — | — | 681 | ||||||||||||||||||||
| Bank audit fees(ix) |
67 | 94 | 133 | 113 | — | 56 | ||||||||||||||||||||
|
|
|
|
|
|
|
|
|
|
|
|
|
|||||||||||||||
| Total |
$ | 7,084 | $ | 2,315 | $ | 6,564 | $ | 6,673 | $ | 3,062 | $ | 4,156 | ||||||||||||||
|
|
|
|
|
|
|
|
|
|
|
|
|
|||||||||||||||
| (i) | Represents management’s estimate of unusual consulting and advisory fees primarily associated with cost savings and other strategic initiatives. Included in these fees are costs of $2.2 million associated with this offering. |
| (ii) | Represents management’s estimate of unusual inventory obsolescence recorded related to a new window product launch and an inventory write-off related to a process change. |
| (iii) | Represents accretion on the liability recorded at present value for future lease costs in connection with our warehouse facility adjacent to the Ennis manufacturing plant, which we discontinued using during 2009. |
| (iv) | Represents management’s estimates for excess severance expense due primarily to unusual changes within senior management. |
| (v) | Represents the excess of cash paid over the estimated fair values of purchased equipment previously leased. |
| (vi) | Represents an unusual insurance claim paid by us, which is in dispute with our insurance carrier. |
| (vii) | Represents excess legal expense incurred in connection with the defense of actions filed by plaintiffs and a putative nationwide class of homeowners regarding certain warranty related claims related to steel and aluminum siding. See Note 18 to the audited consolidated financial statements included elsewhere in this prospectus. |
| (viii) | Represents annual management fees paid to Harvest Partners before the Merger. |
| (ix) | Represents bank audit fees incurred under our current ABL facilities and our prior ABL facility. |
| (k) | Represents foreign currency (gain) loss recognized in the income statement, including loss (gain) on foreign currency exchange hedging agreements. |
52
Table of Contents
| (l) | Does not include adjustments for “run-rate” cost saving as allowed by the terms of the Indenture and our ABL facilities. Run-rate cost savings adjustments include the following: |
| Successor | Predecessor | |||||||||||||||||||||||||
| Nine Months Ended | Year Ended | October 13, 2010 to January 1, 2011 |
January 3, 2010 to October 12, 2010 |
|||||||||||||||||||||||
| September 28, 2013 |
September 29, 2012 |
December 29, 2012 |
December 31, 2011 |
|||||||||||||||||||||||
| (in thousands) |
||||||||||||||||||||||||||
| Run-rate cost savings(i) |
$ | — | $ | — | $ | 10,711 | $ | 9,449 | $ | — | $ | — | ||||||||||||||
| Insourcing glass production savings(ii) |
— | — | — | — | — | 462 | ||||||||||||||||||||
| Procurement savings(iii) |
— | — | — | — | — | 141 | ||||||||||||||||||||
|
|
|
|
|
|
|
|
|
|
|
|
|
|||||||||||||||
| Total |
$ | — | $ | — | $ | 10,771 | $ | 9,449 | $ | — | $ | 603 | ||||||||||||||
|
|
|
|
|
|
|
|
|
|
|
|
|
|||||||||||||||
| (i) | Represents our estimate of run-rate cost savings related to actions taken or to be taken within 12 months after the consummation of any acquisition, amalgamation, merger or operational change and prior to or during such period, calculated on a pro forma basis as though such cost savings had been realized on the first day of the period for which Adjusted EBITDA is being calculated, net of the amount of actual benefits realized during such period from such actions and net of the further adjustments required by the ABL facilities and the Indenture, as described below. Run-rate cost savings include actions around operational and engineering improvements, procurement savings and reductions in selling, general and administrative expenses. The run-rate cost savings were estimated to be approximately $13 million and $17 million for the years ended December 29, 2012 and December 31, 2011, respectively. Our ABL facilities and the Indenture permit us to include run-rate cost savings in our calculation of Adjusted EBITDA in an amount, taken together with the amount of certain restructuring costs, up to 10% of Consolidated EBITDA, as defined in such debt instruments. As such, only $10.7 million of the approximately $13 million of run-rate cost savings for 2012 and $9.4 million of the approximately $17 million of run-rate cost savings for 2011 were included in the calculation of Adjusted EBITDA under the ABL facilities and the Indenture for 2012 and 2011, respectively. |
| (ii) | Represents management’s estimates of cost savings that could have resulted from producing glass in-house at our Cuyahoga Falls, Ohio window facility had such production started on January 4, 2009. |
| (iii) | Represents management’s estimate of cost savings that could have resulted from entering into our leveraged procurement program with an outside consulting firm had such program been entered into on January 4, 2009. |
Nine Months Ended September 28, 2013 Compared to Nine Months Ended September 29, 2012
Net Sales
Net sales were $873.5 million for the nine months ended September 28, 2013, an increase of $21.1 million, or 2.5%, compared to $852.4 million for the same period in 2012. The increase in net sales was primarily driven by continuing growth in our ISS business. Net sales for ISS increased $16.0 million, or 31.0% compared to the same period in 2012. The improvement in net sales was also due to an increase in vinyl window sales of $9.9 million, or 3.8%, primarily as a result of an increase in unit volume of approximately 5%. Both our ISS and window business benefited from increased demand in the new construction market. Our window sales were also favorably impacted by improvement in the R&R market. In addition, net sales for third-party manufactured products increased $12.0 million, or 5.3%, compared to the same period in 2012. Partially offsetting these increases were a $10.0 million decline in vinyl siding sales as a result of a decline in unit volume of approximately 3% and a $5.8 million decrease in metal products sales, compared to the same period in 2012, largely due to soft Canadian market conditions. Compared to the same period in 2012, net sales were negatively impacted by $5.1 million for the nine months ended September 28, 2013 due to a weaker Canadian dollar in 2013.
53
Table of Contents
Gross Profit
Gross profit for the nine months ended September 28, 2013 was $208.9 million, or 23.9% of net sales, compared to gross profit of $203.4 million, or 23.9% of net sales, for the same period in 2012. The increase of $5.5 million in gross profit was primarily driven by lower costs for certain materials of $6.4 million, lower depreciation expense of $5.7 million and the favorable volume impact of $4.5 million due to higher sales in our ISS business, vinyl windows and third-party manufactured products partially offset by a decrease in our gross profit due to strong demand in the lower-margin new construction market and unfavorable customer mix of $6.7 million as well as investment in our workforce for new products. Gross profit as a percentage of sales was flat compared to prior year. For the nine months ended September 28, 2013, a weaker Canadian dollar in 2013 negatively impacted our gross profit by $4.1 million compared to the prior year period.
Selling, General and Administrative Expenses
Selling, general and administrative expenses were $176.8 million, or 20.2% of net sales, for the nine months ended September 28, 2013 versus $178.5 million, or 20.9% of net sales, for the same period in 2012. The decrease of $1.7 million in selling, general and administrative expenses was primarily the result of a $2.3 million decrease in marketing related costs, a $1.7 million decrease in executive officers’ separation and hiring costs, lower depreciation expense of $1.1 million and decreased bad debt expense of $0.9 million partially offset by $2.2 million of costs associated with this offering and increased consulting fees of $3.3 million related to corporate strategic initiatives compared to the prior year.
Income from Operations
Income from operations was $32.1 million for the nine months ended September 28, 2013 and $24.9 million for the nine months ended September 29, 2012.
Interest Expense
Interest expense was $59.6 million and $56.7 million for the nine months ended September 28, 2013 and September 29, 2012, respectively. The $2.9 million increase in interest expense in the current year primarily relates to the additional $100.0 million of 9.125% senior secured notes issued on May 1, 2013, partially offset by lower interest rates and a lower principal balance on the ABL facilities.
Income Tax Expense
The income tax expense of $4.0 million for the nine months ended September 28, 2013 reflected a negative effective income tax rate of 14.4%, whereas the income tax expense of $5.0 million for the same period in 2012 reflected a negative effective income tax rate of 15.6%. The lower than statutory effective tax rate in both periods was primarily a result of operating losses in the U.S. with no tax benefit recognized due to the valuation allowance on U.S. deferred tax assets partially offset by income tax expense on foreign income.
Net Loss
Net loss for the nine months ended September 28, 2013 was $32.0 million compared to a net loss of $37.0 million for the same period in 2012.
54
Table of Contents
Year Ended December 29, 2012 Compared to Year Ended December 31, 2011
Net Sales
Net sales were $1,142.5 million for the year ended December 29, 2012, a decrease of $17.0 million, or 1.5%, compared to net sales of $1,159.5 million for the year ended December 31, 2011. Vinyl windows, vinyl siding, metal products and third-party manufactured products comprised approximately 31%, 20%, 15% and 27%, respectively, of our net sales for the year ended December 29, 2012 and approximately 31%, 19%, 15% and 28%, respectively, of our net sales for the year ended December 31, 2011. The decrease in sales was primarily due to a decline in third-party manufactured product sales primarily driven by a reduction in roofing product sales of $17.9 million, or 5.6%, compared to the prior year. Third-party manufactured product sales in 2011 were positively impacted by increased storm related activity. Our focus on driving profitable growth in 2012 also contributed to lower sales of third-party manufactured products as we pulled back from some lower margin sales in order to drive pricing discipline. In addition, vinyl windows sales for the year ended December 29, 2012 decreased by $5.3 million as a result of a decline in unit volumes of approximately 2%. These decreases were partially offset by a $7.7 million increase in Installed Sales Solutions sales and a $3.0 million increase in vinyl siding sales as unit volumes increased by approximately 1% compared to 2011. Net sales were also negatively impacted by $2.1 million due to the weaker Canadian dollar in 2012.
Gross Profit
Gross profit for the year ended December 29, 2012 was $282.9 million, or 24.8% of net sales, compared to gross profit of $265.2 million, or 22.9% of net sales, for 2011. The increase in gross profit was primarily the result of an increase in sales volume and improved margin associated with vinyl siding of approximately $9.0 million, partially offset by the impact of lower sales volumes in vinyl windows and third-party manufactured products of approximately $2.0 million. In addition, gross profit was favorably impacted by approximately $10.0 million primarily related to higher costs in the prior year in our window manufacturing plants associated with warranty costs due to valuation adjustments. Compared to the prior year, gross profit as a percentage of sales improved across all core products due to increased sales of higher margin products and lower material costs associated with certain products, partially offset by a shift in product mix to the lower margin window products.
Selling, General and Administrative Expenses
Selling, general and administrative expenses were $240.0 million, or 21.0% of net sales, for the year ended December 29, 2012 versus $247.3 million, or 21.3% of net sales, for 2011. The decrease of $7.3 million in selling, general and administrative expenses was primarily due to a $3.4 million decrease in executive officer separation and hiring costs, a $3.1 million decrease in sales incentives and marketing expenses and a $1.9 million decrease in certain professional fees, which includes professional services associated with cost savings initiatives. There was also a $1.6 million decrease in compensation primarily due to lower supply center headcount compared to the prior year. These decreases were partially offset by a $3.7 million increase in legal fees related to the Steel Peel litigation and a $0.9 million increase under the performance-based incentive compensation program. In addition, selling, general and administrative expenses for the year ended December 31, 2011 included a $0.8 million lease termination penalty and $0.6 million in costs related to the Merger completed on October 13, 2010.
Impairment of Goodwill and Indefinite Lived Intangible Assets
During 2011, weaker economic conditions and lower results of operations resulted in management changing our outlook and lowering our forecast used for our discounted cash flow analysis. As a result of the lower management projections for operating results and the calculated
55
Table of Contents
lower per share equity value, we believed that we had an indicator of impairment and performed interim impairment testing on goodwill and indefinite lived intangibles as of September 3, 2011. As a result, we recorded impairment charges of $84.3 million during the fourth quarter and $72.2 million during the third quarter, respectively. In addition to the interim impairment testing, we performed our annual impairment test on goodwill and indefinite lived intangibles in the fourth quarter of 2011, which resulted in an additional impairment charge related to indefinite lived intangibles of $7.7 million. No additional impairment charges were required as a result of the annual impairment test of goodwill.
Loss from Operations
Income from operations was $42.9 million for the year ended December 29, 2012 compared to a loss from operations of $147.1 million for 2011.
Interest Expense
Interest expense was $75.5 million and $75.7 million for the years ended December 29, 2012 and December 31, 2011, respectively. Interest expense for the year ended December 29, 2012 and December 31, 2011 both relate to interest on the 9.125% notes and borrowings under our ABL facilities.
Income Tax Expense
Income tax expense for the year ended December 29, 2012 was $5.6 million reflecting a negative effective income tax rate of 17.1%, whereas the income tax benefit for 2011 was $20.4 million reflected an effective income tax rate of 9.2%. The changes in the effective income tax rates for 2012 compared to 2011 were primarily due to changes between periods of the valuation allowance, goodwill impairment and tax liability on remitted earnings. The valuation allowance was recorded based upon a review of historical earnings, trends, forecasted earnings and current economic conditions.
Net Loss
Net loss for the year ended December 29, 2012 was $38.4 million compared to a net loss of $202.8 million for the same period in 2011.
EBITDA
EBITDA was $93.4 million and Adjusted EBITDA was $96.4 million for the year ended December 29, 2012. EBITDA was a loss of $96.2 million and Adjusted EBITDA was $87.3 million for the year ended December 31, 2011. For a reconciliation of our net income (loss) to EBITDA and Adjusted EBITDA and additional details of the EBITDA adjustments, see the table shown above.
Year Ended December 31, 2011 Compared to the Successor Period Ended January 1, 2011 and Predecessor Period Ended October 12, 2010
Net Sales
Net sales for the year ended December 31, 2011 were $1,159.5 million and primarily consisted of 31% vinyl windows, 19% siding products, 15% metal products and 28% third-party manufactured products. Third-party manufactured products were positively impacted as a result of our roll-out of roofing materials to additional supply centers and increased storm-related activity. Vinyl window sales were negatively impacted by the significant reduction in energy tax incentives compared to 2010, which affected consumer purchasing decisions in 2011. The macroeconomic drivers for our industry continued to decline during 2011 and negatively affected consumer confidence and spending. In addition, we realized $9.0 million from the impact of the stronger Canadian dollar in 2011. Net sales for the successor period October 13, 2010 to January 1, 2011 were $269.2 million and primarily consisted
56
Table of Contents
of approximately 44% vinyl windows, 15% siding products, 13% metal products and 21% third-party manufactured products. Net sales for the predecessor period January 3, 2010 to October 12, 2010 were $897.9 million and primarily consisted of approximately 35% vinyl windows, 20% siding products, 16% metal products and 22% third-party manufactured products. Sales for the successor period October 13, 2010 to January 1, 2011 reflected strong demand in vinyl windows and third-party manufactured products and benefited from the impact of the stronger Canadian dollar during 2010.
Gross Profit
Gross profit for the year ended December 31, 2011 was $265.2 million, or 22.9% of net sales. We experienced negative trends in gross margin primarily related to product mix, including a greater percentage of lower margin third-party manufactured products, increased material costs and lower absorption of costs due to lower production volumes. We also experienced increased production costs in our window manufacturing plants, resulting in higher costs per unit produced. Freight costs were also higher and we experienced increases in commodity costs for certain raw materials. Price increases were instituted to cover commodity cost increases; however, our sales pricing typically lags the change in purchase cost. Gross profit was favorably impacted by $2.7 million for the year ended December 31, 2011 as a result of the stronger Canadian dollar as compared to the prior year. Gross profit for the successor period October 13, 2010 to January 1, 2011 was $46.5 million, or 17.3% of net sales, and reflects a reduction of $23.1 million for the amortization of the step-up in basis of inventory related to purchase accounting, partially offset by $1.2 million of other purchase accounting related adjustments, and $1.2 million for the impairment related to issues with and the ultimate discontinuation of a new product line. Gross profit for the predecessor period January 3, 2010 to October 12, 2010 was $239.4 million, or 26.7% of net sales.
Selling, General and Administrative Expenses
Selling, general and administrative expenses were $247.3 million, or 21.3% of net sales, for the year ended December 31, 2011. Selling, general and administrative expenses for the period were negatively impacted by increased depreciation and amortization related to the application of purchase accounting for the Merger of approximately $20.0 million, executive officer separation and hiring costs of $6.7 million, higher delivery expense reflecting increased fuel costs, supply center and roofing distribution expansion costs, an operating lease termination penalty of $0.8 million, stock compensation expense related to restricted shares issued to certain board members of $0.7 million and $0.6 million of excess severance primarily due to changes within management, partially offset by reduced pension expense of $1.9 million as a result of the application of purchase accounting. Selling, general and administrative expenses for the year ended December 31, 2011 increased by $1.7 million as a result of the stronger Canadian dollar as compared to the prior year. For the successor period October 13, 2010 to January 1, 2011, selling, general and administrative expenses totaled $53.5 million, or 19.9% of net sales, and included increased depreciation of fixed assets and amortization of intangible assets of approximately $5.0 million as a result of the revaluation of certain assets as part of the application of the purchase accounting fair value adjustments in 2010, professional fees associated with cost savings initiatives of $3.0 million, $1.2 million in impairment and write-offs of assets and employee termination costs totaling $1.4 million. Selling, general and administrative expenses for the predecessor period January 3, 2010 to October 12, 2010 totaled $159.4 million, or 17.8% of net sales. Selling, general and administrative expenses for the predecessor period January 3, 2010 to October 12, 2010 included professional fees associated with cost savings initiatives of $2.7 million, excess severance of $0.4 million and management fees expense of $0.7 million. Selling, general and administrative expenses also included increased costs as a result of the translation impact on Canadian expenses as a result of the stronger Canadian dollar and increased salaries and incentive compensation programs.
57
Table of Contents
Impairment of Goodwill and Indefinite Lived Intangible Assets
During the third quarter of 2011, the weaker economic conditions and lower results of operations resulted in management changing our outlook and lowering our forecast used for our discounted cash flow analysis. As a result of the lower management projections for operating results and the calculated lower per share equity value, we believed that we had an indicator of impairment and performed interim impairment testing on goodwill and indefinite lived intangibles as of September 3, 2011 resulting in impairment charges of $84.3 million during the fourth quarter of 2011 and $72.2 million during the third quarter, respectively.
In addition to the interim impairment testing, we performed our annual impairment test on goodwill and indefinite lived intangibles in the fourth quarter of 2011. We had revised our forecasts downward after the date of the interim impairment testing based on our annual budgeting process, which resulted in an additional impairment charge related to indefinite lived intangibles of $7.7 million. No additional impairment charges were required as a result of the annual impairment test of goodwill.
Merger Costs
Transaction costs associated with the Merger were $0.6 million for the year ended December 31, 2011. For the successor period October 13, 2010 to January 1, 2011, transaction costs associated with the Merger were $7.4 million. Merger costs for the predecessor period January 3, 2010 to October 12, 2010 included $38.4 million related to investment banking fees and expenses, legal fees and expenses and sponsor fees paid to Harvest Partners and Investcorp International Inc. In addition, we recorded $26.2 million of expense related to transaction bonuses paid to certain members of management in connection with the completion of the Merger and $38.0 million of stock option compensation expense related to the modification of certain Predecessor stock options in connection with the Merger and the fair value of an in-the-money stock option award granted immediately prior to the Merger.
Loss from Operations
Loss from operations of $147.1 million for the year ended December 31, 2011 was primarily due to the impairment charges related to goodwill and other intangible assets, a full year of increased depreciation and amortization related to the application of purchase accounting for the Merger, reduced gross profit margins, executive officer separation and hiring costs and lower supply center expense leverage. Loss from operations was $14.4 million for the successor period October 13, 2010 to January 1, 2011 and was primarily due to the purchase accounting related adjustments reflected in gross margin and transaction costs related to the Merger. Loss from operations was $22.7 million for the predecessor period January 3, 2010 to October 12, 2010 and was primarily due to the Merger costs included in the results of operations.
Interest Expense
Interest expense was $75.7 million for the year ended December 31, 2011 and $16.1 million for the successor period ended January 1, 2011 and primarily consisted of interest on the 9.125% notes and borrowings under our ABL facilities and amortization of deferred financing costs. Interest expense of $58.8 million for the predecessor period January 3, 2010 to October 12, 2010 primarily consisted of interest expense on the 11.25% notes, the 9.875% notes and the prior ABL facility for the period January 3, 2010 through October 12, 2010 and amortization of deferred financing costs. The 9.875% notes and the 11.25% notes were redeemed and the indentures related thereto were discharged in October 2010 in connection with the Merger.
58
Table of Contents
Loss on Debt Extinguishment
The loss on debt extinguishment of $25.1 million for the successor period October 13, 2010 to January 1, 2011 was comprised of $13.6 million related to the redemption of the previously outstanding 9.875% notes and 11.25% notes and $11.5 million of expense related to an interim financing facility, which was negotiated but ultimately not utilized. The net gain on debt extinguishment of $15.2 million for the predecessor period January 3, 2010 to October 12, 2010 was recorded by the Predecessor in connection with the Merger and related to the write-off of the troubled debt accrued interest associated with the redemption of the previously outstanding 13.625% notes and the write-off of the financing fees related to the prior ABL facility.
Income Tax Benefit
The income tax benefit for the year ended December 31, 2011 was $20.4 million and reflected an effective income tax rate of 9.2%. The income tax provision for the successor period October 13, 2010 to January 1, 2011 was $8.6 million on a loss before income taxes of $56.5 million and reflects an effective income tax rate of approximately 15.1%. The changes in the effective income tax rates for the year ended December 31, 2011 and the successor period ended January 1, 2011 were primarily due to the impact of the changes in the valuation allowance between periods and the goodwill impairment charge. After a review of historical earnings, trends, forecasted earnings and current economic conditions, we determined that it is more likely than not that our net U.S. deferred tax assets would not be realized. The increase in the valuation allowance during this period was related to an increase in the deferred tax assets related to the net operating loss carryforwards and the net movement of other deferred tax assets and liabilities. The income tax provision for the predecessor period January 3, 2010 to October 12, 2010 of $5.2 million on a loss before income taxes of $66.1 million, or an effective income tax rate of approximately 7.9%, reflects the impact of the changes between years in the valuation allowance. This valuation allowance was recorded based upon a review of historical earnings, trends, forecasted earnings and current economic conditions. The increase in the valuation allowance during this period was related to an increase in the deferred tax assets related to the net operating loss carryforwards and the net movement of other deferred tax assets and liabilities.
Net Loss
Net loss for the year ended December 31, 2011 was $202.8 million. Net loss for the successor period October 13, 2010 to January 1, 2011 was $65.0 million. Net loss for the predecessor period January 3, 2010 to October 12, 2010 was $71.3 million.
EBITDA
EBITDA was a loss of $96.2 million and Adjusted EBITDA was $87.3 million for the year ended December 31, 2011. EBITDA was a loss of $29.8 million and Adjusted EBITDA was $30.6 million for the successor period October 13, 2010 to January 1, 2011. EBITDA was $10.3 million and Adjusted EBITDA was $102.7 million for the predecessor period January 3, 2010 to October 12, 2010. For a reconciliation of our net income (loss) to EBITDA and Adjusted EBITDA and additional details of the EBITDA adjustments, see the table shown above.
Quarterly Financial Data
Because most of our building products are intended for exterior use, sales and operating profits tend to be lower during periods of inclement weather. Weather conditions in the first quarter of each calendar year usually result in that quarter producing significantly less net sales and net cash flows from operations than in any other period of the year. Consequently, we have historically had losses or small profits in the first quarter and reduced profits from operations in the fourth quarter of each
59
Table of Contents
calendar year. To meet seasonal cash flow needs during the periods of reduced sales and net cash flows from operations, we have typically utilized our revolving credit facilities and repay such borrowings in periods of higher cash flow. We typically generate the majority of our cash flow in the third and fourth quarters.
Summary financial data for 2013, 2012 and 2011 to date are shown in the tables below:
| Quarter Ended | ||||||||||||||||||||||||||||||||||||||||||||
| September 29, 2013 |
June 29, 2013 |
March 30, 2013 |
December 29, 2012 |
September 29, 2012 |
June 30, 2012 |
March 31, 2012 |
December 31, 2011 |
October 1, 2011 |
July 2, 2011 |
April 2, 2011 |
||||||||||||||||||||||||||||||||||
| (in thousands) |
||||||||||||||||||||||||||||||||||||||||||||
| Net sales |
$ | 339,905 | $ | 324,575 | $ | 208,984 | $ | 290,142 | $ | 325,034 | $ | 314,391 | $ | 212,954 | $ | 303,119 | $ | 349,201 | $ | 310,459 | $ | 196,736 | ||||||||||||||||||||||
| Gross profit |
81,946 | 82,195 | 44,754 | 79,500 | 81,604 | 80,706 | 41,094 | 59,604 | 85,159 | 80,340 | 40,079 | |||||||||||||||||||||||||||||||||
| Income (loss) from operations |
24,831 | 19,392 | (12,081 | ) | 17,936 | 22,153 | 21,164 | (18,376 | ) | (92,276 | ) | (50,659 | ) | 14,716 | (18,837 | ) | ||||||||||||||||||||||||||||
| Net income (loss) |
2,495 | (3,136 | ) | (31,341 | ) | (1,397 | ) | 533 | 376 | (37,867 | ) | (110,457 | ) | (48,017 | ) | (7,194 | ) | (37,123 | ) | |||||||||||||||||||||||||
| Certain significant items included in income (loss) from operations: |
||||||||||||||||||||||||||||||||||||||||||||
| Impairment of goodwill |
$ | — | $ | — | $ | — | $ | — | $ | — | $ | — | $ | — | $ | 84,253 | $ | — | $ | — | $ | — | ||||||||||||||||||||||
| Impairment of intangible assets |
— | — | — | — | — | — | — | 7,652 | 72,242 | — | — | |||||||||||||||||||||||||||||||||
| Executive officer separation and hiring costs |
57 | 1,115 | 21 | 445 | 46 | 1,228 | 1,647 | 432 | 807 | 5,467 | — | |||||||||||||||||||||||||||||||||
| Excess legal expense (benefit) |
67 | 47 | 88 | 3,403 | 196 | (7 | ) | 452 | 80 | 17 | 44 | 221 | ||||||||||||||||||||||||||||||||
|
|
|
|
|
|
|
|
|
|
|
|
|
|
|
|
|
|
|
|
|
|
|
|||||||||||||||||||||||
| Total |
$ | 124 | $ | 1,162 | $ | 109 | $ | 3,848 | $ | 242 | $ | 1,221 | $ | 2,099 | $ | 92,417 | $ | 73,066 | $ | 5,511 | $ | 221 | ||||||||||||||||||||||
|
|
|
|
|
|
|
|
|
|
|
|
|
|
|
|
|
|
|
|
|
|
|
|||||||||||||||||||||||
Liquidity and Capital Resources
As of September 28, 2013, we had $9.5 million and $0.7 million of cash and cash equivalents in the United States and Canada, respectively. As of December 29, 2012, we had $7.3 million and $2.3 million of cash and cash equivalents in the United States and Canada, respectively. At September 28, 2013, we had available borrowing capacity of $182.0 million under our ABL facilities, after giving effect to outstanding letters of credit and borrowing base limitations. We believe that borrowing capacity under the credit facilities and current cash and cash equivalents are expected to provide sufficient liquidity to maintain our current operations and capital expenditure requirements and service our debt obligations for at least the next 12 months.
On April 18, 2013, Associated Materials, Holdings and certain direct or indirect wholly owned U.S. and Canadian restricted subsidiaries of Associated Materials entered into the Amended and Restated Revolving Credit Agreement, which amended the revolving credit agreement governing the ABL facilities to, among other things: reduce the interest rate margins in respect of the loans by 75 basis points; and extend the maturity of the loans and commitments to the earlier of (1) April 18, 2018 and (2) 90 days prior to the maturity of our 9.125% notes and permit the offering of the new notes (as defined below).
On May 1, 2013, Associated Materials and AMH New Finance, Inc. issued and sold $100.0 million in aggregate principal amount of additional 9.125% notes (the “new notes”) in a private placement. We used the net proceeds of the offering to repay outstanding borrowings under our ABL facilities and for other general corporate purposes. The new
60
Table of Contents
notes were issued as additional notes under the same indenture, dated as of October 13, 2010, governing the $730.0 million aggregate principal amount of 9.125% notes issued on October 13, 2010, as supplemented by a supplemental indenture (the “Indenture”). See “—Description of Indebtedness.”
We may from time to time, in our sole discretion, purchase, redeem or retire the 9.125% notes in privately negotiated or open market transactions by tender offer or otherwise.
Upon the closing of this offering, we intend to enter into a tax receivable agreement with our Pre-
IPO Stockholders. See “—Contractual Obligations.” Because we are a holding company with no operations of our own, our ability to make payments under the tax receivable agreement is dependent on the ability of our subsidiaries to make distributions to us. We expect any such distributions to be funded by net cash provided by operating activities, if any, borrowing capacity under the ABL facilities and current cash and cash equivalents. The ABL facilities and the indenture governing the 9.125% notes may restrict the ability of our subsidiaries to make distributions to us, which could affect our ability to make payments under the tax receivable agreement. Associated Materials Group, Inc. is not subject to the restrictions of the ABL facilities or the 9.125% notes. To the extent that we are unable to make payments under the tax receivable agreement as a result of limitations imposed by any debt instruments to which we or any of our subsidiaries is a party (including the debt covenants described under “—Covenant Compliance”), such payments will be deferred and will accrue interest at a rate of LIBOR plus basis points until paid. To the extent that we are unable to make payments under the tax receivable agreement for any other reason, such payments will be deferred and will accrue interest at a rate of LIBOR plus basis points until paid. In either case, our inability to make payments under the tax receivable agreement could adversely affect our results of operations and could also affect our liquidity in periods in which such payments are made. However, because we will defer payments under the tax receivable agreement as a result of any limitations imposed by such debt instruments, any payments made under the tax receivable agreement are not expected to have a significant impact on our ability to comply with our debt covenants.
Covenant Compliance
There are no financial maintenance covenants included in the Amended and Restated Revolving Credit Agreement and the Indenture, other than a springing fixed charge coverage ratio of at least 1.00 to 1.00 under the ABL facilities, which is triggered as of the end of the most recently ended four consecutive fiscal quarter period for which financial statements have been delivered prior to such date of determination, only when excess availability is less than, for a period of five consecutive business days, the greater of $20.0 million and 10.0% of the sum of (i) the lesser of (A) the U.S. tranche A borrowing base and (B) the U.S. tranche A revolving credit commitments, and which applies until the 30th consecutive day that excess availability exceeds such threshold. The fixed charge coverage ratio was 1.31:1.00 for the four consecutive fiscal quarter test period ended September 28, 2013. The Amended and Restated Revolving Credit Agreement and the Indenture permit the inclusion of run-rate cost savings in the calculation of Consolidated EBITDA in an amount, taken together with the amount of certain restructuring costs, up to 10% of Consolidated EBITDA for the relevant test period.
As of September 28, 2013, Associated Materials has not triggered such fixed charge coverage ratio covenant for 2013, and it currently does not expect to be required to test such covenant for the remainder of fiscal year 2013, although, as of September 28, 2013, Associated Materials would be in compliance with such covenant if it were required to be tested. Should the current economic conditions or other factors described herein cause Associated Materials’ results of operations to deteriorate beyond our expectations, it may trigger such covenant and, if so triggered, may not be able to satisfy such covenant and be forced to refinance such debt or seek a waiver. Even if new financing is available, it may not be available on terms that are acceptable to it. If Associated Materials is required to seek a waiver, it may be required to pay significant amounts to the lenders under the ABL facilities to obtain such a waiver.
61
Table of Contents
In addition to the financial covenant described above, certain incurrences of debt and investments require compliance with financial covenants under the Amended and Restated Revolving Credit Agreement and the Indenture. The breach of any of these covenants could result in a default under the Amended and Restated Revolving Credit Agreement and the Indenture, and the lenders or note holders, as applicable, could elect to declare all amounts borrowed due and payable. See “Risk Factors.”
Consolidated EBITDA is calculated by reference to net income plus interest and amortization of other financing costs, provision for income taxes, depreciation and amortization. Consolidated EBITDA, as defined in the Amended and Restated Revolving Credit Agreement and the Indenture, is calculated by adjusting EBITDA to reflect adjustments permitted in calculating covenant compliance under these agreements. Consolidated EBITDA will be referred to as Adjusted EBITDA herein. We believe that the inclusion of supplementary adjustments to EBITDA applied in presenting Adjusted EBITDA are appropriate to provide additional information to investors to demonstrate the ability of Associated Materials to comply with its financial covenant.
Associated Materials was in compliance with its debt covenants as of September 28, 2013.
Cash Flows
The following sets forth a summary of our cash flows:
| Successor | Predecessor | |||||||||||||||||||||||||
| Nine months Ended | Year Ended | October 13, 2010 to January 1, 2011 |
January 3, 2010 to October 12, 2010 |
|||||||||||||||||||||||
| September 28, 2013 |
September 29, 2012 |
December 29, 2012 |
December 31, 2011 |
|||||||||||||||||||||||
| (in thousands) |
||||||||||||||||||||||||||
| Net cash (used in) provided by operating activities |
$ | (14,409 | ) | $ | (14,104 | ) | $ | (589 | ) | $ | (2,005 | ) | $ | (72,141 | ) | $ | 28,569 | |||||||||
| Net cash used in investing activities |
|
(9,198 |
) |
|
(3,632 |
) |
(5,277 | ) | (16,503 | ) | (562,751 | ) | (10,302 | ) | ||||||||||||
| Net cash provided by (used in) financing activities |
24,297 | 16,076 | 4,155 | 15,902 | 582,324 | (8,406 | ) | |||||||||||||||||||
Cash Flows from Operating Activities
Successor Company
Net cash used in operating activities was $14.4 million for the nine months ended September 28, 2013, compared to $14.1 million for the same period in 2012, which was a $0.3 million increase in the use of cash from the comparable prior year period. Change in accounts receivable was a use of cash of $47.6 million for the nine months ended September 28, 2013, compared to a use of cash of $38.1 million for the nine months ended September 29, 2012. The net decrease in cash flows from accounts receivable of $9.5 million reflected an increase in sales volume in the current year third quarter compared to the prior year period as well as timing of collections from customers. Change in accounts payable and accrued liabilities was a source of cash of $73.0 million for the nine months ended September 28, 2013, compared to a source of cash of $61.6 million for the nine months ended September 29, 2012, resulting in a net increase in cash flows of $11.4 million. This increase was largely attributable to lower beginning accounts payable balances in the current year compared to the prior year, primarily due to timing of purchases. Cash flows used in operating activities for the nine months ended September 28, 2013 include income tax payments of $4.4 million compared to $11.1 million of income tax payments for the same period in 2012.
62
Table of Contents
Net cash used in operating activities was $0.6 million for the year ended December 29, 2012, compared to $2.0 million for the year ended December 31, 2011, an improvement of $1.4 million. Cash flows from changes in operating assets and liabilities for the year ended December 29, 2012 were a use of cash of $17.8 million, compared to a source of cash of $9.4 million for the year ended December 31, 2011. Change in accounts receivable was a use of cash of $1.3 million in 2012, compared to a use of cash of $7.8 million in 2011. The year-over-year fluctuation was primarily due to timing of collections from customers and lower sales compared to the prior year. Change in inventory was a use of cash of $1.6 million for the year ended December 29, 2012, compared to a source of cash of $29.7 million for the year ended December 31, 2011. Capital optimization initiatives during 2011 effectively brought down inventory levels at the end of 2011 which contributed to the large source of cash in 2011 and also led to a relatively small use of cash in 2012. Change in accounts payable and accrued liabilities was a use of cash of $3.7 million in the year ended December 29, 2012 compared to a use of cash of $15.5 million in the year ended December 31, 2011. The changes from year to year were largely attributable to reduced inventory purchases and the difference in performance-based management incentive compensation payments during each year. The year ended December 29, 2012 included the compensation payment for the prior year, where the payment was minimal due to the lower operating results, and the year ended December 31, 2011 included the compensation payment for the prior year, where the performance target was met. Change in income taxes receivable/payable was a use of cash of $4.2 million for the year ended December 29, 2012, compared to a source of cash of $8.1 million for the year ended December 31, 2011. The source of cash in 2011 was a result of receiving a federal income tax refund of $3.2 million related to the carryback of net operating losses to the 2009 tax year, along with an increase in the Canadian taxes payable related to the Canadian partnership.
Net cash used in operating activities was $72.1 million for the successor period October 13, 2010 to January 1, 2011. Cash flows from operating activities for the successor period ended January 1, 2011 were reduced by $71.4 million of costs related to the Merger. Cash flows from changes in operating assets and liabilities for the successor period ended January 1, 2011 were a use of cash totaling $76.4 million. Change in accounts receivable was a source of cash of $42.9 million for the successor period primarily due to the collection of customer payments for sales earlier in the year. Change in inventory for the same period provided a source of cash of $13.1 million due to reduced inventory levels during the fourth quarter of 2010. Change in prepaid expenses was a use of cash totaling $1.3 million for the same period. Change in accounts payable and accrued liabilities was a use of cash of $131.0 million for the successor period October 13, 2010 to January 1, 2011, primarily related to the payment of costs related to the Merger which were accrued in the predecessor period ended October 12, 2010, along with the seasonal decline in accounts payable.
Predecessor Company
Net cash provided by operating activities was $28.6 million for the predecessor period January 3, 2010 to October 12, 2010. Cash flows from operating activities for the predecessor period ended October 12, 2010 were reduced by $0.7 million of costs related to the Merger. Cash flows from changes in operating assets and liabilities for the predecessor period ended October 12, 2010 were a source of cash totaling $47.6 million. Change in accounts receivable was a use of cash $49.9 million for the predecessor period ended October 12, 2010 primarily due to increased sales levels during 2010. Change in inventory for the same period was a use of cash of $42.0 million due to increased inventory levels and rising commodity costs during 2010. Change in prepaid expenses was a source of cash totaling $1.7 million for the same period. Change in accounts payable and accrued liabilities was a source of cash of $137.8 million for the predecessor period January 3, 2010 to October 12, 2010. The change was primarily due to the initial impact of improved vendor terms in 2009, reduced inventory purchase requirements during the fourth quarter of 2008 and expenses accrued in connection with the Merger which were paid in the successor period October 13, 2010 to January 1, 2011.
63
Table of Contents
Cash Flows from Investing Activities
Successor Company
Net cash used in investing activities during the nine months ended September 28, 2013 consisted of $8.9 million of capital expenditures primarily related to investments in our new windows platform to be launched in 2014 and $0.3 million for a supply center acquisition. During the nine months ended September 29, 2012, net cash used in investing activities consisted of capital expenditures of $3.7 million primary related to various investments at our manufacturing facilities.
Investing activities used $5.3 million of cash in the year ended December 29, 2012, compared to $16.5 million in the year ended December 31, 2011. The use of cash in the current year consisted of capital expenditures of $5.4 million offset by proceeds received from the sale of certain assets of $0.1 million. The use of cash during the year ended December 31, 2011 consisted of capital expenditures of $15.4 million and a supply center acquisition of $1.6 million, partially offset by proceeds received from the sale of certain assets of $0.5 million. Capital expenditures in 2012 decreased as compared to the prior year primarily due to higher spending in 2011 as a result of our roll-out of roofing materials to supply centers.
For the successor period October 13, 2010 to January 1, 2011, net cash used in investing activities included $557.6 million of cash used in connection with the Merger to purchase the Predecessor’s equity interests, including in-the-money stock options and warrants, and capital expenditures of $5.2 million. Capital expenditures were primarily at supply centers for continued operations and relocations and various enhancements at plant locations.
Predecessor Company
For the predecessor period January 3, 2010 to October 12, 2010, net cash used in investing activities included capital expenditures of $10.3 million. Capital expenditures were primarily at supply centers for continued operations and relocations, the continued development of our new glass insourcing process and various enhancements at plant locations.
Cash Flows from Financing Activities
Successor Company
Net cash provided by financing activities for the nine months ended September 28, 2013 included proceeds of $106.0 million from the issuance of the additional 9.125% Senior Secured Notes due 2017 on May 1, 2013, borrowings of $123.9 million under our ABL facilities and $0.7 million from the repayment of the outstanding principal amount of and accrued interest on a promissory note issued to Mr. Burris. These inflows were partially offset by repayments of $200.9 million under our ABL facilities and $5.4 million of financing costs related to the issuance of the additional 9.125% Senior Secured Notes due 2017 and amendment of our ABL facilities during the current year second quarter. Net cash used in financing activities for the nine months ended September 29, 2012 included borrowings of $147.6 million under our ABL facilities offset by repayments of $131.4 million and payment of financing costs of $0.2 million.
Net cash provided by financing activities was $4.2 million for the year ended December 29, 2012, compared to $15.9 million for the year ended December 31, 2011. The source of cash primarily related to net borrowings under our ABL facilities of $4.3 million and $16.0 million in 2012 and 2011, respectively.
Net cash provided by financing activities for the successor period October 13, 2010 to January 1, 2011 included an equity contribution of $553.5 million in connection with the Merger, proceeds from the issuance of the 9.125% notes of $730.0 million, and net borrowings under our current ABL facilities of $58.0 million. These inflows were partially offset by cash paid of $720.0 million to redeem the 20% notes, the 11.25% notes and the 9.875% notes and payments of $39.2 million of financing costs related to the Merger.
64
Table of Contents
Predecessor Company
Net cash used by financing activities for the predecessor period January 3, 2010 to October 12, 2010 included $10.0 million of repayments, net of borrowings, under our prior ABL facility and payments of $0.2 million of financing costs in connection with the Merger, offset by $1.8 million related to the excess tax benefit from the redemption of options in connection with the Merger.
For 2013, cash requirements for working capital, capital expenditures, interest and tax payments will continue to impact the timing and amount of borrowings on our ABL facilities.
Contractual Obligations
The following table presents our contractual obligations as of September 28, 2013:
| Payments Due by Fiscal Year | ||||||||||||||||||||||||||||
| Total | 2013 | 2014 | 2015 | 2016 | 2017 | After 2017 | ||||||||||||||||||||||
| (in thousands) | ||||||||||||||||||||||||||||
| Long-term debt(1) |
$ | 831,000 | $ | — | $ | — | $ | 1,000 | $ | — | $ | 830,000 | $ | — | ||||||||||||||
| Interest payments on 9.125% notes(2) |
340,821 | 37,869 | 75,738 | 75,738 | 75,738 | 75,738 | — | |||||||||||||||||||||
| Operating leases(3) |
131,615 | 36,526 | 30,601 | 20,775 | 14,432 | 10,962 | 18,319 | |||||||||||||||||||||
| Expected pension contributions(4) |
65,998 | 12,087 | 13,986 | 14,118 | 13,814 | 11,993 | — | |||||||||||||||||||||
|
|
|
|
|
|
|
|
|
|
|
|
|
|
|
|||||||||||||||
| Total |
$ | 1,369,434 | $ | 86,482 | $ | 120,325 | $ | 111,631 | $ | 103,984 | $ | 928,693 | $ | 18,319 | ||||||||||||||
|
|
|
|
|
|
|
|
|
|
|
|
|
|
|
|||||||||||||||
| (1) | Represents principal amounts, but not interest. Does not reflect the anticipated redemption of a portion of our outstanding 9.125% notes with net proceeds of this offering. As of September 28, 2013, our long-term debt consists of $1.0 million in borrowings under the ABL facilities and $835.5 million aggregate principal amount of 9.125% notes including unamortized premium. We are not able to estimate reasonably the cash payments for interest associated with the ABL facilities due to the significant estimation required related to both market rates as well as projected principal payments. The stated maturity date of our 9.125% notes is November 1, 2017. See Note 12 to the audited consolidated financial statements included elsewhere in this prospectus. |
| (2) | Does not reflect the anticipated redemption of a portion of our outstanding 9.125% notes with net proceeds of this offering. As a result of the redemption of $ million of our outstanding 9.125% notes with the net proceeds of this offering, we expect interest payments on the 9.125% notes to decrease to $ in 2013 and $ in 2014 through 2017. |
| (3) | For additional information on our operating leases, see Note 17 to the audited consolidated financial statements included elsewhere in this prospectus. |
| (4) | Based on actuarial data as of December 31, 2012. Although subject to change, the amounts set forth in the table above represent the estimated minimum funding requirements under current law. Due to uncertainties regarding significant assumptions involved in estimating future required contributions to our pension plans, including: (i) interest rate levels, (ii) the amount and timing of asset returns and (iii) what, if any, changes may occur in pension funding legislation, the estimates in the table may differ materially from actual future payments. We cannot reasonably estimate payments beyond 2017. |
Net long-term deferred income tax liabilities as of December 29, 2012 were $130.8 million. This amount is not included in the contractual obligations table because we believe this presentation would not be meaningful. Deferred income tax liabilities are calculated based on temporary differences between the tax bases of assets and liabilities and their respective book bases, which will result in taxable amounts in future years when the liabilities are settled at their reported financial statement amounts. The results of these calculations do not have a direct connection with the amount of cash taxes to be paid in any future periods. As a result, we believe scheduling deferred income tax liabilities as payments due by period could be misleading, because this scheduling would not relate to liquidity
65
Table of Contents
needs. At December 29, 2012, we had unrecognized tax benefits of $7.1 million relating to uncertain tax positions. Due to our federal net operating loss position, the settlement of such tax positions would be offset by the net operating losses resulting in no outlay of cash.
Consistent with industry practice, we provide to homeowners limited warranties on certain products, primarily related to window and siding product categories. We have recorded reserves of $97.5 million at December 29, 2012 related to warranties issued to homeowners. We estimate that $9.4 million of payments will be made in 2013 to satisfy warranty obligations. However, we cannot reasonably estimate payments by year for 2014 and thereafter due to the nature of the obligations under these warranties.
We also have a liability in connection with the tax receivable agreement that we will enter into upon the closing of this offering. The tax receivable agreement will obligate us to make payments to the Pre-IPO Stockholders generally equal to 85% of the applicable cash savings that we realize as a result of NOL carryovers, deductible expenses attributable to the transactions related to this offering, and deductions arising from or attributable to payments under the tax receivable agreement, if any. We will retain the benefit of the remaining 15% of these tax savings.
The payments we will be required to make could be substantial and are not reflected in the above tables. We expect that, as a result of the amount of the NOL carryovers from prior periods (or portions thereof), assuming no material changes in the relevant tax law and that we earn sufficient taxable income to realize in full the potential tax benefit described above, future payments under the tax receivable agreement, in respect of the NOL carryovers, could be up to approximately $ million in the aggregate and would be paid within the next years, assuming that utilization of such tax attributes is not subject to limitation under Section 382 of the Internal Revenue Code of 1986, as amended (the “Code”), as the result of an “ownership change” (within the meaning of Section 382 of the Code) of Associated Materials Group, Inc. These amounts reflect only the cash savings attributable to current tax attributes resulting from the NOL carryovers. It is possible that future transactions or events could increase or decrease the actual tax benefits realized from these tax attributes and the corresponding tax receivable agreement payments. We are currently unable to estimate the amount of payments under the tax receivable agreement in respect of deductible expenses attributable to the transactions related to this offering or deductions arising from or attributable to payments under this tax receivable agreement, if any. See “Risk Factors—Risks Related to Our Business—We will be required to pay our Pre-IPO Stockholders for certain tax benefits, including net operating loss carryovers, we may claim, and the amounts we may pay could be substantial” and “Certain Relationships and Related Party Transactions—Tax Receivable Agreement.”
Off-Balance Sheet Arrangements
We have no special purpose entities or off-balance sheet debt, other than operating leases in the ordinary course of business, which are disclosed in Note 17 to the consolidated financial statements included elsewhere in this prospectus.
At September 28, 2013 and December 29, 2012, we had stand-by letters of credit of $11.0 million and $9.3 million, respectively, with no amounts drawn under the stand-by letters of credit. These letters of credit reduce the availability under the ABL facilities. Letters of credit are purchased guarantees that ensure our performance or payment to third parties in accordance with specified terms and conditions.
Under certain agreements, indemnification provisions may require us to make payments to third parties. In connection with certain facility leases, we may be required to indemnify the lessors for certain claims. Also, we may be required to indemnify our directors, officers, employees and agents to the maximum extent permitted under the laws of the State of Delaware. The duration of these indemnity
66
Table of Contents
provisions under the terms of each agreement varies. The majority of indemnities do not provide for any limitation of the maximum potential future payments we could be obligated to make. In 2012, we did not make any payments under any of these indemnification provisions or guarantees, and we have not recorded any liability for these indemnities in the accompanying consolidated balance sheets.
Quantitative and Qualitative Disclosures about Market Risk
Interest Rate Risk
We have outstanding borrowings under our ABL facilities and may incur additional borrowings from time to time for general corporate purposes, including working capital and capital expenditures. As of September 28, 2013, the interest rate applicable to outstanding loans under the U.S. and Canadian tranche A revolving facilities is, at our option, equal to either a U.S. or Canadian adjusted base rate plus an applicable margin ranging from 0.75% to 1.25%, or LIBOR plus an applicable margin ranging from 1.75% to 2.25%, with the applicable margin in each case depending on our quarterly average “excess availability” as defined in the credit facilities.
As of September 28, 2013, we had borrowings outstanding of $1.0 million under the ABL facilities. The effect of a 1.00% increase or decrease in interest rates would not materially impact the total annual interest expenses. As of September 28, 2013, we are not party to any interest rate swaps.
We have $830.0 million aggregate principal amount of 9.125% notes outstanding as of September 28, 2013, which bear a fixed interest rate of 9.125%. The fair value of our 9.125% notes is sensitive to changes in interest rates. In addition, the fair value is affected by our overall credit rating, which could be impacted by changes in our future operating results. These notes have an estimated fair value of $887.1 million based on quoted market prices as of September 28, 2013.
Foreign Currency Exchange Rate Risk
Our revenues are primarily from domestic customers and are realized in U.S. dollars. However, we realize revenues from sales made through our Canadian distribution centers in Canadian dollars. Our Canadian manufacturing facilities acquire raw materials and supplies from U.S. vendors, which results in foreign currency transactional gains and losses upon settlement of the obligations. Payment terms among Canadian manufacturing facilities and these vendors are short-term in nature. We may, from time to time, enter into foreign exchange forward contracts with maturities of less than three months to reduce our exposure to fluctuations in the Canadian dollar. As of September 28, 2013, we were a party to foreign exchange forward contracts for Canadian dollars, the value of which was $0.1 million. A 10% strengthening or weakening from the levels experienced during 2013 of the U.S. dollar relative to the Canadian dollar would have resulted in a $0.7 million decrease or increase, respectively, in comprehensive loss for the nine months ended September 28, 2013.
Commodity Price Risk
See “—Effects of Inflation” below for a discussion of the market risk related to our principal raw materials (vinyl resin, aluminum, steel, resin stabilizers and pigments, glass, window hardware and packaging materials) and diesel fuel.
Effects of Inflation
The principal raw materials used by us are vinyl resin, aluminum, steel, resin stabilizers and pigments, glass, window hardware, and packaging materials, as well as diesel fuel, all of which have historically been subject to price changes. Raw material pricing on our key commodities has fluctuated significantly over the past several years. Our freight costs may also fluctuate based on changes in
67
Table of Contents
gasoline and diesel fuel costs related to our trucking fleet. Our ability to maintain gross margin levels on our products during periods of rising raw material costs and freight costs depends on our ability to obtain selling price increases. Furthermore, the results of operations for individual quarters can be negatively impacted by a delay between the timing of raw material cost increases and price increases on our products. There can be no assurance that we will be able to maintain the selling price increases already implemented or achieve any future price increases. At September 28, 2013, we had no raw material hedge contracts in place.
Critical Accounting Policies
Our discussion and analysis of our financial condition and results of operations are based upon our consolidated financial statements, which have been prepared in accordance with U.S. generally accepted accounting principles. The preparation of these consolidated financial statements requires us to make estimates and judgments that affect the reported amounts of assets, liabilities, revenues and expenses. On an ongoing basis, we evaluate our estimates, including those related to recoverability of intangibles and other long-lived assets, customer programs and incentives, allowance for doubtful accounts, inventories, warranties, valuation allowances for deferred tax assets, share-based compensation, pensions and postretirement benefits and various other allowances and accruals. We base our estimates on historical experience and on various other assumptions that are believed to be reasonable under the circumstances, the results of which form the basis for making judgments about the carrying values of assets and liabilities that are not readily apparent from other sources. Actual results may differ from these estimates under different assumptions or conditions.
We believe the following critical accounting policies affect our more significant judgments and estimates used in the preparation of our consolidated financial statements.
Revenue Recognition
We primarily sell and distribute our products through two channels: direct sales from our manufacturing facilities to independent distributors and dealers and sales to contractors through our company-operated supply centers. Direct sales revenue is recognized when our manufacturing facility ships the product and title and risk of loss passes to the customer or when services have been rendered. Sales to contractors are recognized either when the contractor receives product directly from the supply center or when the supply center delivers the product to the contractor’s job site. For both direct sales to independent distributors and sales generated through our supply centers, revenue is not recognized until collectability is reasonably assured.
Revenues are recorded net of estimated returns, customer incentive programs and other incentive offerings including special pricing agreements, promotions and other volume-based incentives. Revisions to these estimates are charged to income in the period in which the facts that give rise to the revision become known. For contracts involving installation, revenue is recognized when the installation is complete. We collect sales, use, and value added taxes that are imposed by governmental authorities on and concurrent with sales to our customers. Revenues are presented net of these taxes as the obligation is included in accrued liabilities until the taxes are remitted to the appropriate taxing authorities.
We offer certain sales incentives to customers who become eligible based on the level of purchases made during the calendar year and are accrued as earned throughout the year. The sales incentives programs are considered customer volume rebates, which are typically computed as a percentage of customer sales, and in certain instances the rebate percentage may increase as customers achieve sales hurdles. Volume rebates are accrued throughout the year based on
68
Table of Contents
management estimates of customers’ annual sales volumes and the expected annual rebate percentage achieved. For these programs, we do not receive an identifiable benefit in exchange for the consideration, and therefore, we characterize the volume rebate to the customer as a reduction of revenue in our consolidated statements of comprehensive loss.
Accounts Receivable
We record accounts receivable at selling prices which are fixed based on purchase orders or contractual arrangements. We maintain an allowance for doubtful accounts for estimated losses resulting from the inability of our customers to make required payments. The allowance for doubtful accounts is based on a review of the overall condition of accounts receivable balances and a review of significant past due accounts. If the financial condition of our customers were to deteriorate, resulting in an impairment of their ability to make payments, additional allowances may be required. Account balances are charged off against the allowance for doubtful accounts after all means of collection have been exhausted and the potential for recovery is considered remote. Accounts receivable which are not expected to be collected within one year are reclassified as long-term accounts receivable. Long-term accounts receivable balances, net of the related allowance for doubtful accounts are included in other assets in the Consolidated Balance Sheets.
Inventories
We value our inventories at the lower of cost (first-in, first-out) or market value. We write down our inventory for estimated obsolescence or unmarketable inventory equal to the difference between the cost of inventory and the estimated market value based upon assumptions about future demand and market conditions. Market value is estimated based on the inventories’ current replacement costs by purchase or production; however, market value shall not exceed net realizable value or be lower than net realizable value less normal profit margins. The market and net realizable values of inventory require estimates and judgments based on our historical write-down experience, anticipated write-downs based on future merchandising plans and consumer demand, seasonal considerations, current market conditions and expected industry trends. If actual market conditions are less favorable than those projected by management, additional inventory write-downs may be required. Our estimates of market value generally are not sensitive to management assumptions. Replacement costs and net realizable values are based on actual recent purchase and selling prices, respectively. We believe that our average days of inventory on hand indicate that market value declines are not a significant risk and that we do not maintain excess levels of inventory. In addition, we believe that our cost of inventories is recoverable as our realized gross profit margins have remained consistent with historical periods and management currently expects margins to generally remain in-line with historical results.
Goodwill and Other Intangible Assets
We review goodwill and other intangible assets with indefinite lives for impairment on an annual basis, or more frequently if events or circumstances change that would impact the value of these assets, in accordance with FASB ASC Topic 350, Intangibles—Goodwill and Other. As the consolidated entity represents the only component that constitutes a business for which discrete financial information is reviewed by our chief operating decision maker to make decisions about resources to be allocated and assess performance, we concluded that we have one reporting unit, which is the same as our single operating segment, and we perform our goodwill impairment assessment for our company as a whole. The impairment test is conducted using an income approach. As we do not have a market for our equity, management performs the annual impairment analysis utilizing a discounted cash flow approach incorporating current estimates regarding performance and macroeconomic factors discounted at a weighted average cost of capital. We conduct our impairment test of goodwill and other intangible assets with indefinite lives annually at the beginning of the fourth quarter of each year or as indicators of
69
Table of Contents
impairment arise. The resulting fair value measures used in such impairment tests incorporate significant unobservable inputs, and as such, are considered Level 3 fair value measures.
Assumptions used in our impairment evaluation, such as long-term sales growth rates, forecasted operating margins and our discount rate are based on the best available market information and are consistent with our internal forecasts and operating plans. Changes in these estimates or a decline in general economic condition could change our conclusion regarding an impairment of goodwill and potentially result in a non-cash impairment loss in a future period. We utilize a cash flow model in estimating the fair value of our reporting unit for the income approach, where the discount rate reflects a weighted average cost of capital rate. The cash flow model used to derive fair value is most sensitive to the discount rate, long-term sales growth rate and forecasted operating margin assumptions used. Our 2012 Step 1 impairment test indicated that the fair value of our enterprise exceeded carrying value by approximately 5% as of December 29, 2012. Relatively small changes in these key assumptions could have resulted in us not passing Step 1.
During the third quarter of 2011, the weaker economic conditions and lower results of operations resulted in management changing our outlook and lowering our forecast used for our discounted cash flow analysis. As a result of the lower management projections for operating results and the calculated lower per share equity value, we believed that we had an indicator of impairment and performed interim impairment testing on goodwill and indefinite lived intangibles as of September 3, 2011 resulting in impairment charges of $84.3 million and $72.2 million, respectively. In addition to the interim impairment testing, we performed our annual impairment test on goodwill and indefinite lived intangibles in the fourth quarter of 2011. We had revised our forecasts downward after the date of the interim impairment testing based on our annual budgeting process which resulted in an additional impairment charge related to indefinite lived intangibles of $7.7 million. No additional impairment charges were required as a result of the annual impairment test of goodwill.
As of December 29, 2012, goodwill and intangible assets were $482.6 million and $599.6 million, respectively, and were associated with the Merger. Given the significant amount of goodwill and intangible assets, any future impairment could have an adverse effect on our results of operations and financial position.
Income Taxes
We account for income taxes in accordance with FASB ASC Topic 740, Income Taxes (“ASC 740”). Income tax expense includes both current and deferred taxes. Deferred tax assets and liabilities may be recognized for the effect of temporary differences between the book and tax bases of recorded assets and liabilities. ASC 740 requires deferred tax assets be reduced by a valuation allowance if it is more likely than not that some portion or all of the deferred tax asset will not be realized. We review the recoverability of any tax assets recorded on the balance sheet and provide any necessary allowances as required. When an uncertain tax position meets the more likely than not recognition threshold, the position is measured to determine the amount of expense and benefit to be recognized in the financial statement. No tax benefit is recognized in the financial statements for tax positions that do not meet the more likely than not threshold. We recognize interest and penalties related to uncertain tax positions within income tax expense. The effect of a change to the deferred tax assets or liabilities as a result of new tax law, including tax rate changes, is recognized in the period that the tax law is enacted.
Product Warranty Costs
Consistent with industry practice, we provide homeowners limited warranties on certain products, primarily related to window and siding product categories. Warranties are of varying lengths of time from the date of purchase up to and including lifetime. Warranties cover product failures such as seal
70
Table of Contents
failures for windows and fading and peeling for siding products, as well as manufacturing defects. We have various options for remedying product warranty claims including repair, refinishing or replacement and directly incur the cost of these remedies. Warranties also become reduced under certain conditions of time and change in home ownership. Certain metal coating suppliers provide warranties on materials sold to us that mitigate the costs incurred by us. Reserves for future warranty costs are provided based on management’s estimates utilizing an actuarial calculation performed by an independent actuary which projects future remedy costs using historical data trends of claims incurred, claim payments, sales history of products to which such costs relate and other factors.
As a result of the Merger and the application of purchase accounting, we adjusted our warranty reserves to represent an estimate of the fair value of the liability as of the closing date of the Merger. The estimated fair value of the liability was based on an actuarial calculation performed by an independent actuary which projected future remedy costs using historical data trends of claims incurred, claims payments and sales history of products to which such costs relate. The fair value of the expected future remedy costs related to products sold prior to the Merger was based on the actuarially determined estimates of expected future remedy costs and other factors and assumptions we believe market participants would use in valuing the warranty reserves. These other factors and assumptions included inputs for claims administration costs, confidence adjustments for uncertainty in the estimates of expected future remedy costs and a discount factor to arrive at the liability at the date of the Merger. The excess of the estimated fair value over the expected future remedy costs of $9.5 million, which was included in our warranty reserve at the date of the Merger, is being amortized as a reduction of warranty expense over the expected term such warranty claims will be satisfied. The remaining unamortized amount at December 29, 2012 is $7.9 million. Prior to the Merger, the reserves for future warranty costs were based on our estimates of such future costs. We believe that the adopted actuarial method provides us additional information to base our estimates of the expected future remedy costs and is a preferable method for estimating warranty reserves. The provision for warranties is reported within cost of sales in the consolidated statements of comprehensive loss.
Pensions
Our pension costs are developed from actuarial valuations. Inherent in these valuations are key assumptions including discount rates and expected return on plan assets. In selecting these assumptions, management considers current market conditions, including changes in interest rates and market returns on plan assets.
We used weighted-average discount rates of 4.54% and 5.17% as of December 29, 2012 to determine the net periodic pension costs for the domestic and foreign pension plans, respectively. A 100 basis point increase in the discount rate would decrease 2013 net periodic pension costs by approximately $0.1 million and $0.4 million for the domestic and foreign pension plans, respectively. A 100 basis point decrease in the discount rate would increase 2013 net periodic pension costs by approximately $0.7 million and $0.5 million for the domestic and foreign pension plans, respectively.
We used weighted-average long-term rate of return on assets of 7.50% and 6.50% as of December 29, 2012 to determine the net periodic pension costs for the domestic and foreign pension plans, respectively. A 100 basis point increase in the long-term rate of return would decrease 2013 net periodic pension costs by approximately $0.5 million and $0.6 million for the domestic and foreign pension plans, respectively. A 100 basis point decrease in the long-term rate of return would increase 2013 net periodic pension costs by approximately $0.5 million and $0.6 million for the domestic and foreign pension plans, respectively.
Changes in the related pension benefit costs may occur in the future due to changes in assumptions.
71
Table of Contents
Recent Accounting Pronouncements
In July 2013, the Financial Accounting Standards Board (“FASB”) issued Accounting Standards Update (“ASU”) No. 2013-11, Presentation of an Unrecognized Tax Benefit When a Net Operating Loss Carryforward, a Similar Tax Loss, or a Tax Credit Carryforward Exists (“ASU 2013-11”). ASU 2013-11 eliminates diversity in practice in the presentation of unrecognized tax benefits. ASU 2013-11 requires an unrecognized tax benefit, or a portion of an unrecognized tax benefit to be presented as a reduction to the related deferred tax asset for a net operating loss carryforward, a similar tax loss or a tax credit carryforward, unless a net operating loss carryforward, a similar tax loss or a tax credit carryforward is not available at the reporting date under the governing tax law to settle taxes that would result from the disallowance of the tax position, or the entity does not intend to use the deferred tax asset for such purpose. ASU 2013-11 is effective for fiscal years and interim periods within those years, beginning after December 15, 2013. We do not believe that the adoption of the provisions of ASU 2013-11 will have a material impact on our consolidated financial position, results of operations or cash flows.
In February 2013, FASB issued ASU No. 2013-02, Comprehensive Income (Topic 220): Reporting of Amounts Reclassified Out of Accumulated Other Comprehensive Income (“ASU 2013-02”). ASU 2013-02 requires the disclosure of additional information about reclassification adjustments, including (1) changes in accumulated other comprehensive income balances by component and (2) significant items reclassified out of accumulated other comprehensive income. Required disclosures include disaggregation of the total change of each component of other comprehensive income and the separate presentation of reclassification adjustments and current-period other comprehensive income. In addition, ASU 2013-02 requires the presentation of information about significant items reclassified out of accumulated other comprehensive income by component either on the face of the statement where net income is presented or as a separate disclosure in the notes to the financial statements. The new disclosure requirements are effective, prospectively, for fiscal years, and interim periods within those years, beginning after December 15, 2012. ASU 2013-02 concerns presentation and disclosure only. Adoption of the provisions of ASU 2013-02 at the beginning of 2013 did not have an impact on our consolidated financial position, results of operations or cash flows.
In July 2012, the FASB issued ASU No. 2012-02, Intangibles—Goodwill and Other (Topic 350): Testing Indefinite-Lived Intangible Assets for Impairment (“ASU 2012-02”). ASU 2012-02 permits an entity first to assess qualitative factors to determine whether it is more likely than not that an indefinite-lived intangible asset is impaired. If an entity determines that it is not more likely than not that the asset is impaired, the entity will have the option not to calculate annually the fair value of an indefinite-lived intangible asset. The more-likely-than-not threshold is defined as having a likelihood of more than 50 percent. ASU 2012-02 is effective for annual and interim impairment tests performed for fiscal years beginning after September 15, 2012, with early adoption permitted. Adoption of the provisions of ASU 2012-02 at the beginning of 2013 did not have an impact on our consolidated financial position, results of operations or cash flows.
72
Table of Contents
General
We are a leading, vertically integrated manufacturer and distributor of exterior residential building products in the United States and Canada. We produce a comprehensive offering of exterior building products, including vinyl windows, vinyl siding, vinyl railing and fencing, aluminum trim coil, aluminum and steel siding and related accessories, which we produce at our 11 manufacturing facilities. We also sell complementary products that are manufactured by third parties, such as roofing materials, cladding materials, insulation, exterior doors, equipment and tools and provide installation services. We distribute these products through our extensive dual-distribution network to over 50,000 professional exterior contractors, builders and dealers, whom we refer to as our “contractor customers.” This dual-distribution network consists of 124 company-operated supply centers, through which we sell directly to our contractor customers, and our direct sales channel, through which we sell to more than 275 independent distributors, dealers and national account customers. The products we sell are generally marketed under our brand names, such as Alside®, Revere®, Gentek®, UltraGuard® and Preservation®. Our product sales of vinyl windows, vinyl siding, metal products and third-party manufactured products comprised approximately 31%, 20%, 15% and 27%, respectively, of our net sales for the year ended December 29, 2012. For the year ended December 29, 2012, we had net sales of $1,142.5 million, Adjusted EBITDA of $96.4 million and a net loss of $38.4 million. For the nine months ended September 28, 2013, we had net sales of $873.5 million, Adjusted EBITDA of $70.4 million and a net loss of $32.0 million. For the definition of Adjusted EBITDA and a presentation of net income (loss) calculated in accordance with generally accepted accounting principles (“GAAP”), and reconciliation of Adjusted EBITDA to net income (loss), see “Prospectus Summary—Summary Historical Condensed Consolidated Financial Data” and “Prospectus Summary—Adjusted EBITDA.” Adjusted EBITDA is a non-GAAP financial measure and should not be considered as a substitute for other measures of liquidity or financial performance reported in accordance with GAAP.
Our company-operated supply centers provide “one-stop” shopping to our contractor customers by carrying the products, accessories and tools necessary to complete a project. In addition, our supply centers provide value-added services, including marketing support, installation support, technical support and warranty services that become a part of our contractor customers’ workflows, and these services form a critical component of the contractors’ offering to end consumers. Many of our supply centers also offer full-service product installation of our window, siding and third-party products through our ISS group. Our ISS group provides a turn-key solution for remodeling dealers and builders who benefit from purchasing bundled products and installation from a single source, allowing them to focus on generating new business. For the nine months ended September 28, 2013 and the year ended December 29, 2012, approximately 74% and 75%, respectively, of our net sales were generated through our network of supply centers.
We also distribute products through our direct sales channel, which consists of more than 275 independent distributors, dealers and national account customers. We sell to distributors and dealers both in markets where we have existing supply centers and in markets where we may not have a supply center presence, and we utilize our manufacturing and marketing capabilities to help these direct customers grow their businesses. Our distributor and dealer customers in this channel are carefully selected based on their ability to drive sales of our products, deliver high customer service levels and meet other performance factors. This sales channel also allows us to service larger regional and national account customers with a broader geographic scope, which drives additional volume. In addition, in many cases we are able to leverage our vertical integration in support of our distributor and dealer customers by selling and shipping our products directly to their contractor customers. For the nine months ended September 28, 2013 and the year ended December 29, 2012, we generated approximately 26% and 25%, respectively, of our net sales from this channel.
73
Table of Contents
We estimate that, for the year ended December 29, 2012, approximately 70% of our net sales were generated in the R&R market and approximately 30% of our net sales were generated in the residential new construction market. We believe that the strength of our products and distribution network has resulted in strong brand loyalty and longstanding relationships with our contractor customers and has enabled us to develop and maintain a leading position in the markets that we serve. In addition, we believe that our focus on the R&R market provides us with a more attractive market than residential new construction due to the relative stability in demand, superior competitive dynamics and higher profit margins available in R&R.
Our Competitive Strengths
We believe that we are well-positioned in our industry, and we expect to utilize our strengths to capture additional market share from our competitors. Our key competitive strengths include:
Leading Market Position
We are one of the largest exterior building products companies focused exclusively in the U.S. and Canadian markets. We believe, based on industry data and our estimates, that we hold leading market positions within the North American exterior residential building products market, including top five positions in the vinyl windows and vinyl siding segments, based on sales, and that our market position is stronger within the R&R market in the geographies we serve. We believe that we have one of the broadest manufacturing and distribution footprints in North America in our industry, which allows us to service larger regional and national accounts that many of our competitors either cannot cover or can only do so by relying on a series of multiple independent distributors, and provides us capabilities that we believe make us a “go-to” provider of exterior building products for our customers.
Differentiated Dual-Distribution Network
Our distribution strategy successfully combines a network of company-operated supply centers with a complementary network of independent distributors and dealers. We believe we are the only major vinyl window and siding manufacturer that primarily markets products to contractors through company-operated supply centers. This dual-distribution strategy, which we have operated since 1952, is part of our corporate legacy. We believe there are significant barriers that make it difficult for our competitors to replicate this strategy, namely the capital costs of building a network of company-operated supply centers and the complexity of maintaining existing relationships with independent distributors and dealers while simultaneously operating a supply center network.
| Ÿ | Company-Operated Supply Centers. We believe that our network of 124 U.S. and Canadian company-operated supply centers offers a superior distribution channel compared to the traditional network of third-party distributors and dealers used by our major competitors. Third-party distributors and dealers typically carry an assortment of brands and may not focus on any particular brand. Moreover, third-party distributors and dealers own the contractor relationships—acting as intermediaries between the contractors and the manufacturers. We, on the other hand, have built dedicated longstanding relationships directly with our contractor customers through our supply centers. In addition, we believe that distributing our products through our vertically integrated network of company-operated supply centers provides a compelling value proposition for our contractor customers through (1) comprehensive service offerings (including marketing and sales support, aftermarket service and private label and customized offerings), (2) integrated logistics between our manufacturing and distribution facilities (driving product availability and fulfillment) and (3) “one-stop” shopping. In addition, we believe that our supply centers facilitate innovation by allowing us to directly monitor developments in local customer preferences and to bring products to market faster. We also |
74
Table of Contents
| believe that our supply centers have played a critical role in helping us to establish our more than 430 person industry-leading sales force. By allowing our sales force to concentrate on and develop expertise in a single company’s product and service offerings, our supply center network also offers a compelling value proposition to top sales talent. |
| Ÿ | Direct Sales Channel. We believe that our strength in selling to independent distributors and dealers provides us with operational flexibility because it allows us to further penetrate markets and expand our geographic reach without requiring us to deploy the resources to establish a company-operated supply center. By offering different brands within a given market through our direct sales channel, we are able to augment our market position in areas that are also served by our company-operated supply centers. This reach also allows us to service larger customers with a broader geographic scope, many of whom cannot be serviced by local and regional competitors that lack geographic coverage. In addition, in many cases we are able to leverage our vertical integration to support our distributor and dealer customers by selling and shipping our products directly to their contractor customers, as evidenced by our approximately 1,000 ship-to locations. We believe that this enhances our value proposition to larger regional and national customers and differentiates us from our major competitors who in many cases must fulfill orders through a network of independent distributors. |
Entrenched Customer Relationships
We believe that we are a deeply integrated partner to our customers. Contractors typically work with a limited number of manufacturers and distributors in order to streamline their processes of selling residential exterior building products and installation services to the end customer. We believe we are a critical part of this sales process and are integrated with our customers’ work flow given the services we provide, including marketing support, sales training, fulfillment, lead generation and, for certain larger customers, private label marketing services. We are able to serve as a single point of contact to our customers for their essential marketing needs because of the depth of our value-added marketing and service offerings. We believe our customer integration has led to longstanding relationships, high “share of wallet” and strong customer retention. For example, more than 95% of our independent distributor and dealer customers that generated more than $50,000 of annual sales in 2010 or 2011 were also our customers in 2012. Additionally, we have high levels of retention of the larger customers in our supply centers. For our top 100 U.S. supply center customers, the average length of our relationship is nine years.
Comprehensive Product and Service Offering
We believe that our broad product offering is a key advantage relative to competitors who focus on a limited number of products. We manufacture a diverse mix of vinyl windows, vinyl siding, vinyl railing and fencing, aluminum trim coil, aluminum and steel siding and related accessories. Furthermore, we offer broad product lines, ranging from entry-level economy products to premium products, including many products that have earned the highest ENERGY STAR® rating. All of our windows for the R&R market are made to order and are custom manufactured to existing window openings. We are in the process of a significant enhancement to our window platform to be launched in 2014, which we believe will result in increased energy efficiency, enhanced aesthetics and additional features and benefits. We utilize our supply center distribution base to sell complementary products to our core window and siding product offerings, such as roofing and insulation products. We believe our contractor customers often install more than one product type and prefer to purchase multiple products from a single source, and we aim to offer a one-stop solution for these customers. In total, we sell more than 2,000 products, and we believe our longstanding commitment to product innovation will help us continue to drive the expansion of our product offering.
75
Table of Contents
We believe our brands are known for quality and durability in the residential building products industry and that these brands are a distinguishing factor for our customers. We sell our products under several brand names, including Alside®, Revere®, Gentek®, Preservation®, UltraGuard® and Alpine®. This portfolio allows us to offer various brands to contractors within a local market, which in turn allows local contractors to differentiate themselves to the end consumer.
We combine this strong product and brand portfolio with outstanding service offerings, which we believe differentiates us and helps us strengthen our customer relationships. Our contractor customers require significant support in order to effectively sell and install products. Whether through lead generation, marketing materials, product delivery or installation support, our service offerings allow our contractor customers to generate new business, differentiate themselves to end consumers and efficiently manage their installation resources. Our ISS offering, through which we provide full-service product installation services for our vinyl siding, vinyl window and third-party products, and our private label program are two examples of offerings that other manufacturers typically are unable to provide on their own.
Superior, Vertically Integrated Operating Model
Our operations, from manufacturing our own vinyl extrusions and in-sourcing our insulated glass units, to distributing our products through our network of 124 company-operated supply centers, provide us with a level of vertical integration that we believe differentiates us within the building products industry. We believe our vertically integrated platform offers us intimate knowledge of our customer base, enables us to meet their evolving product needs and facilitates superior service and quality control. In particular, we believe that our ability to service larger regional and national accounts through an integrated manufacturing, sales and delivery platform differentiates us from our competitors. Furthermore, we believe our vertically integrated operations provide us with a cost advantage over our non-vertically integrated competitors, given that we can retain the profit margins that would otherwise be earned by third-party suppliers or distributors.
Attractive Financial Model
We run a capital-efficient business, requiring relatively modest annual capital investment and resulting in strong returns on the tangible capital employed in our operations. In addition, our base of company-operated supply centers and manufacturing facilities provides a strong platform for growth, resulting in attractive incremental profit margins. We believe these dynamics, combined with a diverse customer base, a geographically diverse set of operations and a focus on the R&R market, result in sustainable earnings and attractive returns on capital. As evidence, based on an analysis of public filings we were able to maintain, on average, more attractive returns on capital and more stable margins during the 2007 through 2012 economic cycle than our peers, as a group.
We believe that we have multiple levers that will continue to drive our growth beyond the continued recovery in the residential new construction and R&R markets. We believe that the recent implementation of AMES, which focuses on the implementation of lean principles throughout our operations, coupled with our continued focus on operating efficiency and quality, provides us with the opportunity for further margin expansion. In addition, we believe that we have an ability to drive our sales growth over and above the growth of the market, by increasing our penetration at our existing customers, expanding our base of company-operated supply centers and introducing new products to the market.
Experienced Management Team
Beginning in the third quarter of 2011, we added a highly experienced executive management team with a track record of operational excellence to the extensive industry experience of our organization. Our Chief Executive Officer, Jerry Burris, spent over 20 years in various operating roles
76
Table of Contents
at General Electric Company, and most recently served as President of Precision Components at Barnes Group Inc., a manufacturer and distributor of aerospace and industrial components. Other members of our senior leadership team bring operating experience from American Standard Companies Inc., Barnes Group Inc., Danaher Corp., General Electric Company, Pernod Ricard SA, Rexnord Corp., Smith & Nephew plc and United Technologies Corp., among other firms. Through AMES, which was launched during 2012, we are leveraging the experiences of these executives to drive enhanced performance across both our manufacturing and distribution operations. The new additions to our management team complement a team of seasoned building materials industry and Associated Materials veterans who bring extensive domain knowledge and customer intimacy. We believe this combination of blue-chip company executives coupled with building materials industry veterans positions us to deliver on our strategic imperatives of driving profitable growth, enhancing our customers’ experience and optimizing the efficiency of our capital deployed.
Our Strategy
We are committed to enhancing our customers’ experience by providing high quality products and excellent service, while profitably growing our business. We believe that our longstanding customer relationships are among our most critical assets. Our objective is to grow these existing relationships and to build new relationships by partnering with our contractor customers. By providing customized sales solutions through a dedicated sales, service and fulfillment platform, we seek to enable our customers to continue to grow their market share. We believe this strategy is critical to our positioning in our market and will allow us to grow our market share over time. Our leadership team is committed to delivering sustainable growth while maintaining a focus on improving profitability by executing on predictable, repeatable processes. With these processes intact, we believe we have significant room to expand our geographic footprint, grow our market share and enhance operating margins as our end markets recover.
Capitalize on Residential Recovery and Secular Trends
We expect the growing residential recovery to drive increases in our revenue and profitability. In addition, we believe that the market for vinyl-related building products, specifically windows and siding, is poised for growth. We expect this growth will be driven by favorable long-term demand drivers, a cyclical recovery in demand in the R&R and new residential construction markets from historically low levels, a demand for energy efficient products and the ongoing conversion to vinyl as a material of choice.
| Ÿ | Favorable Long-Term Demand Drivers. We expect population growth, an aging housing stock and general economic growth to drive underlying demand for building products. Population growth and household formation are important drivers for both new home construction and R&R spending, requiring the construction of new homes and the alteration and expansion of existing homes. According to the American Housing Survey by the U.S. Census Bureau and the U.S. Department of Housing and Urban Development, more than 67% of the current U.S. housing stock was built before 1980 and the median estimated home age has increased from 23 years in 1985 to 37 years in 2011. In addition, expenditures for residential improvements and repairs grew at a 7.1% compound annual rate from 1995 through 2007, according to the U.S. Census Bureau. We believe the fundamentals listed above will drive long-term growth in our product categories and end markets. |
| Ÿ | Recovery in Our End Markets. We believe we are well positioned to benefit from a robust recovery in both new residential construction and R&R spending. Approximately 70% of our revenues in fiscal year 2012 were generated from the R&R market. We believe that many repair and remodel decisions have been deferred since the global financial crisis began, creating substantial pent-up demand. Based on our estimates and industry data, we believe that the average amount of time that passes before consumers replace their existing windows |
77
Table of Contents
| and siding has increased by over 40% versus the rate of replacement prior to the financial crisis. We also believe that R&R spending has historically lagged new home construction spending. We expect that a more prolonged recovery in R&R spending will be driven by increasing consumer confidence, falling unemployment rates and increasing home equity values. The Leading Indicator of Remodeling Activity provided by the Joint Center for Housing Studies at Harvard University expects 19.7% and 19.8% year-over-year increases in home improvement spending for the third and fourth quarters of 2013. Additionally, approximately 30% of our revenues in fiscal year 2012 were generated from new residential construction. We believe this category will grow rapidly over the next several years as housing starts improve to rates that are more consistent with historical levels. According to the U.S. Census Bureau, seasonally adjusted single- and multi-family housing starts in 2012 were 780,000 compared to a 50-year average of 1.5 million. |
| Ÿ | Energy Efficiency. We believe that there is strong and growing demand for energy efficient, “green” building products. Recent surveys demonstrate that consumers are willing to invest in energy efficient products that provide measurable savings over time. We expect to benefit from this increasing demand for energy efficient building products, as many of our products meet energy efficiency standards, including many of our window product lines that have earned the ENERGY STAR® rating. |
| Ÿ | Continued Penetration of Vinyl Products. We believe our focus on vinyl products will further drive our market share in the window and siding markets. Vinyl has greater durability, requires less maintenance and provides greater energy efficiency than many competing materials. In addition, we believe vinyl products have a price advantage over other material types. As a result, vinyl products have gained substantial share in the window and siding markets over the last decade and are expected to be a preferred material going forward. |
Drive Incremental Growth from Existing Stores
We believe that we can grow our business by expanding sales to our existing customers and attracting new customers with our high quality products and services. Our differentiated delivery model, outstanding service offering and high quality products provide the foundations for this growth. These elements in particular manifest themselves in our ability to differentially service larger regional and national customers versus our competitors. As many of these larger customers are regional and national homebuilders, these elements are an important driver of our ability to take advantage of the recovery in residential new construction. Our growth is further enhanced by our demonstrated ability to increase the number of products that we sell to each customer, for example by selling siding to customers who previously only purchased windows, and the continued rollout of our ISS offering, which enables our customers to expand their geographic presence without increasing their installer base. We believe our product and service offerings, coupled with both our AMES-led efforts to drive sales force and operating excellence and our investment in new sales representatives, will enable us to expand our customer base and increase our market share.
Expand Our Distribution Network
We believe that we have considerable room to expand our geographic coverage and intend to grow our network of company-operated supply centers through the creation and acquisition of new supply centers. We have added supply centers in six of the last nine years and have added two company-operated supply centers in the first nine months of 2013. We maintain disciplined selection criteria for new supply centers, which include target investment return thresholds. We typically target cash flows from operations to achieve a break-even rate within two years of opening a new “greenfield” or acquired supply center. We believe our ability to add company-operated supply centers while effectively maintaining our relationship with third-party distributors differentiates us from our
78
Table of Contents
competitors. We believe there is significant market capacity for additional supply centers: a company-commissioned study suggested that we have the opportunity to add more than 200 locations to our existing supply center network, which would more than double our current base of supply centers. In addition, in areas in which we believe an opportunity for expansion exists but where we do not intend to open new company-operated supply centers, we will selectively pursue additional independent distributor and dealer relationships to drive additional sales.
Innovate and Expand Our Product Portfolio
We intend to expand our product portfolio through product innovation as well as through an increase in the breadth of third-party manufactured products that we sell through our company-operated supply centers. We plan to capitalize on our vinyl window and siding manufacturing expertise by continuing to develop innovative and complementary new products that offer long-term performance, cost, aesthetic and other competitive advantages. We believe that our vertically integrated operating model and strong customer relationships provide us with valuable insights into the latest product attributes that appeal to customers. We are currently developing a new window platform designed not only to increase the energy efficiency of our product line but also to increase our range of window products that we offer. We believe that our re-designed dual-pane window offering, which we expect will meet anticipated ENERGY STAR® Version 6.0 standards in a cost effective manner, will be a key differentiator versus our competitors. In addition we expect manufacturing and system enhancements in this new window platform to help drive operating improvements and lower cost in our manufacturing facilities.
In addition to investing in new manufactured products, we will continue to selectively increase the range of third-party manufactured products that we sell through our company-operated supply centers. For example, in 2008, we began an effort to significantly expand our roofing product offering within our supply center network. Our roofing products were offered at 25 of our locations at the beginning of 2008 and are now available at 74 of our 124 company-operated supply centers. We believe there are numerous other opportunities to provide additional exterior building products through our distribution network.
Drive Profitable Growth and Expand Margins
Over the past two years, we have focused on establishing an efficient operating platform in order to facilitate margin expansion and profitable growth. Following the addition of several key members to our management team, we developed and began implementing AMES. We believe that AMES positions us to significantly increase the efficiency of both our manufacturing and distribution operations. Our leadership team is focused on implementing predictable and repeatable processes, with the goal of more efficiently providing a broad range of high quality products with shorter lead times. We believe that these initiatives, combined with a substantially fixed cost base, should allow us to expand our margins as our revenues increase.
Our Structure
Our operational structure is comprised of our corporate head office based in Cuyahoga Falls, Ohio from which we manage our operations. Our operations consist of 124 company-operated supply centers and 11 manufacturing plants.
79
Table of Contents
Our organizational structure is composed of the subsidiaries listed below. We and Holdings are holding companies with no material direct operations. Associated Materials, LLC is our main operating subsidiary and the direct parent of each of our other operating subsidiaries. As a result, we and Holdings are dependent on loans, dividends and other payments from Associated Materials, LLC to generate the funds necessary to meet our financial obligations. This offering will not result in any changes in our organizational structure.
| Subsidiaries |
| U.S. Subsidiaries |
| Associated Materials Incorporated* |
| Associated Materials, LLC |
| AMH New Finance, Inc.** |
| Associated Materials Finance, Inc. |
| Gentek Building Products, Inc. |
| Gentek Holdings, LLC |
| Canadian Subsidiaries |
| Associated Materials Canada Limited |
| Gentek Building Products Limited Partnership |
| Gentek Canada Holdings Limited |
| * | Associated Materials Incorporated is a holding company and has no material direct operations. |
| ** | AMH New Finance, Inc. is a co-issuer of the 9.125% notes and has no material direct operations. |
Products
Our core products are vinyl windows, vinyl siding, aluminum trim coil and aluminum and steel siding and accessories. For the nine months ended September 28, 2013 and the year ended December 29, 2012, vinyl windows and vinyl siding products together comprised approximately 50% and 51% of our net sales, respectively, while aluminum and steel products comprised approximately 15% for the nine months ended September 28, 2013 and the year ended December 29, 2012, respectively. We also sell complementary products that are manufactured by third parties, such as roofing materials, insulation, exterior doors, vinyl siding in a shake and scallop design and installation equipment and tools.
We manufacture and distribute vinyl windows in the premium and standard categories, primarily under the Alside®, Revere®, Gentek®, Alpine® and Preservation® brand names. Vinyl window performance and price vary across categories and are generally based on a number of differentiating factors, including method of construction and materials used. Premium and standard windows are primarily geared toward the repair and remodeling segment, while economy products are typically used in new construction applications. Our vinyl windows are available in a broad range of models, including fixed, double- and single-hung, horizontal sliding, casement and decorative bay, bow and garden, as well as patio doors. All of our windows for the repair and remodeling market are made to order and are custom-manufactured to existing window openings. Additional features include frames that do not require painting, tilt-in sashes for easy cleaning and high-energy efficiency glass packages. Most models offer multiple finish and glazing options and substantially all are accompanied by a limited lifetime warranty. Key offerings include Excalibur®, a fusion-welded window featuring a slim frame design; Performance Series™, a new construction product with superior strength and stability; and Sheffield® and UltraMaxx®, an extra-thick premium window complete with higher-end options. Preservation® is a high-end siding and window bundled program available to specific dealers on an exclusive basis. Most replacement window lines feature the Frameworks® colors palette with seven interior woodgrains (White, Soft Maple, Rich Maple, Light Oak, Dark Oak, Foxwood and Cherry) and seven special exterior finishes (Architectural Bronze, English Red, Desert Clay, Hudson Khaki, Forest Green, American Terra and Castle Gray) along with solid colors of White, Beige and Almond/Clay.
80
Table of Contents
We also manufacture and distribute vinyl siding and related accessories in the premium, standard and economy categories, primarily under the Alside®, Revere®, Gentek® and Preservation® brand names. Vinyl siding quality and price vary across categories and are generally based on rigidity, thickness, impact resistance, insulation benefits, color selection, ease of installation, as well as other factors. Premium and standard siding products are primarily geared towards the repair and remodeling segment, while economy products are typically used in new construction applications. Our vinyl siding is textured to simulate wood lap siding or shingles and is available in clapboard, Dutch lap and board-and-batten styles. Products are available in a wide palette of colors to satisfy individual aesthetic tastes. We also offer specialty siding products, such as shakes and scallops, beaded siding, insulated siding, extended length siding and variegated siding. Our product line is complemented by a broad array of color and style-matched accessories, including soffit, fascia and other components, which enable easy installation and provide numerous appearance options. All of our siding products are accompanied by limited 50-year to lifetime warranties. Key offerings include Charter Oak®, a premium product whose TriBeam® design system provides superior rigidity; Prodigy®, a premium product that includes an attached insulating underlayment with a surface texture of finely milled cedar lumber; and Odyssey®, an easy-to-install product designed for maximum visual appeal.
Our metal offerings include aluminum trim coil and flatstock, aluminum gutter coil, as well as aluminum and steel siding and accessories. These products are available in a broad assortment of colors, styles and textures and are color-matched to vinyl and other metal product lines with special features including multi-colored paint applications, which replicate the light and dark tones of the grain in natural wood. We offer steel siding in a full complement of profiles including 8”, vertical and Dutch lap. We manufacture aluminum siding and accessories in economy, standard and premium grades in a broad range of profiles to appeal to various geographic and contractor preferences. While aluminum siding sales are limited to niche markets, particularly Canada, aluminum accessories enjoy popularity in vinyl siding applications. All aluminum soffit colors match or complement our core vinyl siding colors, as well as those of several of our competitors.
We manufacture a broad range of painted and vinyl coated aluminum trim coil and flatstock for application in siding projects. Our innovative Color Clear Through® and ColorConnect® programs match core colors across our vinyl, aluminum and steel product lines, as well as those of other siding manufacturers. Trim coil and flatstock products are installed in most siding projects, whether vinyl, brick, wood, stucco or metal, and are used to seal and finish exterior corners, fenestration and other areas. These products are typically formed on site by professional installers to fit such surfaces. As a result, due to its superior pliability, aluminum remains the preferred material for these products and is rarely substituted by other materials. Trim coil and flatstock represent a majority of our metal product sales.
We generally market our products under our brand names, including Alside®, Revere®, Gentek®, Alpine® and Preservation®, and offer extensive product, sales and marketing support. A summary of our key window and siding product offerings is presented in the table below according to our product line classification:
| Product Line |
Window | Vinyl Siding/Soffit |
Steel Siding | Aluminum Siding/Soffit | ||||
| Premium |
8000 Series Preservation Regency Sequoia Select Sheffield Sovereign UltraMaxx Westbridge Platinum |
Alliance Soffit Beaded Premium Soffit Bennington Board and Batten Berkshire Beaded Centennial Beaded CenterLock Charter Oak |
Cedarwood Driftwood |
Aluminum HT Soffit Cedarwood Deluxe |
81
Table of Contents
| Product Line |
Window | Vinyl Siding/Soffit |
Steel Siding | Aluminum Siding/Soffit | ||||
| Charter Oak Soffit Cypress Creek EnFusion Fairweather Greenbriar Soffit Northern Forest Elite Oxford Premium Soffit Premium Beaded Soffit Preservation Prodigy Sequoia Select Sequoia Select Soffit Sovereign Select Sovereign Select Soffit SuperSpan Soffit Trilogy TrimEssentials TrimWorks Williamsport Beaded |
||||||||
| Standard |
Alpine 80 Series Berkshire Excalibur Fairfield 80 Sierra Signature Westbridge Elite |
Advantage III Advantage Plus Amherst Berkshire Classic Concord Coventry Fair Oaks Odyssey Plus Signature Supreme Somerville III |
Gallery Series Satinwood SuperGard SteelTek SteelSide |
|||||
| Economy |
Alpine 70 Series Amherst Blue Print Series Builder Series Centurion Concord Fairfield 70 Series Geneva Performance Series |
Aurora Conquest Driftwood |
Aluminum Econ Soffit Woodgrain 2000 Series | |||||
We also produce vinyl fencing and railing materials under the brand name UltraGuard®, consisting of both agricultural and residential vinyl fencing components. We sell this product group to a single customer who fabricates the components into finished products and in turn sells the finished products through independent dealers and select Alside® supply centers.
To complete our line of exterior residential building products, we also distribute building products manufactured by other companies. The third-party manufactured products that we distribute complement our exterior building product offerings and include such products as roofing materials, insulation, housewrap, exterior doors, vinyl and polypropylene siding in shake and scallop designs, shutters and accents, and installation equipment and tools. Third-party manufactured products comprised approximately 27% of our net sales for the nine months ended September 28, 2013 and the year ended December 29, 2012.
82
Table of Contents
We earn higher gross profit margins on the products that we manufacture and sell than on third-party manufactured products that we sell through our supply centers. Based on our historical results, we expect that on average our gross profit margins on products that we manufacture will be approximately 3 to 4 percentage points, as a percent of revenue, higher than the gross profit margins we earn on third party products that we distribute.
Marketing and Distribution
We market exterior residential building products to over 50,000 professional exterior contractors (whom we refer to as our contractor customers) engaged in home remodeling and new home construction. Primary distribution consists of our 124 company-operated supply centers, through which we sell directly to our contractor customers, and our direct sales channel, through which we sell to more than 275 independent distributors, dealers and national account customers. Traditionally, most windows and siding are sold to the home remodeling marketplace through independent distributors. We believe we are the only major vinyl window and siding manufacturer that primarily markets products to contractors through company-operated supply centers. For the nine months ended September 28, 2013 and the year ended December 29, 2012, approximately 74% and 75%, respectively, of our net sales were generated through our company-operated supply centers.
Our company-operated supply centers provide “one-stop” shopping to our contractor customers by carrying the products, accessories and tools necessary to complete a project. In addition, our supply centers provide value-added services, including marketing support, installation support, technical support and warranty services that become a part of our contractor customers’ workflows, and these services form a critical component of the contractors’ offering to end consumers. Many of our supply centers also offer full-service product installation of our window, siding and third-party products through our ISS group. Our ISS group provides a turn-key solution for remodeling dealers and builders who benefit from purchasing bundled products and installation from a single source, allowing them to focus on generating new business.
Our contractor customers look to their local supply center to provide a broad range of specialty product offerings in order to maximize their ability to attract remodeling and home building customers. Many have established longstanding relationships with their local supply center based on individualized service and credit terms, quality products, timely delivery, breadth of product offerings, strong sales and promotional programs and competitive prices. We support our contractor customer base with marketing and promotional programs that include a wide range of product samples, sales literature, presentation materials, visualization software, and other sales and promotional materials. Professional contractors use these materials to sell remodeling construction services to prospective consumers. The consumer generally relies on the professional contractor to specify the brand of window or siding to be purchased, subject to the consumer’s price, color and quality requirements. Our daily contact with our contractor customers also enables us to closely monitor activity in each of the remodeling and new construction markets in which we compete. This direct presence in the marketplace permits us to obtain current local market information, which helps us recognize trends in the marketplace earlier and adapt our product offerings on a location-by-location basis.
We believe that our strategic approach to provide a comprehensive product offering is a key competitive advantage relative to competitors who focus on a limited number of products. We also believe that our supply centers provide “one-stop shopping” to meet the specialized needs of our contractor customers by distributing more than 2,000 building and remodeling products, including a broad range of company-manufactured vinyl windows, vinyl siding, aluminum trim coil, aluminum and steel siding and accessories and vinyl fencing and railing, as well as products manufactured by third parties. We believe that our supply centers have strong appeal to contractor customers and that the ability to provide a broad range of products is a key competitive advantage because it allows our
83
Table of Contents
contractor customers, who often install more than one product type, to acquire multiple products from a single source. In addition, we have historically achieved economies of scale in sales and marketing by deploying integrated, multiple product programs on a national, regional and local level. Many of our supply centers also offer full-service product installation of our window, siding and third-party products through our ISS group. Our ISS group provides a turn-key solution for remodeling dealers and builders who benefit from purchasing bundled products and installation from one resource.
We also sell the products we manufacture directly to independent distributors, dealers and national account customers in the U.S., many of which operate in multiple locations. Independent distributors comprise the industry’s primary market channel for the types of products that we manufacture and, as such, remain a key focus of our marketing activities. With our multi-brand offering, we can often provide these customers with distinct brands and differentiated product, sales and marketing support. Our distribution partners are carefully selected based on their ability to drive sales of our products, deliver high customer service levels and meet other performance factors. We believe that our strength in independent distribution provides us with a high level of operational flexibility because it allows us to penetrate key markets and expand our geographic reach without deploying the necessary capital to establish a company-operated supply center. This reach also allows us to service larger customers with a broader geographic scope, which we believe results in additional sales. For the nine months ended September 28, 2013, and the year ended December 29, 2012 sales to independent distributors and dealers accounted for approximately 26% and 25%, respectively, of our net sales. Despite their aggregate lower percentage of total sales, our largest individual customers are among our direct dealers and independent distributors. In 2012, 2011 and 2010, sales to Window World, Inc. and its licensees represented approximately 13%, 13% and 14%, respectively, of net sales.
Manufacturing
We produce our core products at our 11 manufacturing facilities. We fabricate vinyl windows at our facilities in Cuyahoga Falls, Ohio; Bothell, Washington; Cedar Rapids, Iowa; Kinston, North Carolina; Yuma, Arizona and London, Ontario. We operate vinyl extrusion facilities in West Salem, Ohio; Ennis, Texas and Burlington, Ontario. We also have two metal manufacturing facilities located in Woodbridge, New Jersey and Pointe Claire, Quebec.
Our window fabrication plants in Cuyahoga Falls, Ohio; Kinston, North Carolina; Cedar Rapids, Iowa and London, Ontario each use vinyl extrusions manufactured by the West Salem, Ohio extrusion facility for a portion of their production requirements and utilize high-speed welding and cleaning equipment for their welded window products. By internally producing a large portion of our vinyl extrusions, we believe we achieve higher product quality compared to only purchasing these materials from third-party suppliers. Our Bothell, Washington and Yuma, Arizona facilities also have short-term contracts to purchase a portion of their vinyl extrusions from a third-party supplier, which we typically renew on an annual basis.
Our window plants, which have the capacity to operate on a three-shift basis, generally operate on a two-shift basis. Our vinyl extrusion plants generally operate on a three-shift basis to optimize equipment productivity and utilize additional equipment to increase capacity to meet higher seasonal needs.
We estimate that, in 2012, we spent approximately $60 million on fixed costs in our plants (included in our costs of goods sold), relating to costs of operating a plant regardless of the volumes that we produce (including, but not limited to, plant management personnel and support expense, depreciation of plant fixed assets, rent expense and taxes).
84
Table of Contents
Raw Materials
The principal raw materials used by us are vinyl resin, aluminum, steel, resin stabilizers and pigments, glass, window hardware and packaging materials, all of which are available from a number of suppliers and have historically been subject to price changes. Raw material pricing on certain of our key commodities has fluctuated significantly over the past several years. In response, we have announced price increases over the past several years on certain of our product offerings to offset inflation in raw material pricing and continually monitor market conditions for price changes as warranted. We have a contract with our resin supplier through December 2015 to supply substantially all of our vinyl resin requirements. We believe that other suppliers could meet our requirements for vinyl resin in the event of supply disruptions or upon the expiration of the contract with our current resin supplier.
Competition
The market for our products and services is highly competitive. We compete with numerous small and large manufacturers of exterior residential building products, as well as numerous large and small distributors of building products in our capacity as a distributor of these products. We focus primarily on the market for professional contractor customers. We focus primarily on the vinyl market within windows and siding. We also face competition from alternative materials: wood and aluminum in the window market and wood, masonry and fiber cement in the siding market. We believe, based on industry data and our estimates, that we hold leading market positions within the North American exterior residential building products market, including top five positions in the vinyl windows and vinyl siding segments, based on sales, and that our market position is stronger within the R&R market in the geographies we serve. We believe that we have one of the broadest manufacturing and distribution footprints in North America in our industry, which allows us to service larger regional and national accounts that many of our competitors either cannot cover or can only do so by relying on a series of multiple independent distributors, and provides us capabilities that we believe make us a “go-to” provider of exterior building products for our customers.
Exterior building products manufacturers and distributors generally compete on price, product performance and reliability, service levels and sales and marketing support. Some of our competitors are larger in size and have greater financial resources than we do. While we believe we have been able to compete successfully in our industry to-date, there can be no assurance that we will be able to do so in the future.
Seasonality
Because most of our building products are intended for exterior use, sales tend to be lower during periods of inclement weather. Weather conditions in the first quarter of each calendar year usually result in that quarter producing significantly less net sales and net cash flows from operations than in any other period of the year. Consequently, we have historically had losses or small profits in the first quarter and reduced profits from operations in the fourth quarter of each calendar year. To meet seasonal cash flow needs during the periods of reduced sales and net cash flows from operations, we have typically utilized our revolving credit facilities and repay such borrowings in periods of higher cash flow. We typically generate the majority of our cash flow in the third and fourth quarters.
Backlog
Our backlog of orders is not considered material to, or a significant factor in, evaluating and understanding our business. Our backlog is subject to fluctuation due to various factors, including the size and timing of orders and seasonality for our products, and is not necessarily indicative of the level of future sales. We did not have a significant manufacturing backlog at September 28, 2013.
85
Table of Contents
Trademarks and Other Intangible Assets
We rely on trademark and other intellectual property law and protective measures to protect our proprietary rights. We have registered and common law rights in trade names and trademarks covering the principal brand names and product lines under which our products are marketed. Although we employ a variety of intellectual property in our business, we believe that none of that intellectual property is individually critical to our current operations.
Government Regulation and Environmental Matters
Our operations are subject to various U.S. and Canadian environmental statutes and regulations, including those relating to materials used in our products and operations; discharge of pollutants into the air, water and soil; treatment, transport, storage and disposal of solid and hazardous wastes; and remediation of soil and groundwater contamination. Such laws and regulations may also impact the cost and availability of materials used in manufacturing our products. Our facilities are subject to inspections by governmental regulators, which occur from time to time. While our management does not currently expect the costs of compliance with environmental requirements to increase materially, future expenditures may increase as compliance standards and technology change and as we expand our geographic coverage and grow our network of company-operated supply centers.
For information regarding pending proceedings relating to environmental matters, see “Legal Proceedings.”
Properties
Our operations include both owned and leased facilities as described below:
| Location |
Principal Use | Square Feet | ||||
| Cuyahoga Falls, Ohio |
Corporate Headquarters | 70,000 | ||||
| Cuyahoga Falls, Ohio |
Vinyl Windows | 577,000 | ||||
| Bothell, Washington |
Vinyl Windows | 159,000 | (1) | |||
| Yuma, Arizona |
Vinyl Windows | 223,000 | (1)(4) | |||
| Cedar Rapids, Iowa |
Vinyl Windows | 259,000 | (1) | |||
| Kinston, North Carolina |
Vinyl Windows | 319,000 | (1) | |||
| London, Ontario |
Vinyl Windows | 60,000 | ||||
| Burlington, Ontario |
Vinyl Siding Products | 387,000 | (2) | |||
| Ennis, Texas |
Vinyl Siding Products | 538,000 | (3) | |||
| West Salem, Ohio |
Vinyl Window Extrusions, Vinyl Fencing and Railing | 173,000 | ||||
| Pointe Claire, Quebec |
Metal Products | 278,000 | ||||
| Woodbridge, New Jersey |
Metal Products | 318,000 | (1) | |||
| Ashtabula, Ohio |
Distribution Center | 297,000 | (1) | |||
| (1) | Leased facilities. |
| (2) | We lease a portion of our warehouse space in this facility. |
| (3) | Includes a 237,000 square foot warehouse that was built during 2005, which, along with the land under the warehouse, is leased. |
| (4) | The land for this facility is owned by us, but we lease the use of the building. |
Management believes that our facilities are generally in good operating condition and are adequate to meet anticipated requirements in the near future.
We also operate 124 supply centers in major metropolitan areas throughout the U.S. and Canada. Except for one owned location in Akron, Ohio, we lease our supply centers for terms generally ranging from five to seven years with renewal options. The supply centers range in size from 6,000 square feet to 74,000 square feet depending on sales volume and the breadth and type of products offered at each location.
86
Table of Contents
The leases for our window plants expire in 2015 for the Bothell, Yuma and Kinston locations and in 2020 for the Cedar Rapids location. The leases for the Yuma and Kinston locations are renewable at our option for two additional five-year periods and one additional five-year period, respectively.
The lease for the warehouse at our Ennis location expires in 2020. In 2009, we transitioned the majority of the distribution of our U.S. vinyl siding products to a center located in Ashtabula, Ohio and committed to a plan to discontinue use of our warehouse facility adjacent to our Ennis, Texas vinyl manufacturing facility. The lease for the warehouse at our Ashtabula location expires in December 2013. The leases for our Burlington warehouse and our Woodbridge location expire in March 2014 and December 2014, respectively.
Employees
Our employment needs vary seasonally with sales and production levels. As of September 28, 2013, we had approximately 2,900 full-time employees, including approximately 1,600 hourly workers. We had approximately 220 employees in the U.S. and approximately 330 employees in Canada located at unionized facilities covered by collective bargaining agreements. We consider our labor relations to be good.
We utilize leased employees to supplement our own workforce at our manufacturing facilities. As of September 28, 2013, the aggregate number of leased employees in our manufacturing facilities on a full-time equivalency basis is approximately 1,200 workers.
Legal Proceedings
We are involved from time to time in litigation arising in the ordinary course of business, none of which, after giving effect to existing insurance coverage, is expected to have a material adverse effect on our financial position, results of operations or liquidity. From time to time, we are also involved in proceedings and potential proceedings relating to environmental and product liability matters.
Environmental Claims
The Woodbridge, New Jersey facility is currently the subject of an investigation and/or remediation before the New Jersey Department of Environmental Protection (“NJDEP”) under ISRA Case No. E20030110 for our indirect wholly owned subsidiary, Gentek Building Products, Inc. (“Gentek”). The facility is currently leased by Gentek. Previous operations at the facility resulted in soil and groundwater contamination in certain areas of the property. In 1999, the property owner and Gentek signed a remediation agreement with NJDEP, pursuant to which the property owner and Gentek agreed to continue an investigation/remediation that had been commenced pursuant to a Memorandum of Agreement with NJDEP. Under the remediation agreement, NJDEP required posting of a remediation funding source of approximately $100,000 that was provided by Gentek under a self-guarantee as of December 31, 2011. In March 2012, the self-guarantee was replaced by a $228,000 standby letter of credit provided to the NJDEP. In May 2013, the amount of the standby letter of credit was increased to $339,500. Although investigations at this facility are ongoing and it appears probable that a liability will be incurred, we cannot currently estimate the amount of liability that may be associated with this facility as the delineation process has not been completed. We believe this matter will not have a material adverse effect on our financial position, results of operations or liquidity.
Product Liability Claims
On September 20, 2010, Associated Materials and its subsidiary, Gentek Buildings Products, Inc. (“Gentek”), were named as defendants in an action filed in the United States District Court for the Northern District of Ohio, captioned Donald Eliason, et al. v. Gentek Building Products, Inc., et al (the
87
Table of Contents
“Eliason complaint”). The complaint was filed by a number of individual plaintiffs on behalf of themselves and a putative nationwide class of owners of steel and aluminum siding products manufactured by Associated Materials and Gentek or their predecessors. The plaintiffs assert a breach of express and implied warranty, along with related causes of action, claiming that an unspecified defect in the siding causes paint to peel off the metal and that Associated Materials and Gentek have failed adequately to honor their warranty obligations to repair, replace or refinish the defective siding. Plaintiffs seek unspecified actual and punitive damages, restitution of monies paid to the defendants and an injunction against the claimed unlawful practices, together with attorneys’ fees, costs and interest. Since such time that the Eliason complaint was filed, seven additional putative class actions have been filed. On September 6, 2012, the Court issued an order granting defendants’ request for consolidation of all cases under a single caption, proceeding on a single track. The Court also ordered plaintiffs to file their single consolidated amended complaint by September 19, 2012, which plaintiffs did.
On February 13, 2013, we entered into a Settlement Agreement and Release of Claims (the “Settlement”) with the named plaintiffs that was preliminarily approved by the Court on March 5, 2013. On August 1, 2013 following a fairness hearing the Court issued a final judgment and order approving the Settlement (“Final Judgment and Order”). The Settlement became effective on September 2, 2013 when the time period for appealing the Final Judgment and Order ended.
The Settlement provides for the certification of a class for settlement purposes only of commercial and residential property owners who purchased steel siding manufactured and warranted by us during the period January 1, 1991 to March 15, 2013 (the date on which notice of the proposed Settlement was first sent to settlement class members) and whose siding allegedly experienced “Steel Peel,” which is characterized for the purposes of settlement by the separation of any layer of the finish on the steel siding from the steel siding itself. Subject to the terms and conditions of the Settlement, we have agreed that (1) the first time an eligible settlement class member submits a valid Steel Peel warranty claim for siding, we will, at our option, repair or replace the siding or, at such class member’s option, make a cash settlement payment to such class member equal to the cost to us of the repair or replacement option selected by us; (2) the second time such class member submits a valid Steel Peel warranty claim for the same siding, the same options will be available; and (3) the third time such a claim is submitted, such class member may elect to have us either refinish or replace the siding or may elect to receive a one-time $8,000 payment. If the $8,000 payment option is chosen, we will have no further obligation to such class member in connection with the warranty.
Under the Settlement, we have agreed to pay the sum of $2.5 million to compensate class counsel for attorneys’ fees and litigation expenses incurred and to be incurred in connection with the lawsuit. We also paid $0.6 million associated with executing the notice provisions of the Settlement. We recognized settlement costs related to the attorneys’ fees and notice costs as of December 29, 2012. We did not recognize additional settlement costs during the nine months ended September 28, 2013. We expect to incur additional warranty costs associated with the Settlement, however, we do not believe the incremental costs, which currently cannot be estimated for recognition purposes, will be material.
The Settlement does not constitute an admission of liability, culpability, negligence or wrongdoing on our part, and we believe we have valid defenses to the claims asserted. Upon final approval by the court, the Settlement will release all claims that were or could have been asserted against us in the lawsuit or that relate to any aspect of the subject matter of the lawsuit.
Other environmental claims and product liability claims are administered by us in the ordinary course of business, and we maintain pollution and remediation and product liability insurance covering certain types of claims. Although it is difficult to estimate our potential exposure to these matters, we believe that the resolution of these matters will not have a material adverse effect on our financial position, results of operations or liquidity.
88
Table of Contents
Executive Officers and Directors
The following table sets forth information about our directors and executive officers as of November 15, 2013:
| Name |
Age | Position | ||||
| Jerry W. Burris |
50 | President, Chief Executive Officer and Director | ||||
| Paul Morrisroe |
50 | Senior Vice President and Chief Financial Officer | ||||
| Robert C. Gaydos |
50 | Senior Vice President, Operations | ||||
| James T. Kenyon |
55 | Senior Vice President and Chief Human Resources Officer | ||||
| Kenneth James |
62 | General Counsel and Secretary | ||||
| David S. Nagle |
49 | Senior Vice President and Chief Operations Officer, AMI Distribution and Services | ||||
| Brad S. Beard |
47 | Senior Vice President and Chief Commercial Officer, AMI Distribution and Services | ||||
| David L. King |
55 | Senior Vice President and Chief Commercial Officer, Direct Sales | ||||
| Erik D. Ragatz |
40 | Director, Chairman of the Board of Directors | ||||
| Lawrence M. Blackburn |
58 | Director | ||||
| Charles A. Carroll |
64 | Director | ||||
| Dana R. Snyder |
66 | Director | ||||
| Robert B. Henske |
52 | Director | ||||
| Adam B. Durrett |
33 | Director | ||||
Set forth below is a brief description of the business experience of the directors and executive officers. All of our officers serve at the discretion of our board of directors.
Jerry W. Burris, Age 50. Mr. Burris has been our President and Chief Executive Officer since September 12, 2011. Before joining us, Mr. Burris served as President of Precision Components at Barnes Group Inc. from October 2008 to May 2011 and President of Barnes Industrial from July 2006 to September 2008. Previously, Mr. Burris served in various management roles at General Electric Company, including as President and Chief Executive Officer of Advanced Materials Quartz & Ceramics in 2006 and General Manager of Global Services for GE Healthcare from 2003 to 2006. Since 2007, Mr. Burris has also served on the board of directors of Pentair, Inc., a global diversified manufacturing company. Mr. Burris’ over 20 years of experience in management and executive positions at manufacturing and logistical services companies provides the board of directors with valuable insight regarding strategic decisions and our overall direction. Mr. Burris’ detailed knowledge of our operations, finances, strategies and industry qualify him to serve as our President and Chief Executive Officer and as a member of the board of directors.
Paul Morrisroe, Age 50. Mr. Morrisroe has been our Senior Vice President, Chief Financial Officer and Secretary since February 27, 2012. Before joining us, Mr. Morrisroe served in various management positions within Barnes Group Inc., including as Vice President of Finance, Precision Components from April 2011 to February 2012, Vice President, Internal Audit from February 2009 to March 2011, Barnes Industrial Group Controller from 2005 to 2008, Barnes Aerospace Group Controller from 2000 to 2004 and Director of Accounting and Planning from 1997 to 2000. Mr. Morrisroe held various roles with United Technologies Corporation from 1991 to 1997 and served as an auditor at Arthur Andersen LLP from 1986 to 1991.
89
Table of Contents
Robert C. Gaydos, Age 50. Mr. Gaydos has been our Senior Vice President, Operations since August 1, 2011. Before joining us, Mr. Gaydos served as Senior Vice President, Global Operations—Orthopaedics Division and CT/Biologics Division from August 2008 to July 2011 and Vice President, Global Operations—Reconstructive Division from September 2004 to August 2008 of Smith & Nephew, Inc., a global medical technology business. Mr. Gaydos’ previous experience included roles at American Standard Companies Inc., Ingersoll-Rand, Inc., Nissan Forklift Corporation and Lincoln Electric Company.
James T. Kenyon, Age 55. Mr. Kenyon has been our Senior Vice President and Chief Human Resources Officer since June 4, 2012. Before joining us, Mr. Kenyon served as the Vice President, Human Resources at Rexnord Corporation’s Water Management Platform from 2010 through 2012. Mr. Kenyon also served as Vice President Human Resources for OM Group from 2008 to 2009. Mr. Kenyon held various roles with Danaher Corporation from 1996 to 2007 including Vice-President Human Resources for its Hand Tool Platform.
Kenneth James, Age 62. Mr. James has been our General Counsel since May 15, 2013. Before joining us, Mr. James served as Senior Counsel and Deputy General Counsel at Pernod Ricard USA, LLC from 2006 through 2012. Mr. James served as a principal of The James Group from 2004 to 2006. Mr. James also served as Vice President and Assistant General Counsel for Diageo North, Inc. from 2000 to 2003. Mr. James served as Counsel with General Electric Company, Lighting Business Group from 1990 to 2000.
David S. Nagle, Age 49. Mr. Nagle was named our Senior Vice President and Chief Operations Officer, AMI Distribution and Services on November 1, 2013 having previously served as our President, AMI Distribution since February 20, 2012. Before joining us, Mr. Nagle was Corporate Vice President, Business Performance at J.D. Irving Limited of the Irving Group of Companies from January 2010 through December 2011. Mr. Nagle held several positions within Barnes Group Inc. from 2004 to 2010 including President, Barnes Distribution North America from 2007 to 2010, Vice President/General Manager, Associated Spring Raymond from 2006 to 2007 and Vice President, Operations, Barnes Distribution from 2004 to 2006. Prior to working for Barnes Group Inc., Mr. Nagle held various positions within General Electric Company from 1985 to 2004.
Brad S. Beard, Age 47. Mr. Beard was named Senior Vice President and Chief Commercial Officer, AMI Distribution and Services on November 1, 2013 having previously served as our Senior Vice President, New Business Development and National Account Sales and Services since February 20, 2012 and our Vice President of AMI Distribution since December 2010. Mr. Beard joined our company in 2002 and has held various positions within the distribution business, most recently as Regional Vice President.
David L. King, Age 55. Mr. King was named Senior Vice President and Chief Commercial Officer, Direct Sales on November 1, 2013 having served as our Senior Vice President of Direct Sales since February 15, 2013. Mr. King has been with our company for 16 years, previously serving as our Senior Vice President, AMI Sales since 2008. Prior to 2008, Mr. King served as our Vice President, National Credit manager.
Erik D. Ragatz, Age 40. Mr. Ragatz has been a director and the Chairman of the board of directors since October 2010. Mr. Ragatz is a Managing Director at Hellman & Friedman LLC. Before joining Hellman & Friedman LLC in 2001, Mr. Ragatz was a vice-president with Pacific Equity Partners in Sydney, Australia and an associate with Bain Capital in Boston, Massachusetts. Mr. Ragatz also worked as a management consultant for Bain & Company in San Francisco, California. Mr. Ragatz previously served as Chairman of the board of directors of Goodman Global Group, Inc. Mr. Ragatz was a member of the boards of directors of Texas Genco, LLC, Sheridan Holdings, Inc. and LPL Investment Holdings, Inc. As a member of the board of directors, Mr. Ragatz contributes his financial
90
Table of Contents
and capital markets expertise and draws on his years of experience with Hellman & Friedman LLC. Mr. Ragatz also brings his insight into the proper functioning and role of corporate boards of directors, gained through his years of service on the boards of directors of Hellman & Friedman LLC’s portfolio companies.
Lawrence M Blackburn. Mr. Blackburn was appointed to our board of directors in September 2013. Mr. Blackburn has served as Executive Vice President and Chief Financial Officer of Goodman Global, Inc. since September 2001. Before joining Goodman Global, Inc., Mr. Blackburn served as Vice President and Chief Financial Officer of Amana Appliances from February 2000 to July 2001, when substantially all of the assets of Amana Appliances were acquired by Maytag Corporation. From April 1983 to August 1999, Mr. Blackburn was with Newell Rubbermaid, Inc. and previously Rubbermaid, Inc., where he had most recently been President and General Manager of its wholly owned subsidiary, Little Tikes Commercial Play Systems, Inc. Mr. Blackburn was previously a member of the board of directors of Goodman Global Group, Inc. As a member of the board, Mr. Blackburn contributes significant industry-specific experience and financial expertise based on his years of senior executive experience and his service on other company boards.
Charles A. Carroll, Age 64. Mr. Carroll has been a director since October 2010. Mr. Carroll served as President and Chief Executive Officer of Goodman Global, Inc. from September 2001 to April 2008. Before joining Goodman Global, Inc., Mr. Carroll served as President and Chief Executive Officer of Amana Appliances from January 2000 to July 2001, when substantially all of the assets of Amana Appliances were acquired by Maytag Corporation. From 1971 to March 1999, Mr. Carroll was employed by Rubbermaid, Inc. where, from 1993, he held the position of President and Chief Operating Officer and was a member of the board of directors. Mr. Carroll was previously a member of the board of directors of Goodman Global Group, Inc. Mr. Carroll contributes his knowledge of the building products industry, as well as substantial experience developing corporate strategy and assessing emerging industry trends and business operations, which make him well-qualified to serve as a member of the board of directors.
Dana R. Snyder, Age 66. Mr. Snyder has been a director since November 2010. From December 2004 to October 2010, Mr. Snyder served as a director of AMH Holdings II, Inc. Mr. Snyder also served as our Interim Chief Executive Officer from June 2011 through September 2011 and our Interim President and Chief Executive Officer from July 2006 through September 2006. Previously, Mr. Snyder was an executive with Ply Gem Industries, Inc. and The Stolle Corporation and served on the board of directors of Werner Ladder from 2004 to 2007. Mr. Snyder’s valuable experience in general management, manufacturing operations, sales and marketing, as well as cost reduction and acquisitions, adds value and extensive knowledge regarding our industry and evaluation of certain strategic alternatives. In addition, he has experience evaluating the financial and operational performance of companies within the building products industry. Mr. Snyder’s service as our Interim President and Chief Executive Officer and Interim Chief Executive Officer gave him an understanding of the financial and business issues relevant to us and make him well-qualified to serve as a member of the board of directors.
Robert B. Henske, Age 52. Mr. Henske has been a director since October 2010. Mr. Henske has served as a Managing Director at Hellman & Friedman LLC since July 2007. From May 2005 until July 2007, he served as Senior Vice President and General Manager of the Consumer Tax Group of Intuit Inc. He was Intuit’s Chief Financial Officer from January 2003 to September 2005. Before joining Intuit, he served as Senior Vice President and Chief Financial Officer of Synopsys, Inc. from May 2000 until January 2003. From January 1997 to May 2000, Mr. Henske was a Partner at Oak Hill Capital Management, a Robert M. Bass Group private equity investment firm. Mr. Henske is Chairman of the boards of directors of Ellucian and OpenLink Financial and also serves on the board of directors of VeriFone Systems, Inc. Mr. Henske was previously a member of the boards of directors of Activant Solutions, Inc., IRIS Software Group Limited, SSP Holdings plc., Goodman Global Group, Inc.,
91
Table of Contents
Williams Scotsman, Inc., Grove Worldwide L.L.C., Reliant Building Products, Inc. and American Savings Bank. As a member of the board of directors, Mr. Henske contributes his financial and capital markets expertise and draw on his years of experience as a private equity investor and corporate executive. Mr. Henske also brings his insight into the proper functioning and role of corporate boards of directors, gained through his years of service on various boards of directors.
Adam B. Durrett, Age 33. Mr. Durrett has been a director since October 2010. Mr. Durrett is a Director at Hellman & Friedman LLC. Before joining Hellman & Friedman LLC in 2005, Mr. Durrett worked in the Media and Telecommunications Mergers and Acquisitions Department of Morgan Stanley & Co. in New York from 2003 to 2005. In addition, Mr. Durrett was a member of the Grosvenor Capital Management LP Advisory Board during 2011. As a member of the board of directors, Mr. Durrett contributes his financial expertise and draws on his years of experience with Hellman & Friedman LLC and in other financial positions.
Board of Directors
Our business and affairs are managed under the direction of our board of directors. Our board of directors currently consists of Messrs. Burris, Ragatz, Blackburn, Carroll, Snyder, Henske and Durrett. Following the completion of this offering, we expect our Board of Directors to initially consist of directors, of whom will be independent. Our directors were elected by the H&F Investors pursuant to the Stockholders Agreement. For a discussion regarding the Stockholders Agreement, please refer to “Certain Relationships and Related Party Transactions—Stockholders Agreement.”
In accordance with our amended and restated certificate of incorporation which will be in effect upon the closing of this offering, our board of directors will be divided into three classes with staggered three-year terms. At each annual meeting of stockholders after the initial classification, the successors to the directors whose terms will then expire will be elected to serve from the time of election and qualification until the third annual meeting following their election. Our directors will be divided among the three classes as follows:
| Ÿ | Our class I directors will be and and their term will expire at the annual meeting of stockholders to be held in 2014. |
| Ÿ | Our class II directors will be and and their term will expire at the annual meeting of stockholders to be held in 2015. |
| Ÿ | Our class III directors will be and and their term will expire at the annual meeting of stockholders to be held in 2016. |
Any additional directorships resulting from an increase in the number of directors will be distributed among the three classes so that, as nearly as possible, each class will consist of one-third of the directors. This classification of our board of directors may have the effect of delaying or preventing a change of our management or a change in control.
Background and Experience of Directors
When considering whether directors and nominees have the experience, qualifications, attributes or skills, taken as a whole, to enable our board of directors to satisfy its oversight responsibilities effectively in light of our business and structure, the board of directors focused primarily on each person’s background and experience as reflected in the information discussed in each of the directors’ individual biographies set forth above. We believe that our directors provide an appropriate mix of experience and skills relevant to the size and nature of our business. Once appointed, directors serve until they resign or are terminated by the stockholders.
92
Table of Contents
Role of Board of Directors in Risk Oversight
The board of directors has extensive involvement in the oversight of risk management related to us and our business and accomplishes this oversight through the regular reporting by the Audit Committee. The Audit Committee represents the board of directors by periodically reviewing our accounting, reporting and financial practices, including the integrity of our financial statements, the surveillance of administrative and financial controls and our compliance with legal and regulatory requirements. Through its regular meetings with management, including the finance, legal, and internal audit functions, the Audit Committee reviews and discusses all significant areas of our business and summarizes for the board of directors all areas of risk and the appropriate mitigating factors. In addition, our board of directors receives periodic detailed operating performance reviews from management.
Controlled Company Exception
After the completion of this offering, the H&F Investors will continue to beneficially own more than 50% of our common stock and voting power. As a result, (x) under certain provisions of our amended and restated bylaws which will be in effect upon the closing of this offering, the H&F Investors will be entitled to nominate at least a majority of the total number of directors comprising our board of directors (see “Certain Relationships and Related Party Transactions—Stockholders Agreement”) and (y) we will be a “controlled company” as that term is set forth in Section 303A of the NYSE Listed Company Manual or Nasdaq rules, as applicable. Under the NYSE or Nasdaq, as applicable, corporate governance standards, a company of which more than 50% of the voting power is held by an individual, group or another company is a “controlled company” and may elect not to comply with certain corporate governance standards, including (1) the requirement that a majority of the board of directors consist of independent directors, (2) the requirement that we have a compensation committee that is composed entirely of independent directors with a written charter addressing the committee’s purpose and responsibilities, (3) the requirement that we have a nominating and corporate governance committee that is composed entirely of independent directors with a written charter addressing the committee’s purpose and responsibilities and (4) the requirement for an annual performance evaluation of the nominating and corporate governance and compensation committees. Following this offering, we intend to utilize these exemptions. As a result, following this offering, we will not have a majority of independent directors on our board of directors; and we will not have a nominating and corporate governance committee or a compensation committee that is composed entirely of independent directors. Also, such committee will not be subject to annual performance evaluations. Accordingly, you will not have the same protections afforded to stockholders of companies that are subject to all of the NYSE or Nasdaq, as applicable, corporate governance requirements. In the event that we cease to be a “controlled company,” we will be required to comply with these provisions within the transition periods specified in the NYSE or Nasdaq, as applicable, corporate governance rules.
Committees of the Board of Directors
After the completion of this offering, the standing committees of our board of directors will consist of an Audit Committee, a Compensation Committee and a Nominating and Corporate Governance Committee.
Our president and chief executive officer and other executive officers will regularly report to the non-executive directors and the Audit, the Compensation and the Nominating and Corporate Governance Committees to ensure effective and efficient oversight of our activities and to assist in proper risk management and the ongoing evaluation of management controls. The director of internal audit will report functionally and administratively to our chief financial officer and directly to the Audit Committee. We believe that the leadership structure of our board of directors provides appropriate risk oversight of our activities given the controlling interests held by the H&F Investors.
93
Table of Contents
Audit Committee
The members of our current Audit Committee are Messrs. , and . Upon the completion of this offering, we expect to have an Audit Committee, consisting of , and . Messrs. , and qualify as independent directors under NYSE or Nasdaq, as applicable, corporate governance standards and the independence requirements of Rule 10A-3 of the Securities Exchange Act of 1934, as amended (the “Exchange Act”). Our board of directors has determined that qualifies as an “audit committee financial expert” as such term is defined in Item 407(d)(5) of Regulation S-K.
The purpose of the Audit Committee will be to prepare the audit committee report required by the SEC to be included in our proxy statement and to assist our board of directors in overseeing and monitoring (1) the quality and integrity of our financial statements, (2) our compliance with legal and regulatory requirements, (3) our independent registered public accounting firm’s qualifications and independence, (4) the performance of our internal audit function and (5) the performance of our independent registered public accounting firm.
Our board of directors has adopted a written charter for the Audit Committee, which will be available on our website upon the completion of this offering.
Compensation Committee Interlocks and Insider Participation
Compensation decisions are made by the board of directors and Compensation Committee of our board of directors. None of our executive officers has served as a member of the Compensation Committee (or other committee serving an equivalent function) of any other entity, whose executive officers served as a member of our board of directors or the Compensation Committee.
Messrs. Ragatz and Henske are managing directors of Hellman & Friedman LLC. As of September 28, 2013, the H&F Investors control approximately 97% of our outstanding common stock and are entitled to designate members of our board of directors. See “Certain Relationships and Related Party Transactions—Stockholders Agreement—Board of Directors.”
Compensation Committee
The members of our current Compensation Committee are Messrs. Ragatz, Henske, Carroll and Snyder. Upon the completion of this offering, we expect to have a Compensation Committee, consisting of Messrs. , and .
The purpose of the Compensation Committee is to assist our board of directors in discharging its responsibilities relating to (1) setting our compensation program and compensation of our executive officers and directors, (2) monitoring our incentive and equity-based compensation plans and (3) preparing the compensation committee report required to be included in our proxy statement under the rules and regulations of the SEC.
Our board of directors will adopt a written charter for the Compensation Committee which will be available on our website upon the completion of this offering.
Nominating and Corporate Governance Committee
Upon the completion of this offering, we expect to have a Nominating and Corporate Governance Committee, consisting of , and . The purpose of our Nominating and Corporate Governance Committee will be to assist our board of directors in discharging its responsibilities relating to (1) identifying individuals qualified to become new board of directors
94
Table of Contents
members, consistent with criteria approved by the board of directors, subject to the Stockholders Agreement; (2) reviewing the qualifications of incumbent directors to determine whether to recommend them for reelection and selecting, or recommending that the board of directors select, the director nominees for the next annual meeting of stockholders; (3) identifying board of directors members qualified to fill vacancies on any board of directors committee and recommending that the board of directors appoint the identified member or members to the applicable committee, subject to the Stockholders Agreement; (4) reviewing and recommending to the board of directors corporate governance principles applicable to us; (5) overseeing the evaluation of the board of directors and management; and (6) handling such other matters that are specifically delegated to the committee by the board of directors from time to time.
Our board of directors will adopt a written charter for the Nominating and Corporate Governance Committee which will be available on our website upon completion of this offering.
Director Independence
Pursuant to the corporate governance listing standards of the NYSE or Nasdaq, as applicable, a director employed by us cannot be deemed to be an “independent director,” and each other director will qualify as “independent” only if our Board of Directors affirmatively determines that he has no material relationship with us, either directly or as a partner, stockholder or officer of an organization that has a relationship with us. Ownership of a significant amount of our stock, by itself, does not constitute a material relationship.
Our Board of Directors is expected to affirmatively determine prior to this offering which members are “independent” in accordance with NYSE or Nasdaq rules, as applicable.
Code of Business Conduct and Ethics
Prior to the consummation of this offering, we will adopt a Code of Business Conduct and Ethics (the “Code of Ethics”) applicable to all employees, executive officers and directors that addresses legal and ethical issues that may be encountered in carrying out their duties and responsibilities, including the requirement to report any conduct they believe to be a violation of the Code of Ethics. The Code of Ethics is available on the Corporate Governance page of our internet website, www.associatedmaterials.com. The information available on or through our internet website is not part of this prospectus. If we ever were to amend or waive any provision of our Code of Ethics that applies to our principal executive officer, principal financial officer, principal accounting officer or any person performing similar functions, we intend to satisfy our disclosure obligations with respect to any such waiver or amendment by posting such information on our internet website set forth above rather than by filing a Form 8-K.
95
Table of Contents
Named Executive Officers
For the fiscal year ended December 29, 2012 (the “2012 fiscal year”), the following individuals were our named executive officers:
| Ÿ | Jerry W. Burris, President, Chief Executive Officer and Director |
| Ÿ | Paul Morrisroe, Senior Vice President, Chief Financial Officer and Secretary |
| Ÿ | Robert C. Gaydos, Senior Vice President, Operations |
| Ÿ | David S. Nagle, President, AMI Distribution |
| Ÿ | Brad S. Beard, Senior Vice President, New Business Development and National Account Sales and Services |
| Ÿ | Stephen E. Graham, former Senior Vice President, Chief Financial Officer and Secretary (resigned February 29, 2012) |
| Ÿ | John F. Haumesser, former Senior Vice President of Human Resources (resigned April 19, 2012) |
Objectives of Our Executive Compensation Program
The goals of our executive compensation program are to: (1) attract and retain key executives, (2) align executive pay with corporate goals and (3) encourage a long-term commitment to enhance equity value.
Our primary key performance indicator is EBITDA. We utilize EBITDA as the primary measure of our financial performance. Accordingly, our compensation programs are primarily designed to reward executives for driving growth of our EBITDA, which we believe corresponds to the enhancement of equity value. “EBITDA,” as used in our annual incentive bonus program for both the 2012 and 2013 fiscal years and for purposes of establishing the vesting targets for performance vesting stock options, has the same meaning as “Adjusted EBITDA” as described under the heading “Prospectus Summary—Adjusted EBITDA” elsewhere in this prospectus. For this purpose, EBITDA does not include the run-rate cost savings add-back allowable under the Amended and Restated Revolving Credit Agreement and the Indenture and may be subject to additional adjustments as made in good faith by the Compensation Committee of our board of directors (the “Committee”) for non-recurring or unusual transactions such as acquisitions or dispositions of assets outside the ordinary course of business.
As discussed below under the heading “—Annual Incentive Bonus,” certain other operating metrics, which are established by the Committee, in mutual agreement with our Chief Executive Officer (“CEO”), within the first 90 days of each fiscal year are utilized as secondary performance indicators under our annual incentive bonus program.
Elements of Compensation
The compensation of our named executive officers consists of the following elements: (1) base salary, (2) discretionary bonus awards payable under special circumstances, (3) annual incentive bonus, (4) long-term incentive compensation in the form of both time and performance vesting stock options and (5) severance and change in control benefits. We believe that offering each of these elements is necessary to remain competitive in attracting and retaining talented executives. Furthermore, the annual incentive bonus and equity-based long-term incentive compensation align the executive’s goals with those of the organization and our stockholders.
96
Table of Contents
Collectively, these elements of a named executive officer’s total compensation are designed to reward and influence the executive’s individual performance and our short-term and long-term performance. Base salaries and annual incentive bonuses are designed to reward executives for their performance and our short-term performance. Discretionary bonus awards typically include sign-on bonuses or incentives to attract executives, or awards to executives paid at the discretion of the Committee under special circumstances. We believe that providing long-term incentive compensation in the form of stock options ensures that our executives have a continuing stake in our long-term success and have incentives to increase our equity value. Severance benefits are commonplace in executive positions, and we believe that offering such benefits is necessary to remain competitive in the marketplace. Total compensation for each named executive officer is reviewed annually by the Committee to ensure that the proportions of the executive’s short-term incentives and long-term incentives are, in the view of the Committee, properly balanced.
Setting Executive Compensation
The Committee reviews and approves all employment agreements entered into by our named executive officers when they commence employment with us. The Committee is also responsible for approving any changes to the compensation of our named executive officers following their commencement of employment. Historically, the Committee has not engaged in any formal benchmarking of compensation. However, the Committee from time to time has reviewed data compiled from publicly available surveys regarding the compensation paid by similarly sized companies for similar positions and will consider this data both when determining whether the named executive officers should receive a base salary increase and in deciding whether to make any changes in the compensation of our named executive officers.
Each year, our Senior Vice President and Chief Human Resources Officer (“CHRO”) and our CEO conduct an assessment of each executive’s (other than the CEO’s) performance for the immediately preceding year. Following this assessment, our CEO presents recommendations to the Committee regarding base salary increases and any other proposed changes in the compensation of the executives, excluding himself. The Committee reviews these performance assessments and recommendations, and either approves these recommendations or adjusts such recommendations as it determines to be appropriate in its sole discretion in making changes to the compensation of any executive. Our CHRO also provides our CEO and the Committee with input regarding our annual bonus plan (as discussed below) and equity grants for executives, including but not limited to, recommendations regarding eligibility for such grants and the size of the applicable grant (determined as a percentage of base salary). Although our CEO and CHRO generally attend meetings of the Committee, each recuses himself from those portions of the meetings related to his compensation. In addition, our CEO provides input to the Committee with respect to setting the EBITDA targets under our annual bonus program and the other operating metrics under the annual bonus program are mutually agreed by the Committee and our CEO.
The Committee is exclusively responsible for determining any base salary increases for our CEO and for making any other compensation decisions with respect to our CEO. In making any such compensation decisions, the Committee has historically considered any relevant data from publicly available sources and its own assessment of the performance of our CEO for the preceding year.
97
Table of Contents
At the beginning of the 2013 fiscal year, we engaged Organizational Consulting Group (“OCG”) to deliver a report reviewing our executive compensation program against the following peer group of companies developed by OCG:
Although OCG has delivered its report, as of the date of this prospectus, the Committee has not made any decisions regarding the compensation of any executive based on the data or recommendations contained in the report. Following this offering, the Committee anticipates that it will retain an independent compensation consultant who will provide the Committee with input and guidance on all components of our executive compensation program and will advise the Committee with respect to market data for base salary, annual bonus and long-term equity compensation for similarly situated executives in the peer group. The Committee has not yet determined whether it will engage in any formal benchmarking of executive compensation against the peer group following this offering.
Base Salary
Base salaries are determined based on (1) a review of salary ranges for similar positions at companies of similar size based on annual revenues, (2) the specific experience level of the executive, and (3) expected contributions by the executive toward organizational goals. Annually, the Committee reviews base salaries of executives to ensure that, along with all other compensation, base salaries continue to be competitive with respect to similarly sized companies. The Committee may also award annual increases in base salary based upon the executive’s individual contributions and performance during the prior fiscal year. The base salaries of Messrs. Morrisroe and Nagle were determined as a result of negotiations with each such executive in connection with his commencement of employment with us and the Committee’s subjective judgment (based on the experience of its members) as to what a competitive salary would be for each such executive’s position. None of the named executive officers received a base salary increase in the 2012 fiscal year or in the 2013 fiscal year through the date of this prospectus.
Discretionary Bonus Awards
Discretionary bonus awards encompass any bonus provided outside of the annual incentive bonus program discussed below. Typical bonus awards include awards used to attract executives to us, such as signing bonuses or bonuses that guarantee a fixed or minimum payout as compared to a payout under the annual incentive bonus program based upon the achievement of defined performance goals. Bonus awards can also be awarded at the discretion of the Committee to recognize extraordinary achievements or contributions by our executives.
In connection with the commencement of employment of each of Messrs. Morrisroe and Nagle with us in the 2012 fiscal year, each received a one-time signing bonus of $125,000 and $26,000, respectively. These signing bonuses were intended to encourage each such executive to accept employment with us, to cover certain relocation expenses that are not reimbursable under our policy, and, in the case of Mr. Morrisroe, to serve as a partial make whole for an unvested equity award from his prior employer that he forfeited when he accepted employment with us.
98
Table of Contents
Annual Incentive Bonus
For each fiscal year, the executives’ annual incentive bonuses are determined as a percentage of their base salaries (with a target bonus percentage set forth in each executive’s employment agreement), based on the achievement of the applicable performance goals.
2012 Fiscal Year Annual Bonus Program. Seventy percent (70%) of the total target bonus for the 2012 fiscal year is based on achieving an EBITDA performance goal. Each year, the Committee establishes EBITDA performance goals, including threshold, target, and maximum performance goals. The EBITDA performance goals are established by the Committee, giving consideration to our prior fiscal year performance, expected growth in EBITDA, market conditions that may impact results, and a review of the budget prepared by management. The EBITDA performance goals are established to motivate superior performance by management to achieve challenging targets and results that are deemed to be in the best interest of us and our stockholders and to tie their interest to meeting and exceeding our established financial goals. Failure to achieve the internal EBITDA performance goals is not necessarily an indication of our financial performance or our financial condition. If the EBITDA results for the period in question are between either the threshold and target performance goals or target and maximum performance goals, linear interpolation is used to calculate the portion of the incentive bonus payout that is based on the achievement of the EBITDA performance goal. As described above under the heading, “—Objectives of Our Executive Compensation Program,” EBITDA excludes the adjustment for run-rate cost savings and may be adjusted by the Committee, at its discretion, for non-recurring or unusual transactions, which may not otherwise be included as an adjustment to derive our Adjusted EBITDA as presented elsewhere in this prospectus.
The threshold, target and maximum EBITDA performance goals for the 2012 fiscal year were $95.0 million, $105.2 million and $126.2 million, respectively. EBITDA for the 2012 fiscal year was $96.4 million calculated on the same basis as Adjusted EBITDA for the 2012 fiscal year excluding run-rate cost savings of $10.7 million (as presented under “Management’s Discussion and Analysis of Financial Condition and Results of Operations” and elsewhere in this prospectus), in accordance with the Committee’s discretion in permitting adjustments for non-recurring or unusual transactions as permitted under the Amended and Restated Revolving Credit Agreement governing our ABL facilities and the Indenture. For 2012, the achieved EBITDA performance corresponded to a payout equal to 42% of the EBITDA bonus.
Thirty percent (30%) of the total target bonus is based on achieving other applicable operating metrics, which metrics are established by the Committee, in mutual agreement with our CEO, within the first 90 days of each fiscal year.
For the 2012 fiscal year, these other operating metrics consisted of (1) “Quality” of orders completed, weighted at 15% of the total target bonus, (2) our “Liquidity”, weighted at 7.5% of the total target bonus, and (3) “Working Capital”, weighted at 7.5% of the total target bonus. The threshold, target and maximum levels of each of these operating metrics was set with the following objectives: the target level is both challenging and achievable, reflects the midpoint of planned company performance and the performance ranges within which threshold and maximum payouts can be earned are consistent with the range of financial results within which performance is expected to occur; and a threshold payment is made to reward partial achievement of the targets and a maximum payment rewards attainment of an aggressive, but potentially achievable, level of performance.
“Quality” was determined by measuring the number of fully correct purchase orders invoiced during the fiscal year over the total number of purchase orders invoiced for that same period. The portion of the Quality bonus that is paid is based on the actual level of achievement, with the threshold, target and maximum achievement levels corresponding to payouts of 33%, 100% and 167% of the Quality bonus, respectively. For 2012, the achieved Quality level corresponded to a payout equal to 161% of the Quality bonus.
99
Table of Contents
“Liquidity” was determined over the first half of the 2012 fiscal year and was defined as the excess availability under the revolving credit agreement governing our ABL facilities. The threshold, target and maximum Liquidity goals for the 2012 fiscal year were $10 million, $15 million and $20 million, respectively. The portion of the Liquidity bonus that is paid is based on the actual level of achievement, with the threshold, target and maximum achievement levels corresponding to payouts of 33%, 100% and 167% of the Liquidity bonus, respectively. For 2012, the achieved Liquidity level corresponded to a payout equal to 167% of the Liquidity bonus.
“Working Capital” was determined over the second half of the 2012 fiscal year and was defined as the amount of accounts receivable plus inventory less accounts payable, divided by our total sales over the previous three month period multiplied by four. The threshold, target and maximum Working Capital Efficiency goals for the 2012 fiscal year were 9.2%, 8.4% and 7.5%, respectively. The portion of the Working Capital Efficiency bonus that is paid is based on the actual level of achievement, with the threshold, target and maximum achievement levels corresponding to payouts of 33%, 100% and 167% of the Working Capital Efficiency bonus, respectively. For the 2012 fiscal year, the threshold performance goal for Working Capital was not achieved and the Working Capital portion of the target bonus was not paid.
For the 2012 fiscal year, the threshold, target and maximum bonuses that could have been earned by each of our named executive officers (expressed as a percentage of base salary and based on the bonus they could have earned for the full year), as well as the amount of bonus actually paid to each named executive officer, are set forth below:
| 2012 Annual Incentive Bonus Payout Percentage(1) |
2012 Annual Incentive Bonus Payout |
|||||||||||||||||||
| Name |
Threshold | Target | Maximum | Actually Paid as Percentage of Base Salary(2) |
Dollar Amount of Bonus(3) |
|||||||||||||||
| Jerry W. Burris |
33 | % | 100 | % | 260 | % | 66 | % | $ | 364,803 | ||||||||||
| Paul Morrisroe |
20 | % | 60 | % | 156 | % | 40 | % | $ | 109,275 | ||||||||||
| Robert C. Gaydos |
20 | % | 60 | % | 156 | % | 40 | % | $ | 129,339 | ||||||||||
| David S. Nagle |
20 | % | 60 | % | 156 | % | 40 | % | $ | 110,043 | ||||||||||
| Brad S. Beard |
20 | % | 60 | % | 156 | % | 40 | % | $ | 99,491 | ||||||||||
| (1) | Messrs. Graham’s and Haumesser’s employment terminated in 2012, and as a result, they did not receive a bonus payment for the 2012 fiscal year. |
| (2) | For Messrs. Morrisroe and Nagle, such percentages reflect the actual bonus earned (at approximately 40% of base salary) by each such executive as pro-rated for the number of days each such executive was employed by us in the 2012 fiscal year. |
| (3) | The dollar amount of the 2012 annual incentive bonus payout is calculated as described in the following example. Assuming a $100,000 target bonus and the bonus criteria and achievement levels described above, a participating executive would receive: $29,400 for the EBITDA portion (70% of $100,000 multiplied by 42%); $24,150 for the Quality portion (15% of $100,000 multiplied by 161%); $12,525 for the Liquidity portion (7.5% of $100,000 multiplied by 167%); and $0 for the Working Capital portion (7.5% of $100,000 multiplied by 0%) for an aggregate bonus of $66,075. |
2013 Fiscal Year Annual Bonus Program. For the 2013 fiscal year, the annual incentive bonus payable to each of our named executive officers will be determined based upon the same percentage of their base salaries as is set forth above. 70% of the target bonus is payable based upon the level at which the EBITDA performance goal established by the Committee is achieved (with EBITDA having the same definition as under the 2012 annual incentive bonus program), 15% of the target bonus is payable based upon the level at which the Sales Growth operating metric is achieved, and the remaining 15% of the target bonus is payable based upon the level at which the Window Quality
100
Table of Contents
Improvement operating metric is achieved Each of the operating metrics was established by the Committee in mutual agreement with the CEO and is designed to measure short-term initiatives specific to the 2013 fiscal year. We believe that the target, threshold and maximum targets established for EBITDA performance goal under the 2013 fiscal year annual incentive bonus program and the two operating metrics for the 2013 fiscal year represent confidential financial information, the disclosure of which could cause us competitive harm. Accordingly, it is our practice not to include such information in
our public filings until the completion of the 2013 fiscal year. No bonuses will be payable under the 2013 fiscal year annual incentive program if the EBITDA performance goal is not achieved at the threshold level of performance.
Equity-Based Compensation
The Committee awards equity-based compensation, consisting of stock options, to executives based on the expected role of the executive in increasing equity value. Typically equity-based awards will be granted upon hiring or promotion of the executive; however, equity-based awards may be granted at any time at the discretion of the Committee.
In connection with the commencement of employment of each of Messrs. Morrisroe and Nagle with us in the 2012 fiscal year, we granted each an option to purchase 320,000 shares of our common stock subject to time-based vesting and 80,000 shares subject to performance-based vesting pursuant to our 2010 Stock Incentive Plan (the “2010 Plan”). The number of shares subject to each stock option award was determined based on grants to executives in similar positions of similarly sized companies (based on the above-described publicly available surveys), the result of negotiations with each of Messrs. Morrisroe and Nagle in connection with their commencement of employment with us and the Committee’s judgment (based on the experience of its members) as to what a competitive initial option grant would be for each such executive based on his position with us.
The time-based options vest with respect to 20% of the shares on each anniversary of the grant date, with accelerated vesting of all unvested shares in the event of a change in control, as defined below under the heading “—2010 Stock Incentive Plan.” The performance-based options vest based on the achievement of EBITDA targets as established by the Committee annually with respect to 20% of the shares per year over a five-year period, or if the target for a given year is not achieved, the option may vest if the applicable EBITDA target is achieved in the next succeeding year. As described above under the heading, “—Objectives of Our Executive Compensation Program,” EBITDA excludes the adjustment for run-rate cost savings and may be adjusted by the board of directors, at its discretion, for non-recurring or unusual transactions, which may not otherwise be included as an adjustment to derive our Adjusted EBITDA as presented elsewhere in this prospectus. In addition, the performance-based options also provide that in the event of a change in control, that portion of the option that was scheduled to vest in the year in which the change in control occurs and in any subsequent years shall become vested immediately prior to such change in control. All of the performance-based vesting options and 50% of the time-based vesting options granted to Messrs. Morrisroe and Nagle have an exercise price equal to the grant date fair market value of the underlying shares of our common stock; 25% of the time-based vesting options have an exercise price equal to two times the grant date fair market value of such stock; and the remaining 25% of the time-based vesting options have an exercise price equal to four times the grant date fair market value of such stock. The shares of common stock acquired upon the exercise of such stock options are subject to the terms of the Stockholders Agreement, as described below. The stock options expire on the tenth anniversary of the date of grant.
None of the other named executive officers was granted stock option or other equity-based awards in the 2012 fiscal year, and none of the named executive officers has been granted a stock option or other equity-based award in the 2013 fiscal year through the date of this prospectus.
101
Table of Contents
Severance Compensation/Change in Control Benefits
Severance Benefits under Employment Agreements. Each of the executives has entered into an employment agreement that provides for severance benefits in the event that we terminate the executive without “cause” (and other than due to death or disability) at any time. We believe that it is necessary to offer severance benefits in order to remain competitive in attracting talent to us (and to retain such talent). These executives’ employment agreements do not provide for enhanced severance if we have a change in control.
Change in Control Benefits under Stock Option Award Agreements. The stock option award agreements between us and our named executive officers provide that the time-based vesting options, granted pursuant to our 2010 Plan, will vest in full immediately prior to a change in control. In the event of a change in control, these option agreements also provide that the portion of the performance-based vesting options that was otherwise scheduled to vest in the year in which the change in control occurs and the portion that was scheduled to vest in any years subsequent to such change in control will become vested immediately prior to such change in control. We agreed to provide accelerated vesting of unvested time-based options and performance-based options (other than that portion of the performance-based option that did not vest in any year prior to a change in control) in order to ensure that our executives are solely focused on helping us consummate a change in control.
Perquisites
Upon commencement of employment, we offer relocation packages to our executives if necessary, which includes temporary living costs, house searching trips for the executive and the executive’s family, temporary use of a company-owned vehicle, the cost of moving household goods and reimbursement of closing costs and real estate expenses. We have also agreed to compensate each of Messrs. Burris and Morrisroe if the sale of his primary residence at the time he accepted employment with us results in a loss, as described in more detail below in the description of each such executive’s employment agreement.
Tax Implications
The Internal Revenue Code of 1986, as amended (the “Code”), Section 162(m) (as interpreted by IRS Notice 2007-49) denies a federal income tax deduction for certain compensation in excess of $1 million per year paid to the chief executive officer and the three other most highly-paid executive officers (other than the company’s chief executive officer and chief financial officer) of a publicly-traded corporation. Certain types of compensation, including compensation based on performance criteria that are approved in advance by stockholders, are excluded from the deduction limit. In addition, “grandfather” provisions may apply to certain compensation arrangements that were entered into by a corporation before it was publicly held. The Committee’s policy will be to qualify compensation paid to our named executive officers for deductibility for federal income tax purposes to the extent feasible. However, to retain highly skilled executives and remain competitive with other employers, the Committee will have the right to authorize compensation that would not otherwise be deductible under Section 162(m) or otherwise and to pay bonuses in any amount, including discretionary bonuses or bonuses with performance goals that are different from those under our annual incentive bonus program.
102
Table of Contents
Summary Compensation Table
The table below summarizes the total compensation paid to, or earned by, our Chief Executive Officer, our Chief Financial Officer, each of our three other most highly compensated executive officers, our former Chief Financial Officer and one additional individual who would have been among our three other most highly compensated executive officers but for his termination (collectively, our “named executive officers”) for services rendered to us during the 2012 fiscal year.
| Name and Principal Position |
Year | Salary | Bonus(1) | Option Awards(2) |
Non-Equity Incentive Plan Compensation(3) |
All Other Compensation |
Total | |||||||||||||||||||||
| Jerry W. Burris |
2012 | $ | 550,000 | $ | — | $ | — | $ | 364,803 | $ | 78,580 | (4) | $ | 993,383 | ||||||||||||||
| President and Chief Executive Officer |
2011 | 168,878 | 168,157 | — | — | 24,689 | 361,724 | |||||||||||||||||||||
| Paul Morrisroe(6) |
2012 | 274,583 | 125,000 | — | 109,275 | 27,884 | (4) | 536,742 | ||||||||||||||||||||
| Senior Vice President, Chief Financial Officer and Secretary |
||||||||||||||||||||||||||||
| Robert C. Gaydos |
2012 | 325,000 | — | — | 129,339 | 9,830 | 464,169 | |||||||||||||||||||||
| Senior Vice President, Operations |
2011 | 135,420 | 125,000 | — | — | 47,653 | 308,073 | |||||||||||||||||||||
| David S. Nagle(6) |
2012 | 276,513 | 26,000 | — | 110,043 | 23,067 | (4) | 435,623 | ||||||||||||||||||||
| President, AMI Distribution |
||||||||||||||||||||||||||||
| Brad S. Beard |
2012 | 250,000 | — | — | 99,491 | 9,289 | 358,780 | |||||||||||||||||||||
| Senior Vice President, New Business Development and National Account Sales and Services |
2011 | 250,000 | — | — | — | 15,163 | 265,163 | |||||||||||||||||||||
| Stephen E. Graham(7) |
2012 | 52,000 | — | — | — | 1,311,442 | (5) | 1,363,442 | ||||||||||||||||||||
| Former Senior Vice President, Chief Financial Officer and Secretary |
2011 | 312,000 | — | — | — | 11,636 | 323,636 | |||||||||||||||||||||
| 2010 | 304,500 | — | 2,726,365 | 312,000 | 1,577,529 | 4,920,394 | ||||||||||||||||||||||
| John F. Haumesser(7) |
2012 | 80,472 | — | — | — | 1,106,958 | (5) | 1,187,430 | ||||||||||||||||||||
| Former Senior Vice President of Human Resources |
2011 | 262,000 | — | — | — | 1,708 | 263,708 | |||||||||||||||||||||
| 2010 | 255,780 | — | 3,406,294 | 262,080 | 1,969,571 | 5,893,725 | ||||||||||||||||||||||
| (1) | For Messrs. Morrisroe and Nagle, amounts consist of the signing bonuses paid to them in connection with their commencing employment with us. |
| (2) | Each of Messrs. Morrisroe and Nagle was granted an option to purchase 400,000 shares of our common stock subject to time and performance-based vesting as described above under the heading “Equity-Based Compensation.” No other options were granted to our named executive officers in 2012. However, as described in more detail in footnote 2 under the heading “—Grant of Plan-Based Awards in Fiscal Year 2012,” performance vesting stock options granted prior to the 2012 fiscal year that vest based on the attainment of the 2012 fiscal year EBITDA goal are considered granted in accordance with ASC 718 when the fiscal year 2012 EBITDA goal is set by the Committee and communicated to the executives. The dollar amount provided herein reflects the dollar amount recognized for financial statement purposes in accordance with ASC 718. The assumptions used by us in determining the grant date fair value of option awards and our general approach to our valuation methodology are set forth in Note 15 to our consolidated financial statements included elsewhere in this prospectus. For purposes of ASC 718, the grant date fair value of the options granted to Messrs. Morrisroe and Nagle, and the grant date fair value of the performance vesting options, deemed to be granted in fiscal year 2012, is $0.00. The grant date fair value is $0.00 because, prior to this offering, stock purchased as a result of the exercise of options was subject to a post-termination repurchase right by us, and as a result, other than in limited circumstances, stock issued upon the exercise of the option could be repurchased at our discretion. This repurchase feature resulted in no compensation expense being recognized in connection with options granted by us, until such time as the exercise of the options could occur without our repurchase of the shares (that is, on or after a liquidity event, such as a change in control or an initial public offering of shares of our common stock). Upon the consummation of this offering, the repurchase feature will lapse, and we will accordingly begin to recognize compensation expense with respect to outstanding option awards. |
| (3) | Amounts in the column “Non-Equity Incentive Plan Compensation” reflect the annual cash incentive bonus approved by the Committee. |
| (4) | For Mr. Nagle, the amount includes $18,228 of moving expenses in 2012. For Messrs. Burris and Morrisroe, the amount includes $47,773 and $15,492 of moving expenses in 2012, respectively, and $10,772 and $4,554, respectively, as the incremental cost to us of their use of a company-owned vehicle in 2012. |
103
Table of Contents
| (5) | For Messrs. Graham and Haumesser such amounts include $1,303,346 and $1,105,500 of severance payments, respectively. |
| (6) | Mr. Morrisroe commenced employment with us on February 27, 2012, and Mr. Nagle commenced employment with us on February 20, 2012 and their annual base salary and payments under the annual cash incentive bonus program are prorated accordingly. |
| (7) | On February 24, 2012, Mr. Graham resigned from his position as Senior Vice President—Chief Financial Officer and Secretary and on April 19, 2012, Mr. Haumesser resigned from his position as Senior Vice President of Human Resources. |
Executive Employment Agreements
As a matter of practice, we enter into employment agreements with our executive officers that establish minimum salary levels, outline the terms of their discretionary and annual incentive bonuses, and provide for severance benefits in the event of a qualifying termination. The following is a summary of the significant terms of each named executive officer’s employment agreement.
Mr. Burris
Effective September 12, 2011, we entered into an employment agreement with Mr. Burris, pursuant to which he commenced serving as our President and Chief Executive Officer. Pursuant to the employment agreement, Mr. Burris will receive an annual base salary of $550,000, and is eligible for an annual bonus with a target bonus opportunity equal to 100% of his base salary and a maximum bonus opportunity equal to 255% of his base salary. The Committee increased Mr. Burris’ maximum bonus opportunity to 260% of his base salary. We reimbursed Mr. Burris for certain amounts in connection with his relocation to the Northeast Ohio area and related travel. In addition, in connection with his relocation, if Mr. Burris sells his primary residence in Connecticut for less than what he paid for such residence, he will be entitled to an amount equal to the loss on the sale of such residence, up to $600,000 (the “Make-Whole Payment”), plus an additional payment to fully reimburse him for all federal, state and local taxes with respect to the Make-Whole Payment. The after-tax proceeds of any Make-Whole Payment received by Mr. Burris shall be used to repay the outstanding principal balance (plus any accrued and unpaid interest) of the September 2011 promissory note. On June 17, 2013, Mr. Burris sold his Connecticut residence and on June 26, 2013 received a Make-Whole Payment (including the additional amount for the tax gross up) in the amount of $827,930 and repaid the note in full on June 27, 2013.
If Mr. Burris’ employment is terminated by us other than for cause (and not due to death or disability), he will be entitled to (i) his base salary for two years, payable in equal installments, (ii) his incentive bonus, pro-rated for the year in which such termination occurs and in accordance with the terms of the employment agreement and (iii) continued medical and dental benefits for up to two years. The severance benefits are subject to Mr. Burris’ execution of a general release in favor of us and our affiliates and Mr. Burris’ continued compliance with the restrictive covenants in the employment agreement, and are capped to the extent such benefits would not be fully deductible by us for federal income tax purposes under Section 280G of the Code or would give rise to a related excise tax on Mr. Burris. Pursuant to the employment agreement, Mr. Burris will be subject to restrictions on competition and solicitation of employees and customers during his employment with us and for a period of two years thereafter. Mr. Burris’ employment agreement also contains customary confidentiality, invention assignment and non-disparagement covenants.
Mr. Morrisroe
On February 27, 2012, we entered into an employment agreement with Mr. Morrisroe, pursuant to which he agreed to serve as our Senior Vice President, Chief Financial Officer and Secretary. Pursuant to the employment agreement, Mr. Morrisroe will receive an annual base salary of $325,000,
104
Table of Contents
and is eligible for an annual bonus with a target bonus opportunity equal to 60% of his base salary and a maximum bonus opportunity equal to 156% of his base salary. In connection with the commencement of Mr. Morrisroe’s employment, he received a one-time signing bonus of $125,000. We reimbursed Mr. Morrisroe for certain amounts in connection with his relocation to the Northeast Ohio area and related travel. In addition, in connection with his relocation, if Mr. Morrisroe sells his primary residence in Connecticut for less than what he paid for such residence, he will be entitled to an amount equal to the loss on the sale of such residence, up to $50,000, plus an additional payment to fully reimburse him for all federal, state and local taxes with respect to the Make-Whole Payment. On June 17, 2013, Mr. Morrisroe sold his Connecticut residence and on July 5, 2013 received a Make-Whole Payment (including the additional amount for the tax gross up) in the amount of $99,751.
If Mr. Morrisroe’s employment is terminated by us other than for cause (and not due to disability or death), he will be entitled to (i) his base salary for twelve months, payable in equal installments, (ii) his incentive bonus, pro-rated for the year in which such termination occurs and in accordance with the terms of the employment agreement and (iii) continued medical and dental benefits for up to twelve months. The severance benefits are subject to Mr. Morrisroe’s execution of a general release in favor of us and our affiliates and Mr. Morrisroe’s continued compliance with the restrictive covenants in the employment agreement, and are capped to the extent such benefits would not be fully deductible by us for federal income tax purposes under Section 280G of the Code or would give rise to a related excise tax on Mr. Morrisroe. Mr. Morrisroe will also be subject to restrictions on competition and solicitation of employees and customers during his employment with us and for a period of two years thereafter. The employment agreement also contains customary confidentiality, invention assignment and non-disparagement covenants.
Mr. Gaydos
On August 1, 2011, we entered into an employment agreement with Mr. Gaydos, pursuant to which he agreed to serve as our Senior Vice President, Operations. Pursuant to the employment agreement, Mr. Gaydos will receive an annual base salary of $325,000 and will have a target annual bonus opportunity equal to 60% of his base salary and a maximum bonus opportunity equal to 156% of his base salary. We reimbursed Mr. Gaydos for certain amounts in connection with his relocation to the Northeast Ohio area and related travel.
If Mr. Gaydos’ employment is terminated by us other than for cause (and not due to disability or death), he will be entitled to (i) his base salary for twelve months, payable in equal installments, (ii) his incentive bonus, pro-rated for the year in which such termination occurs and in accordance with the terms of the employment agreement and (iii) continued medical and dental benefits for up to twelve months. The severance benefits are subject to Mr. Gaydos’ execution of a general release in favor of us and our affiliates and Mr. Gaydos’ continued compliance with the restrictive covenants in the employment agreement and are capped to the extent such benefits would not be fully deductible by us for federal income tax purposes under Section 280G of the Code or would give rise to a related excise tax on Mr. Gaydos. Mr. Gaydos will also be subject to restrictions on competition and solicitation of employees and customers during his employment with us and for a period of two years thereafter. The employment agreement also contains customary confidentiality, invention assignment and non-disparagement covenants.
Mr. Nagle
On October 25, 2013, we amended Mr. Nagle’s employment agreement, originally entered into on February 20, 2012, pursuant to which he will serve as our Senior Vice President and Chief Operations Officer, AMI Distribution and Services, having previously served as our President, AMI Distribution. Pursuant to the amended employment agreement, Mr. Nagle will receive an annual base salary of $300,000, and is eligible for an annual bonus with a target bonus opportunity equal to 60% of his base
105
Table of Contents
salary and a maximum bonus opportunity equal to 156% of his base salary. In connection with the commencement of Mr. Nagle’s employment, he received a one-time signing bonus of $26,000. We reimbursed Mr. Nagle for certain amounts in connection with his relocation to the Northeast Ohio area and related travel.
If Mr. Nagle’s employment is terminated by us other than for cause (and not due to disability or death), he will be entitled to (i) his base salary for twelve months, payable in equal installments, (ii) his incentive bonus, pro-rated for the year in which such termination occurs and in accordance with the terms of the employment agreement and (iii) continued medical and dental benefits for up to twelve months. The severance benefits are subject to Mr. Nagle’s execution of a general release in favor of us and our affiliates and Mr. Nagle’s continued compliance with the restrictive covenants in the employment agreement, and are capped to the extent such benefits would not be fully deductible by us for federal income tax purposes under Section 280G of the Code or would give rise to a related excise tax on Mr. Nagle. Mr. Nagle will also be subject to restrictions on competition and solicitation of employees and customers during his employment with us and for a period of two years thereafter. The employment agreement also contains customary confidentiality, invention assignment and non-disparagement covenants.
Mr. Beard
On December 20, 2010, we entered into an employment agreement with Mr. Beard, pursuant to which he agreed to serve as our Vice President of AMI Distribution. Pursuant to the employment agreement, Mr. Beard will receive an annual base salary of $250,000 and will have a target annual bonus opportunity equal to 60% of his base salary and a maximum bonus opportunity equal to 156% of his base salary.
On February 15, 2012, Mr. Beard’s employment agreement was amended in connection with his assumption of the position of Senior Vice President, New Business Development and National Account Sales and Services, effective as of February 20, 2012. In the event he is terminated without cause (and not due to death or disability), at any time commencing on December 21, 2012, he will receive (i) an amount equal to his base salary and, solely if such termination occurred on or prior to June 19, 2013, an amount equal to his target bonus payable in 12 equal monthly installments in accordance with our payroll procedures over the twelve-month period following such termination of employment, (ii) a pro-rated portion of his annual target bonus and (iii) continued medical, dental and life insurance benefits for twelve months (or reimbursement for the cost of such benefits). The severance benefits are subject to Mr. Beard’s execution of a general release in favor of us and our affiliates and are capped to the extent such benefits would not be fully deductible by us for federal income tax purposes under section 280G of the Code or would give rise to a related excise tax on Mr. Beard.
Pursuant to the employment agreement, Mr. Beard will be subject to restrictions on competition and interference during his employment with us and for a period of two years thereafter. The employment agreement also contains standard confidentiality, invention assignment and non-disparagement covenants.
Definition of Cause
Under each of the above-described employment agreements, “cause” is generally defined as the executive’s: (i) embezzlement, theft or misappropriation of any of our property; (ii) breach of the restrictive covenants set forth in the employment agreement; (iii) breach of any other material provision of the employment agreement which breach is not cured, to the extent susceptible to cure, within 30 days after we give written notice to the executive describing such breach; (iv) willful failure to perform the duties of his employment which continues for a period of 14 days following written notice by us; (v) conviction of, or a plea of no contest (or a similar plea) to, any criminal offense that is a
106
Table of Contents
felony or involves fraud, or any other criminal offense punishable by imprisonment of at least one year or materially injurious to the business or reputation of us involving theft, dishonesty, misrepresentation or moral turpitude; (vi) gross negligence or willful misconduct in the performance of his duties as an employee, officer or director of us; (vii) breach of fiduciary obligations to us; (viii) commission of intentional, wrongful damage to our property; (ix) chemical dependence which adversely affects the performance of his duties and responsibilities to us; or (x) violation of our code of ethics, code of business conduct or similar policies applicable to the executive. The existence or non-existence of cause shall be determined in good faith by the board of directors.
Grants of Plan-Based Awards in Fiscal Year 2012
The following table summarizes the grants of equity and non-equity, plan-based awards made to our named executive officers during the 2012 fiscal year.
| Name |
Grant Date |
Estimated Possible Payouts Under Non-Equity Incentive Plan Awards(1) |
Estimated Future Payouts Under Equity Incentive Plan Awards |
All Other Option Awards: Number of Securities Underlying Options (#)(3) |
Exercise or Base Price of Option Awards ($/Share) |
Grant Date Fair Value of Option Awards ($)(4) |
||||||||||||||||||||||||||||||||||
| Threshold ($) |
Target ($) |
Maximum ($) |
Threshold (#) |
Target (#)(2) |
Maximum (#) |
|||||||||||||||||||||||||||||||||||
| Jerry W. Burris |
181,500 | 550,000 | 1,430,000 | — | — | — | — | — | — | |||||||||||||||||||||||||||||||
| 4/2/2012 | — | — | — | — | 74,000 | — | — | 5.00 | — | |||||||||||||||||||||||||||||||
| Paul Morrisroe |
54,917 | 164,750 | 428,350 | — | — | — | — | — | — | |||||||||||||||||||||||||||||||
| 4/2/2012 | — | — | — | — | 16,000 | — | — | 5.00 | — | |||||||||||||||||||||||||||||||
| 4/2/2012 | — | — | — | — | — | — | 120,000 | 5.00 | — | |||||||||||||||||||||||||||||||
| 4/2/2012 | — | — | — | — | — | — | 100,000 | 10.00 | (5) | — | ||||||||||||||||||||||||||||||
| 4/2/2012 | — | — | — | — | — | — | 100,000 | 20.00 | (6) | — | ||||||||||||||||||||||||||||||
| Robert C. Gaydos |
65,000 | 195,000 | 507,000 | — | — | — | — | — | — | |||||||||||||||||||||||||||||||
| 4/2/2012 | — | — | — | — | 16,000 | — | — | 5.00 | — | |||||||||||||||||||||||||||||||
| David S. Nagle |
55,303 | 165,908 | 431,360 | — | — | — | — | — | — | |||||||||||||||||||||||||||||||
| 4/2/2012 | — | — | — | — | 16,000 | — | — | 5.00 | — | |||||||||||||||||||||||||||||||
| 4/2/2012 | — | — | — | — | — | — | 120,000 | 5.00 | — | |||||||||||||||||||||||||||||||
| 4/2/2012 | — | — | — | — | — | — | 100,000 | 10.00 | (5) | — | ||||||||||||||||||||||||||||||
| 4/2/2012 | — | — | — | — | — | — | 100,000 | 20.00 | (6) | — | ||||||||||||||||||||||||||||||
| Brad S. Beard |
50,000 | 150,000 | 390,000 | — | — | — | — | — | — | |||||||||||||||||||||||||||||||
| 4/2/2012 | — | — | — | — | 13,555 | — | — | 5.00 | — | |||||||||||||||||||||||||||||||
| Stephen E. Graham(7) |
— | — | — | — | — | — | — | — | — | |||||||||||||||||||||||||||||||
| John F. Haumesser(7) |
— | — | — | — | — | — | — | — | — | |||||||||||||||||||||||||||||||
| (1) | Amounts in the table above under “Estimated Possible Payouts Under Non-Equity Incentive Plan Awards” reflect the annual cash incentive bonuses that could be earned by each of our named executive officers upon the achievement of defined EBITDA performance goals and the other operating metrics designed to measure short-term initiatives for 2012 at threshold, target and maximum levels of performance (based on the achievement of the goals applicable to the fiscal year). |
| (2) | This amount represents the tranche of performance vesting stock options that vest based on the attainment of the 2012 fiscal year EBITDA goal, which tranche, in the case of named executive officers other than Messrs. Morrisroe and Nagle, was granted to the named executive officers prior to the 2012 fiscal year. Each tranche of performance vesting stock options is not considered granted in accordance with ASC 718 until the EBITDA goal is set by the Committee and communicated to the executives. The performance vesting stock options vest upon the attainment of annual EBITDA-based performance targets. If the target for a given year is not achieved, the performance vesting stock options may vest if the applicable EBITDA target is achieved in the next succeeding year. Additional detail is provided below in the footnotes under the heading “—Outstanding Equity Awards At December 29, 2012.” |
| (3) | Total number of options granted in the 2012 fiscal year subject to time-based vesting. 30% of the total number of options granted have an exercise price equal to the grant date fair market value of the underlying common stock; 25% of the total number of options granted have an exercise price equal to two times the grant date fair market value of such stock; and the remaining 25% of the total number of options granted have an exercise price equal to four times the grant date fair market value of such stock. Each of the time vesting stock options vest solely upon the executive’s continued service over a five year period. Additional detail is provided below in the footnotes under the heading “—Outstanding Equity Awards At December 29, 2012.” |
| (4) | Each of Messrs. Morrisroe and Nagle was granted an option to purchase 400,000 shares of our common stock subject to time and performance-based vesting as described above under the heading “Equity-Based Compensation.” No other options were granted |
107
Table of Contents
| to our named executive officers in 2012. However, as described in more detail in footnote 2 under the heading “—Grant of Plan-Based Awards in Fiscal Year 2012,” performance vesting stock options granted prior to the 2012 fiscal year that vest based on the attainment of the 2012 fiscal year EBITDA goal are considered granted in accordance with ASC 718 when the fiscal year 2012 EBITDA goal is set by the Committee and communicated to the executives. The dollar amount provided herein reflects the dollar amount recognized for financial statement purposes in accordance with ASC 718. The assumptions used by us in determining the grant date fair value of option awards and our general approach to our valuation methodology are set forth in Note 15 to our consolidated financial statements included elsewhere in this prospectus. For purposes of ASC 718, the grant date fair value of the options granted to Messrs. Morrisroe and Nagle, and the grant date fair value of the performance vesting options, deemed to be granted in fiscal year 2012, is $0.00. The grant date fair value is $0.00 because, prior to this offering, stock purchased as a result of the exercise of options was subject to a post-termination repurchase right by us, and as a result, other than in limited circumstances, stock issued upon the exercise of the option could be repurchased at our discretion. This repurchase feature resulted in no compensation expense being recognized in connection with options granted by us, until such time as the exercise of the options could occur without our repurchase of the shares (that is, on or after a liquidity event, such as a change in control or an initial public offering of shares of our common stock). Upon the consummation of this offering, the repurchase feature will lapse, and we will accordingly begin to recognize compensation expense with respect to outstanding option awards. |
| (5) | The exercise price equals two times the grant date fair market value of our common stock. |
| (6) | The exercise price equals four times the grant date fair market value of our common stock. |
| (7) | Messrs. Graham and Haumesser’s employment terminated in 2012 and, as a result, they forego all future payments under our non-equity incentive plan awards and forfeited all unvested equity awards. |
Outstanding Equity Awards at December 29, 2012
The following table provides information regarding outstanding equity awards held by our named executive officers as of December 29, 2012:
| Option Awards | ||||||||||||||||||||
| Name |
Number of Securities Underlying Unexercised Options (#) Exercisable |
Number of Securities Underlying Unexercised Options (#) Unexercisable |
Equity Incentive Plan Awards: Number of Securities Underlying Unexercised Unearned Options (#) |
Option Exercise Price ($) |
Option Expiration Date |
|||||||||||||||
| Jerry W. Burris |
111,000 | (1) | 444,000 | (1) | — | 5.00 | 9/12/2021 | |||||||||||||
| 92,500 | (1) | 370,000 | (1) | — | 10.00 | 9/12/2021 | ||||||||||||||
| 92,500 | (1) | 370,000 | (1) | — | 20.00 | 9/12/2021 | ||||||||||||||
| 22,504 | (2) | — | 74,000 | (2) | 5.00 | 9/12/2021 | ||||||||||||||
| Paul Morrisroe |
— | 120,000 | (1) | — | 5.00 | 4/2/2022 | ||||||||||||||
| — | 100,000 | (1) | — | 10.00 | 4/2/2022 | |||||||||||||||
| — | 100,000 | (1) | — | 20.00 | 4/2/2022 | |||||||||||||||
| — | — | 16,000 | (2) | 5.00 | 4/2/2022 | |||||||||||||||
| Robert C. Gaydos |
24,000 | (1) | 96,000 | (1) | — | 5.00 | 8/1/2021 | |||||||||||||
| 20,000 | (1) | 80,000 | (1) | — | 10.00 | 8/1/2021 | ||||||||||||||
| 20,000 | (1) | 80,000 | (1) | — | 20.00 | 8/1/2021 | ||||||||||||||
| 16,000 | (2) | — | 16,000 | (2) | 5.00 | 8/1/2021 | ||||||||||||||
| David S. Nagle |
— | 120,000 | (1) | — | 5.00 | 4/2/2022 | ||||||||||||||
| — | 100,000 | (1) | — | 10.00 | 4/2/2022 | |||||||||||||||
| — | 100,000 | (1) | — | 20.00 | 4/2/2022 | |||||||||||||||
| — | — | 16,000 | (2) | 5.00 | 4/2/2022 | |||||||||||||||
| Brad S. Beard |
20,333 | (1) | — | — | 10.00 | 12/20/2020 | ||||||||||||||
| 16,944 | (1) | — | — | 20.00 | 12/20/2020 | |||||||||||||||
| 16,944 | (1) | — | — | 30.00 | 12/20/2020 | |||||||||||||||
| 20,333 | (1) | 60,999 | (1) | — | 5.00 | 12/20/2020 | ||||||||||||||
| 16,944 | (1) | 50,832 | (1) | — | 10.00 | 12/20/2020 | ||||||||||||||
| 16,944 | (1) | 50,832 | (1) | — | 20.00 | 12/20/2020 | ||||||||||||||
| 13,555 | (2) | — | — | 10.00 | 12/20/2020 | |||||||||||||||
| 13,555 | (2) | 5.00 | 12/20/2020 | |||||||||||||||||
| Stephen E. Graham(3) |
— | — | — | — | — | |||||||||||||||
| John F. Haumesser(3) |
— | — | — | — | — | |||||||||||||||
| (1) | 80% of the total number of options granted are subject to time-based vesting. Except for options repriced in 2011 (where the exercise price was reduced), of the total number of options granted, 30% have an exercise price equal to the grant date fair market value of the underlying common stock; 25% of the total number of options granted have an exercise price |
108
Table of Contents
| equal to two times the grant date fair market value of such stock; and the remaining 25% of the total number of options granted have an exercise price equal to either three or four times the grant date fair market value of such stock. Each of the time vesting stock options vest solely upon the executive’s continued service over a five year period. The vesting accelerates in full if there is a change in control. |
| (2) | 20% of the total number of options granted are subject to performance-based vesting. Except for options repriced in 2011 (where the exercise price was reduced), the performance vesting stock options were granted with an exercise price equal to the grant date fair market value of the underlying stock and vest upon the attainment of EBITDA-based performance goals determined annually by the Committee over a five-year period, subject to the executive’s continued service over such period. The 2011 tranche of performance vesting stock options granted or modified in 2011 are vested and outstanding as of December 31, 2011. The 2012 tranche of performance-based awards granted were not vested as of December 29, 2012 since the goal for the 2012 fiscal year was not achieved. The remaining tranches of the performance vesting stock options are subject to vesting conditions based on the attainment of future annual EBITDA goals determined by the Committee within 90 days of the commencement of each fiscal year and are not considered granted until the future annual goals are communicated in accordance with ASC 718. If the goal for a given year is not achieved, the performance vesting stock option may vest if the applicable EBITDA goal is achieved in the next succeeding year. In the event of a change in control, that portion of the performance vesting stock option that was scheduled to vest in the year in which such change in control occurs and the portion that was scheduled to vest in any subsequent years shall become vested immediately prior to such change in control. |
| (3) | Unvested options held by Messrs. Graham and Haumesser were forfeited upon their respective resignations, and their vested options expired without being exercised at the end of the applicable post-termination exercise period. |
Options Exercises in Fiscal Year 2012
None of our named executive officers exercised options during the 2012 fiscal year.
Pension Benefits
We do not maintain any pension plans which provide for payments or other benefits in connection with the retirement of any current named executive officer.
Non-Qualified Deferred Compensation
We do not maintain any non-qualified defined contribution or other deferred compensation plans.
Potential Payments upon Termination or Change in Control
Severance Benefits for Termination without Cause
Each of Messrs. Burris, Morrisroe, Gaydos, Nagle and Beard is party to an employment agreement that provides for severance benefits in the event that we terminate the executive without cause (and other than due to death or disability) at any time (without regard to whether such termination occurs following a change in control). Refer to the “Employment Agreements” section for an additional discussion regarding the employment agreements with our executives.
Change in Control Vesting in Option Agreements
The stock option award agreements between us and our named executive officers provide that the time vesting stock options, granted pursuant to the 2010 Plan, will vest in full immediately prior to a change in control. In the event of a change in control, these option agreements also provide that the portion of the performance vesting stock options that was otherwise scheduled to vest in the year in which the change in control occurs and the portion that was scheduled to vest in any years subsequent to such change in control will become vested immediately prior to such change in control.
109
Table of Contents
The table below summarizes the severance benefits that would have been payable to our named executive officers in connection with a termination without cause had such event occurred on December 29, 2012.
| Severance Benefits | ||||||||||||
| Name |
Severance Payments(1) |
Benefits(2) | Total | |||||||||
| Jerry W. Burris |
$ | 1,464,815 | $ | 13,080 | $ | 1,477,895 | ||||||
| Paul Morrisroe |
434,278 | 6,540 | 440,818 | |||||||||
| Robert C. Gaydos |
454,342 | 6,540 | 460,882 | |||||||||
| David S. Nagle |
430,045 | 6,540 | 436,585 | |||||||||
| Brad S. Beard |
499,494 | 6,540 | 506,034 | |||||||||
| (1) | Amounts represent the severance payable on termination without cause in accordance with the terms of each executive’s individual employment agreement and are based on both the executive’s current base salary and the pro-rata share of their annual incentive bonus (and, in the case of Mr. Beard, the additional severance payment equal to one times his annual target bonus). |
| (2) | Represents an estimate of the medical benefits, based on our current cost per employee, to which the executives would be entitled in the event of a termination without cause. |
None of Messrs. Burris, Morrisroe, Gaydos, Nagle and Beard would be entitled to any additional payments or benefits upon a change in control because all of the options held by them have an exercise price that equals or exceeds the fair market value of our common stock as of December 29, 2012.
Named Executive Officers Terminated During 2012
On February 24, 2012, Mr. Graham resigned from his position as our Senior Vice President, Chief Financial Officer and Secretary. On April 19, 2012, Mr. Haumesser resigned from his position as our Vice President of Human Resources. We agreed to treat each such termination as if the executive were terminated without cause pursuant to the terms of his employment agreement, in each case, dated October 13, 2010. The terms of the employment agreements provided for the following severance if Mr. Graham or Mr. Haumesser was terminated by us without cause within two years from October 13, 2010 (i.e., the post-change in control period): (i) a payment in an amount equal to (A) two times base salary and (B) two times annual incentive pay (equal to the highest amount of incentive pay earned in any year during the preceding three years), which amount commenced being paid on the 61st day following such termination in 24 equal monthly installments (other than the first installment which included all amounts that would have otherwise been paid if payment had commenced immediately following such termination), (ii) for a period of 24 months, medical and dental insurance benefits consistent with the terms in effect for our active employees during this period (or reimbursement for the cost of such benefits), subject to reduction to the extent comparable benefits are actually received by the executive from another employer during this period and (iii) the cost of employee outplacement services equal to $30,000. Mr. Graham received $1,303,346 in severance pay and Mr. Haumesser received $1,105,500 in severance pay in connection with their respective terminations of employment with us. The employment agreements also provided that each of Messrs. Graham and Haumesser is subject to various restrictive covenants, including confidentiality and non-disparagement covenants, as well as a covenant not to solicit our employees and a non-competition covenant, for the two-year period following his resignation. The severance payments and benefits were conditioned upon each executive executing a general release of claims in favor of us and our affiliates within 60 days of such termination date, which releases were so executed.
Director Compensation
Each of Messrs. Snyder and Carroll are entitled to annual retainers of $40,000. They are each also entitled to receive an additional retainer of $10,000 per year for service on any committee of our
110
Table of Contents
board of directors. Each of Messrs. Snyder and Carroll also receives $2,000 for each board or committee meeting he attends in person and $1,500 for each such meeting which he attends telephonically. Messrs. Snyder and Carroll are both members of the compensation committee. Annual retainers for board and committee service, as applicable, along with meeting fees, are payable to Messrs. Snyder and Carroll quarterly, one quarter in arrears. We also pay direct travel expenses in connection with attending meetings and functions of our board of directors and committee(s) in accordance with applicable policies as in effect from time to time.
On December 31, 2012, each of Messrs. Snyder and Carroll was granted a restricted stock award of 12,000 shares of common stock that will vest in full on October 13, 2013, subject to each director’s continued service on our board of directors.
| Name(1) |
Fees Earned or Paid in Cash |
Stock Awards(2) |
Option Awards |
Non-Equity Incentive Plan Compensation |
Change in Pension Value and Nonqualified Deferred Compensation Earnings |
All Other Compensation |
Total | |||||||||||||||||||||
| Erik D. Ragatz |
$ | — | $ | — | $ | — | $ | — | $ | — | $ | — | $ | — | ||||||||||||||
| Charles A. Carroll |
66,500 | — | — | — | — | — | 66,500 | |||||||||||||||||||||
| Dana R. Snyder |
66,500 | — | — | — | — | — | 66,500 | |||||||||||||||||||||
| Robert B. Henske |
— | — | — | — | — | — | — | |||||||||||||||||||||
| Adam B. Durrett |
— | — | — | — | — | — | — | |||||||||||||||||||||
| (1) | Mr. Burris, our CEO, is not included in this table as he is our employee and thus receives no compensation for his services as a director. The compensation received by Mr. Burris is shown in the Summary Compensation Table. In addition, each of Messrs. Ragatz, Henske and Durrett did not receive any compensation for their services on our board of directors since they are employed by and receive compensation from the H&F Investors. |
| (2) | On December 29, 2012, none of our non-employee directors held any outstanding equity awards. |
2010 Stock Incentive Plan
Options have been issued to our named executive officers under the 2010 Plan.
In October 2010, in connection with the Merger, we adopted the 2010 Plan, pursuant to which a total of 6,150,076 shares of our common stock, par value $0.01 per share, are reserved for issuance pursuant to awards under the 2010 Plan. As of September 28, 2013, 5,225,261 shares of our common stock are subject to outstanding awards under our 2010 Plan. If any award is forfeited or if any option terminates, expires or lapses without being exercised, the common stock subject to such award will again be made available for future grant. If there is any change in our corporate capitalization, the Committee will make or recommend to our board of directors for approval substitutions or adjustments to the number of shares reserved for issuance under our 2010 Plan, the number of shares covered by awards then outstanding under our 2010 Plan, the limitations on awards under our 2010 Plan, the exercise price of outstanding options and such other equitable substitution or adjustments as it may determine appropriate in its sole discretion.
The 2010 Plan provides for the grant of stock options, restricted stock awards, and other equity-based incentive awards. To date, we have only granted stock options and restricted stock awards under the 2010 Plan. The Committee administers the 2010 Plan and selects eligible executives, directors, and employees of, and consultants to, us and our subsidiaries, to receive awards under the 2010 Plan. Shares of our common stock acquired pursuant to awards granted under the 2010 Plan will be subject to certain transfer restrictions and repurchase rights set forth in the 2010 Plan. The Committee has full discretion to administer and interpret the 2010 Plan and to adopt such rules, regulations and procedures as it deems necessary or advisable and to determine, among other things,
111
Table of Contents
the number of shares of stock covered by awards granted under the 2010 Plan and the terms of each award, including but not limited to, the terms under which stock options may be exercised, the exercise price of the stock options and other terms and conditions of the options and other awards in accordance with the provisions of the 2010 Plan.
In the event we undergo a change of control, the Committee may, at its discretion, accelerate the vesting or cause any restrictions to lapse with respect to outstanding awards, or may cancel such awards for fair value (as determined by the Committee), or may provide for the issuance of substitute awards. Under the 2010 Plan, a “change in control” is generally defined as a sale or disposition of all or substantially all of the assets of us and our subsidiaries (taken as a whole) to any person other than to the H&F Investors, any person or group (other than the H&F Investors) becomes the beneficial owner of more than 50% of the total voting power of our outstanding voting stock, or prior to an initial public offering of our common stock, the H&F Investors do not have the ability to cause the election of a majority of the members of the board of directors and any person or group (other than the H&F investors) beneficially owns outstanding voting stock representing a greater percentage of voting power with respect to the general election of members of the board than the shares of outstanding voting stock the H&F Investors beneficially own.
Subject to particular limitations specified in the 2010 Plan, our board of directors may amend or terminate the 2010 Plan. No amendment, suspension or termination will impair the rights of any participant or recipient of any award without the consent of the participant or recipient. The 2010 Plan will terminate no later than 10 years following its effective date; however, any awards outstanding under the 2010 Plan will remain outstanding in accordance with their terms.
2013 Stock Incentive Plan
We expect to adopt the Associated Materials Group, Inc. 2013 Stock Incentive Plan (the “2013 Plan”) and to receive approval of the 2013 Plan from our stockholders prior to the closing of this offering. The purpose of the 2013 Plan is to attract and retain key personnel and to provide a means for directors, officers, employees, consultants and advisors to acquire and maintain an interest in us, which interest may be measured by reference to the value of our common stock. The 2013 Plan is also designed to permit us to make cash-based awards and equity-based awards intended to qualify as “performance-based compensation” under Section 162(m) of the Code.
The principal features of the 2013 Plan are summarized below. This summary is qualified in its entirety by reference to the text of the 2013 Plan, which is filed as an exhibit hereto.
Administration. Our board of directors or the Committee will administer our 2013 Plan. The Committee will have the authority to determine the terms and conditions of any agreements evidencing any awards granted under our 2013 Plan and to adopt, alter and repeal rules, guidelines and practices relating to our 2013 Plan. Our Committee will have full discretion to administer and interpret the 2013 Plan and to adopt such rules, regulations and procedures as it deems necessary or advisable and to determine, among other things, the time or times at which the awards may be exercised and whether and under what circumstances an award may be exercised.
Eligibility. Our employees, directors, officers, advisors, consultants or affiliates are eligible to participate in the 2013 Plan. Our Committee has the sole and complete authority to determine who will be granted an award under the 2013 Plan, however, it may delegate such authority to one or more of our officers under the circumstances set forth in our 2013 Plan.
Number of Shares Authorized. The 2013 Plan provides for an aggregate amount of no more than shares of common stock to be available for awards. No more than shares of common
112
Table of Contents
stock may be issued upon the exercise of incentive stock options. No single participant may be granted awards of options and stock appreciation rights with respect to more than shares of common stock in any one year. No more than shares of common stock may be granted under our 2013 Plan to any participant during any single year with respect to performance compensation awards in any one performance period. The maximum amount payable pursuant to a cash bonus for an individual employee or officer under our 2013 Plan for any single year during a performance period is $ . If any award is forfeited or if any option terminates, expires or lapses without being exercised, the common stock subject to such award will again be made available for future grant. Shares that are used to pay the exercise price of an option or that are withheld to satisfy a participant’s tax withholding obligation will not be available for re-grant under the 2013 Plan. If there is any change in our corporate capitalization, the Committee will make or recommend to our board of directors for approval substitutions or adjustments to the number of shares reserved for issuance under our 2013 Plan, the number of shares covered by awards then outstanding under our 2013 Plan, the limitations on awards under our 2013 Plan, the exercise price of outstanding options and such other equitable substitution or adjustments as it may determine appropriate in its sole discretion.
The 2013 Plan will have a term of ten years and no further awards may be granted under the 2013 Plan after the expiration of the term.
Awards Available for Grant. The Committee may grant awards of non-qualified stock options, incentive (qualified) stock options, stock appreciation rights, restricted stock awards, restricted stock units, stock bonus awards, dividend equivalents, performance compensation awards (including cash bonus awards) or any combination of the foregoing.
Options. The Committee will be authorized to grant options to purchase shares of common stock that are either “qualified,” meaning they are intended to satisfy the requirements of Section 422 of the Code for incentive stock options, or “non-qualified,” meaning they are not intended to satisfy the requirements of Section 422 of the Code. Options granted under our 2013 Plan will be subject to the terms and conditions established by the Committee. Under the terms of our 2013 Plan, unless the Committee determines otherwise in the case of an option substituted for another option in connection with a corporate transaction, the exercise price of the options will not be less than the fair market value of our common stock at the time of grant. Options granted under the 2013 Plan will be subject to such terms, including the exercise price and the conditions and timing of exercise, as may be determined by our Committee and specified in the applicable award agreement. The maximum term of an option granted under the 2013 Plan will be ten years from the date of grant (or five years in the case of a qualified option granted to a 10% stockholder). Payment in respect of the exercise of an option may be made in cash or by check, by surrender of unrestricted shares (at their fair market value on the date of exercise) that have been held by the participant for any period deemed necessary by our accountants to avoid an additional compensation charge or have been purchased on the open market, or the Committee may, in its discretion and to the extent permitted by law, allow such payment to be made through a broker-assisted cashless exercise mechanism, a net exercise method or by such other method as our Committee may determine to be appropriate. Unless provided otherwise in the option agreement, options will vest in four equal installments on each of the first four anniversaries of the grant date.
Stock Appreciation Rights. Our Committee will be authorized to award stock appreciation rights (“SARs”) under the 2013 Plan. SARs will be subject to the terms and conditions established by the Committee. An SAR is a contractual right that allows a participant to receive, either in the form of cash, shares or any combination of cash and shares, the appreciation, if any, in the value of a share over a certain period of time. An option granted under the 2013 Plan may include SARs and SARs may also be awarded to a participant independent of the grant of an option. SARs granted in connection with an option shall be subject to terms similar to the option corresponding to such SARs. The terms of the
113
Table of Contents
SARs shall be subject to terms established by the Committee and reflected in the award agreement. Unless provided otherwise in the SAR agreement, SARs will vest in four equal installments on each of the first four anniversaries of the grant date.
Restricted Stock. Our Committee will be authorized to award restricted stock under the 2013 Plan. Unless provided otherwise in the award agreement, restrictions on restricted stock will lapse in four equal installments on each of the first four anniversaries of the grant date. The Committee will determine the terms of such restricted stock awards. Restricted stock is common stock that generally is non-transferable and is subject to other restrictions determined by the Committee for a specified period. Unless the Committee determines otherwise or specifies otherwise in an award agreement, if the participant terminates employment or service during the restricted period, then any unvested restricted stock will be forfeited.
Restricted Stock Unit Awards. Our Committee will be authorized to award restricted stock unit awards. Unless provided otherwise in the award agreement, restricted stock units will vest in four equal installments on each of the first four anniversaries of the grant date. The Committee will determine the terms of such restricted stock units. Unless the Committee determines otherwise or specifies otherwise in an award agreement, if the participant terminates employment or service during the period of time over which all or a portion of the units are to be earned, then any unvested units will be forfeited. At the election of the Committee, the participant will receive a number of shares of common stock equal to the number of units earned or an amount in cash equal to the fair market value of that number of shares at the expiration of the period over which the units are to be earned or at a later date selected by the Committee.
Stock Bonus Awards. Our Committee will be authorized to grant awards of unrestricted common stock or other awards denominated in common stock, either alone or in tandem with other awards, under such terms and conditions as the Committee may determine.
Dividend Equivalents. Our Committee will be authorized to grant participants the right to receive the equivalent value (in cash or common stock) of dividends paid to holders of our common stock.
Performance Compensation Awards. The Committee will be authorized to grant any award under the 2013 Plan in the form of a performance compensation award by conditioning the vesting of the award on the satisfaction of certain performance goals. The committee may establish these performance goals with reference to one or more of the following:
| Ÿ | Net earnings or net income (before or after taxes); |
| Ÿ | Basic or diluted earnings per share (before or after taxes); |
| Ÿ | Net revenue or revenue growth; |
| Ÿ | Net interest margin; |
| Ÿ | Operating profit (before or after taxes); |
| Ÿ | Return measures (including, but not limited to, return on assets or equity); |
| Ÿ | Cash flow (including, but not limited to, operating cash flow and free cash flow); |
| Ÿ | Share price (including, but not limited to, growth measures and total stockholder return); |
| Ÿ | Expense targets; |
| Ÿ | Margins; |
| Ÿ | Operating efficiency; |
114
Table of Contents
| Ÿ | Measures of economic value added; |
| Ÿ | Asset quality; |
| Ÿ | Enterprise value; |
| Ÿ | Employee retention; |
| Ÿ | Objective measures of personal targets, goals or completion of projects; |
| Ÿ | Asset growth; |
| Ÿ | Dividend yield; or |
| Ÿ | Any combination of the foregoing. |
Transferability. Each award may be exercised during the participant’s lifetime only by the participant or, if permissible under applicable law, by the participant’s guardian or legal representative and may not be otherwise transferred or encumbered by a participant other than by will or by the laws of descent and distribution. The Committee, however, may permit awards (other than incentive stock options) to be transferred to family equityholders, a trust for the benefit of such family equityholders, a partnership or limited liability company whose partners or stockholders are the participant and his or her family equityholders or anyone else approved by it.
Amendment. Our 2013 Plan will have a term of ten years. Our board of directors may amend, suspend or terminate our 2013 Plan at any time; however, stockholder approval to amend our 2013 Plan may be necessary if the law so requires. No amendment, suspension or termination will impair the rights of any participant or recipient of any award without the consent of the participant or recipient.
Change in Control. In the event of a change in control, the Committee may provide that all outstanding options and equity awards (other than performance compensation awards) issued under the 2013 Plan will become fully vested and that performance compensation awards will vest, as determined by the Committee, based on the level of attainment of the specified performance goals. The Committee may, in its discretion, cancel outstanding awards and pay the value of such awards to the participants in connection with a change in control. The Committee can also provide otherwise in an award agreement under the 2013 Plan.
Under the 2013 Plan, a “change in control” is generally defined as:
| Ÿ | Any person or group becomes the beneficial owner of 50% or more of our voting shares; |
| Ÿ | A change in the composition of our board of directors over a two-year period such that 50% or more of the equityholders of the board of directors were elected through one or more contested elections; |
| Ÿ | A merger, share exchange, consolidation or other business transaction in which we are involved, directly or indirectly, other than a transaction which results in our outstanding voting securities immediately before the transaction continuing to represent a majority of the voting power of the acquiring company’s outstanding voting securities which are held in substantially the same proportions as immediately before the transaction, and after which no person or group beneficially owns 50% or more of the outstanding voting securities of the surviving entity immediately after the transaction and at least a majority of our board of directors following the transaction were equityholders of the incumbent board of directors immediately prior to the transaction; |
| Ÿ | The sale, exchange or transfer of all or substantially all of our assets; |
| Ÿ | The board of directors’ determination that as a consequence of any transaction or event, a change in control has occurred; or |
| Ÿ | Stockholder approval of our liquidation or dissolution. |
115
Table of Contents
In addition, if an award under the 2013 Plan is subject to Section 409A of the Code, a change in control transaction may constitute a payment event only if the transaction is also a “change in control event” for purposes of Section 409A of the Code.
United States Federal Income Tax Consequences
The following is a general summary of the material United States federal income tax consequences of the grant and exercise and vesting of awards under the 2013 Plan and the disposition of shares acquired pursuant to the exercise of such awards and is intended to reflect the current provisions of the Code and the regulations thereunder. This summary is not intended to be a complete statement of applicable law, nor does it address foreign, state, local and payroll tax considerations. Moreover, the United States federal income tax consequences to any particular participant may differ from those described herein by reason of, among other things, the particular circumstances of such participant.
Options. The Code requires that, for treatment of an option as a qualified option, common stock acquired through the exercise of a qualified option cannot be disposed of before the later of (i) two years from the date of grant of the option or (ii) one year from the date of exercise. Holders of qualified options will generally incur no federal income tax liability at the time of grant or upon exercise of those options. However, the spread at exercise will be an “item of tax preference,” which may give rise to “alternative minimum tax” liability for the taxable year in which the exercise occurs. If the holder does not dispose of the shares before two years following the date of grant and one year following the date of exercise, the difference between the exercise price and the amount realized upon disposition of the shares will constitute long-term capital gain or loss, as the case may be. Assuming both holding periods are satisfied, we will not be allowed a deduction for federal income tax purposes in connection with the grant or exercise of the qualified option. If, within two years following the date of grant or within one year following the date of exercise, the holder of shares acquired through the exercise of a qualified option disposes of those shares, the participant will generally realize taxable compensation at the time of such disposition equal to the difference between the exercise price and the lesser of the fair market value of the share on the date of exercise or the amount realized on the subsequent disposition of the shares, and that amount will generally be deductible by us for federal income tax purposes, subject to the possible limitations on deductibility under Sections 280G and 162(m) of the Code for compensation paid to executives designated in those Sections.
Finally, if an otherwise qualified option becomes first exercisable in any one year for shares having an aggregate value in excess of $100,000 (based on the grant date value), the portion of the qualified option in respect of those excess shares will be treated as a non-qualified stock option for federal income tax purposes. No income will be realized by a participant upon grant of a non-qualified stock option. Upon the exercise of a non-qualified stock option, the participant will recognize ordinary compensation income in an amount equal to the excess, if any, of the fair market value of the underlying exercised shares over the option exercise price paid at the time of exercise. We will be able to deduct this same amount for United States federal income tax purposes, but such deduction may be limited under Sections 280G and 162(m) of the Code for compensation paid to certain executives designated in those Sections.
Restricted Stock. A participant will not be subject to tax upon the grant of an award of restricted stock unless the participant otherwise elects to be taxed at the time of grant pursuant to Section 83(b) of the Code. On the date an award of restricted stock becomes transferable or is no longer subject to a substantial risk of forfeiture, the participant will have taxable compensation equal to the difference between the fair market value of the shares on that date over the amount the participant paid for such shares, if any, unless the participant made an election under Section 83(b) of the Code to be taxed at
116
Table of Contents
the time of grant. If the participant made an election under Section 83(b), the participant will have taxable compensation at the time of grant equal to the difference between the fair market value of the shares on the date of grant over the amount the participant paid for such shares, if any. Special rules apply to the receipt and disposition of restricted stock received by officers and directors who are subject to Section 16(b) of the Exchange Act. We will be able to deduct, at the same time as it is recognized by the participant, the amount of taxable compensation to the participant for United States federal income tax purposes, but such deduction may be limited under Sections 280G and 162(m) of the Code for compensation paid to certain executives designated in those Sections.
Restricted Stock Units. A participant will not be subject to tax upon the grant of a restricted stock unit award. Rather, upon the delivery of shares or cash pursuant to a restricted stock unit award, the participant will have taxable compensation equal to the fair market value of the number of shares (or the amount of cash) the participant actually receives with respect to the award. We will be able to deduct the amount of taxable compensation to the participant for United States federal income tax purposes, but the deduction may be limited under Sections 280G and 162(m) of the Code for compensation paid to certain executives designated in those Sections.
SARs. No income will be realized by a participant upon grant of an SAR. Upon the exercise of an SAR, the participant will recognize ordinary compensation income in an amount equal to the fair market value of the payment received in respect of the SAR. We will be able to deduct this same amount for United States federal income tax purposes, but such deduction may be limited under Sections 280G and 162(m) of the Code for compensation paid to certain executives designated in those Sections.
Stock Bonus Awards and Dividend Equivalents. A participant will have taxable compensation equal to the difference between the fair market value of the shares on the date the common stock subject to the award is transferred to the participant over the amount the participant paid for such shares, if any. We will be able to deduct, at the same time as it is recognized by the participant, the amount of taxable compensation to the participant for United States federal income tax purposes, but such deduction may be limited under Sections 280G and 162(m) of the Code for compensation paid to certain executives designated in those Sections. Dividend equivalents are taxable at ordinary income tax rates upon receipt.
Section 162(m). In general, Section 162(m) of the Code denies a publicly held corporation a deduction for United States federal income tax purposes for compensation in excess of $1 million per year per person to its principal executive officer and the three other officers (other than the principal executive officer and principal financial officer) whose compensation is disclosed in its prospectus or proxy statement as a result of their total compensation, subject to certain exceptions. Subject to obtaining approval of the 2013 Plan by our stockholders prior to the payment of any awards thereunder, the 2013 Plan is intended to satisfy an exception with respect to grants of options to covered employees. In addition, the 2013 Plan is designed to permit certain awards of restricted stock, restricted stock units, cash bonus awards and other awards to be awarded as performance compensation awards intended to qualify under the “performance-based compensation” exception to Section 162(m) of the Code.
117
Table of Contents
CERTAIN RELATIONSHIPS AND RELATED PARTY TRANSACTIONS
Stockholders Agreement
In connection with the closing of the Merger on October 13, 2010, we, Holdings and Associated Materials entered into the Stockholders Agreement with the H&F Investors and the Management Investors. We may not issue any equity securities (prior to an initial public offering) without the consent of the H&F Investors and unless the recipient thereof agrees to become a party to the Stockholders Agreement. The Stockholders Agreement contains the following principal provisions:
Board of Directors
The Stockholders Agreement provides that, until an initial public offering of shares of our common stock, the owners of such shares who are parties to the agreement will vote their shares to elect a board of directors comprised of the following persons:
| Ÿ | our Chief Executive Officer (unless otherwise determined in writing by the H&F Investors); and |
| Ÿ | such other directors as shall be designated from time to time by the H&F Investors. |
Following an initial public offering, subject to certain exceptions, the H&F Investors will have the right to nominate a number of persons for election to our board of directors equal to the product (rounded up to the nearest whole number) of: (1) the percentage of outstanding equity securities beneficially owned by the H&F Investors and (2) the number of directors then on the board of directors. In addition, without the consent of the H&F Investors, each stockholder party (other than the H&F Investors) must vote all of his, her or its voting shares in favor of such H&F nominees, and each committee and subcommittee of our board of directors must include an H&F nominee, subject to applicable law and stock exchange rules.
Indemnification
We are generally required to indemnify and hold harmless the H&F Investors, together with each of their respective partners, stockholders, members, affiliates, directors, officers, fiduciaries, employees, managers, controlling persons and agents from any losses arising out of either of the following, subject to limited exceptions:
| Ÿ | an H&F Investor’s or its affiliates’ ownership of our equity interests or other securities or their control of or ability to influence us or any of our subsidiaries; or |
| Ÿ | the business, operations, properties, assets or other rights or liabilities of us or any of our subsidiaries. |
Transfer Restrictions
The Stockholders Agreement contains transfer restrictions applicable to the equity securities held by the H&F Investors and other stockholder parties. In particular, the consent of the H&F Investors is required for all transfers of equity securities by the other stockholder parties, subject to certain exceptions, which include transfers to permitted transferees (i.e., certain affiliates) or transfers in connection with a tag-along or drag- along sale or, in certain circumstances, the exercise of preemptive rights. The transfer restrictions expire on the twelve-month anniversary of an initial public offering.
Registration Rights
Following an initial public offering, the Stockholders Agreement provides the H&F Investors with “demand rights” allowing them to require us to register all or a portion of such number of registrable
118
Table of Contents
securities as they shall designate. In connection with a marketed underwritten offering of our common stock other than an initial public offering, subject to certain exceptions, all stockholder parties will have certain “piggyback” registration rights.
Tag-Along Rights
Under the Stockholders Agreement, in connection with any sale by an H&F Investor constituting not less than 15% of our equity securities, subject to certain exceptions, the other stockholder parties, including H&F Investors not initiating the sale, will have “tag-along” rights that allow them to sell a proportional amount of their equity securities on substantially the same terms as those sold by the selling H&F Investors. The tag-along rights expire on the twelve-month anniversary of an initial public offering.
Drag-Along Rights
Under the Stockholders Agreement, subject to certain exceptions, the H&F Investors have “drag-along” rights that allow them to cause the other stockholder parties to participate in a transaction or transactions involving the transfer of not less than 50% of our equity securities. The drag-along rights expire on the twelve-month anniversary of an initial public offering.
Preemptive Rights
In the event that we issue capital stock outside of specified exempted issuances, unless the H&F Investors have notified us that they will not exercise their preemptive rights, each stockholder party, including the H&F Investors, may purchase up to its pro rata portion of such new securities. The preemptive rights expire upon the consummation of an initial public offering.
Call Rights
Upon termination of a Management Investor’s employment, we will have the right, but not the obligation, to purchase the common stock held by such Management Investor or his, her or its permitted transferee. If, at any time before it terminates, we determine not to exercise such call right, we must promptly notify the H&F Investors, and the H&F Investors will then have the right to exercise such call right in the same manner. The call rights expire upon the consummation of an initial public offering.
Information Rights
Pursuant to the Stockholders Agreement, the H&F Investors and certain of their affiliates are entitled to certain information rights so long as they continue to own shares of our common stock. These information rights include, among other rights, the right to inspect our books and records and receive copies of certain financial and other information, the right to periodically consult with our officers and directors regarding our business and affairs and, in certain circumstances, the right to designate a non-voting board observer who will be entitled to attend all meetings of our board of directors and participate in all deliberations of the board of directors.
Tax Receivable Agreement
Upon the closing of this offering, we intend to enter into a tax receivable agreement with our Pre-IPO Stockholders. The tax receivable agreement will generally provide for the payment by us to our Pre-IPO Stockholders of 85% of the amount of cash savings, if any, in U.S. federal, state and local
119
Table of Contents
income tax that we realize in periods after this offering as a result of the TRA Attributes. At the effective date of the tax receivable agreement, we will recognize this obligation by recording a liability in accordance with GAAP. This liability will be accounted for as a reduction of additional paid-in capital and not impact the income statement. The cash savings generated by our utilization of the TRA Attributes will only result in a benefit to the stockholders purchasing shares in this offering to the extent of our continuing 15% interest in the TRA Attributes. Cash tax savings generally will be computed by comparing our actual federal, state and local income tax liability to the amount of such taxes that we would have been required to pay had such TRA Attributes not been available to us.
The amount and timing of any payments under the tax receivable agreement will vary depending upon a number of factors, including the amount and timing of the taxable income we generate in the future and the tax rate then applicable and our use of NOL carryovers.
The payments we will be required to make under the tax receivable agreement could be substantial. We expect that, as a result of the amount of the NOL carryovers from prior periods (or portions thereof), assuming no material changes in the relevant tax law and that we earn sufficient taxable income to realize in full the potential tax benefit described above, future payments under the tax receivable agreement, in respect of the NOL carryovers, could be up to approximately $ million in the aggregate and would be paid within the next years, assuming that utilization of such tax attributes is not subject to limitation under Section 382 of the Code as the result of an “ownership change” (within the meaning of Section 382 of the Code) of Associated Materials Group, Inc. These amounts reflect only the cash savings attributable to current tax attributes resulting from the NOL carryovers. It is possible that future transactions or events could increase or decrease the actual tax benefits realized from these tax attributes and the corresponding tax receivable agreement payments. We are currently unable to estimate the amount of payments under the tax receivable agreement in respect of deductible expenses attributable to the transactions related to this offering or deductions arising from or attributable to payments under this tax receivable agreement, if any.
The Pre-IPO Stockholders will not reimburse us for any payments previously made if such benefits are subsequently disallowed, however, any excess payments made to the Pre-IPO Stockholders will be netted against payments otherwise to be made, if any, after our determination of such excess. As a result, in such circumstances, we could make payments under the tax receivable agreement that are greater than our actual cash tax savings and may not be able to recoup those payments, which could adversely affect our liquidity.
Because we are a holding company with no operations of our own, our ability to make payments under the tax receivable agreement is dependent on the ability of our subsidiaries to make distributions to us. We expect any such distributions to be funded by net cash provided by operating activities, if any, borrowing capacity under the ABL facilities and current cash and cash equivalents. The ABL facilities and the indenture governing the 9.125% notes may restrict the ability of our subsidiaries to make distributions to us, which could affect our ability to make payments under the tax receivable agreement. Associated Materials Group, Inc. is not subject to the restrictions of the ABL facilities or the 9.125% notes. To the extent that we are unable to make payments under the tax receivable agreement as a result of limitations imposed by any debt instruments to which we or any of our subsidiaries is a party, such payments will be deferred and will accrue interest at a rate of LIBOR plus basis points until paid. To the extent that we are unable to make payments under the tax receivable agreement for any other reason, such payments will be deferred and will accrue interest at a rate of LIBOR plus basis points until paid. In either case, our inability to make payments under the tax receivable agreement could adversely affect our results of operations and could also affect our liquidity in periods in which such payments are made.
In certain cases, payments under the tax receivable agreement to our Pre-IPO Stockholders may be accelerated and/or significantly exceed the actual benefits we realize in respect of the TRA
120
Table of Contents
Attributes. We have the right to terminate the tax receivable agreement early, in which case, our payment and other obligations under the tax receivable agreement will be accelerated and we would be required to make an immediate payment equal to the present value of the anticipated future tax benefits, which upfront payment may be made years in advance of the actual realization of such future benefits. Such payments could be substantial, because they will be based on certain assumptions, and could exceed our actual cash tax savings from the TRA Attributes. In these situations, our obligations under the tax receivable agreement could have a substantial negative impact on our liquidity and could have the effect of delaying, deferring or preventing certain mergers, asset sales, other forms of business combinations or other changes of control. We may not have sufficient cash available or be able to finance our obligations under the tax receivable agreement.
In addition, the tax receivable agreement provides that, upon certain change of control transactions, our or our successor’s obligations with respect to tax benefits would be based on certain assumptions, including that we or our successor would have sufficient taxable income to fully utilize the NOL carryovers covered by the tax receivable agreement. As a result, upon a change of control, we could be required to make payments under the tax receivable agreement that are greater than or less than the specified percentage of our actual cash tax savings.
Agreements Related to the Merger
In connection with the Merger, and in accordance with the amended and restated management agreement entered into in December 2004 between Harvest Partners and our company and the agreement entered into in December 2004 between Harvest Partners and Investcorp International Inc. (“III”), our prior sponsors, which agreement provided that transaction fees would be shared equally between Harvest Partners and III, we paid (1) a transaction fee of $6.5 million and management fees for the remaining term of the amended and restated management agreement, including the cancellation notice period, of $3.2 million to Harvest Partners and (2) a transaction fee of $6.5 million to III. In addition, we paid $1.1 million to H&F in reimbursement for third party transaction related expenses incurred on behalf of Merger Sub primarily related to due diligence activities.
Alix Partners
During the years ended December 29, 2012, December 31, 2011 and January 1, 2011, respectively, we paid Alix Partners, LLP, a former portfolio company of H&F, $0.5 million, $2.9 million and $2.2 million, respectively, in connection with operational improvement projects, including projects related to purchasing, manufacturing, inventory and logistics.
Loan to our Chief Executive Officer
In September 2011, we provided a loan to Mr. Burris in the principal amount of $0.8 million. The loan was granted to Mr. Burris in exchange for a promissory note to repay the principal and interest within a fixed term. A principal payment of $0.1 million was made on March 31, 2012. The promissory note was secured by 220,000 shares of our common stock held by Mr. Burris. The $0.7 million in outstanding principal amount of and accrued interest on the promissory note was repaid in full by Mr. Burris on June 27, 2013, and we will no longer make such loans to Mr. Burris or our other executive officers.
Relocation Arrangements with Certain Executive Officers
On June 17, 2013, a third-party relocation company, acting as our agent, entered into an agreement with Mr. Burris (the “Burris Relocation Agreement”) pursuant to which such relocation
121
Table of Contents
company purchased Mr. Burris’ former primary residence for $1.2 million. The Relocation Agreement was entered into in furtherance of the relocation arrangements in Mr. Burris’ employment agreement, which were entered into to permit Mr. Burris to reside, on a full-time basis, near our corporate headquarters. The purchase price for the residence of $1.2 million was determined based on independent third-party appraisals of the market value of the residence. Pursuant to his employment agreement and the Burris Relocation Agreement, we paid Mr. Burris a make-whole payment of $0.8 million to compensate him for the loss recognized by him on the sale of the residence. See “Executive Compensation—Executive Employment Agreements—Mr. Burris.”
On June 17, 2013, a third-party relocation company, acting as our agent, entered into an agreement with Mr. Morrisroe (the “Morrisroe Relocation Agreement”) pursuant to which such company purchased Mr. Morrisroe’s former primary residence for $0.5 million. The Morrisroe Relocation Agreement was entered into in furtherance of the relocation arrangements in Mr. Morrisroe’s employment agreement, which were entered into to permit Mr. Morrisroe to reside, on a full-time basis, near our corporate headquarters. The purchase price for the residence of $0.5 million was determined based on independent third-party appraisals of the market value of the residence. Pursuant to his employment agreement and the Morrisroe Relocation Agreement, we paid Mr. Morrisroe a make-whole payment of $0.1 million to compensate him for the loss recognized by him on the sale of the residence. See “Executive Compensation—Executive Employment Agreements—Mr. Morrisroe.”
Indemnification of Directors and Officers
We have entered into and plan to enter into in the future indemnification agreements with each of our directors and executive officers. The indemnification agreements provide that we will jointly and severally indemnify each indemnitee to the fullest extent permitted by the Delaware general corporation law from and against all loss and liability suffered and expenses, judgments, fines and amounts paid in settlement actually and reasonably incurred by or on behalf of the indemnitee in connection with any threatened, pending, or completed action, suit or proceeding. Additionally, we will generally advance to the indemnitee all out-of-pocket costs of any type or nature whatsoever incurred in connection therewith.
Our amended and restated limited liability company agreement provides that we will indemnify each of our members, directors and officers to the fullest extent permitted by law for claims arising by reason of the fact that such person is or was a member, director or officer of our company or is or was serving at our request as a director, officer, employee or agent of another corporation, partnership, joint venture, employee benefit plan, trust or other enterprise. See “Description of Capital Stock—Limitations on Liability and Indemnification of Officers and Directors.”
Policies and Procedures for Review and Approval of Related Party Transactions
We have written policies governing conflicts of interest with our employees. In addition, we circulate director and executive officer questionnaires on an annual basis to identify potential conflicts of interest and related party transactions with such directors and officers. Although we do not have a formal process for approving related party transactions, the board of directors as a matter of practice has reviewed all of the transactions described under “Certain Relationships and Related Party Transactions.”
122
Table of Contents
The following table sets forth certain information as of November 15, 2013, regarding the beneficial ownership of us by:
| Ÿ | each person known by us to own beneficially 5% or more of our outstanding voting preferred stock or voting common stock; |
| Ÿ | each of our directors and named executive officers; and |
| Ÿ | our directors and executive officers as a group. |
We determined beneficial ownership in accordance with the rules of the SEC, which generally require inclusion of shares over which a person has voting or investment power. Share ownership in each case includes shares that may be acquired within 60 days as of November 15, 2013 through the exercise of any options or the conversion of convertible debt. None of the shares of our common stock has been pledged as collateral. Except as otherwise indicated, the address for each of the named individuals is c/o Associated Materials Group, Inc., 3773 State Road, Cuyahoga Falls, Ohio 44223.
Percentage of beneficial ownership is based on shares of common stock outstanding as of November 15, 2013 and shares of common stock outstanding immediately after completion of this offering.
| Shares Beneficially Owned Prior to the Offering |
Shares Beneficially Owned After the Offering |
|||||||||||||||||||||||
| If Underwriters’ Option to Purchase Additional Shares is Not Exercised |
If Underwriters’ Option to Purchase Additional Shares is Exercised in Full |
|||||||||||||||||||||||
| Name of Beneficial Owner |
Shares | Percentage | Shares | Percentage | Shares | Percentage | ||||||||||||||||||
| 5% Stockholders: |
||||||||||||||||||||||||
| Investment funds affiliated with Hellman & Friedman LLC(1) |
53,995,660 | 97.0 | % | 53,995,660 | % | 53,995,660 | % | |||||||||||||||||
| Executive Officers and Directors: |
||||||||||||||||||||||||
| Jerry W. Burris(2) |
834,504 | 1.5 | % | 834,504 | * | 834,504 | * | |||||||||||||||||
| Paul Morrisroe(3) |
64,000 | * | 64,000 | * | 64,000 | * | ||||||||||||||||||
| Robert C. Gaydos(4) |
144,000 | * | 144,000 | * | 144,000 | * | ||||||||||||||||||
| James Kenyon(5) |
87,000 | * | 87,000 | * | 87,000 | * | ||||||||||||||||||
| Ken James |
— | — | — | — | — | — | ||||||||||||||||||
| Dave S. Nagle(6) |
64,000 | * | 64,000 | * | 64,000 | * | ||||||||||||||||||
| Brad S. Beard(7) |
176,218 | * | 176,218 | * | 176,218 | * | ||||||||||||||||||
| Dave King(8) |
222,292 | * | 222,292 | * | 222,292 | * | ||||||||||||||||||
| Erik D. Ragatz(1) |
— | — | — | — | — | — | ||||||||||||||||||
| Lawrence M. Blackburn(9) |
18,000 | * | 18,000 | * | 18,000 | * | ||||||||||||||||||
| Charles A. Carroll(10) |
548,000 | * | 548,000 | * | 548,000 | * | ||||||||||||||||||
| Dana R. Snyder(11) |
112,958 | * | 112,958 | * | 112,958 | * | ||||||||||||||||||
| Robert B. Henske(1) |
— | — | — | — | — | — | ||||||||||||||||||
| Adam B. Durrett(1) |
— | — | — | — | — | — | ||||||||||||||||||
| All directors and executive officers as a group (14 persons)(12) |
2,270,972 | 4.0 | % | 2,270,972 | % | 2,270,972 | % | |||||||||||||||||
| * | Indicates ownership of less than 1%. |
| (1) | Hellman & Friedman Capital Partners VI, L.P. (“HFCP VI”), Hellman & Friedman Capital Partners VI (Parallel), L.P. (“HFCP VI (Parallel)”), Hellman & Friedman Capital Executives VI, L.P. (“HFCE VI”) and Hellman & Friedman Capital Associates VI, L.P. (“HFCA VI,” and together with HFCP VI, HFCP VI (Parallel) and HFCE VI, the “H&F Entities”) beneficially own 53,995,660 shares of our common stock. The address for each of the H&F Entities is c/o Hellman & Friedman LLC, One Maritime Plaza, 12th Floor, San Francisco, CA 94111. Such shares of our common stock are owned of record by HFCP VI, which owns 42,584,221 shares, HFCP VI (Parallel), which owns 11,179,259 shares, HFCE VI, which owns 176,025 shares, and HFCA VI, which owns 56,155 |
123
Table of Contents
| shares. Hellman & Friedman Investors VI, L.P. (“H&F Investors VI”) is the general partner of each of the H&F Entities. Hellman & Friedman LLC (“H&F”) is the general partner of H&F Investors VI. As the general partner of H&F Investors VI, H&F may be deemed to have beneficial ownership of the shares over which any of the H&F Entities has voting or dispositive power. An investment committee of H&F has sole voting and dispositive control over such shares of our common stock. Messrs. Ragatz and Henske serve as Managing Directors of Hellman & Friedman, but none of them serves on the investment committee. Each of the members of the investment committee, as well as Messrs. Ragatz, Henske and Durrett, disclaim beneficial ownership of such shares of our common stock, except to the extent of their respective pecuniary interest therein. |
| (2) | Includes 614,504 shares of our common stock issuable pursuant to options that are exercisable as of or within 60 days of November 15, 2013. |
| (3) | Includes 64,000 shares of our common stock issuable pursuant to options that are exercisable as of or within 60 days of November 15, 2013. |
| (4) | Includes 144,000 shares of our common stock issuable pursuant to options that are exercisable as of or within 60 days of November 15, 2013. |
| (5) | Includes 60,000 shares of our common stock issuable pursuant to options that are exercisable as of or within 60 days of November 15, 2013 and 21,600 shares of restricted stock that have not vested. |
| (6) | Includes 64,000 shares of our common stock issuable pursuant to options that are exercisable as of or within 60 days of November 15, 2013. |
| (7) | Includes 176,218 shares of our common stock issuable pursuant to options that are exercisable as of or within 60 days of November 15, 2013. |
| (8) | Includes 176,218 shares of our common stock issuable pursuant to options that are exercisable as of or within 60 days of November 15, 2013. |
| (9) | Includes 18,000 shares of restricted stock that have not vested. |
| (10) | Includes 30,000 shares of restricted stock that have not vested. |
| (11) | Includes 12,000 shares of restricted stock and 18,000 deferred stock units that have not vested. |
| (12) | Includes 1,298,940 shares of our common stock issuable pursuant to options that are exercisable as of or within 60 days of November 15, 2013 and 81,600 shares of restricted stock and 18,000 deferred stock units that have not vested. |
124
Table of Contents
9.125% notes
In October 2010, Associated Materials and AMH New Finance, Inc. (collectively, the “Issuers”) issued and sold $730.0 million of the 9.125% notes (the “existing notes”). The existing notes bear interest at a rate of 9.125% per annum. Interest payments are remitted on a semi-annual basis on May 1 and November 1 of each year.
On May 1, 2013, the Issuers issued and sold $100.0 million in aggregate principal amount of additional 9.125% notes (the “new notes” and, together with the existing notes, the “notes”) at an issue price of 106.00% of the principal amount of the new notes in a private placement (the “offering”). On September 30, 2013, the Issuers offered to exchange up to $100.0 million aggregate principal amount of 9.125% Senior Secured Notes due 2017 and the related guarantees (the “exchange notes”), which have been registered under the Securities Act for any and all of the new notes. All of the new notes were exchanged for exchange notes on October 31, 2013.
We used the net proceeds of the offering to repay outstanding borrowings under our ABL facilities, including the prepayment and termination of our existing tranche B revolving credit commitments, thereby reducing our total credit commitment by $12.0 million to $213.0 million, and for other general corporate purposes. The new notes were issued as additional notes under the Indenture. The new notes are consolidated with and form a single class with the existing notes and have the same terms as to status, redemption, collateral and otherwise (other than issue date, issue price and first interest payment date) as the existing notes.
The 9.125% notes have an estimated fair value, classified as Level 1, of $887.1 million (at carrying value of $830.0 million) and $742.8 million (at carrying value of $730.0 million) based on quoted market prices as of September 28, 2013 and December 29, 2012, respectively.
Guarantees
The notes are unconditionally guaranteed, jointly and severally, by each of the Issuers’ direct and indirect domestic subsidiaries (“guarantors”) that guarantee our obligations under the ABL facilities.
Collateral
The notes and the guarantees are secured by a first-priority lien on substantially all of the Issuers’ and the guarantors’ present and future assets located in the U.S. (other than the ABL collateral, in which the notes and the guarantees have a second-priority lien, and certain other excluded assets), including equipment, owned real property valued at $5.0 million or more and all present and future shares of capital stock of each of the Issuers’ and each guarantor’s material directly 100% owned domestic subsidiaries and 65% of the present and future shares of capital stock, of each of the Issuers’ and each guarantor’s directly owned foreign restricted subsidiaries (other than Canadian subsidiaries), in each case subject to certain exceptions and customary permitted liens. In addition, the notes and the guarantees are secured by a second-priority lien on substantially all of the Issuers’ and the guarantors’ present and future assets, which assets also secure the Issuers’ obligations under the ABL facilities, including accounts receivable, inventory, related general intangibles, certain other related assets and the proceeds thereof.
Optional Redemption
The Issuers have the option to redeem the notes, in whole or in part, at any time on or after November 1, 2013 at redemption prices (expressed as percentages of principal amount of the notes to be redeemed) of 106.844%, 104.563%, 102.281% and 100.000% during the 12-month periods
125
Table of Contents
commencing on November 1, 2013, 2014, 2015 and 2016, respectively, plus accrued and unpaid interest thereon, if any, to, but excluding, the applicable redemption date. Prior to November 1, 2013, the Issuers may redeem the notes, in whole or in part, at a redemption price equal to 100% of the principal amount thereof plus a make-whole premium. In addition, prior to November 1, 2013, the Issuers may on one or more occasions redeem up to 35% of the aggregate principal amount of the notes from the net cash proceeds of one or more equity offerings (to the extent such net cash proceeds are received by or contributed to us) at a redemption price equal to 109.125% of the aggregate principal amount thereof, plus accrued and unpaid interest thereon, if any, to, but excluding, the applicable redemption date; provided that (a) at least 50% of the sum of the aggregate principal amount of notes originally issued under the Indenture remains outstanding immediately after the occurrence of each such redemption and (b) that each such redemption occurs within 120 days of the date of closing of each such equity offering. In addition, during any 12-month period prior to November 1, 2013, the Issuers may redeem up to 10% of the aggregate principal amount of the notes issued under the Indenture at a redemption price equal to 103.000% of the principal amount thereof plus accrued and unpaid interest thereon, if any, to, but excluding, the applicable redemption date.
Change of Control
Upon the occurrence of a change of control, as defined in the Indenture, the Issuers must give holders of notes the opportunity to sell the Issuers their notes at 101% of their face amount, plus accrued and unpaid interest, if any, to, but excluding, the repurchase date.
Covenants
The Indenture contains covenants limiting the Issuers’ ability and the ability of their restricted subsidiaries to, among other things: pay dividends or distributions, repurchase equity, prepay junior debt and make certain investments; incur additional debt or issue certain disqualified stock and preferred stock; incur liens on assets; merge or consolidate with another company or sell all or substantially all assets; enter into transactions with affiliates; and enter into agreements that would restrict our subsidiaries to pay dividends or make other payments to us. These covenants are subject to important exceptions and qualifications as described in the Indenture. Most of these covenants will cease to apply if, for so long as, the notes have investment grade ratings from both Moody’s Investors Service, Inc. and Standard & Poor’s.
ABL Facilities
On April 18, 2013, Associated Materials, Holdings, certain direct or indirect wholly owned U.S. and Canadian restricted subsidiaries of Associated Materials designated as a borrower or guarantor under the revolving credit agreement governing the ABL facilities, certain of the lenders party to the revolving credit agreement governing the ABL facilities, UBS AG, Stamford Branch and UBS AG Canada Branch, as administrative and collateral agents, and Wells Fargo Capital Finance, LLC, as co-collateral agent, amended and restated the revolving credit agreement governing the ABL facilities in the amount of $225.0 million (comprised of a $150.0 million U.S. facility and a $75.0 million Canadian facility) pursuant to a revolving credit agreement maturing on the date that is the earlier of (i) April 18, 2018 and (ii) 90 days prior to the maturity date of the existing notes. The $150.0 million U.S. facility consisted of $141.5 million of U.S. tranche A revolving credit commitments and $8.5 million of U.S. tranche B revolving credit commitments. The $75.0 million Canadian facility consisted of $71.5 million of Canadian tranche A revolving credit commitments and $3.5 million of Canadian tranche B revolving credit commitments. During the nine months ended September 28, 2013, Associated Materials terminated the tranche B revolving credit commitments of $12.0 million in accordance with the Amended and Restated Revolving Credit Agreement and wrote off $0.5 million of deferred financing fees related to the ABL facilities.
126
Table of Contents
As of September 28, 2013, there was $1.0 million drawn under the Amended and Restated Revolving Credit Agreement and $182.0 million available for additional borrowings. The weighted average per annum interest rate applicable to borrowings under the U.S. portion of the ABL facilities was 4.3% as of September 28, 2013. Associated Materials had letters of credit outstanding of $11.0 million as of September 28, 2013 primarily securing deductibles of insurance policy, certain lease facilities and purchasing card program.
Interest Rate and Fees
At Associated Materials’ option, the U.S. and Canadian tranche A revolving credit loans under the Amended and Restated Revolving Credit Agreement governing the ABL facilities bear interest at the rate equal to (1) LIBOR (for eurodollar loans under the U.S. facility) or CDOR (for loans under the Canadian facility), plus an applicable margin of 2.00%, or (2) the alternate base rate (for alternate base rate loans under the U.S. facility, which is the highest of a prime rate, the Federal Funds Effective Rate plus 0.50% and a one-month LIBOR rate plus 1.0% per annum) or the alternate Canadian base rate (for loans under the Canadian facility, which is the higher of a Canadian prime rate and the 30-day CDOR Rate plus 1.0%), plus an applicable margin of 1.00%, in each case, which interest rate margin may vary in 25 basis point increments between three pricing levels determined by reference to the average excess availability in respect of the U.S. and Canadian tranche A revolving credit loans. In addition to paying interest on outstanding principal under the ABL facilities, Associated Materials is required to pay a commitment fee in respect of the U.S. and Canadian tranche A revolving credit loans, payable quarterly in arrears, of 0.375%.
Borrowing Base
Availability under the U.S. and Canadian facilities are subject to a borrowing base, which is based on eligible accounts receivable and inventory of certain of our U.S. subsidiaries and eligible accounts receivable, inventory and, with respect to the Canadian tranche A revolving credit loans, equipment and real property, of certain of Associated Materials’ Canadian subsidiaries, after adjusting for customary reserves established or modified from time to time by and at the permitted discretion of the administrative agent thereunder. To the extent that eligible accounts receivable, inventory, equipment and real property decline, the borrowing base will decrease and the availability under the ABL facilities may decrease below $213.0 million. In addition, if the amount of outstanding borrowings and letters of credit under the U.S. and Canadian facilities exceeds the borrowing base or the aggregate revolving credit commitments, Associated Materials is required to prepay borrowings to eliminate the excess.
Guarantors
All obligations under the U.S. facility are guaranteed by each existing and subsequently acquired direct and indirect wholly owned material U.S. restricted subsidiary of Associated Materials and the direct parent of Associated Materials, other than certain excluded subsidiaries (“U.S. guarantors”). All obligations under the Canadian facility are guaranteed by each existing and subsequently acquired direct and indirect wholly owned material Canadian restricted subsidiary of Associated Materials, other than certain excluded subsidiaries (“Canadian guarantors,” and together with U.S. guarantors, “ABL guarantors”) and the U.S. guarantors.
Security
The U.S. security agreement provides that all obligations of the U.S. borrowers and the U.S. guarantors are secured by a first-priority perfected security interest in substantially all of the present and future property and assets of Associated Materials, including a first priority security interest in the capital stock of Associated Materials and a second-priority security interest in the capital stock of each direct, material wholly owned restricted subsidiary of Associated Materials. The Canadian security agreement provides that all obligations of the Canadian borrowers and the Canadian guarantors are
127
Table of Contents
secured by the U.S. ABL collateral and a first-priority perfected security interest in substantially all of Associated Materials’ Canadian assets, including a first priority security interest in the capital stock of the Canadian borrowers and each direct, material wholly owned restricted subsidiary of the Canadian borrowers and Canadian guarantors.
Covenants, Representations and Warranties
The Amended and Restated Revolving Credit Agreement contains customary representations and warranties and customary affirmative and negative covenants, including, with respect to negative covenants, among other things, restrictions on indebtedness, liens, investments, fundamental changes, asset sales, dividends and other distributions, prepayments or redemption of junior debt, transactions with affiliates and negative pledge clauses. There are no financial covenants included in the Amended and Restated Revolving Credit Agreement, other than a springing fixed charge coverage ratio of at least 1.00 to 1.00, which will be tested only when excess availability is less than the greater of (i) 10.0% of the sum of (x) the lesser of (A) the U.S. tranche A borrowing base and (B) the U.S. tranche A revolving credit commitments and (y) the lesser of (A) the Canadian tranche A borrowing base and (B) the Canadian tranche A revolving credit commitments and (ii) $20.0 million for a period of five consecutive business days until the 30th consecutive day when excess availability exceeds the above threshold.
128
Table of Contents
General
In connection with this offering, we will amend and restate our certificate of incorporation and our bylaws. The following is a description of the material terms of our amended and restated certificate of incorporation and amended and restated bylaws, each of which will be in effect upon the consummation of this offering, the forms of which are filed as exhibits to the registration statement of which this prospectus is a part.
Our purpose is to engage in any lawful act or activity for which corporations may now or hereafter be organized under the General Corporation Law of the State of Delaware (the “DGCL”). Upon the consummation of this offering, our authorized capital stock will consist of shares of common stock, par value $0.01 per share, and shares of preferred stock, par value $0.01 per share. No shares of preferred stock will be issued or outstanding immediately after the public offering contemplated by this prospectus. Unless our board of directors determines otherwise, we will issue all shares of our capital stock in uncertificated form.
Common Stock
Holders of our common stock are entitled to one vote for each share held of record on all matters on which stockholders are entitled to vote generally, including the election or removal of directors. The holders of our common stock do not have cumulative voting rights in the election of directors.
Upon our liquidation, dissolution or winding up and after payment in full of all amounts required to be paid to creditors and to the holders of preferred stock having liquidation preferences, if any, the holders of our common stock will be entitled to receive pro rata our remaining assets available for distribution. Holders of our common stock do not have preemptive, subscription, redemption or conversion rights. The common stock will not be subject to further calls or assessment by us. There will be no redemption or sinking fund provisions applicable to the common stock. All shares of our common stock that will be outstanding at the time of the completion of the offering will be fully paid and non-assessable. The rights, powers, preferences and privileges of holders of our common stock will be subject to those of the holders of any shares of our preferred stock we may authorize and issue in the future.
Preferred Stock
Our amended and restated certificate of incorporation authorizes our board of directors to establish one or more series of preferred stock (including convertible preferred stock). Unless required by law or by the NYSE or Nasdaq, as applicable, the authorized shares of preferred stock will be available for issuance without further action by you. Our board of directors is authorized to determine, with respect to any series of preferred stock, the powers (including voting powers), preferences and relative, participating, optional and other special rights, and the qualifications, limitations or restrictions thereof, including, without limitation:
| Ÿ | the designation of the series; |
| Ÿ | the number of shares of the series, which our board of directors may, except where otherwise provided in the preferred stock designation, increase (but not above the total number of authorized shares of the class) or decrease (but not below the number of shares then outstanding); |
| Ÿ | whether dividends, if any, will be cumulative or non-cumulative and the dividend rate of the series; |
| Ÿ | the dates at which dividends, if any, will be payable; |
129
Table of Contents
| Ÿ | redemption rights and price or prices, if any, for shares of the series; |
| Ÿ | the terms and amounts of any sinking fund provided for the purchase or redemption of shares of the series; |
| Ÿ | the amounts payable on shares of the series in the event of any voluntary or involuntary liquidation, dissolution or winding-up of the affairs of our company; |
| Ÿ | whether the shares of the series will be convertible into shares of any other class or series of the stock of our company, or any other security of our company or any other entity, and, if so, the specification of the other class or series or other security, the conversion price or prices or rate or rates, any rate adjustments, the date or dates as of which the shares will be convertible and all other terms and conditions upon which the conversion may be made; |
| Ÿ | restrictions on the issuance of shares of the same series or of any other class or series; and |
| Ÿ | the voting rights, if any, of the holders of the series. |
We could issue a series of preferred stock that could, depending on the terms of the series, impede or discourage an acquisition attempt or other transaction that some, or a majority, of the holders of our common stock might believe to be in their best interests or in which the holders of our common stock might receive a premium for their common stock over the market price of the common stock. Additionally, the issuance of preferred stock may adversely affect the holders of our common stock, including, without limitation, by restricting dividends on the common stock, diluting the voting power of the common stock or subordinating the liquidation rights of the common stock. As a result of these or other factors, the issuance of preferred stock could have an adverse impact on the market price of our common stock.
Dividends
The DGCL permits a corporation to declare and pay dividends out of “surplus” or, if there is no “surplus,” out of its net profits for the fiscal year in which the dividend is declared and/or the preceding fiscal year. “Surplus” is defined as the excess of the net assets of the corporation over the amount determined to be the capital of the corporation by the board of directors. The capital of the corporation is typically calculated to be (and cannot be less than) the aggregate par value of all issued shares of capital stock. Net assets equals the fair value of the total assets minus total liabilities. The DGCL also provides that dividends may not be paid out of net profits if, after the payment of the dividend, remaining capital would be less than the capital represented by the outstanding stock of all classes having a preference upon the distribution of assets.
Declaration and payment of any dividend will be subject to the discretion of our board of directors. The time and amount of such dividends, if any, will be dependent upon our financial condition, operations, compliance with applicable law, cash requirements and availability, debt repayment obligations, capital expenditure needs and restrictions in our debt instruments, contractual restrictions, business prospects, industry trends, the provisions of Delaware law affecting the payment of distributions to stockholders and any other factors our board of directors may consider relevant.
We have never declared or paid any dividends on our common stock and do not expect to declare or pay any dividends on our common stock in the foreseeable future. In addition, our ability to pay dividends on our common stock is limited by the covenants of our ABL facility and the Indenture and may be further restricted by the terms of any future debt or preferred securities. See “Dividend Policy” and “Description of Indebtedness.”
130
Table of Contents
Annual Stockholder Meetings
Our amended and restated certificate of incorporation and our amended and restated bylaws provide that annual stockholder meetings will be held at a date, time and place, if any, as exclusively selected by our board of directors. To the extent permitted under applicable law, we may conduct meetings by remote communications, including by webcast.
Effects of Our Amended and Restated Certificate of Incorporation and Amended and Restated Bylaws and Certain Provisions of Delaware Law
Our amended and restated certificate of incorporation, amended and restated bylaws and the DGCL contain provisions, which are summarized in the following paragraphs, that are intended to enhance the likelihood of continuity and stability in the composition of our board of directors. These provisions are intended to avoid costly takeover battles, reduce our vulnerability to a hostile change of control and enhance the ability of our board of directors to maximize stockholder value in connection with any unsolicited offer to acquire us. However, these provisions may have the effect of delaying, deterring or preventing a merger or acquisition of our company by means of a tender offer, a proxy contest or other takeover attempt that a stockholder might consider in its best interest, including attempts that might result in a premium over the prevailing market price for the shares of common stock held by stockholders.
Authorized but Unissued Capital Stock
Delaware law does not require stockholder approval for any issuance of authorized shares. However, the listing requirements of the NYSE or Nasdaq, as applicable, which would apply if and so long as our common stock remains listed on the NYSE or Nasdaq, as applicable, require stockholder approval of certain issuances equal to or exceeding 20% of the then outstanding voting power or then outstanding number of shares of common stock. Additional shares that may be used in the future may be used for a variety of corporate purposes, including future public offerings, to raise additional capital or to facilitate acquisitions.
Our board of directors may generally issue preferred shares on terms calculated to discourage, delay or prevent a change of control of our company or the removal of our management. Moreover, our authorized but unissued shares of preferred stock will be available for future issuances without stockholder approval and could be utilized for a variety of corporate purposes, including future offerings to raise additional capital, to facilitate acquisitions and employee benefit plans.
One of the effects of the existence of unissued and unreserved common stock or preferred stock may be to enable our board of directors to issue shares to persons friendly to current management, which issuance could render more difficult or discourage an attempt to obtain control of our company by means of a merger, tender offer, proxy contest or otherwise, and thereby protect the continuity of our management and possibly deprive our stockholders of opportunities to sell their shares of common stock at prices higher than prevailing market prices.
Classified Board of Directors
Our amended and restated certificate of incorporation provides that our board of directors will be divided into three classes of directors, with the classes to be as nearly equal in number as possible, and with the directors serving three-year terms. As a result, approximately one-third of our board of directors will be elected each year. The classification of directors will have the effect of making it more difficult for stockholders to change the composition of our board of directors. Our amended and restated certificate of incorporation and amended and restated bylaws provide that, subject to any
131
Table of Contents
rights of holders of preferred stock to elect additional directors under specified circumstances, the number of directors will be fixed from time to time exclusively pursuant to a resolution adopted by the board of directors.
Business Combinations
We have opted out of Section 203 of the DGCL; however, our amended and restated certificate of incorporation contains similar provisions providing that we may not engage in certain “business combinations” with any “interested stockholder” for a three-year period following the time that the stockholder became an interested stockholder, unless:
| Ÿ | prior to such time, our board of directors approved either the business combination or the transaction which resulted in the stockholder becoming an interested stockholder; |
| Ÿ | upon consummation of the transaction which resulted in the stockholder becoming an interested stockholder, the interested stockholder owned at least 85% of our voting stock outstanding at the time the transaction commenced, excluding certain shares; or |
| Ÿ | at or subsequent to that time, the business combination is approved by our board of directors and by the affirmative vote of holders of at least 66 2/3% of our outstanding voting stock that is not owned by the interested stockholder. |
Generally, a “business combination” includes a merger, asset or stock sale or other transaction resulting in a financial benefit to the interested stockholder. Subject to certain exceptions, an “interested stockholder” is a person who, together with that person’s affiliates and associates, owns, or within the previous three years owned, 15% or more of our outstanding voting stock. For purposes of this section only, “voting stock” has the meaning given to it in Section 203 of the DGCL.
Under certain circumstances, this provision will make it more difficult for a person who would be an “interested stockholder” to effect various business combinations with our company for a three-year period. This provision may encourage companies interested in acquiring our company to negotiate in advance with our board of directors because the stockholder approval requirement would be avoided if our board of directors approves either the business combination or the transaction which results in the stockholder becoming an interested stockholder. These provisions also may have the effect of preventing changes in our board of directors and may make it more difficult to accomplish transactions which stockholders may otherwise deem to be in their best interests.
Our amended and restated certificate of incorporation provides that the H&F Investors, and any of their respective direct or indirect transferees and any group as to which such persons are a party, do not constitute “interested stockholders” for purposes of this provision.
Removal of Directors; Vacancies
Under the DGCL, unless otherwise provided in our amended and restated certificate of incorporation, directors serving on a classified board may be removed by the stockholders only for cause. Our amended and restated certificate of incorporation provides that directors may be removed with or without cause upon the affirmative vote of a majority in voting power of all outstanding shares of stock entitled to vote thereon, voting together as a single class; provided, however, at any time when the H&F Investors beneficially own, in the aggregate, less than 40% in voting power of the stock of our company entitled to vote generally in the election of directors, directors may only be removed for cause, and only by the affirmative vote of holders of at least 66 2/3% in voting power of all the then-outstanding shares of stock of our company entitled to vote thereon, voting together as a single class. In addition, our amended and restated certificate of incorporation also provides that, subject to the rights granted to one or more series of preferred stock then outstanding or the rights granted under the
132
Table of Contents
Stockholders Agreement with the H&F Investors, any newly created directorship on the board of directors that results from an increase in the number of directors and any vacancies on our board of directors will be filled only by the affirmative vote of a majority of the remaining directors, even if less than a quorum, by a sole remaining director or by the stockholders; provided, however, at any time when the H&F Investors beneficially own, in the aggregate, less than 40% in voting power of the stock of our company entitled to vote generally in the election of directors, any newly created directorship on the board of directors that results from an increase in the number of directors and any vacancy occurring in the board of directors may only be filled by a majority of the directors then in office, although less than a quorum, or by a sole remaining director (and not by the stockholders). Our amended and restated certificate of incorporation provides that the board of directors may increase the number of directors by the affirmative vote of a majority of the directors or, at any time when the H&F Investors beneficially own, in the aggregate, at least 40% of the voting power of the stock of our company entitled to vote generally in the election of directors, of the stockholders.
No Cumulative Voting
Under Delaware law, the right to vote cumulatively does not exist unless the certificate of incorporation specifically authorizes cumulative voting. Our amended and restated certificate of incorporation does not authorize cumulative voting. Therefore, stockholders holding a majority in voting power of the shares of our stock entitled to vote generally in the election of directors will be able to elect all our directors.
Special Stockholder Meetings
Our amended and restated certificate of incorporation provides that special meetings of our stockholders may be called at any time only by or at the direction of the board of directors or the chairman of the board of directors; provided, however, at any time when the H&F Investors beneficially own, in the aggregate, at least 40% in voting power of the stock of our company entitled to vote generally in the election of directors, special meetings of our stockholders shall also be called by the board of directors or the chairman of the board of directors at the request of the H&F Investors. Our amended and restated bylaws prohibit the conduct of any business at a special meeting other than as specified in the notice for such meeting. These provisions may have the effect of deferring, delaying or discouraging hostile takeovers, or changes in control or management of our company.
Requirements for Advance Notification of Director Nominations and Stockholder Proposals
Our amended and restated bylaws establish advance notice procedures with respect to stockholder proposals and the nomination of candidates for election as directors, other than nominations made by or at the direction of the board of directors or a committee of the board of directors. In order for any matter to be properly brought before a meeting of our stockholders, a stockholder will have to comply with advance notice requirements and provide us with certain information. Generally, to be timely, a stockholder’s notice must be received at our principal executive offices not less than 90 days nor more than 120 days prior to the first anniversary date of the immediately preceding annual meeting of stockholders. Our amended and restated bylaws also specify requirements as to the form and content of a stockholder’s notice. Our amended and restated bylaws allow the chairman of the meeting at a meeting of the stockholders to adopt rules and regulations for the conduct of meetings which may have the effect of precluding the conduct of certain business at a meeting if the rules and regulations are not followed. These provisions will not apply to the H&F Investors so long as the Stockholders Agreement remains in effect. See “Certain Relationships and Related Party Transactions—Stockholders Agreement.” These provisions may also deter, delay or discourage a potential acquirer from conducting a solicitation of proxies to elect the acquirer’s own slate of directors or otherwise attempting to influence or obtain control of our company.
133
Table of Contents
Stockholder Action by Written Consent
Pursuant to Section 228 of the DGCL, any action required to be taken at any annual or special meeting of the stockholders may be taken without a meeting, without prior notice and without a vote if a consent or consents in writing, setting forth the action so taken, is signed by the holders of outstanding stock having not less than the minimum number of votes that would be necessary to authorize or take such action at a meeting at which all shares of our stock entitled to vote thereon were present and voted, unless our amended and restated certificate of incorporation provides otherwise. Our amended and restated certificate of incorporation will preclude stockholder action by written consent at any time when the H&F Investors beneficially own, in the aggregate, less than 40% in voting power of the stock of our company entitled to vote generally in the election of directors.
Supermajority Provisions
Our amended and restated certificate of incorporation and amended and restated bylaws will provide that the board of directors is expressly authorized to make, alter, amend, change, add to, rescind or repeal, in whole or in part, our bylaws without a stockholder vote in any matter not inconsistent with the laws of the State of Delaware or our amended and restated certificate of incorporation. For as long as the H&F Investors beneficially own, in the aggregate, at least 40% in voting power of the stock of our company entitled to vote generally in the election of directors, any amendment, alteration, rescission or repeal of our bylaws by our stockholders will require the affirmative vote of a majority in voting power of the outstanding shares of our stock present in person or represented by proxy at the meeting of stockholders and entitled to vote on such amendment, alteration, change, addition, rescission or repeal. At any time when the H&F Investors beneficially own, in the aggregate, less than 40% in voting power of all outstanding shares of the stock of our company entitled to vote generally in the election of directors, any amendment, alteration, rescission or repeal of our bylaws by our stockholders will require the affirmative vote of the holders of at least 66 2/3% in voting power of all the then-outstanding shares of stock of our company entitled to vote thereon, voting together as a single class.
The DGCL provides generally that the affirmative vote of a majority of the outstanding shares entitled to vote thereon, voting together as a single class, is required to amend a corporation’s certificate of incorporation, unless the certificate of incorporation requires a greater percentage.
Our amended and restated certificate of incorporation provides that at any time when the H&F Investors beneficially own, in the aggregate, less than 40% in voting power of the stock of our company entitled to vote generally in the election of directors, the following provisions in our amended and restated certificate of incorporation may be amended, altered, repealed or rescinded only by the affirmative vote of the holders of at least 66 2/3% in voting power of all the then-outstanding shares of stock of our company entitled to vote thereon, voting together as a single class:
| Ÿ | the provision requiring a 66 2/3% supermajority vote for stockholders to amend our amended and restated bylaws; |
| Ÿ | the provisions providing for a classified board of directors (the election and term of our directors); |
| Ÿ | the provisions regarding resignation and removal of directors; |
| Ÿ | the provisions regarding competition and corporate opportunities; |
| Ÿ | the provisions regarding entering into business combinations with interested stockholders; |
| Ÿ | the provisions regarding stockholder action by written consent; |
| Ÿ | the provisions regarding calling special meetings of stockholders; |
134
Table of Contents
| Ÿ | the provisions regarding filling vacancies on our board of directors and newly created directorships; |
| Ÿ | the provisions eliminating monetary damages for breaches of fiduciary duty by a director; and |
| Ÿ | the amendment provision requiring that the above provisions be amended only with a 66 2/3% supermajority vote. |
The combination of the classification of our board of directors, the lack of cumulative voting and the supermajority voting requirements will make it more difficult for our existing stockholders to replace our board of directors as well as for another party to obtain control of us by replacing our board of directors. Because our board of directors has the power to retain and discharge our officers, these provisions could also make it more difficult for existing stockholders or another party to effect a change in management.
These provisions may have the effect of deterring hostile takeovers or delaying or preventing changes in control of our management or our company, such as a merger, reorganization or tender offer. These provisions are intended to enhance the likelihood of continued stability in the composition of our board of directors and its policies and to discourage certain types of transactions that may involve an actual or threatened acquisition of our company. These provisions are designed to reduce our vulnerability to an unsolicited acquisition proposal. The provisions are also intended to discourage certain tactics that may be used in proxy fights. However, such provisions could have the effect of discouraging others from making tender offers for our shares and, as a consequence, they also may inhibit fluctuations in the market price of our shares that could result from actual or rumored takeover attempts. Such provisions may also have the effect of preventing changes in management of our company.
Dissenters’ Rights of Appraisal and Payment
Under the DGCL, with certain exceptions, our stockholders will have appraisal rights in connection with a merger or consolidation of us. Pursuant to the DGCL, stockholders who properly request and perfect appraisal rights in connection with such merger or consolidation will have the right to receive payment of the fair value of their shares as determined by the Delaware Court of Chancery.
Stockholders’ Derivative Actions
Under the DGCL, any of our stockholders may bring an action in our name to procure a judgment in our favor, also known as a derivative action, provided that the stockholder bringing the action is a holder of our shares at the time of the transaction to which the action relates or such stockholder’s stock thereafter devolved by operation of law.
Exclusive Forum
Our amended and restated certificate of incorporation will provide that unless we consent to the selection of an alternative forum, the Court of Chancery of the State of Delaware shall, to the fullest extent permitted by law, be the sole and exclusive forum for any (i) derivative action or proceeding brought on behalf of our company, (ii) action asserting a claim of breach of a fiduciary duty owed by any director or officer of our company to our company or our company’s stockholders, creditors or other constituents, (iii) action asserting a claim against our company or any director or officer of our company arising pursuant to any provision of the DGCL or our amended and restated certificate of incorporation or our amended and restated bylaws, or (iv) action asserting a claim against our company or any director or officer of our company governed by the internal affairs doctrine, in each such case subject to said Court of Chancery having personal jurisdiction over the indispensable parties
135
Table of Contents
named as defendants therein. Any person or entity purchasing or otherwise acquiring any interest in shares of capital stock of our company shall be deemed to have notice of and consented to the forum provisions in our amended and restated certificate of incorporation. However, the enforceability of similar forum provisions in other companies’ certificates of incorporation has been challenged in legal proceedings, and it is possible that a court could find these types of provisions to be unenforceable.
Conflicts of Interest
Delaware law permits corporations to adopt provisions renouncing any interest or expectancy in certain opportunities that are presented to the corporation or its officers, directors or stockholders. Our amended and restated certificate of incorporation will, to the maximum extent permitted from time to time by Delaware law, renounce any interest or expectancy that we have in, or right to be offered an opportunity to participate in, specified business opportunities that are from time to time presented to our officers, directors or stockholders or their respective affiliates, other than those officers, directors, stockholders or affiliates who are our or our subsidiaries’ employees. Our amended and restated certificate of incorporation will provide that, to the fullest extent permitted by law, none of the H&F Investors or any director who is not employed by us (including any non-employee director who serves as one of our officers in both his director and officer capacities) or his or her affiliates will have any duty to refrain from (i) engaging in a corporate opportunity in the same or similar business activities or lines of business in which we or our affiliates now engage or propose to engage or (ii) otherwise competing with us or our affiliates. In addition, to the fullest extent permitted by law, in the event that the H&F Investors or any non-employee director acquires knowledge of a potential transaction or other business opportunity which may be a corporate opportunity for itself or himself or its or his affiliates or for us or our affiliates, such person will have no duty to communicate or offer such transaction or business opportunity to us or any of our affiliates and they may take any such opportunity for themselves or offer it to another person or entity. Our amended and restated certificate of incorporation will not renounce our interest in any business opportunity that is expressly offered to a non-employee director solely in his or her capacity as a director or officer of our company. To the fullest extent permitted by law, no business opportunity will be deemed to be a potential corporate opportunity for us unless we would be permitted, to undertake the opportunity under our amended and restated certificate of incorporation, we have sufficient financial resources to undertake the opportunity and the opportunity would be in line with our business.
Limitations on Liability and Indemnification of Officers and Directors
The DGCL authorizes corporations to limit or eliminate the personal liability of directors to corporations and their stockholders for monetary damages for breaches of directors’ fiduciary duties, subject to certain exceptions. Our amended and restated certificate of incorporation includes a provision that eliminates the personal liability of directors for monetary damages for any breach of fiduciary duty as a director, except to the extent such exemption from liability or limitation thereof is not permitted under the DGCL. The effect of these provisions is to eliminate the rights of us and our stockholders, through stockholders’ derivative suits on our behalf, to recover monetary damages from a director for breach of fiduciary duty as a director, including breaches resulting from grossly negligent behavior. However, exculpation does not apply to any director if the director has acted in bad faith, knowingly or intentionally violated the law, authorized illegal dividends or redemptions or derived an improper benefit from his or her actions as a director.
Our amended and restated bylaws provide that we must indemnify and advance expenses to our directors and officers to the fullest extent authorized by the DGCL. We also are expressly authorized to carry directors’ and officers’ liability insurance providing indemnification for our directors, officers and certain employees for some liabilities. We believe that these indemnification and advancement provisions and insurance are useful to attract and retain qualified directors and executive officers.
136
Table of Contents
The limitation of liability, indemnification and advancement provisions in our amended and restated certificate of incorporation and amended and restated bylaws may discourage stockholders from bringing a lawsuit against directors for breach of their fiduciary duty. These provisions also may have the effect of reducing the likelihood of derivative litigation against directors and officers, even though such an action, if successful, might otherwise benefit us and our stockholders. In addition, any investment in our common stock may be adversely affected to the extent we pay the costs of settlement and damage awards against directors and officers pursuant to these indemnification provisions.
We currently are party to indemnification agreements with certain of our directors and officers. These agreements require us to indemnify these individuals to the fullest extent permitted under Delaware law against liabilities that may arise by reason of their service to us, and to advance expenses incurred as a result of any proceeding against them as to which they could be indemnified.
There is currently no pending material litigation or proceeding involving any of our directors, officers or employees for which indemnification is sought.
Transfer Agent and Registrar
The transfer agent and registrar for our common stock is .
Listing
We intend to apply to have our shares of common stock listed on the NYSE or Nasdaq, as applicable, under the symbol “ .”
137
Table of Contents
SHARES ELIGIBLE FOR FUTURE SALE
General
Prior to this offering, there has not been a public market for our common stock, and we cannot predict what effect, if any, market sales of shares of common stock or the availability of shares of common stock for sale will have on the market price of our common stock prevailing from time to time. Nevertheless, sales of substantial amounts of common stock, including shares issued upon the exercise of outstanding options, in the public market, or the perception that such sales could occur, could materially and adversely affect the market price of our common stock and could impair our future ability to raise capital through the sale of our equity or equity-related securities at a time and price that we deem appropriate. See “Risk Factors—Risks Related to this Offering and Ownership of Our Common Stock—Future sales, or the perception of future sales, by us or our existing stockholders in the public market following this offering could cause the market price for our common stock to decline.”
Upon the consummation of this offering, we will have shares of common stock outstanding. All shares sold in this offering will be freely tradable without registration under the Securities Act and without restriction by persons other than our “affiliates” (as defined under Rule 144). The shares of common stock held by the H&F Investors and certain of our directors, officers and employees after this offering, will be “restricted” securities under the meaning of Rule 144 and may not be sold in the absence of registration under the Securities Act, unless an exemption from registration is available, including the exemptions pursuant to Rule 144 under the Securities Act.
The restricted shares held by our affiliates will be available for sale in the public market at various times after the date of this prospectus pursuant to Rule 144 following the expiration of the applicable lock-up period.
In addition, a total of shares of our common stock has been reserved for issuance under our 2013 Plan (subject to adjustments for stock splits, stock dividends and similar events), which will equal approximately % of the shares of our common stock outstanding immediately following this offering. We intend to file one or more registration statements on Form S-8 under the Securities Act to register common stock issued or reserved for issuance under our 2013 Plan. Any such Form S-8 registration statement will automatically become effective upon filing. Accordingly, shares registered under such registration statement will be available for sale in the open market, unless such shares are subject to vesting restrictions or the lock-up restrictions described below.
Rule 144
In general, under Rule 144, as currently in effect, a person (or persons whose shares are aggregated) who is not deemed to be or have been one of our affiliates for purposes of the Securities Act at any time during 90 days preceding a sale and who has beneficially owned the shares proposed to be sold for at least six months, including the holding period of any prior owner other than an affiliate, is entitled to sell such shares without registration, subject to compliance with the public information requirements of Rule 144. If such a person has beneficially owned the shares proposed to be sold for at least one year, including the holding period of a prior owner other than an affiliate, then such person is entitled to sell such shares without complying with any of the requirements of Rule 144.
138
Table of Contents
In general, under Rule 144, as currently in effect, our affiliates or persons selling shares on behalf of our affiliates, who have met the six month holding period for beneficial ownership of “restricted shares” of our common stock, are entitled to sell within any three-month period, a number of shares that does not exceed the greater of:
| Ÿ | 1% of the number of shares of our common stock then outstanding, which will equal approximately shares immediately after this offering; or |
| Ÿ | the average reported weekly trading volume of our common stock on the NYSE or Nasdaq, as applicable, during the four calendar weeks preceding the filing of a notice on Form 144 with respect to such sale. |
Sales under Rule 144 by our affiliates or persons selling shares on behalf of our affiliates are also subject to certain manner of sale provisions and notice requirements and to the availability of current public information about us. The sale of these shares, or the perception that sales will be made, could adversely affect the price of our common stock after this offering because a great supply of shares would be, or would be perceived to be, available for sale in the public market.
Rule 701
In general, under Rule 701 of the Securities Act as currently in effect, any of our employees, consultants or advisors who purchase shares from us in connection with a compensatory stock or option plan or other written agreement in a transaction that was completed in reliance on Rule 701 and complied with the requirements of Rule 701 will be eligible to resell such shares 90 days after the effective date of this offering in reliance on Rule 144, but without compliance with certain restrictions, including the holding period, contained in Rule 144.
Lock-Up Agreements
In connection with this offering, we, our officers, directors and all significant equity holders have agreed with the underwriters, subject to certain exceptions, not to sell, dispose of or hedge any shares of our common stock or securities convertible into or exchangeable for shares of common stock during the period ending 180 days after the date of this prospectus, except with the prior written consent of the representatives of the underwriters.
Immediately following the consummation of this offering, equity holders subject to lock-up agreements will hold shares of our common stock, representing approximately % of our then outstanding shares of common stock, or approximately % if the underwriters exercise their option to purchase additional shares in full.
We have agreed not to issue, sell or otherwise dispose of any shares of our common stock during the 180-day period following the date of this prospectus (subject to certain extensions). We may, however, grant options to purchase shares of common stock, issue shares of common stock upon the exercise of outstanding options, issue shares of common stock in connection with an acquisition or business combination and in certain other circumstances.
The 180-day restricted period described in the preceding paragraphs will be automatically ex-tended if (i) during the last 17 days of the 180-day restricted period we issue an earnings release or announce material news or a material event relating to us occurs or (ii) prior to the expiration of the 180-day restricted period, we announce that we will release earnings results during the 15-day period beginning on the last day of the 180-day restricted period, in which case the restrictions described in the pre-ceding paragraph will continue to apply until the expiration of the 18-day period beginning on the issuance of the earnings release or the announcement of the material news or material event.
139
Table of Contents
Registration Rights
Pursuant to our Stockholders Agreement, we have granted the H&F Investors the right to cause us, subject to certain conditions, at our expense, to file registration statements under the Securities Act covering resales of our common stock held by them. Following completion of this offering, the shares covered by such registration rights would represent approximately % of our outstanding common stock (or %, if the underwriters exercise in full their option to purchase additional shares). These shares also may be sold under Rule 144 under the Securities Act, depending on their holding period and subject to restrictions in the case of shares held by persons deemed to be our affiliates. For a description of rights H&F and certain equity holders of H&F have to require us to register the shares of common stock they own, see “Certain Relationships and Related Party Transactions—Stockholders Agreement.”
140
Table of Contents
CERTAIN U.S. FEDERAL INCOME AND
ESTATE TAX CONSEQUENCES TO NON-U.S. HOLDERS
The following is a summary of certain U.S. federal income and estate tax consequences to a non-U.S. holder (as defined below) of the purchase, ownership and disposition of our common stock as of the date hereof. Except where noted, this summary deals only with common stock purchased in this offering that is held as a capital asset.
A “non-U.S. holder” means a beneficial owner of our common stock (other than a partnership) that is not, for U.S. federal income tax purposes any of the following:
| Ÿ | an individual who is a citizen or resident of the U.S.; |
| Ÿ | a corporation (or any other entity treated as a corporation for U.S. federal income tax purposes) created or organized in or under the laws of the U.S., any state thereof or the District of Columbia; |
| Ÿ | an estate the income of which is subject to U.S. federal income taxation regardless of its source; or |
| Ÿ | a trust if it (1) is subject to the primary supervision of a court within the U.S. and one or more U.S. persons have the authority to control all substantial decisions of the trust or (2) has a valid election in effect under applicable U.S. Treasury regulations to be treated as a U.S. person. |
This summary is based upon provisions of the Code and Treasury regulations, rulings and judicial decisions, all as of the date hereof. Those authorities may be changed or subject to different interpretations, perhaps retroactively, so as to result in U.S. federal income and estate tax consequences different from those summarized below. We cannot provide any assurance that a change in law will not alter significantly the tax considerations that we describe in this summary.
This summary does not address all aspects of U.S. federal income and estate taxes and does not deal with other U.S. federal taxes (such as gift tax or the Medicare contribution tax), or with foreign, state, or local tax considerations or other tax considerations that may be relevant to non-U.S. holders in light of their particular circumstances. In addition, it does not represent a detailed description of the U.S. federal income tax consequences applicable to you if you are subject to special treatment under the U.S. federal income tax laws (including if you are a U.S. expatriate, a bank or other financial institution, an insurance company, a tax exempt organization, a trader, broker or dealer in securities or currencies, a “controlled foreign corporation,” a “passive foreign investment company,” a partnership or other pass-through entity for U.S. federal income tax purposes (or an investor in such pass-through entity) or a person who has acquired shares of our common stock as part of a straddle, hedge, conversion transaction or other integrated investment).
If an entity treated as a partnership for U.S. federal income tax purposes holds our common stock, the tax treatment of a partner will generally depend upon the status of the partner and the activities of the partnership. If you are a partner of a partnership considering an investment in our common stock, you should consult your own tax advisors.
If you are considering the purchase of our common stock, you should consult your own tax advisors concerning the particular U.S. federal income and estate tax consequences to you of the ownership of the common stock, as well as the consequences to you arising under other U.S. federal tax laws and the laws of any other taxing jurisdiction.
141
Table of Contents
Dividends
Dividends paid to a non-U.S. holder of our common stock generally will be subject to U.S. federal withholding tax at a 30% rate or such lower rate as may be specified by an applicable income tax treaty. However, dividends that are effectively connected with the conduct of a trade or business by the non-U.S. holder within the U.S. (and, if required by an applicable income tax treaty, are attributable to a U.S. permanent establishment) are not subject to the withholding tax, provided certain certification and disclosure requirements are satisfied. Instead, such dividends are generally subject to U.S. federal income tax on a net income basis in the same manner as if the non-U.S. holder were a U.S. person as defined under the Code. Any such effectively connected dividends received by a foreign corporation may be subject to an additional “branch profits tax” at a 30% rate or such lower rate as may be specified by an applicable income tax treaty.
A non-U.S. holder of our common stock who wishes to claim the benefit of an applicable treaty rate and avoid backup withholding, as discussed below, for dividends will be required (a) to complete Internal Revenue Service Form W-8BEN (or other applicable form) and certify under penalty of perjury that such holder is not a U.S. person as defined under the Code and is eligible for treaty benefits or (b) if our common stock is held through certain foreign intermediaries, to satisfy the relevant certification requirements of applicable U.S. Treasury regulations. Special certification and other requirements apply to certain non-U.S. holders that are pass-through entities rather than corporations or individuals.
A non-U.S. holder of our common stock eligible for a reduced rate of U.S. federal withholding tax pursuant to an income tax treaty may obtain a refund of any excess amounts withheld by timely filing an appropriate claim for refund with the Internal Revenue Service.
Gain on Disposition of Common Stock
Subject to the discussions of backup withholding and additional withholding requirements below, any gain realized on the disposition of our common stock generally will not be subject to U.S. federal income tax unless:
| Ÿ | the gain is effectively connected with a trade or business of the non-U.S. holder in the U.S. (and, if required by an applicable income tax treaty, is attributable to a U.S. permanent establishment of the non-U.S. holder); |
| Ÿ | the non-U.S. holder is an individual who is present in the U.S. for 183 days or more in the taxable year of that disposition, and certain other conditions are met; or |
| Ÿ | we are or have been a “U.S. real property holding corporation” for U.S. federal income tax purposes. |
An individual non-U.S. holder described in the first bullet point immediately above generally will be subject to tax on the net gain derived from the sale under regular graduated U.S. federal income tax rates. An individual non-U.S. holder described in the second bullet point immediately above will be subject to a flat 30% tax on any gain derived from the sale, which may be offset by U.S. source capital losses, even though the individual is not considered a resident of the U.S. If a non-U.S. holder that is a foreign corporation falls under the first bullet point immediately above, it will be subject to tax on its net gain in the same manner as if it were a U.S. person as defined under the Code and, in addition, may be subject to the branch profits tax equal to 30% of its effectively connected earnings and profits or at such lower rate as may be specified by an applicable income tax treaty.
We believe we are not and do not anticipate becoming a “United States real property holding corporation” for U.S. federal income tax purposes. If we are or become a “United States real property
142
Table of Contents
holding corporation,” so long as our common stock continues to be regularly traded on an established securities market, only a non-U.S. holder who holds or held (at any time during the shorter of the five year period preceding the date of disposition or the holder’s holding period) more than 5% of our common stock will be subject to U.S. federal income tax on the disposition of our common stock.
Federal Estate Tax
Common stock held (or deemed to be held) by an individual non-U.S. holder at the time of death will be included in such holder’s gross estate for U.S. federal estate tax purposes, unless an applicable estate tax treaty provides otherwise.
Information Reporting and Backup Withholding
We must report annually to the Internal Revenue Service and to each non-U.S. holder the amount of dividends paid to such holder and the tax withheld with respect to such dividends, regardless of whether withholding was required. Copies of the information returns reporting such dividends and withholding may also be made available to the tax authorities in the country in which the non-U.S. holder resides under the provisions of an applicable income tax treaty.
A non-U.S. holder may be subject to backup withholding for dividends paid to such holder unless such holder certifies under penalty of perjury that it is a non-U.S. holder (and the payor does not have actual knowledge or reason to know that such holder is a U.S. person as defined under the Code), or such holder otherwise establishes an exemption.
Information reporting and, depending on the circumstances, backup withholding may apply to the proceeds of a sale of our common stock within the U.S. or conducted through certain U.S.-related financial intermediaries, unless the beneficial owner certifies under penalty of perjury that it is a non-U.S. holder (and the payor does not have actual knowledge or reason to know that the beneficial owner is a U.S. person as defined under the Code), or such owner otherwise establishes an exemption.
Backup withholding is not an additional tax. Any amounts withheld under the backup withholding rules may be allowed as a refund or a credit against a non-U.S. holder’s U.S. federal income tax liability provided the required information is timely furnished to the Internal Revenue Service.
Additional Withholding Requirements
Under legislation enacted in 2010 the regulations thereunder and administrative guidance, a 30% U.S. federal withholding tax may apply to any dividends paid after June 30, 2014, and the gross proceeds from a sale or other disposition of our common stock occurring after December 31, 2016, in each case paid to (i) a “foreign financial institution” (as specifically defined in the regulations), whether such foreign financial institution is the beneficial owner or an intermediary, unless such foreign financial institution agrees to verify, report and disclose its U.S. “account” holders (as specifically defined in the regulations) and meets certain other specified requirements or (ii) a non-financial foreign entity, whether such non-financial foreign entity is the beneficial owner or an intermediary, unless such entity provides a certification that the beneficial owner of the payment does not have any “substantial U.S. owners” (as specifically defined in the regulations) or provides the name, address and taxpayer identification number of each such substantial U.S. owner and certain other specified requirements are met. In certain cases, the relevant foreign financial institution or non-financial foreign entity may qualify for an exemption from, or be deemed to be in compliance with, these rules. You should consult your own tax advisor regarding this legislation and whether it may be relevant to your ownership and disposition of our common stock.
143
Table of Contents
We and the underwriters named below have entered into an underwriting agreement with respect to the shares being offered. Subject to certain conditions, each underwriter has severally agreed to purchase the number of shares indicated in the following table. Goldman, Sachs & Co., Barclays Capital Inc. and UBS Securities LLC are the representatives of the underwriters.
| Underwriters |
Number of Shares | |
| Goldman, Sachs & Co |
||
| Barclays Capital Inc. |
||
| UBS Securities LLC |
||
| Deutsche Bank Securities Inc. |
||
|
| ||
| Total |
||
|
|
The underwriters are committed to take and pay for all of the shares being offered, if any are taken, other than the shares covered by the option described below unless and until this option is exercised.
The underwriters have an option to buy up to an additional shares from us. They may exercise that option for 30 days. If any shares are purchased pursuant to this option, the underwriters will severally purchase shares in approximately the same proportion as set forth in the table above.
The following tables show the per share and total underwriting discounts and commissions to be paid to the underwriters by us. Such amounts are shown assuming both no exercise and full exercise of the underwriters’ option to purchase additional shares.
| Underwriting Discounts and Commissions |
No Exercise | Full Exercise | ||||||
| Per Share |
$ | $ | ||||||
| Total |
$ | $ | ||||||
Shares sold by the underwriters to the public will initially be offered at the initial public offering price set forth on the cover of this prospectus. Any shares sold by the underwriters to securities dealers may be sold at a discount of up to $ per share from the initial public offering price. After the initial offering of the shares, the representatives may change the offering price and the other selling terms. The offering of the shares by the underwriters is subject to receipt and acceptance and subject to the underwriters’ right to reject any order in whole or in part.
We and our officers, directors and holders of substantially all of our common stock have agreed with the underwriters, subject to certain exceptions, not to dispose of or hedge any of their common stock or securities convertible into or exchangeable for shares of common stock during the period from the date of this prospectus continuing through the date 180 days after the date of this prospectus, except with the prior written consent of Goldman, Sachs & Co. and Barclays Capital Inc. See “Shares Eligible for Future Sale” for a discussion of certain transfer restrictions.
The 180-day restricted period described in the preceding paragraph will be automatically extended if: (1) during the last 17 days of the 180-day restricted period we issue an earnings release or announce material news or a material event; or (2) prior to the expiration of the 180-day restricted period, we announce that we will release earnings results during the 15-day period following the last day of the 180-day period, in which case the restrictions described in the preceding paragraph will continue to apply until the expiration of the 18-day period beginning on the issuance of the earnings release of the announcement or the material news or material event.
144
Table of Contents
Prior to the offering, there has been no public market for the shares. The initial public offering price has been negotiated among us and the representatives. Among the factors to be considered in determining the initial public offering price of the shares, in addition to prevailing market conditions, will be our historical performance, estimates of our business potential and earnings prospects, an assessment of our management and the consideration of the above factors in relation to market valuation of companies in related businesses.
We intend to apply to have our shares of common stock listed on the NYSE or Nasdaq, as applicable, under the symbol “ .” In order to meet one of the requirements for listing the common stock on the NYSE or Nasdaq, as applicable, the underwriters have undertaken to sell lots of 100 or more shares to a minimum of 400 beneficial owners.
In connection with the offering, the underwriters may purchase and sell shares of common stock in the open market. These transactions may include short sales, stabilizing transactions and purchases to cover positions created by short sales. Short sales involve the sale by the underwriters of a greater number of shares than they are required to purchase in the offering, and a short position represents the amount of such sales that have not been covered by subsequent purchases. A “covered short position” is a short position that is not greater than the amount of additional shares for which the underwriters’ option described above may be exercised. The underwriters may cover any covered short position by either exercising their option to purchase additional shares or purchasing shares in the open market. In determining the source of shares to cover the covered short position, the underwriters will consider, among other things, the price of shares available for purchase in the open market as compared to the price at which they may purchase additional shares pursuant to the option described above. “Naked” short sales are any short sales that create a short position greater than the amount of additional shares for which the option described above may be exercised. The underwriters must cover any such naked short position by purchasing shares in the open market. A naked short position is more likely to be created if the underwriters are concerned that there may be downward pressure on the price of the common stock in the open market after pricing that could adversely affect investors who purchase in the offering. Stabilizing transactions consist of various bids for or purchases of common stock made by the underwriters in the open market prior to the completion of the offering.
The underwriters may also impose a penalty bid. This occurs when a particular underwriter repays to the underwriters a portion of the underwriting discount received by it because the representatives have repurchased shares sold by or for the account of such underwriter in stabilizing or short covering transactions.
Purchases to cover a short position and stabilizing transactions, as well as other purchases by the underwriters for their own accounts, may have the effect of preventing or retarding a decline in the market price of our stock, and together with the imposition of the penalty bid, may stabilize, maintain or otherwise affect the market price of the common stock. As a result, the price of the common stock may be higher than the price that otherwise might exist in the open market. The underwriters are not required to engage in these activities and may end any of these activities at any time. These transactions may be effected on the NYSE or Nasdaq, as applicable, in the over-the-counter market or otherwise.
Expenses and Indemnification
We estimate that the total expenses of the offering, excluding underwriting discounts and commissions, will be approximately $ million and are payable by us. The underwriters have agreed to reimburse us for certain expenses up to a maximum of $ in the aggregate in connection with the offering.
145
Table of Contents
We have agreed to indemnify the several underwriters against certain liabilities, including liabilities under the Securities Act.
Relationship with Solebury Capital LLC
Pursuant to an engagement agreement, we retained Solebury Capital LLC (“Solebury”) a Financial Industry Regulatory Authority (“FINRA”) member, to provide certain financial consulting services (which do not include underwriting services) in connection with this offering. We agreed to pay Solebury, only upon successful completion of this offering, a fee of up to $ . We also agreed to reimburse Solebury for reasonable and documented out-of-pocket expenses up to a maximum of $25,000 and have provided indemnification of Solebury pursuant to the engagement agreement. Solebury’s services include advice with respect to selection of underwriters for this offering, deal structuring, fee and economics recommendations, distribution strategy recommendations and preparation of presentation materials. Solebury is not acting as an underwriter and has no contact with any public or institutional investor on behalf of us or the underwriter. In addition, Solebury will not underwrite or purchase any of our common stock in this offering or otherwise participate in any such undertaking.
Discretionary Sales
The underwriters have informed us that they do not intend to confirm sales to discretionary accounts that exceed 5% of the total number of shares offered by them.
Other Relationships
The underwriters and their respective affiliates are full service financial institutions engaged in various activities, which may include sales and trading, commercial and investment banking, advisory, investment management, investment research, principal investment, hedging, market making, brokerage and other financial and non-financial activities and services. Certain of the underwriters and their respective affiliates have provided, and may in the future provide, a variety of these services to us and to persons and entities with relationships with us, for which they received or will receive customary fees and expenses. In particular, certain of the underwriters and/or their affiliates hold a position in our 9.125% notes and, in the connection with the redemption of the 9.125% notes with proceeds from this offering, will receive a pro rata portion of the net proceeds of this offering.
In the ordinary course of their various business activities, the underwriters and their respective affiliates, officers, directors and employees may purchase, sell or hold a broad array of investments and actively trade securities, derivatives, loans, commodities, currencies, credit default swaps and other financial instruments for their own account and for the accounts of their customers, and such investment and trading activities may involve or relate to our assets, securities and/or instruments (directly, as collateral securing other obligations or otherwise) and/or persons and entities with relationships with us. The underwriters and their respective affiliates may also communicate independent investment recommendations, market color or trading ideas and/or publish or express independent research views in respect of such assets, securities or instruments and may at any time hold, or recommend to clients that they should acquire, long and/or short positions in such assets, securities and instruments.
Selling Restrictions
European Economic Area
In relation to each Member State of the European Economic Area which has implemented the Prospectus Directive (each, a “Relevant Member State”), with effect from and including the date on which the Prospectus Directive is implemented in that Relevant Member State, no offer of shares may be made to the public in that Relevant Member State other than:
(a) to any legal entity which is a qualified investor as defined in the Prospectus Directive;
146
Table of Contents
(b) to fewer than 100, or, if the Relevant Member State has implemented the relevant portion of the 2010 PD Amending Directive, 150 natural or legal persons (other than qualified investors as defined in the Prospectus Directive), as permitted under the Prospectus Directive, subject to obtaining the prior consent of the representative;
(c) in any other circumstances falling within Article 3(2) of the Prospectus Directive, provided that no such offer of shares shall require the company or the representatives to publish a prospectus pursuant to Article 3 of the Prospectus Directive or supplement a prospectus pursuant to Article 16 of the Prospectus Directive.
For the purposes of this provision, the expression an “offer of shares to the public” in relation to any shares in any Relevant Member State means the communication in any form and by any means of sufficient information on the terms of the offer and the shares to be offered so as to enable an investor to decide to purchase or subscribe the shares, as the same may be varied in that Relevant Member State by any measure implementing the Prospectus Directive in that Relevant Member State and the expression Prospectus Directive means Directive 2003/71/EC (including the 2010 PD Amending Directive, to the extent implemented in the Relevant Member State) and includes any relevant implementing measure in each Relevant Member State and the expression “2010 PD Amending Directive” means Directive 2010/73/EU.
United Kingdom
This prospectus and any other material in relation to the shares described herein is only being distributed to, and is only directed at, persons in the United Kingdom that are qualified investors within the meaning of Article 2(1)(e) of the Prospective Directive (“qualified investors”) that also (i) have professional experience in matters relating to investments falling within Article 19(5) of the Financial Services and Markets Act 2000 (Financial Promotion) Order 2005, as amended (the “Order”), (ii) who fall within Article 49(2)(a) to (d) of the Order or (iii) to whom it may otherwise lawfully be communicated (all such persons together being referred to as “relevant persons”). The shares are only available to, and any invitation, offer or agreement to purchase or otherwise acquire such shares will be engaged in only with, relevant persons. This prospectus and its contents are confidential and should not be distributed, published or reproduced (in whole or in part) or disclosed by recipients to any other person in the United Kingdom. Any person in the United Kingdom that is not a relevant person should not act or rely on this prospectus or any of its contents.
Hong Kong
The shares may not be offered or sold by means of any document other than (i) in circumstances which do not constitute an offer to the public within the meaning of the Companies Ordinance (Cap.32, Laws of Hong Kong), or (ii) to “professional investors” within the meaning of the Securities and Futures Ordinance (Cap.571, Laws of Hong Kong) and any rules made thereunder, or (iii) in other circumstances which do not result in the document being a “prospectus” within the meaning of the Companies Ordinance (Cap.32, Laws of Hong Kong), and no advertisement, invitation or document relating to the shares may be issued or may be in the possession of any person for the purpose of issue (in each case whether in Hong Kong or elsewhere), which is directed at, or the contents of which are likely to be accessed or read by, the public in Hong Kong (except if permitted to do so under the laws of Hong Kong) other than with respect to shares which are or are intended to be disposed of only to persons outside Hong Kong or only to “professional investors” within the meaning of the Securities and Futures Ordinance (Cap. 571, Laws of Hong Kong) and any rules made thereunder.
Singapore
This prospectus has not been registered as a prospectus with the Monetary Authority of Singapore. Accordingly, this prospectus and any other document or material in connection with the
147
Table of Contents
offer or sale, or invitation for subscription or purchase, of the shares may not be circulated or distributed, nor may the shares be offered or sold, or be made the subject of an invitation for subscription or purchase, whether directly or indirectly, to persons in Singapore other than (i) to an institutional investor under Section 274 of the Securities and Futures Act, Chapter 289 of Singapore (the “SFA”), (ii) to a relevant person, or any person pursuant to Section 275(1A), and in accordance with the conditions, specified in Section 275 of the SFA or (iii) otherwise pursuant to, and in accordance with the conditions of, any other applicable provision of the SFA.
Where the shares are subscribed or purchased under Section 275 by a relevant person which is: (a) a corporation (which is not an accredited investor) the sole business of which is to hold investments and the entire share capital of which is owned by one or more individuals, each of whom is an accredited investor; or (b) a trust (where the trustee is not an accredited investor) whose sole purpose is to hold investments and each beneficiary is an accredited investor, shares, debentures and units of shares and debentures of that corporation or the beneficiaries’ rights and interest in that trust shall not be transferable for six months after that corporation or that trust has acquired the shares under Section 275 except: (1) to an institutional investor under Section 274 of the SFA or to a relevant person, or any person pursuant to Section 275(1A), and in accordance with the conditions, specified in Section 275 of the SFA; (2) where no consideration is given for the transfer; or (3) by operation of law.
Japan
The securities have not been and will not be registered under the Financial Instruments and Exchange Law of Japan (the Financial Instruments and Exchange Law) and each underwriter has agreed that it will not offer or sell any securities, directly or indirectly, in Japan or to, or for the benefit of, any resident of Japan (which term as used herein means any person resident in Japan, including any corporation or other entity organized under the laws of Japan), or to others for re-offering or resale, directly or indirectly, in Japan or to a resident of Japan, except pursuant to an exemption from the registration requirements of, and otherwise in compliance with, the Financial Instruments and Exchange Law and any other applicable laws, regulations and ministerial guidelines of Japan.
148
Table of Contents
The validity of the shares of common stock offered by this prospectus will be passed upon for us by Simpson Thacher & Bartlett LLP, Palo Alto, California. Certain legal matters relating to this offering will be passed upon for the underwriters by Cahill Gordon & Reindel LLP, New York, New York.
The consolidated financial statements of Associated Materials Group, Inc. as of December 29, 2012 and December 31, 2011, and for the years ended December 29, 2012 and December 31, 2011, the successor period October 13, 2010 to January 1, 2011 and the predecessor period January 3, 2010 to October 12, 2010 included elsewhere in this prospectus, and the related financial statement schedule included in the registration statement of which this prospectus forms a part, have been audited by Deloitte & Touche LLP, an independent registered public accounting firm, as stated in their reports appearing herein. Such consolidated financial statements and financial statement schedule have been so included in reliance upon the reports of such firm given upon their authority as experts in accounting and auditing.
WHERE YOU CAN FIND ADDITIONAL INFORMATION
We have filed with the SEC a registration statement on Form S-1 under the Securities Act with respect to the common stock offered by this prospectus. This prospectus is a part of the registration statement and does not contain all of the information set forth in the registration statement and its exhibits and schedules, portions of which have been omitted as permitted by the rules and regulations of the SEC. For further information about us and our common stock, you should refer to the registration statement and its exhibits and schedules.
We will file annual, quarterly and special reports and other information with the SEC. Our filings with the SEC will be available to the public on the SEC’s website at http://www.sec.gov. Those filings will also be available to the public on, or accessible through, our website under the heading “Investor Relations” at www.associatedmaterials.com. The information we file with the SEC or contained on or accessible through our corporate website or any other website that we may maintain is not part of this prospectus or the registration statement of which this prospectus is a part. You may also read and copy, at SEC prescribed rates, any document we file with the SEC, including the registration statement (and its exhibits) of which this prospectus is a part, at the SEC’s Public Reference Room located at 100 F Street, N.E., Washington D.C. 20549. You can call the SEC at 1-800-SEC-0330 to obtain information on the operation of the Public Reference Room.
149
Table of Contents
INDEX TO CONSOLIDATED FINANCIAL STATEMENTS
| Page | ||||
| Consolidated Financial Statements as of December 29, 2012 and December 31, 2011 and for the Years Ended December 29, 2012 and December 31, 2011, the Successor Period October 13, 2010 to January 1, 2011 and the Predecessor Period January 3, 2010 to October 12, 2010 |
||||
| F-2 | ||||
| F-3 | ||||
| F-4 | ||||
| F-5 | ||||
| F-6 | ||||
| F-7 | ||||
| F-8 | ||||
| Condensed Consolidated Financial Statements as of September 28, 2013 and December 29, 2012 and for the Nine Months Ended September 28, 2013 and September 29, 2012 |
||||
| F-46 | ||||
| F-47 | ||||
| F-48 | ||||
| F-49 | ||||
| F-50 | ||||
F-1
Table of Contents
REPORT OF INDEPENDENT REGISTERED PUBLIC ACCOUNTING FIRM
To the Board of Directors of
Associated Materials Group, Inc.
We have audited the accompanying consolidated balance sheets of Associated Materials Group, Inc. and subsidiaries (the “Company”) as of December 29, 2012 and December 31, 2011, and the related consolidated statements of operations, comprehensive loss, stockholders’ equity, and cash flows for the years ended December 29, 2012 and December 31, 2011 and the period from October 13, 2010 to January 1, 2011. We have also audited the consolidated statements of operations, comprehensive loss, stockholders’ (deficit), and cash flows of AMH Holdings II, Inc. and subsidiaries (the “Predecessor”) for the period from January 3, 2010 to October 12, 2010. These financial statements are the responsibility of the Company’s management. Our responsibility is to express an opinion on these financial statements based on our audits.
We conducted our audits in accordance with the standards of the Public Company Accounting Oversight Board (United States). Those standards require that we plan and perform the audit to obtain reasonable assurance about whether the financial statements are free of material misstatement. The Company is not required to have, nor were we engaged to perform, an audit of its internal control over financial reporting. Our audits included consideration of internal control over financial reporting as a basis for designing audit procedures that are appropriate in the circumstances, but not for the purpose of expressing an opinion on the effectiveness of the Company’s or the Predecessor’s internal control over financial reporting. Accordingly, we express no such opinion. An audit also includes examining, on a test basis, evidence supporting the amounts and disclosures in the financial statements, assessing the accounting principles used and significant estimates made by management, as well as evaluating the overall financial statement presentation. We believe that our audits provide a reasonable basis for our opinion.
In our opinion, such consolidated financial statements present fairly, in all material respects, the financial position of the Company at December 29, 2012 and December 31, 2011, and the results of its operations and its cash flows for the years ended December 29, 2012 and December 31, 2011 and for the period from October 13, 2010 to January 1, 2011, and the results of the Predecessor’s operations and the Predecessor’s cash flows for the period January 3, 2010 to October 12, 2010, in conformity with accounting principles generally accepted in the United States of America.
| /s/ Deloitte & Touche LLP |
| Cleveland, Ohio July 15, 2013 |
F-2
Table of Contents
ASSOCIATED MATERIALS GROUP, INC.
CONSOLIDATED BALANCE SHEETS
(In thousands)
| December 29, 2012 |
December 31, 2011 |
|||||||
| ASSETS |
||||||||
| Current assets: |
||||||||
| Cash and cash equivalents |
$ | 9,594 | $ | 11,374 | ||||
| Accounts receivable, net |
121,387 | 121,998 | ||||||
| Inventories |
117,965 | 115,653 | ||||||
| Income taxes receivable |
2,690 | — | ||||||
| Deferred income taxes |
8,734 | 8,013 | ||||||
| Prepaid expenses |
8,771 | 11,653 | ||||||
|
|
|
|
|
|||||
| Total current assets |
269,141 | 268,691 | ||||||
| Property, plant and equipment, net |
108,452 | 126,593 | ||||||
| Goodwill |
482,613 | 478,912 | ||||||
| Other intangible assets, net |
599,644 | 622,100 | ||||||
| Other assets |
22,434 | 24,872 | ||||||
|
|
|
|
|
|||||
| Total assets |
$ | 1,482,284 | $ | 1,521,168 | ||||
|
|
|
|
|
|||||
| LIABILITIES AND STOCKHOLDERS’ EQUITY |
||||||||
| Current liabilities: |
||||||||
| Accounts payable |
$ | 74,311 | $ | 80,260 | ||||
| Accrued liabilities |
75,297 | 72,429 | ||||||
| Deferred income taxes |
3,469 | 4,967 | ||||||
| Income taxes payable |
5,697 | 6,989 | ||||||
|
|
|
|
|
|||||
| Total current liabilities |
158,774 | 164,645 | ||||||
| Deferred income taxes |
130,777 | 131,698 | ||||||
| Other liabilities |
153,473 | 150,361 | ||||||
| Long-term debt |
808,205 | 804,000 | ||||||
| Commitments and contingencies |
||||||||
| Stockholders’ equity: |
||||||||
| Common stock |
557 | 556 | ||||||
| Capital in excess of par |
554,647 | 554,552 | ||||||
| Note receivable from officer for purchase of common stock |
(736 | ) | (804 | ) | ||||
| Accumulated other comprehensive loss |
(17,247 | ) | (16,029 | ) | ||||
| Accumulated deficit |
(306,166 | ) | (267,811 | ) | ||||
|
|
|
|
|
|||||
| Total stockholders’ equity |
231,055 | 270,464 | ||||||
|
|
|
|
|
|||||
| Total liabilities and stockholders’ equity |
$ | 1,482,284 | $ | 1,521,168 | ||||
|
|
|
|
|
|||||
See accompanying notes to consolidated financial statements.
F-3
Table of Contents
ASSOCIATED MATERIALS GROUP, INC.
CONSOLIDATED STATEMENTS OF OPERATIONS
(In thousands, except share and per share amounts)
| Year Ended December 29, 2012 |
Year Ended December 31, 2011 |
October 13, 2010 to January 1, 2011 |
January 3, 2010 to October 12, 2010 |
|||||||||||||||
| Successor | Predecessor | |||||||||||||||||
| Net sales |
$ | 1,142,521 | $ | 1,159,515 | $ | 269,249 | $ | 897,938 | ||||||||||
| Cost of sales |
859,617 | 894,333 | 222,737 | 658,509 | ||||||||||||||
|
|
|
|
|
|
|
|
|
|||||||||||
| Gross profit |
282,904 | 265,182 | 46,512 | 239,429 | ||||||||||||||
| Selling, general and administrative expenses |
240,027 | 247,278 | 53,543 | 159,448 | ||||||||||||||
| Impairment of goodwill |
— | 84,253 | — | — | ||||||||||||||
| Impairment of other intangible assets |
— | 79,894 | — | — | ||||||||||||||
| Merger costs: |
||||||||||||||||||
| Transaction costs |
— | 585 | 7,411 | 38,416 | ||||||||||||||
| Transaction bonuses |
— | — | — | 26,231 | ||||||||||||||
| Stock option compensation |
— | — | — | 38,014 | ||||||||||||||
| Manufacturing restructuring costs |
— | 228 | — | — | ||||||||||||||
|
|
|
|
|
|
|
|
|
|||||||||||
| Income (loss) from operations |
42,877 | (147,056 | ) | (14,442 | ) | (22,680 | ) | |||||||||||
| Interest expense, net |
75,508 | 75,731 | 16,125 | 58,759 | ||||||||||||||
| Loss (gain) on debt extinguishment |
— | — | 25,129 | (15,201 | ) | |||||||||||||
| Foreign currency loss (gain) |
119 | 438 | 771 | (184 | ) | |||||||||||||
|
|
|
|
|
|
|
|
|
|||||||||||
| Loss before income taxes |
(32,750 | ) | (223,225 | ) | (56,467 | ) | (66,054 | ) | ||||||||||
| Income tax expense (benefit) |
5,605 | (20,434 | ) | 8,553 | 5,220 | |||||||||||||
|
|
|
|
|
|
|
|
|
|||||||||||
| Net loss |
$ | (38,355 | ) | $ | (202,791 | ) | $ | (65,020 | ) | $ | (71,274 | ) | ||||||
|
|
|
|
|
|
|
|
|
|||||||||||
| Per share data: |
||||||||||||||||||
| Loss per share (basic and diluted) |
$ | (0.69 | ) | $ | (3.67 | ) | $ | (1.19 | ) | $ | (41.41 | ) | ||||||
|
|
|
|
|
|
|
|
|
|||||||||||
| Weighted average shares outstanding (basic and diluted) |
55,642,894 | 55,290,857 | 54,860,707 | 1,721,076 | ||||||||||||||
|
|
|
|
|
|
|
|
|
|||||||||||
See accompanying notes to consolidated financial statements.
F-4
Table of Contents
ASSOCIATED MATERIALS GROUP, INC.
CONSOLIDATED STATEMENTS OF COMPREHENSIVE LOSS
(In thousands)
| Year Ended December 29, 2012 |
Year Ended December 31, 2011 |
October 13, 2010 to January 1, 2011 |
January 3, 2010 to October 12, 2010 |
|||||||||||||||
| Successor | Predecessor | |||||||||||||||||
| Net loss |
$ | (38,355 | ) | $ | (202,791 | ) | $ | (65,020 | ) | $ | (71,274 | ) | ||||||
| Other comprehensive income (loss): |
||||||||||||||||||
| Pension and other postretirement benefit adjustments, net of tax |
(9,446 | ) | (18,640 | ) | 4,799 | (12,663 | ) | |||||||||||
| Foreign currency translation adjustments, net of tax |
8,228 | (7,374 | ) | 5,186 | 3,023 | |||||||||||||
|
|
|
|
|
|
|
|
|
|||||||||||
| Total comprehensive loss |
$ | (39,573 | ) | $ | (228,805 | ) | $ | (55,035 | ) | $ | (80,914 | ) | ||||||
|
|
|
|
|
|
|
|
|
|||||||||||
See accompanying notes to consolidated financial statements.
F-5
Table of Contents
ASSOCIATED MATERIALS GROUP, INC.
CONSOLIDATED STATEMENTS OF STOCKHOLDERS’ EQUITY
(In thousands, except share data)
| Common Stock Outstanding |
Capital in Excess Of Par |
Note Receivable from Officer for Purchase of Common Stock |
Accumulated Other Comprehensive Income (Loss) |
Accumulated Deficit |
Total Stockholders’ Equity |
|||||||||||||||||||||||
| Shares | Amount | |||||||||||||||||||||||||||
| Predecessor |
||||||||||||||||||||||||||||
| Balance at January 2, 2010 |
1,721,076 | $ | 16 | $ | 15 | $ | — | $ | (7,810 | ) | $ | (317,426 | ) | $ | (325,205 | ) | ||||||||||||
| Comprehensive loss |
— | — | — | — | (9,640 | ) | (71,274 | ) | (80,914 | ) | ||||||||||||||||||
| Accrued Stock Options |
— | — | 38,014 | — | — | — | 38,014 | |||||||||||||||||||||
| Accrued Warrants |
— | — | 806 | — | — | — | 806 | |||||||||||||||||||||
| Excess tax benefit on stock options |
— | — | 1,817 | — | — | — | 1,817 | |||||||||||||||||||||
|
|
|
|
|
|
|
|
|
|
|
|
|
|
|
|||||||||||||||
| Balance at October 12, 2010 |
1,721,076 | 16 | 40,652 | — | (17,450 | ) | (388,700 | ) | (365,482 | ) | ||||||||||||||||||
|
|
|
|
|
|
|
|
|
|
|
|
|
|
|
|||||||||||||||
| Successor |
||||||||||||||||||||||||||||
| Balance at October 13, 2010 |
— | — | — | — | — | — | — | |||||||||||||||||||||
| Issuance of common stock |
54,860,707 | 549 | 548,058 | — | — | — | 548,607 | |||||||||||||||||||||
| Comprehensive loss |
— | — | — | — | 9,985 | (65,020 | ) | (55,035 | ) | |||||||||||||||||||
|
|
|
|
|
|
|
|
|
|
|
|
|
|
|
|||||||||||||||
| Balance at January 1, 2011 |
54,860,707 | 549 | 548,058 | — | 9,985 | (65,020 | ) | 493,572 | ||||||||||||||||||||
| Comprehensive loss |
— | — | — | — | (26,014 | ) | (202,791 | ) | (228,805 | ) | ||||||||||||||||||
| Issuance of common stock |
220,000 | 2 | 1,098 | (800 | ) | — | — | 300 | ||||||||||||||||||||
| Issuance of restricted stock |
134,800 | 1 | (1 | ) | — | — | — | — | ||||||||||||||||||||
| Restricted stock surrendered upon vesting |
(43,842 | ) | (1 | ) | (219 | ) | — | — | — | (220 | ) | |||||||||||||||||
| Conversion of convertible notes |
491,229 | 5 | 4,907 | — | — | — | 4,912 | |||||||||||||||||||||
| Stock-based compensation |
— | — | 709 | — | — | — | 709 | |||||||||||||||||||||
| Accrued interest on note receivable from officer |
— | — | — | (4 | ) | — | — | (4 | ) | |||||||||||||||||||
|
|
|
|
|
|
|
|
|
|
|
|
|
|
|
|||||||||||||||
| Balance at December 31, 2011 |
55,662,894 | 556 | 554,552 | (804 | ) | (16,029 | ) | (267,811 | ) | 270,464 | ||||||||||||||||||
| Comprehensive loss |
— | — | — | — | (1,218 | ) | (38,355 | ) | (39,573 | ) | ||||||||||||||||||
| Issuance of restricted stock |
24,000 | 1 | (1 | ) | — | — | — | — | ||||||||||||||||||||
| Stock-based compensation |
— | — | 96 | — | — | — | 96 | |||||||||||||||||||||
| Repayment of note receivable from officer |
— | — | — | 80 | — | — | 80 | |||||||||||||||||||||
| Accrued interest on note receivable from officer |
— | — | — | (12 | ) | — | — | (12 | ) | |||||||||||||||||||
|
|
|
|
|
|
|
|
|
|
|
|
|
|
|
|||||||||||||||
| Balance at December 29, 2012 |
55,686,894 | $ | 557 | $ | 554,647 | $ | (736 | ) | $ | (17,247 | ) | $ | (306,166 | ) | $ | 231,055 | ||||||||||||
|
|
|
|
|
|
|
|
|
|
|
|
|
|
|
|||||||||||||||
See accompanying notes to consolidated financial statements.
F-6
Table of Contents
ASSOCIATED MATERIALS GROUP, INC.
CONSOLIDATED STATEMENTS OF CASH FLOWS
(In thousands)
| Year Ended December 29, 2012 |
Year Ended December 31, 2011 |
October 13, 2010 to January 1, 2011 |
January 3, 2010 to October 12, 2010 |
|||||||||||||||
| Successor | Predecessor | |||||||||||||||||
| OPERATING ACTIVITIES |
||||||||||||||||||
| Net loss |
$ | (38,355 | ) | $ | (202,791 | ) | $ | (65,020 | ) | $ | (71,274 | ) | ||||||
| Adjustments to reconcile net loss to net cash (used in) provided by operating activities: |
||||||||||||||||||
| Depreciation and amortization |
50,678 | 51,326 | 10,498 | 17,582 | ||||||||||||||
| Deferred income taxes |
(2,061 | ) | (32,616 | ) | 8,267 | 4,278 | ||||||||||||
| Impairment of goodwill and other intangible assets |
— | 164,147 | — | — | ||||||||||||||
| Impact of inventory step-up |
— | — | 23,091 | — | ||||||||||||||
| Provision for losses on accounts receivable |
2,420 | 3,114 | 1,343 | 3,292 | ||||||||||||||
| (Gain) loss on sale or disposal of assets |
(12 | ) | 215 | — | 43 | |||||||||||||
| Loss (gain) on debt extinguishment |
— | — | 25,129 | (15,201 | ) | |||||||||||||
| Amortization of deferred financing costs |
4,479 | 4,459 | 914 | 3,203 | ||||||||||||||
| Stock-based compensation expense |
96 | 709 | — | 38,014 | ||||||||||||||
| Compensation expense related to warrants |
— | — | — | 806 | ||||||||||||||
| Debt accretion |
— | — | — | 201 | ||||||||||||||
| Changes in operating assets and liabilities: |
||||||||||||||||||
| Accounts receivable |
(1,333 | ) | (7,774 | ) | 42,933 | (49,940 | ) | |||||||||||
| Inventories |
(1,647 | ) | 29,701 | 13,128 | (41,998 | ) | ||||||||||||
| Prepaid expenses |
2,953 | (2,701 | ) | (1,258 | ) | 1,712 | ||||||||||||
| Accounts payable |
(6,407 | ) | (8,573 | ) | (67,762 | ) | 68,507 | |||||||||||
| Accrued liabilities |
2,666 | (6,948 | ) | (63,496 | ) | 69,282 | ||||||||||||
| Income taxes receivable/payable |
(4,158 | ) | 8,078 | (98 | ) | (1,204 | ) | |||||||||||
| Other assets |
(1,767 | ) | 918 | (32 | ) | (566 | ) | |||||||||||
| Other liabilities |
(8,141 | ) | (3,269 | ) | 222 | 1,832 | ||||||||||||
|
|
|
|
|
|
|
|
|
|||||||||||
| Net cash (used in) provided by operating activities |
(589 | ) | (2,005 | ) | (72,141 | ) | 28,569 | |||||||||||
| INVESTING ACTIVITIES |
||||||||||||||||||
| Supply center acquisition |
— | (1,550 | ) | — | — | |||||||||||||
| Acquisition, net of assumed debt |
— | — | (557,591 | ) | — | |||||||||||||
| Capital expenditures |
(5,371 | ) | (15,447 | ) | (5,160 | ) | (10,302 | ) | ||||||||||
| Proceeds from the sale of assets |
94 | 494 | — | — | ||||||||||||||
|
|
|
|
|
|
|
|
|
|||||||||||
| Net cash used in investing activities |
(5,277 | ) | (16,503 | ) | (562,751 | ) | (10,302 | ) | ||||||||||
| FINANCING ACTIVITIES |
||||||||||||||||||
| Borrowings under ABL facilities |
208,471 | 455,149 | 157,480 | 143,500 | ||||||||||||||
| Payments under ABL facilities |
(204,171 | ) | (439,149 | ) | (99,480 | ) | (153,500 | ) | ||||||||||
| Repayment of Predecessor long-term debt, including redemption premiums and interest |
— | — | (719,972 | ) | — | |||||||||||||
| Excess tax benefit from redemption of options |
— | — | — | 1,817 | ||||||||||||||
| Issuance of senior notes |
— | — | 730,000 | — | ||||||||||||||
| Proceeds from issuance of common stock |
80 | 300 | 553,507 | — | ||||||||||||||
| Financing costs |
(225 | ) | (398 | ) | (39,211 | ) | (223 | ) | ||||||||||
|
|
|
|
|
|
|
|
|
|||||||||||
| Net cash provided by (used in) financing activities |
4,155 | 15,902 | 582,324 | (8,406 | ) | |||||||||||||
| Effect of exchange rate changes on cash and cash equivalents |
(69 | ) | 191 | 75 | 516 | |||||||||||||
|
|
|
|
|
|
|
|
|
|||||||||||
| Net (decrease) increase in cash and cash equivalents |
(1,780 | ) | (2,415 | ) | (52,493 | ) | 10,377 | |||||||||||
| Cash and cash equivalents at beginning of the period |
11,374 | 13,789 | 66,282 | 55,905 | ||||||||||||||
|
|
|
|
|
|
|
|
|
|||||||||||
| Cash and cash equivalents at end of the period |
$ | 9,594 | $ | 11,374 | $ | 13,789 | $ | 66,282 | ||||||||||
|
|
|
|
|
|
|
|
|
|||||||||||
| Supplemental Information: |
||||||||||||||||||
| Cash paid for interest |
$ | 71,122 | $ | 74,300 | $ | 8,729 | $ | 60,601 | ||||||||||
|
|
|
|
|
|
|
|
|
|||||||||||
| Cash paid for income taxes |
$ | 11,920 | $ | 5,918 | $ | 280 | $ | 292 | ||||||||||
|
|
|
|
|
|
|
|
|
|||||||||||
See accompanying notes to consolidated financial statements.
F-7
Table of Contents
ASSOCIATED MATERIALS GROUP, INC.
NOTES TO CONSOLIDATED FINANCIAL STATEMENTS
1. ACCOUNTING POLICIES
Nature of Operations
Associated Materials Group, Inc., formerly known as AMH Investment Holdings Corp. (“Parent”) was incorporated in Delaware on September 3, 2010. On October 13, 2010, through a series of mergers, Associated Materials, LLC (“Associated Materials”) became a 100% owned indirect subsidiary of Parent, which has no material assets or operations other than its 100% ownership of Associated Materials Incorporated, formerly known as AMH Intermediate Holdings Corp. (“Holdings”), which in turn has no material assets or operations other than its 100% ownership of Associated Materials. Parent and, where appropriate, its subsidiaries are collectively referred to as the “Company.” The Company is controlled by investment funds affiliated with Hellman & Friedman LLC (“H&F”). In July 2013, Parent changed its name to “Associated Materials Group, Inc.” Parent is controlled by investment funds affiliated with H&F.
Associated Materials was founded in 1947 when it first introduced residential aluminum siding under the Alside® name and is a leading, vertically integrated manufacturer and distributor of exterior residential building products in the United States (“U.S.”) and Canada. The Company produces a comprehensive offering of exterior building products, including vinyl windows, vinyl siding, vinyl railing and fencing, aluminum trim coil, aluminum and steel siding and related accessories, which are produced at the Company’s 11 manufacturing facilities. The Company also sells complementary products that are manufactured by third parties, such as roofing materials, cladding materials, insulation, exterior doors, equipment and tools, and provides installation services. Because most of the Company’s building products are intended for exterior use, sales tend to be lower during periods of inclement weather. Weather conditions in the first quarter of each calendar year usually result in that quarter producing significantly less net sales and net cash flows from operations than in any other period of the year. Consequently, the Company has historically had losses or small profits in the first quarter and reduced profits from operations in the fourth quarter of each calendar year. Therefore, the results of operations for any interim period are not necessarily indicative of the results of operations for a full year.
Basis of Presentation
Prior to the Merger (see Note 2) completed on October 13, 2010, Associated Materials was a wholly owned subsidiary of Associated Materials Holdings, LLC, which was a wholly owned subsidiary of AMH Holdings, LLC (“AMH”). AMH was a wholly owned subsidiary of AMH Holdings II, Inc. (“AMH II”), which was controlled by affiliates of Investcorp S.A. and Harvest Partners, L.P. Upon completion of the Merger, Associated Materials’ then existing direct and indirect parent companies were merged into Associated Materials.
The financial statements for the year ended December 29, 2012, December 31, 2011 and the period October 13, 2010 to January 1, 2011 have been presented to reflect the financial results of the Company subsequent to the Merger (the “Successor”). The financial statements for the period January 3, 2010 to October 12, 2010 have been presented to reflect the financial results of the Company and its former direct and indirect parent companies, Associated Materials Holdings, LLC, AMH and AMH II (together, the “Predecessor”). The Company’s financial position, results of operations and cash flows prior to the date of the Merger include the activity and results of its former direct and indirect parent companies, which principally consisted of borrowings and related interest expense, and are presented as the results of the Predecessor. The results of operations, including the Merger and results thereafter, are presented as the results of the Successor.
F-8
Table of Contents
The Company operates on a 52/53 week fiscal year that ends on the Saturday closest to December 31st. The Company’s 2012, 2011 and 2010 fiscal years ended on December 29, 2012, December 31, 2011 and January 1, 2011, respectively, and included 52 weeks of operations.
Certain items previously reported in specific financial statement captions have been reclassified to conform to the fiscal 2012 presentation.
Principles of Consolidation
The consolidated financial statements include the accounts of the Company and its wholly owned subsidiaries. All intercompany transactions and balances are eliminated in consolidation.
Use of Estimates
The preparation of the consolidated financial statements in conformity with U.S. generally accepted accounting principles requires the Company to make estimates and judgments that affect the reported amounts of assets, liabilities, revenues and expenses. On an ongoing basis, the Company evaluates its estimates, including those related to recoverability of intangibles and other long-lived assets, customer programs and incentives, allowance for doubtful accounts, inventories, warranties, valuation allowance for deferred tax assets, share-based compensation, pensions and postretirement benefits and various other allowances and accruals. The Company bases its estimates on historical experience and on various other assumptions that are believed to be reasonable under the circumstances, the results of which form the basis for making judgments about the carrying values of assets and liabilities that are not readily apparent from other sources. Actual results may differ from these estimates under different assumptions or conditions.
Revenue Recognition
The Company primarily sells and distributes its products through two channels: direct sales from its manufacturing facilities to independent distributors and dealers and sales to contractors through its company-operated supply centers. Direct sales revenue is recognized when the Company’s manufacturing facility ships the product and title and risk of loss passes to the customer or when services have been rendered. Sales to contractors are recognized either when the contractor receives product directly from the supply center or when the supply center delivers the product to the contractor’s job site. For both direct sales to independent distributors and dealers and sales generated from the Company’s supply centers, revenue is not recognized until collectibility is reasonably assured. A substantial portion of the Company’s sales is in the repair and replacement segment of the exterior residential building products industry. Therefore, vinyl windows are manufactured to specific measurement requirements received from the Company’s customers. In 2012, 2011 and 2010, sales to one customer and its licensees represented approximately 13%, 13% and 14% of total net sales, respectively. The contract with Window World, Inc. expired in December 2012 and was renewed in July 2013.
Revenues are recorded net of estimated returns, customer incentive programs and other incentive offerings including special pricing agreements, promotions and other volume-based incentives. Revisions to these estimates are charged to income in the period in which the facts that give rise to the revision become known. For contracts involving installation, revenue is recognized when the installation is complete. The Company collects sales, use and value added taxes that are imposed by governmental authorities on and concurrent with sales to the Company’s customers. Revenues are presented net of these taxes as the obligation is included in accrued liabilities until the taxes are remitted to the appropriate taxing authorities.
F-9
Table of Contents
The Company offers certain sales incentives to customers, who become eligible for such incentives based on the level of purchases made during the calendar year, which are accrued as earned throughout the year. The sales incentives programs are considered customer volume rebates, which are typically computed as a percentage of customer sales, and in certain instances the rebate percentage may increase as customers achieve sales hurdles. Volume rebates are accrued throughout the year based on management estimates of customers’ annual sales volumes and the expected annual rebate percentage achieved. For these programs, the Company does not receive an identifiable benefit in exchange for the consideration, and therefore, the Company characterizes the volume rebate to the customer as a reduction of revenue in the Consolidated Statements of Operations.
Cash and Cash Equivalents
The Company considers all highly liquid investments with an original maturity of three months or less to be cash equivalents.
Accounts Receivable
The Company records accounts receivable at selling prices which are fixed based on purchase orders or contractual arrangements. The Company maintains an allowance for doubtful accounts for estimated losses resulting from the inability of its customers to make required payments. The allowance for doubtful accounts is based on a review of the overall condition of accounts receivable balances and a review of significant past due accounts. If the financial condition of the Company’s customers were to deteriorate, resulting in an impairment of their ability to make payments, additional allowances may be required. Account balances are charged off against the allowance for doubtful accounts after all means of collection have been exhausted and the potential for recovery is considered remote. Accounts receivable that are not expected to be collected within one year are reclassified as long-term accounts receivable. Long-term accounts receivable balances, net of the related allowance for doubtful accounts are included in other assets in the Consolidated Balance Sheets. See Note 4 for further information.
Inventories
Inventories are valued at the lower of cost (first-in, first-out) or market. The Company writes down its inventory for estimated obsolescence or unmarketable inventory equal to the difference between the cost of inventory and the estimated market value based upon assumptions about future demand and market conditions. Fixed manufacturing overheads are allocated based on normal production capacity and abnormal manufacturing costs are recognized as period costs. Market value is estimated based on the inventories’ current replacement costs by purchase or production; however, market value shall not exceed net realizable value or be lower than net realizable value less normal profit margins. The market and net realizable values of inventory require estimates and judgments based on the Company’s historical write-down experience, anticipated write-downs based on future merchandising plans and consumer demand, seasonal considerations, current market conditions and expected industry trends. If actual market conditions are less favorable than those projected by management, additional inventory write-downs may be required. The Company’s estimates of market value generally are not sensitive to management assumptions. Replacement costs and net realizable values are based on actual recent purchase and selling prices, respectively. See Note 5 for further information.
Property, Plant and Equipment
Additions to property, plant and equipment are stated at cost. The cost of maintenance and repairs of property, plant and equipment is charged to operations in the period incurred. Depreciation is computed by the straight-line method over the estimated useful lives of the assets. The estimated
F-10
Table of Contents
useful lives are approximately 20 to 30 years for buildings and improvements and 3 to 15 years for machinery and equipment. Leasehold improvements are amortized over the lesser of the lease term or the estimated life of the leasehold improvement. Property, plant and equipment are reviewed for impairment in accordance with Financial Accounting Standards Board (“FASB”) Accounting Standards Codification (“ASC”) Topic 360, Property, Plant, and Equipment.
The Company reviews long-lived assets for impairment whenever events or changes in circumstances indicate that the carrying amount of an asset may not be recoverable. Recoverability of assets to be held and used is measured by a comparison of the carrying amount of the asset to undiscounted future net cash flows expected to be generated by the asset. If such assets are considered to be impaired, the impairment to be recognized is measured by the amount by which the carrying amount of the assets exceeds the fair value of the assets. Depreciation on assets held for sale is discontinued, and such assets are reported at the lower of the carrying amount or fair value less costs to sell. See Note 6 for further information.
Goodwill and Other Intangible Assets With Indefinite Lives
The Company reviews goodwill and other intangible assets with indefinite lives for impairment on an annual basis, or more frequently if events or circumstances change that would impact the value of these assets, in accordance with FASB ASC Topic 350, Intangibles—Goodwill and Other. The impairment test is conducted using an income approach. As the Company does not have a market for its equity, management performs the annual impairment analysis utilizing a discounted cash flow approach incorporating current estimates regarding performance and macroeconomic factors discounted at a weighted average cost of capital. The Company conducts its impairment test of its goodwill and other intangible assets with indefinite lives annually at the beginning of the fourth quarter of each year or as indicators of impairment arise. The resulting fair value measures used in such impairment tests incorporate significant unobservable inputs, and as such, are considered Level 3 fair value measures. See Note 7 for further information.
Product Warranty Costs and Service Returns
Consistent with industry practice, the Company provides to homeowners limited warranties on certain products, primarily related to window and siding product categories. Warranties are of varying lengths of time from the date of purchase up to and including lifetime. Warranties cover product failures such as seal failures for windows and fading and peeling for siding products, as well as manufacturing defects. The Company has various options for remedying product warranty claims including repair, refinishing or replacement and directly incurs the cost of these remedies. Warranties also become reduced under certain conditions of time and change in home ownership. Certain metal coating suppliers provide warranties on materials sold to the Company that mitigate the costs incurred by the Company. Reserves for future warranty costs are provided based on management’s estimates utilizing an actuarial calculation performed by an independent actuary which projects future remedy costs using historical data trends of claims incurred, claim payments, sales history of products to which such costs relate and other factors. See Note 10 for further information.
Income Taxes
The Company accounts for income taxes in accordance with FASB ASC Topic 740, Income Taxes (“ASC 740”). Income tax expense includes both current and deferred taxes. Deferred tax assets and liabilities may be recognized for the effect of temporary differences between the book and tax bases of recorded assets and liabilities. ASC 740 requires deferred tax assets be reduced by a valuation allowance if it is more likely than not that some portion or all of the deferred tax asset will not be realized. The Company reviews the recoverability of any tax assets recorded on the balance sheet
and provides any necessary allowances as required. When an uncertain tax position meets the more
F-11
Table of Contents
likely than not recognition threshold, the position is measured to determine the amount of expense and benefit to be recognized in the financial statement. No tax benefit is recognized in the financial statements for tax positions that do not meet the more likely than not threshold. The Company recognizes interest and penalties related to uncertain tax positions within income tax expense. The effect of a change to the deferred tax assets or liabilities as a result of new tax law, including tax rate changes, is recognized in the period that the tax law is enacted. See Note 13 for further information.
Derivatives and Hedging Activities
In accordance with FASB ASC Topic 815, Derivatives and Hedging, all of the Company’s derivative instruments are recognized on the balance sheet at their fair value. The Company uses techniques designed to mitigate the short-term effect of exchange rate fluctuations of the Canadian dollar on its operations by entering into foreign exchange forward contracts. The Company does not speculate in foreign currencies or derivative financial instruments. Gains or losses on foreign exchange forward contracts are recorded within foreign currency loss in the accompanying Consolidated Statements of Operations. At December 29, 2012, the Company was a party to foreign exchange forward contracts for Canadian dollars. The value of these contracts at December 29, 2012 was less than $0.1 million.
Stock Plans
The Company accounts for share-based payments to employees and directors, including grants of restricted stock awards, in accordance with FASB ASC Topic 718, Compensation—Stock Compensation (“ASC 718”), which requires that share-based payments (to the extent they are compensatory) be measured and recognized in the Consolidated Statements of Operation using a fair value method. See Note 15 for further information.
Pensions
Pension costs are developed from actuarial valuations. Inherent in these valuations are key assumptions including discount rates and expected return on plan assets. In selecting these assumptions, management considers current market conditions, including changes in interest rates and market returns on plan assets. Changes in the related pension benefit costs may occur in the future due to changes in assumptions. See Note 16 for further information.
Lease Obligations
Lease expense for operating leases that have escalating rentals over the term of the lease is recorded on a straight-line basis over the life of the lease, which commences on the date the Company has the right to control the property. The cumulative expense recognized on a straight-line basis in excess of the cumulative payments is included in accrued liabilities in the Consolidated Balance Sheets. Capital improvements that may be required to make a building suitable for the Company’s use are incurred by the landlords and made prior to the Company having control of the property (lease commencement date) and are therefore incorporated into the determination of the lease rental rate. See Note 17 for further information.
In connection with the Merger and the application of purchase accounting, the Company evaluated its operating leases and recorded adjustments to reflect the fair market values of its operating leases. As a result, a favorable lease asset of $0.8 million and an unfavorable lease liability of $5.0 million were recorded based on the then current market analysis. The favorable lease asset and unfavorable lease liability are being amortized over the related remaining lease terms and are reported within cost of sales and selling, general and administrative expenses in the Consolidated
F-12
Table of Contents
Statements of Operations beginning October 13, 2010. The unamortized balances as of December 29, 2012 for the lease asset and lease liability were $0.4 million and $3.6 million, respectively.
Litigation Expenses
The Company is involved in certain legal proceedings. The Company recognizes litigation related expenses in the period in which the litigation services are provided. See Note 18 for further information.
Cost of Sales and Selling, General and Administrative Expenses
For products manufactured by the Company, cost of sales includes the purchase cost of raw materials, net of vendor rebates, payroll and benefit costs for direct and indirect labor incurred at the Company’s manufacturing locations including purchasing, receiving and inspection, inbound freight charges, freight charges to deliver product to the Company’s supply centers, and freight charges to deliver product to the Company’s independent distributor and dealer customers. It also includes all variable and fixed costs incurred to operate and maintain the manufacturing locations and machinery and equipment, such as lease costs, repairs and maintenance, utilities and depreciation. For third-party manufactured products, which are sold through the Company’s supply centers, cost of sales includes the purchase cost of the product, net of vendor rebates, as well as inbound freight charges.
As a result of the Merger, the Company’s inventory was increased by approximately $23.1 million to reflect fair market value. The impact to the Consolidated Statement of Operations of such increase was an increase in cost of goods sold of approximately $23.1 million during the successor period October 13, 2010 to January 1, 2011 as the related inventory was sold and replaced by manufactured inventory valued at cost.
Selling, general and administrative expenses include payroll and benefit costs including incentives and commissions of its supply center employees, corporate employees and sales representatives, building lease costs of its supply centers, delivery vehicle costs and other delivery charges incurred to deliver product from its supply centers to its contractor customers, sales vehicle costs, marketing costs, customer sales rewards, other administrative expenses such as supplies, legal, accounting, consulting, travel and entertainment as well as all other costs to operate its supply centers and corporate office. The customer sales rewards programs offer customers the ability to earn points based on purchases, which can be redeemed for products or services procured through independent third-party suppliers. The costs of the rewards programs are accrued as earned throughout the year based on estimated payouts under the program. Total customer rewards costs reported as a component of selling, general and administrative expenses totaled $4.5 million for the year ended December 29, 2012, $6.2 million for the year ended December 31, 2011, $0.1 million for the successor period October 13, 2010 to January 1, 2011 and $4.6 million for the predecessor period January 3, 2010 to October 12, 2010. Shipping and handling costs included in selling, general and administrative expense totaled $31.9 million for the year ended December 29, 2012, $32.1 million for the year ended December 31, 2011, $6.1 million for the successor period October 13, 2010 to January 1, 2011 and $21.4 million for the predecessor period January 3, 2010 to October 12, 2010.
Marketing and Advertising
Marketing and advertising costs are generally expensed as incurred. Marketing and advertising expense was $11.0 million for the year ended December 29, 2012 and $12.3 million for the year ended December 31, 2011, $2.7 million for the successor period October 13, 2010 to January 1, 2011 and $9.5 million for the predecessor period January 3, 2010 to October 12, 2010.
Foreign Currency Translation
The financial position and results of operations of the Company’s Canadian subsidiary are measured using Canadian dollars as the functional currency. Assets and liabilities of the subsidiary are
F-13
Table of Contents
translated into U.S. dollars at the exchange rate in effect at each reporting period end. Income statement and cash flow amounts are translated into U.S. dollars at the average exchange rates prevailing during the year. Translation adjustments arising from the use of different exchange rates from period to period are reflected as a component of stockholders’ equity within accumulated other comprehensive income (loss). Gains and losses arising from transactions denominated in a currency other than Canadian dollars occurring in the Company’s Canadian subsidiary are included in foreign currency loss in the Consolidated Statements of Operations.
Recent Accounting Pronouncements
In February 2013, the FASB issued Accounting Standards Update (“ASU”) No. 2013-02, Comprehensive Income (Topic 220): Reporting of Amounts Reclassified Out of Accumulated Other Comprehensive Income (“ASU 2013-02”). ASU 2013-02 requires the disclosure of additional information about reclassification adjustments, including (1) changes in accumulated other comprehensive income balances by component and (2) significant items reclassified out of accumulated other comprehensive income. Required disclosures include disaggregation of the total change of each component of other comprehensive income and the separate presentation of reclassification adjustments and current-period other comprehensive income. In addition, ASU 2013-02 requires the presentation of information about significant items reclassified out of accumulated other comprehensive income by component either on the face of the statement where net income is presented or as a separate disclosure in the notes to the financial statements. The new disclosure requirements are effective, prospectively, for fiscal years, and interim periods within those years, beginning after December 15, 2012. ASU 2013-02 concerns presentation and disclosure only. Adoption of the provisions of ASU 2013-02 at the beginning of 2013 did not have an impact on the Company’s consolidated financial position, results of operations or cash flows.
In July 2012, the FASB issued ASU No. 2012-02, Intangibles—Goodwill and Other (Topic 350): Testing Indefinite-Lived Intangible Assets for Impairment (“ASU 2012-02”). ASU 2012-02 permits an entity first to assess qualitative factors to determine whether it is more likely than not that an indefinite-lived intangible asset is impaired. If an entity determines that it is not more likely than not that the asset is impaired, the entity will have the option not to calculate annually the fair value of an indefinite-lived intangible asset. The more-likely-than-not threshold is defined as having a likelihood of more than 50 percent. ASU 2012-02 is effective for annual and interim impairment tests performed for fiscal years beginning after September 15, 2012, with early adoption permitted. Adoption of the provisions of ASU 2012-02 at the beginning of 2013 did not have an impact on the Company’s consolidated financial position, results of operations or cash flows.
In September 2011, the FASB issued ASU No. 2011-08, Intangibles—Goodwill and Other (Topic 350): Testing Goodwill for Impairment (“ASU 2011-08”). ASU 2011-08 provides the option to first assess qualitative factors to determine whether the existence of events or circumstance leads to the determination that it is more likely than not that the fair value of a reporting unit is less than its carrying amount. If the entity determines it is not more likely than not that the fair value is less than the carrying amount, then performing the two-step impairment test is unnecessary. However, if the entity concludes otherwise, it is required to perform the first step of the two-step impairment test. The amendments are effective for annual and interim goodwill impairment tests performed for fiscal years beginning after December 15, 2011, with early adoption permitted. Adoption of the provisions of ASU 2011-08 on January 1, 2012 did not have an impact on the Company’s consolidated financial position, results of operations or cash flows.
In June 2011, the FASB issued ASU No. 2011-05, Presentation of Comprehensive Income (“ASU 2011-05”). ASU 2011-05 eliminates the option to report other comprehensive income and its components in the statement of changes in member’s equity and requires an entity to present the
F-14
Table of Contents
components of net income and the components of other comprehensive income and the total for comprehensive income, either in a single continuous statement or in two separate but consecutive statements. In addition, ASU 2011-05 requires presentation of reclassification adjustments for each component of accumulated other comprehensive income in both the statement in which net income is presented and the statement in which other comprehensive income is presented. In December 2011, the FASB issued ASU No. 2011-12, Comprehensive Income—Deferral of the Effective Date for Amendments to the Presentation of Reclassifications of Items Out of Accumulated Other Comprehensive Income in ASU 2011-05 (“ASU 2011-12”). ASU 2011-12 defers the effective date of the specific requirements made in ASU 2011-05 pertaining to presentation of reclassification adjustments for each component of accumulated other comprehensive income in both net income and other comprehensive income on the face of the financial statements. ASU 2011-12 reinstates the previous requirements to present reclassification adjustments either on the face of the statement in which other comprehensive income is reported or to disclose them in the notes to the financial statements. All other requirements in ASU 2011-05 are not affected by ASU 2011-12. ASU 2011-05 and ASU 2011-12 are effective for interim and annual periods beginning after December 15, 2011. Adoption of ASU 2011-05 and ASU 2011-12 on January 1, 2012 did not have an impact on the Company’s consolidated financial position, results of operations or cash flows.
2. BUSINESS COMBINATION
On October 13, 2010, AMH II, the then indirect parent company of Associated Materials, completed its merger (the “Acquisition Merger”) with Carey Acquisition Corp. (“Merger Sub”), pursuant to the terms of the Agreement and Plan of Merger, dated as of September 8, 2010 (“Merger Agreement”), among Parent, Holdings, a 100% owned direct subsidiary of Parent, Merger Sub, a wholly owned direct subsidiary of Holdings, and AMH II, with AMH II surviving such merger as a wholly owned direct subsidiary of Holdings. After a series of additional mergers (the “Downstream Mergers,” and together with the Acquisition Merger, the “Merger”), AMH II merged with and into Associated Materials, with Associated Materials surviving such merger as a wholly owned direct subsidiary of Holdings. As a result of the Merger, Associated Materials is now an indirect wholly owned subsidiary of Parent. The Merger was completed to provide a liquidity event for the Company’s then indirect parent company and to provide the Company with additional growth opportunities and access to capital in order to capitalize on the long-term growth prospects of the business.
Upon consummation of the Merger, the holders of AMH II equity (including “in-the-money” stock options and warrants outstanding immediately prior to the consummation of the Acquisition Merger) received consideration consisting of approximately $600 million in cash, less (1) $16.2 million paid to affiliates of Harvest Partners and Investcorp in accordance with the management services agreement with Harvest Partners and (2) $26.2 million of transaction bonuses paid to senior management and certain other employees in connection with the Merger. Immediately prior to the consummation of the Merger, all outstanding shares of AMH II preferred stock were converted into shares of AMH II common stock.
In connection with the consummation of the Merger, the Company repaid and terminated the prior asset-based credit facility (“prior ABL Facility”) and redeemed the 20% Senior Notes due 2014 (“20% notes”). In addition, the Company redeemed and discharged its obligations under the indentures governing the 9.875% Senior Secured Second Lien Notes due 2016 (“9.875% notes”) and the 11.25% Senior Discount Notes due 2014 (“11.25% notes”). Expenses related to the repayment and termination of the prior ABL Facility and the redemption of the 20% notes were recorded as a net gain on debt extinguishment of the Predecessor. Expenses related to the redemption of the 9.875% notes and the 11.25% notes were in part recognized as fair value increases to the debt balances in the allocation of purchase price, with the remaining redemption costs in excess of the fair value adjustments totaling $13.6 million recognized as a net loss on debt extinguishment in the Successor’s results of operations.
F-15
Table of Contents
The Merger, the repayment and termination of the prior ABL Facility and the redemption of the 9.875% notes, the 11.25% notes and the 20% notes and related expenses were financed with (1) $553.5 million in cash contributed by Parent (which includes $8.5 million invested by management), (2) the issuance of $730.0 million of 9.125% senior secured notes, (3) $73.0 million in cash drawn under the Company’s new $225.0 million asset-based lending facility (“ABL facilities”) and (4) $45.9 million of cash from the Company’s balance sheet. In connection with the Merger and new debt structure, the Successor paid deferred financing fees of $39.2 million in the period ended January 1, 2011, which included $11.5 million related to an interim financing facility, which was negotiated, but ultimately not utilized and expensed by the Successor in net loss on debt extinguishment in the Successor’s results of operations for the period ended January 1, 2011.
The Merger was accounted for using the acquisition method of accounting. The total purchase price was allocated to the tangible and intangible assets acquired and liabilities assumed based upon their estimated fair values. The excess of the cost of the Merger over the fair value of the assets acquired and liabilities assumed was recorded as goodwill. The goodwill recorded was the result of the ability to earn a higher rate of return from the acquired business than would be expected if the assets had to be acquired or developed separately and would not be deductible for federal income tax purposes. The increase in basis of the acquired assets and assumed liabilities would result in non-cash expenses (income) in future periods, principally related to the step-up in the value of inventory, property, plant and equipment, intangible assets and warranty liability.
The following table summarizes the fair values of the assets acquired and liabilities assumed on October 13, 2010 (in thousands):
| Total current assets |
$ | 423,548 | ||
| Property, plant and equipment |
137,152 | |||
| Goodwill |
564,072 | |||
| Other intangible assets |
734,100 | |||
| Other assets |
3,504 | |||
|
|
|
|||
| Total assets acquired |
1,862,376 | |||
| Total current liabilities |
310,465 | |||
| Deferred income taxes |
147,796 | |||
| Other liabilities |
140,239 | |||
| Long-term debt |
706,285 | |||
|
|
|
|||
| Total liabilities assumed |
1,304,785 | |||
|
|
|
|||
| Net assets acquired |
$ | 557,591 | ||
|
|
|
The allocation of purchase price resulted in $564.1 million in goodwill and $734.1 million in other intangible assets, including $404.0 million of customer base intangibles with estimated useful lives ranging from 11 to 18 years and $330.1 million of marketing-based intangibles with indefinite lives.
In connection with the Merger, the Predecessor incurred certain transaction related costs, including investment banking fees and expenses, legal fees and expenses, sponsor fees payable to the Predecessor’s sponsors and other transaction related expenses, which have been classified as merger costs in the Predecessor’s results of operations. In addition, the Predecessor recorded transaction bonuses payable to certain members of management in connection with the completion of the Merger and stock option compensation expense in connection with the Merger related to the modification of certain Predecessor stock options and the fair value of an in-the-money stock option award granted immediately prior to the Merger. The Predecessor also recorded expense related to stock warrants payable as a result of the transaction, which had been classified as a reduction of net
F-16
Table of Contents
sales in accordance with FASB ASC Topic 505-50, Equity-Based Payments to Non-Employees in the Predecessor’s results of operations for the period ended October 12, 2010. The Successor recorded transaction related expenses classified as Merger costs in the Successor’s results of operations for the period ended January 1, 2011 primarily for fees paid on behalf of Merger Sub related to due diligence activities.
Unaudited pro forma operating results of the Company for the year ended January 1, 2011 giving effect to the Merger on January 3, 2010 are summarized as follows (in thousands):
| Net sales(1) |
$ | 1,167,993 | ||
| Net loss(2) |
(58,456 | ) |
| (1) | Excludes $0.8 million of expense for stock warrants, which were redeemed for cash in connection with the Merger. |
| (2) | Excludes $143.9 million of non-recurring expenses directly related to the Merger as follows: (i) $38.4 million of Predecessor expenses including investment banking, legal and other expenses; (ii) $7.4 million of Successor expenses primarily including fees paid on behalf of Merger Sub related to due diligence activities; (iii) $26.2 million of transaction bonuses paid to senior management and certain employees in connection with the Merger; (iv) $38.0 million of stock option compensation expense recognized as a result of the modification of certain stock option awards in connection with the Merger and the fair value of an in-the-money stock option award granted immediately prior to the Merger; (v) $0.8 million of expense for stock warrants, which were redeemed for cash in connection with the Merger; (vi) $23.1 million for the amortization of the step-up in basis of inventory related to purchase accounting which is non-recurring; (vii) a $15.2 million net gain on debt extinguishment recorded by the Predecessor in connection with the Merger, which was related to the write-off of the troubled debt accrued interest associated with the redemption of the previously outstanding 13.625% notes and the write-off of the financing fees related to the prior ABL Facility; and (viii) a $25.1 million loss on debt extinguishment recorded by the Successor, which was comprised of $13.6 million related to the redemption of the previously outstanding 9.875% notes and 11.25% notes and $11.5 million of expense related to an interim financing facility, which was negotiated but ultimately not utilized, related to financing for the Merger. |
3. RELATED PARTIES
During the years ended December 29, 2012 and December 31, 2011, the Company paid AlixPartners, LLP, a former portfolio company of H&F, $0.5 million and $2.9 million, respectively, in connection with operational improvement projects, including projects related to purchasing, manufacturing, inventory and logistics, which is included in selling, general and administrative expenses.
In connection with the Merger, and in accordance with the amended and restated management agreement between Harvest Partners and the Company, and the transaction fee sharing agreement between Harvest Partners and Investcorp International Inc. (“III”), the Company paid (1) a transaction fee of $6.5 million and management fees for the remaining term of the amended and restated management agreement, including the cancellation notice period, of $3.2 million to Harvest Partners and (2) a transaction fee of $6.5 million to III. These fees were included in the Predecessor’s results of operations as merger costs for the period ended October 12, 2010. In addition, the Company paid $1.1 million to H&F in reimbursement for third party transaction related expenses incurred on behalf of Merger Sub primarily related to due diligence activities, which was recorded in the Successor’s results of operations as merger costs for the period ended January 1, 2011.
During the predecessor period ended October 12, 2010, the Company paid $0.7 million of management fees to Harvest Partners for financial advisory and strategic planning services provided in
F-17
Table of Contents
accordance with an amended and restated management agreement, which is included in selling, general and administrative expenses in the Consolidated Statements of Operations. On October 13, 2010, upon consummation of the Merger, the amended and restated management agreement with Harvest Partners was terminated.
4. ALLOWANCE FOR DOUBTFUL ACCOUNTS
Changes in the allowance for doubtful accounts on accounts receivable are as follows (in thousands):
| December 29, 2012 |
December 31, 2011 |
October 13, 2010 to January 1, 2011 |
January 3, 2010 to October 12, 2010 |
|||||||||||||||
| Successor | Predecessor | |||||||||||||||||
| Balance at beginning of period |
$ | 7,823 | $ | 9,203 | $ | 9,471 | $ | 8,015 | ||||||||||
| Provision for losses |
2,420 | 3,114 | 1,343 | 3,292 | ||||||||||||||
| Losses sustained (net of recoveries) |
(1,072 | ) | (4,494 | ) | (1,611 | ) | (1,836 | ) | ||||||||||
|
|
|
|
|
|
|
|
|
|||||||||||
| Balance at end of period |
$ | 9,171 | $ | 7,823 | $ | 9,203 | $ | 9,471 | ||||||||||
|
|
|
|
|
|
|
|
|
|||||||||||
Allowance for doubtful accounts on accounts receivable consists of (in thousands):
| December 29, 2012 |
December 31, 2011 |
|||||||
| Allowance for doubtful accounts, current |
$ | 3,737 | $ | 4,242 | ||||
| Allowance for doubtful accounts, non-current |
5,434 | 3,581 | ||||||
|
|
|
|
|
|||||
| $ | 9,171 | $ | 7,823 | |||||
|
|
|
|
|
|||||
5. INVENTORIES
Inventories consist of (in thousands):
| December 29, 2012 |
December 31, 2011 |
|||||||
| Raw materials |
$ | 26,749 | $ | 29,770 | ||||
| Work-in-progress |
11,589 | 8,580 | ||||||
| Finished goods |
79,627 | 77,303 | ||||||
|
|
|
|
|
|||||
| $ | 117,965 | $ | 115,653 | |||||
|
|
|
|
|
|||||
6. PROPERTY, PLANT AND EQUIPMENT
Property, plant and equipment consist of (in thousands):
| December 29, 2012 |
December 31, 2011 |
|||||||
| Land |
$ | 15,315 | $ | 15,032 | ||||
| Buildings |
40,871 | 39,991 | ||||||
| Machinery and equipment |
105,708 | 98,500 | ||||||
| Construction in process |
642 | 2,797 | ||||||
|
|
|
|
|
|||||
| 162,536 | 156,320 | |||||||
| Less accumulated depreciation |
54,084 | 29,727 | ||||||
|
|
|
|
|
|||||
| $ | 108,452 | $ | 126,593 | |||||
|
|
|
|
|
|||||
F-18
Table of Contents
Depreciation expense was $23.2 million for the year ended December 29, 2012, $23.6 million for the year ended December 31, 2011, $5.0 million for the successor period October 13, 2010 to January 1, 2011 and $15.4 million for the predecessor period January 3, 2010 to October 12, 2010.
7. GOODWILL AND OTHER INTANGIBLE ASSETS
As a result of the Merger completed during the fourth quarter of 2010, the Company engaged an independent valuation firm to assist management in the estimation of the fair values of certain tangible and intangible assets. The valuation analyses were based on the definition of fair value as promulgated in FASB ASC Topic 805, Business Combinations, and FASB ASC Topic 820, Fair Value Measurements and Disclosures. The analysis was performed as of October 13, 2010, which was the closing date of the Merger.
The valuation analyses considered various valuation approaches, including the income approach, market approach and cost approach. The assets were valued by applying these techniques under the premise of the assets’ values to a prudent investor contemplating retention and use of the assets in an ongoing business. The valuation analyses considered financial and other information from management and various public, financial and industry sources. The valuation analyses required significant judgments and estimates, primarily regarding expected growth rates, royalty rates and discount rates. Expected growth rates were determined based on internally developed projections considering future financial plans of the Company. Royalty rates were estimated based on a review of publicly disclosed royalty rates for similar products and based on an analysis of economic profit attributable to the Company’s brands. The discount rates used were estimated based on the Company’s weighted average cost of capital, which considered market assumptions and other risk premiums estimated by the independent valuation firm assisting the Company with the valuation of its intangible assets. Estimates could be materially impacted by factors such as specific industry conditions and changes in growth trends. The assumptions used were management’s best estimates based on projected results and market conditions as of the closing date of the Merger.
The Company reviews goodwill for impairment on an annual basis at the beginning of the fourth quarter, or more frequently if events or circumstances change that would impact the value of these assets. During 2012, the Company completed the annual impairment test of goodwill as of the beginning of the fourth quarter and based on the results of the testing, no impairment charges were recorded.
During 2011, the Company’s results of operations deteriorated as compared to management’s projections for the year. Management believed that the declines experienced during the first half of 2011 were primarily related to the impact of the reduction to the energy tax credit, a weakened economic environment and unfavorable weather conditions, all of which can impact the demand for exterior building products. Management believed that some portion of these conditions were temporary in nature. During the third quarter of 2011, the weaker economic conditions and lower results of operations persisted, resulting in management changing its outlook and lowering its forecast used for its discounted cash flow analysis. In addition, Parent granted stock options in September 2011 to its newly appointed President and Chief Executive Officer at an exercise price of $5 per share and also modified certain other outstanding options to an exercise price of $5 per share based on a determination of fair market value by Parent’s board of directors. As a result of the lower management projections for operating results and the calculated lower per share equity value, during the third quarter of 2011, the Company believed that it had an indicator of impairment and performed interim impairment testing as of September 3, 2011.
The Company, comprised of a single reporting unit, completed the first step of its goodwill impairment testing with the assistance of an independent valuation firm and determined that the fair
F-19
Table of Contents
value of its reporting unit was lower than its carrying value prior to the filing of Associated Materials’ third quarter Form 10-Q on November 15, 2011. The Company’s fair value was determined using a discounted cash flow approach incorporating current estimates regarding future financial performance and macroeconomic factors discounted at a weighted average cost of capital. The Company had not finalized its review of the interim impairment analysis due to the limited time period from the first indication of potential impairment to the date of filing of Associated Materials’ third quarter Form 10-Q and the complexities involved in estimating the fair value of certain assets and liabilities. Accounting guidance provides that in circumstances in which step two of the impairment analysis has not been completed, a company should recognize an estimated impairment charge to the extent that a company determines that it is probable that an impairment loss has occurred and such impairment loss can be reasonably estimated using the guidance of accounting for contingencies. Given that the second step of the valuation analysis had not been completed and the complexities involved in such analysis, management could not reasonably estimate the amount of an impairment charge prior to the filing of Associated Materials’ third quarter Form 10-Q, but had concluded that an impairment loss was probable.
Prior to the completion of the 2011 annual financial statements, the Company finalized the valuation work necessary to complete the second step of the impairment analysis, in which it determined the fair value of its identified tangible and intangible assets and liabilities with the assistance of the same independent valuation firm utilized to assist in the first step of its impairment testing. Based on that analysis, the Company calculated an implied fair value of goodwill, which was lower than the book value of goodwill, resulting in the Company recording a goodwill impairment charge of $84.3 million during the fourth quarter of 2011. The goodwill impairment charge was a non-cash item and did not affect the calculation of the borrowing base or financial covenants in the Company’s credit agreement. There was no tax benefit associated with this non-cash charge.
In addition to the interim impairment testing of goodwill, the Company conducted its annual impairment test as of beginning of the fourth quarter of 2011. The annual fourth quarter test occurred in connection with the Company’s annual budgeting process. In connection with this process, the Company further lowered its financial projections and with the assistance of an independent valuation firm determined that the fair value of its reporting unit was lower than its carrying value as of the annual testing date. As a result, the Company was required to conduct a second step impairment analysis, in which it updated the fair value estimates of its identified tangible and intangible assets and liabilities. The second step impairment analysis indicated the fair value of implied goodwill exceeded the carrying value, and as a result, no further impairment of goodwill was recorded.
Changes in the net carrying amount of goodwill are as follows (in thousands):
| Goodwill | ||||
| Balance at January 1, 2011 |
$ | 566,423 | ||
| Foreign currency translation |
(3,258 | ) | ||
| Impairment loss |
(84,253 | ) | ||
|
|
|
|||
| Balance at December 31, 2011 |
478,912 | |||
| Foreign currency translation |
3,701 | |||
|
|
|
|||
| Balance at December 29, 2012 |
$ | 482,613 | ||
|
|
|
|||
At both December 29, 2012 and December 31, 2011, accumulated goodwill impairment losses were $84.3 million, exclusive of foreign currency translation.
F-20
Table of Contents
The Company’s other intangible assets consist of the following (in thousands):
| December 29, 2012 | December 31, 2011 | |||||||||||||||||||||||
| Cost | Accumulated Amortization |
Net Carrying Value |
Cost | Accumulated Amortization |
Net Carrying Value |
|||||||||||||||||||
| Amortized customer bases |
$ | 331,582 | $ | 57,897 | $ | 273,685 | $ | 330,080 | $ | 31,498 | $ | 298,582 | ||||||||||||
| Amortized non-compete agreements |
10 | 5 | 5 | 10 | 2 | 8 | ||||||||||||||||||
|
|
|
|
|
|
|
|
|
|
|
|
|
|||||||||||||
| Total amortized intangible assets |
331,592 | 57,902 | 273,690 | 330,090 | 31,500 | 298,590 | ||||||||||||||||||
| Non-amortized trade names(1) |
325,954 | — | 325,954 | 323,510 | — | 323,510 | ||||||||||||||||||
|
|
|
|
|
|
|
|
|
|
|
|
|
|||||||||||||
| Total intangible assets |
$ | 657,546 | $ | 57,902 | $ | 599,644 | $ | 653,600 | $ | 31,500 | $ | 622,100 | ||||||||||||
|
|
|
|
|
|
|
|
|
|
|
|
|
|||||||||||||
| (1) | Balances at December 29, 2012 and December 31, 2011 reflected impairment charges of $72.2 million and $7.7 million recorded during the third and fourth quarters of 2011, respectively. |
The Company’s non-amortized intangible assets consist of the Alside®, Revere®, Gentek®, Preservation® and Alpine® trade names and are tested for impairment at least annually at the beginning of the fourth quarter. In addition, the Company tests such assets for impairment on a more frequent basis if there are indications of potential impairment. During 2012, the Company completed the annual impairment test of intangible assets with indefinite lives as of the beginning of the fourth quarter, and based on the results of the testing, no impairment charges were recorded.
During the third quarter of 2011, as indicated previously, due to the weaker economic conditions and lower projections for results of operations, the Company believed potential indicators of impairment existed for the non-amortized trade names and completed an interim test of the fair value with the assistance of an independent valuation firm. The Company determined that the fair value using the income approach of certain non-amortized trade names was lower than the carrying value. Accordingly, the Company recorded an impairment charge of $72.2 million during the third quarter of 2011 associated with its non-amortized trade names.
In addition to the interim impairment testing of other intangible assets, the Company conducted its annual impairment test at the beginning of the fourth quarter of 2011. The Company had revised its forecasts downward after the date of the interim impairment testing based on its annual budgeting process. Using the income approach, the Company concluded that the fair value of certain non-amortized trade names was lower than the carrying value determined during the interim impairment test. Accordingly, the Company recorded an additional impairment charge of $7.7 million during the fourth quarter of 2011 associated with its non-amortized trade names.
Finite lived intangible assets, which consist of amortized customer bases and amortized non-compete agreements, are amortized on a straight-line basis over their estimated useful lives. The estimated average amortization period for amortized customer bases and amortized non-compete agreements is 13 years and 3 years, respectively. Amortization expense related to other intangible assets was $26.2 million for the years ended December 29, 2012 and December 31, 2011, respectively. Amortization expense is estimated to be $26.2 million per year for fiscal years 2013, 2014, 2015, 2016 and 2017.
F-21
Table of Contents
8. ACCRUED AND OTHER LIABILITIES
Accrued liabilities consist of (in thousands):
| December 29, 2012 |
December 31, 2011 |
|||||||
| Employee compensation |
$ | 15,586 | $ | 13,426 | ||||
| Sales promotions and incentives |
16,852 | 18,326 | ||||||
| Warranty reserves |
9,368 | 9,779 | ||||||
| Employee benefits |
7,918 | 6,080 | ||||||
| Interest |
11,682 | 11,842 | ||||||
| Taxes other than income taxes |
3,255 | 2,902 | ||||||
| Other |
10,636 | 10,074 | ||||||
|
|
|
|
|
|||||
| $ | 75,297 | $ | 72,429 | |||||
|
|
|
|
|
|||||
Other liabilities consist of (in thousands):
| December 29, 2012 |
December 31, 2011 |
|||||||
| Pensions and other postretirement plans |
$ | 55,532 | $ | 49,762 | ||||
| Warranty reserves |
88,103 | 91,384 | ||||||
| Other |
9,838 | 9,215 | ||||||
|
|
|
|
|
|||||
| $ | 153,473 | $ | 150,361 | |||||
|
|
|
|
|
|||||
9. MANUFACTURING RESTRUCTURING COSTS
The Company discontinued its use of the warehouse facility adjacent to the Ennis manufacturing plant during the second quarter of 2009. As a result, the related lease costs associated with the discontinued use of the warehouse facility were recorded as a restructuring charge of $5.3 million during 2009. During the second quarter of 2011, the Company re-measured its restructuring liability due to changes in the expected timing and amount of cash flows over the remaining lease term. As a result, the Company recorded an adjustment to increase the restructuring liability and recognized a charge of $0.2 million within selling, general and administrative expenses in the Consolidated Statements of Operations for the year ended December 31, 2011.
Changes in the manufacturing restructuring liability are as follows (in thousands):
| Year Ended December 29, 2012 |
Year Ended December 31, 2011 |
October 13, 2010 to January 1, 2011 |
January 3, 2010 to October 12, 2010 |
|||||||||||||||
| Successor | Predecessor | |||||||||||||||||
| Balance at beginning of period |
$ | 4,086 | $ | 4,583 | $ | 4,728 | $ | 5,036 | ||||||||||
| Additions |
— | 228 | — | — | ||||||||||||||
| Reclass of related lease obligations |
— | — | — | 389 | ||||||||||||||
| Accretion of related lease obligations |
545 | 498 | 89 | 295 | ||||||||||||||
| Payments |
(1,244 | ) | (1,223 | ) | (234 | ) | (992 | ) | ||||||||||
|
|
|
|
|
|
|
|
|
|||||||||||
| Balance at end of period |
$ | 3,387 | $ | 4,086 | $ | 4,583 | $ | 4,728 | ||||||||||
|
|
|
|
|
|
|
|
|
|||||||||||
The remaining restructuring liability was included in accrued liabilities and other liabilities in the Consolidated Balance Sheets and will continue to be paid over the lease term, which ends April 2020.
F-22
Table of Contents
10. PRODUCT WARRANTY COSTS AND SERVICE RETURNS
Consistent with industry practice, the Company provides to homeowners limited warranties on certain products, primarily related to window and siding product categories. Changes in the warranty reserve are as follows (in thousands):
| December 29, 2012 |
December 31, 2011 |
October 13, 2010 to January 1, 2011 |
January 3, 2010 to October 12, 2010 |
|||||||||||||||
| Successor | Predecessor | |||||||||||||||||
| Balance at beginning of period |
$ | 101,163 | $ | 94,712 | $ | 93,387 | $ | 33,016 | ||||||||||
| Provision for warranties issued and changes in estimates for pre-existing warranties |
4,098 | 14,661 | 2,599 | 7,602 | ||||||||||||||
| Claims paid |
(8,133 | ) | (7,823 | ) | (1,441 | ) | (5,675 | ) | ||||||||||
| Foreign currency translation |
343 | (387 | ) | 167 | 210 | |||||||||||||
|
|
|
|
|
|
|
|
|
|||||||||||
| Balance at end of period |
$ | 97,471 | $ | 101,163 | $ | 94,712 | $ | 35,153 | ||||||||||
|
|
|
|
|
|
|
|
|
|||||||||||
As a result of the Merger and the application of purchase accounting, the Company adjusted its warranty reserves to represent an estimate of the fair value of the liability as of the closing date of the Merger. The estimated fair value of the liability was based on an actuarial calculation performed by an independent actuary, which projected future remedy costs using historical data trends of claims incurred, claims payments and sales history of products to which such costs relate. The fair value of the expected future remedy costs related to products sold prior to the Merger was based on the actuarially determined estimates of expected future remedy costs and other factors and assumptions the Company believes market participants would use in valuing the warranty reserves. These other factors and assumptions included inputs for claims administration costs, confidence adjustments for uncertainty in the estimates of expected future remedy costs and a discount factor to arrive at the estimated fair value of the liability at the date of the Merger. The excess of the estimated fair value over the expected future remedy costs of $9.5 million, which was included in the Company’s warranty reserve at the date of the Merger, is being amortized as a reduction of warranty expense over the expected term such warranty claims will be satisfied. The remaining unamortized amount at December 29, 2012 was $7.9 million. Prior to the Merger, the reserves for future warranty costs were based on management estimates of such future costs. Management believes that the adopted actuarial method provides management additional information to base its estimates of the expected future remedy costs and is a preferable method for estimating warranty reserves. The provision for warranties was reported within cost of sales in the Consolidated Statements of Operations.
11. EXECUTIVE OFFICERS’ SEPARATION AND HIRING COSTS
On February 20, 2012, David S. Nagle was appointed President, AMI Distribution. On February 24, 2012, Stephen E. Graham resigned from his position as Senior Vice President—Chief Financial Officer and Secretary of the Company. On February 27, 2012, the Company entered into an employment agreement with Paul Morrisroe, pursuant to which he agreed to serve as the Company’s Senior Vice President, Chief Financial Officer and Secretary. The Company’s Senior Vice President of Human Resources, John F. Haumesser, resigned from his position effective April 19, 2012 and was succeeded by James T. Kenyon, who was named Senior Vice President and Chief Human Resources Officer on June 4, 2012.
On June 2, 2011, Thomas N. Chieffe resigned from his position as President and Chief Executive Officer and as a director of the Company, and Dana R. Snyder, a director of the Company, was appointed Interim Chief Executive Officer. On June 29, 2011, Warren J. Arthur resigned from his position
F-23
Table of Contents
as Senior Vice President of Operations of the Company. On August 1, 2011, Robert C. Gaydos was appointed Senior Vice President, Operations. On September 12, 2011, Jerry W. Burris was appointed President and Chief Executive Officer, and Mr. Snyder resigned from his position as Interim Chief Executive Officer. Robert M. Franco, President of AMI Distribution, left the Company on March 31, 2011.
The Company recorded $3.4 million, $6.7 million and $1.4 million for the years ended December 29, 2012, December 31, 2011 and for the successor period October 13, 2010 to January 1, 2011, respectively, for separation and hiring costs, including payroll taxes, certain benefits and related professional fees. These separation and hiring costs were recorded as a component of selling, general and administrative expenses. As of December 29, 2012, remaining separation costs of $3.4 million were accrued, which will be paid at various dates through 2014.
12. LONG-TERM DEBT
Long-term debt consists of (in thousands):
| December 29, 2012 |
December 31, 2011 |
|||||||
| 9.125% notes |
$ | 730,000 | $ | 730,000 | ||||
| Borrowings under the ABL facilities |
78,205 | 74,000 | ||||||
|
|
|
|
|
|||||
| Total long-term debt |
$ | 808,205 | $ | 804,000 | ||||
|
|
|
|
|
|||||
9.125% Senior Secured Notes due 2017
On October 13, 2010, in connection with the consummation of the Merger, Associated Materials and AMH New Finance, Inc. (collectively, the “Issuers”) issued and sold $730.0 million of 9.125% Senior Secured Notes due November 1, 2017 (“9.125% notes” or “notes”) pursuant to the indenture, dated as of October 13, 2010 (“Indenture”). The notes bear interest at a rate of 9.125% per annum payable May 1 and November 1 of each year commencing May 1, 2011. The Company completed the exchange of all outstanding privately placed 9.125% notes for newly registered notes in July 2011. The notes have an estimated fair value of $742.8 million and $636.9 million based on quoted market prices as of December 29, 2012 and December 31, 2011, respectively.
Guarantees. The notes are unconditionally guaranteed, jointly and severally, by each of the Issuers’ direct and indirect domestic subsidiaries (“guarantors”) that guarantee the Company’s obligations under the ABL facilities.
Collateral. The notes and the guarantees are secured by a first-priority lien on substantially all of the Issuers’ and the guarantors’ present and future assets located in the United States (other than the ABL collateral, in which the notes and the guarantees have a second-priority lien, and certain other excluded assets), including equipment, owned real property valued at $5.0 million or more and all present and future shares of capital stock of each of the Issuers’ and each guarantor’s material directly 100% owned domestic subsidiaries and 65% of the present and future shares of capital stock, of each of the Issuers’ and each guarantor’s directly owned foreign restricted subsidiaries (other than Canadian subsidiaries), in each case subject to the Rule 3-16 exclusion described below, certain other exceptions and customary permitted liens. In addition, the notes and the guarantees are secured by a second-priority lien on substantially all of the Issuers’ and the guarantors’ present and future assets, which assets also secure the Issuers’ obligations under the ABL facilities, including accounts receivable, inventory, related general intangibles, certain other related assets and the proceeds thereof.
The capital stock and other securities of any subsidiary will be excluded from the collateral securing the notes and the guarantees to the extent that the pledge of such capital stock and other
F-24
Table of Contents
securities would result in the Company being required to file separate financial statements of such subsidiary with the Securities and Exchange Commission pursuant to Rule 3-16 or Rule 3-10 of Regulation S-X under the Securities Act of 1933, as amended. Rule 3-16 of Regulation S-X requires the presentation of a company’s standalone, audited financial statements if that company’s capital stock or other securities are pledged to secure the securities of another issuer, and the greatest of the principal amount, par value, book value and market value of the pledged stock or securities equals or exceeds 20% of the principal amount of the securities secured by such pledge. Accordingly, the collateral securing the notes and the guarantees may in the future exclude the capital stock and securities of the Company’s subsidiaries, in each case to the extent necessary to not be subject to such requirement.
Optional Redemption. The Issuers have the option to redeem the notes, in whole or in part, at any time on or after November 1, 2013 at redemption prices (expressed as percentages of principal amount of the notes to be redeemed) of 106.844%, 104.563%, 102.281% and 100.000% during the 12-month periods commencing on November 1, 2013, 2014, 2015 and 2016, respectively, plus accrued and unpaid interest thereon, if any, to, but excluding, the applicable redemption date. Prior to November 1, 2013, the Issuers may redeem the notes, in whole or in part, at a redemption price equal to 100% of the principal amount thereof plus a make-whole premium. In addition, prior to November 1, 2013, the Issuers may on one or more occasions redeem up to 35% of the aggregate principal amount of the notes from the net cash proceeds of one or more equity offerings (to the extent such net cash proceeds are received by or contributed to the Company) at a redemption price equal to 109.125% of the aggregate principal amount thereof, plus accrued and unpaid interest thereon, if any, to, but excluding, the applicable redemption date; provided that (a) at least 50% of the sum of the aggregate principal amount of notes originally issued under the Indenture remains outstanding immediately after the occurrence of each such redemption and (b) that each such redemption occurs within 120 days of the date of closing of each such equity offering. In addition, during any 12-month period prior to November 1, 2013, the Issuers may redeem up to 10% of the aggregate principal amount of the notes issued under the Indenture at a redemption price equal to 103.000% of the principal amount thereof plus accrued and unpaid interest thereon, if any, to, but excluding, the applicable redemption date.
Change of Control. Upon the occurrence of a change of control, as defined in the Indenture, the Issuers must give holders of notes the opportunity to sell the Issuers their notes at 101% of their face amount, plus accrued and unpaid interest, if any, to, but excluding, the repurchase date.
Covenants. The Indenture contains covenants limiting the Issuers’ ability and the ability of their restricted subsidiaries to, among other things: pay dividends or distributions, repurchase equity, prepay junior debt and make certain investments; incur additional debt or issue certain disqualified stock and preferred stock; incur liens on assets; merge or consolidate with another company or sell all or substantially all assets; enter into transactions with affiliates; and enter into agreements that would restrict our subsidiaries to pay dividends or make other payments to us. These covenants are subject to important exceptions and qualifications as described in the Indenture. Most of these covenants will cease to apply for so long as the notes have investment grade ratings from both Moody’s Investors Service, Inc. and Standard & Poor’s.
ABL Facilities
On October 13, 2010, in connection with the consummation of the Merger, Associated Materials entered into the ABL facilities in the amount of $225.0 million (comprised of a $150.0 million U.S. facility and a $75.0 million Canadian facility) pursuant to a revolving credit agreement maturing in 2015 (as amended, “Revolving Credit Agreement”).
On April 26, 2012, Associated Materials, Holdings, certain direct or indirect wholly owned U.S. and Canadian restricted subsidiaries of Associated Materials designated as a borrower or guarantor
F-25
Table of Contents
under the Revolving Credit Agreement, certain of the lenders party to the Revolving Credit Agreement, UBS AG, Stamford Branch and UBS AG Canada Branch, as administrative and collateral agents, and Wells Fargo Capital Finance, LLC, as co-collateral agent, entered into Amendment No. 1 (“Amendment”) to the Revolving Credit Agreement, which, among other things, reallocates (i) $8.5 million of the $150.0 million U.S. revolving credit commitments in existence prior to the Amendment (“Pre-Amended U.S. Facility”) as U.S. tranche B revolving credit commitments and the remaining $141.5 million of the Pre-Amended U.S. Facility as U.S. tranche A revolving credit commitments and (ii) $3.5 million of the $75.0 million Canadian revolving credit commitments in existence prior to the Amendment (“Pre-Amended Canadian Facility”) as Canadian tranche B revolving credit commitments and the remaining $71.5 million of the Pre-Amended Canadian Facility as Canadian tranche A revolving credit commitments. The U.S. and Canadian tranche B revolving facilities are “first-in, last-out,” which requires the entire principal amount available for borrowing under the U.S. and Canadian tranche B revolving credit facilities to be drawn in full before any loans may be drawn under the U.S. and Canadian tranche A revolving credit facilities, and are subject to separate borrowing base restrictions, which provide higher advance rates, for such facilities. The outstanding swingline loans and outstanding letters of credit under the pre-amended Revolving Credit Agreement have been continued under the U.S. and Canadian tranche A revolving facilities, as applicable, under the Revolving Credit Agreement. The U.S. and Canadian tranche B revolving facilities are available for borrowing from January 1 to September 30 of each year and must be repaid in full by October 1 of each year.
Interest Rate and Fees. At the Company’s option, the U.S. and Canadian tranche A revolving credit loans under the Revolving Credit Agreement bear interest at the rate equal to (1) the London Interbank Offered Rate (“LIBOR”) (for eurodollar loans under the U.S. facility) or the Canadian Dealer Offered Rate (“CDOR”) (for loans under the Canadian facility), plus an applicable margin of 2.75% as of December 29, 2012, or (2) the alternate base rate (for alternate base rate loans under the U.S. facility, which is the highest of a prime rate, the Federal Funds Effective Rate plus 0.50% and a one-month LIBOR rate plus 1.0% per annum) or the alternate Canadian base rate (for loans under the Canadian facility, which is the higher of a Canadian prime rate and the 30-day CDOR Rate plus 1.0%), plus an applicable margin of 1.75% as of December 29, 2012, in each case, which interest rate margin may vary in 25 basis point increments between three pricing levels determined by reference to the average excess availability in respect of the U.S. and Canadian tranche A revolving credit loans. The interest rate margins in respect of the U.S. and Canadian tranche B revolving credit loans are 200 basis points higher than a corresponding loan under either the U.S. or Canadian tranche A revolving credit facilities, as applicable. In addition to paying interest on outstanding principal under the revolving credit facility, the Company is required to pay a commitment fee (i) in respect of the U.S. and Canadian tranche A revolving credit loans, payable quarterly in arrears, of 0.50% if the average daily undrawn portion of the U.S. or Canadian tranche A revolving credit loans, as applicable, is less than or equal to 50% as of the most recent fiscal quarter or 0.375% if the average daily undrawn portion of the U.S. and Canadian tranche A revolving credit loans, as applicable, is greater than 50% as of the most recent fiscal quarter and (ii) in respect of the U.S. and Canadian tranche B revolving credit loans, payable quarterly in arrears, of 0.75%. After giving effect to the Amendment, the aggregate revolving credit commitments under the Revolving Credit Agreement were not increased.
Borrowing Base. Availability under the U.S. and Canadian facilities are subject to a borrowing base, which is based on eligible accounts receivable and inventory of certain of the Company’s U.S. subsidiaries and eligible accounts receivable, inventory and, with respect to the Canadian tranche A revolving credit loans, equipment and real property, of certain of the Company’s Canadian subsidiaries, after adjusting for customary reserves established or modified from time to time by and at the permitted discretion of the administrative agent thereunder. To the extent that eligible accounts receivable, inventory, equipment and real property decline, the Company’s borrowing base will decrease and the availability under the Revolving Credit Facility may decrease below $225.0 million. In addition, if the
F-26
Table of Contents
amount of outstanding borrowings and letters of credit under the U.S. and Canadian facilities exceeds the borrowing base or the aggregate revolving credit commitments, the Company is required to prepay borrowings to eliminate the excess.
Guarantors. All obligations under the U.S. facility are guaranteed by each existing and subsequently acquired direct and indirect wholly owned material U.S. restricted subsidiary of the Company and the direct parent of the Company, other than certain excluded subsidiaries (“U.S. guarantors”). All obligations under the Canadian facility are guaranteed by each existing and subsequently acquired direct and indirect wholly owned material Canadian restricted subsidiary of the Company, other than certain excluded subsidiaries (“Canadian guarantors,” and together with U.S. guarantors, “ABL guarantors”) and the U.S. guarantors.
Security. The U.S. security agreement provides that all obligations of the U.S. borrowers and the U.S. guarantors are secured by a first-priority perfected security interest in substantially all of the present and future property and assets of the Company, including a first priority security interest in the capital stock of the Company and a second-priority security interest in the capital stock of each direct, material wholly owned restricted subsidiary of the Company. The Canadian security agreement provides that all obligations of the Canadian borrowers and the Canadian guarantors are secured by the U.S. ABL collateral and a first-priority perfected security interest in substantially all of the Company’s Canadian assets, including a first priority security interest in the capital stock of the Canadian borrowers and each direct, material wholly owned restricted subsidiary of the Canadian borrowers and Canadian guarantors.
Covenants, Representations and Warranties. The Revolving Credit Agreement contains customary representations and warranties and customary affirmative and negative covenants, including, with respect to negative covenants, among other things, restrictions on indebtedness, liens, investments, fundamental changes, asset sales, dividends and other distributions, prepayments or redemption of junior debt, transactions with affiliates and negative pledge clauses. There are no financial covenants included in the Revolving Credit Agreement, other than a springing fixed charge coverage ratio of at least 1.00 to 1.00, which will be tested only when excess availability is less than the greater of (i) 12.5% of the sum of (x) the lesser of (A) the U.S tranche A defined borrowing base and (B) the U.S tranche A revolving credit commitments and (y) the lesser of (A) the Canadian tranche A defined borrowing base and (B) the Canadian tranche A revolving credit commitments and (ii) $20.0 million for a period of five consecutive business days until the 30th consecutive day when excess availability exceeds the above threshold. The fixed charge coverage ratio was 1.26:1.00 for the four consecutive fiscal quarter test period ended December 29, 2012. The Company has not triggered such fixed charge coverage ratio covenant for 2012 and does not expect to be required to test such covenant for 2013.
As of December 29, 2012, there was $78.2 million drawn under the Company’s revolving credit commitment and $70.2 million available for additional borrowings. The per annum interest rate applicable to borrowings under the U.S. portion and the Canadian portion of the revolving credit commitment was 3.4% and 5.0%, respectively as of December 29, 2012. The Company had letters of credit outstanding of $9.3 million as of December 29, 2012 primarily securing deductibles of various insurance policies.
0.50% Subordinated Convertible Promissory Notes due 2011
On October 13, 2010, in connection with the Merger, Parent issued 0.50% Subordinated Convertible Promissory Notes due 2011 (the “convertible notes”) to certain investment funds affiliated with H&F (the “H&F Investors”) with a maturity date of April 13, 2011. The aggregate principal amount of the convertible notes was $5.0 million. Interest was payable on the convertible notes quarterly in arrears on January 10, April 10, July 10 and October 10 of each year, with the first payment made on
F-27
Table of Contents
January 10, 2011. Any interest payable on the convertible notes on any interest payment date was paid by adding an amount equal to the interest payable on such interest payment date to the then outstanding principal amount on such interest payment date.
In November 2010, Parent issued 10,000 shares of common stock to a director pursuant to a stock subscription agreement. Parent instructed the director to pay the $100,000 subscription price to the H&F Investors as a partial prepayment of the outstanding principal of and accrued interest on the convertible notes. As a result, the outstanding principal amount of the convertible notes was $4.9 million at January 1, 2011.
In April 2011, upon conversion of the convertible notes by the H&F Investors, Parent issued 491,229 shares of Parent common stock to the H&F Investors in full repayment of the outstanding principal of and accrued interest on the convertible notes of $4.9 million.
13. INCOME TAXES
(Loss) income before income taxes is as follows (in thousands):
| Year Ended December 29, 2012 |
Year Ended December 31, 2011 |
October 13, 2010 to January 1, 2011 |
January 3, 2010 to October 12, 2010 |
|||||||||||||||
| Successor | Predecessor | |||||||||||||||||
| U.S. |
$ | (42,743 | ) | $ | (202,202 | ) | $ | (50,800 | ) | $ | (98,441 | ) | ||||||
| Canada |
9,993 | (21,023 | ) | (5,667 | ) | 32,387 | ||||||||||||
|
|
|
|
|
|
|
|
|
|||||||||||
| $ | (32,750 | ) | $ | (223,225 | ) | $ | (56,467 | ) | $ | (66,054 | ) | |||||||
|
|
|
|
|
|
|
|
|
|||||||||||
Income tax expense (benefit) for the periods presented consists of (in thousands):
| Year Ended December 29, 2012 |
Year Ended December 31, 2011 |
October 13, 2010 to January 1, 2011 |
January 3, 2010 to October 12, 2010 |
|||||||||||||||
| Successor | Predecessor | |||||||||||||||||
| Current: |
||||||||||||||||||
| Federal |
$ | (107 | ) | $ | 1,462 | $ | — | $ | (3,218 | ) | ||||||||
| State |
328 | 844 | 92 | 477 | ||||||||||||||
| Foreign |
7,445 | 9,876 | 194 | 3,683 | ||||||||||||||
|
|
|
|
|
|
|
|
|
|||||||||||
| 7,666 | 12,182 | 286 | 942 | |||||||||||||||
|
|
|
|
|
|
|
|
|
|||||||||||
| Deferred: |
||||||||||||||||||
| Federal |
(240 | ) | (18,434 | ) | 10,036 | 452 | ||||||||||||
| State |
(478 | ) | (4,658 | ) | 66 | (2,060 | ) | |||||||||||
| Foreign |
(1,343 | ) | (9,524 | ) | (1,835 | ) | 5,886 | |||||||||||
|
|
|
|
|
|
|
|
|
|||||||||||
| (2,061 | ) | (32,616 | ) | 8,267 | 4,278 | |||||||||||||
|
|
|
|
|
|
|
|
|
|||||||||||
| Income tax expense (benefit) |
$ | 5,605 | $ | (20,434 | ) | $ | 8,553 | $ | 5,220 | |||||||||
|
|
|
|
|
|
|
|
|
|||||||||||
F-28
Table of Contents
Deferred income taxes reflect the net tax effects of temporary differences between the carrying amount of assets and liabilities for financial reporting purposes and the amounts used for income tax purposes. Significant components of the Company’s deferred income taxes are as follows (in thousands):
| December 29, 2012 |
December 31, 2011 |
|||||||
| Deferred income tax assets: |
||||||||
| Medical benefits |
$ | 2,085 | $ | 2,135 | ||||
| Allowance for doubtful accounts |
3,556 | 2,959 | ||||||
| Pension and other postretirement plans |
16,561 | 14,876 | ||||||
| Inventory costs |
1,111 | 1,166 | ||||||
| Warranty costs |
36,167 | 37,921 | ||||||
| Net operating loss carryforwards |
128,789 | 132,871 | ||||||
| Foreign tax credit carryforwards |
4,455 | 4,455 | ||||||
| Accrued expenses and other |
16,060 | 15,853 | ||||||
|
|
|
|
|
|||||
| Total deferred income tax assets |
208,784 | 212,236 | ||||||
| Valuation allowance |
(69,904 | ) | (57,832 | ) | ||||
|
|
|
|
|
|||||
| Net deferred income tax assets |
138,880 | 154,404 | ||||||
|
|
|
|
|
|||||
| Deferred income tax liabilities: |
||||||||
| Depreciation |
22,325 | 26,314 | ||||||
| Intangible assets |
213,071 | 220,440 | ||||||
| Tax liability on unremitted foreign earnings |
— | 4,693 | ||||||
| Gain on debt extinguishment |
22,321 | 23,385 | ||||||
| Other |
6,675 | 8,224 | ||||||
|
|
|
|
|
|||||
| Total deferred income tax liabilities |
264,392 | 283,056 | ||||||
|
|
|
|
|
|||||
| Net deferred income tax liabilities |
$ | (125,512 | ) | $ | (128,652 | ) | ||
|
|
|
|
|
|||||
As of December 29, 2012, the Company has U.S. federal net operating loss (“NOL”) carryforwards of $327.5 million and foreign tax credit carryforwards of $4.5 million. The U.S. NOL carryforwards expire in years 2029 through 2032 and the foreign tax credit carryforward expires in year 2017. In addition, the Company has tax benefits related to state NOLs of $17.0 million, which expire in the years 2014 through 2031.
As of December 29, 2012, the Company had total federal, state, and foreign deferred tax assets before valuation allowances of $175.4 million, $23.3 million, and $10.1 million, respectively. As of December 29, 2012, $138.9 million of the total deferred tax assets of $208.8 million was considered more likely than not to be realized, resulting in a valuation allowance of $69.9 million. Of this amount, $59.6 million relates to U.S. federal and $10.3 million relates to state jurisdictions. ASC 740 requires that a valuation allowance be recorded against deferred tax assets when it is more likely than not that some or all of a company’s deferred tax assets will not be realized based on available positive and negative evidence. To the extent the reversal of deferred tax liabilities is relied upon in the Company’s assessment of the realizability of deferred tax assets, the Company has determined that they will reverse in the same period and jurisdiction as the temporary differences giving rise to the deferred tax assets. Deferred tax liabilities related to non-amortizable intangibles or otherwise not reversing, were not offset against deferred tax assets. The Company has not identified any significant U.S. tax planning strategies to support the utilization of deferred tax assets. After reviewing all available positive and negative evidence as of December 29, 2012 and December 31, 2011, the Company recorded a full valuation allowance against its U.S. net federal deferred tax assets since the Company is in a three-year cumulative loss position in the U.S. and it was unable to identify any strong positive evidence,
F-29
Table of Contents
other than the reversal of the appropriate deferred tax liabilities. The net valuation allowance provided against these U.S. net deferred tax assets during 2012 increased by $12.1 million. Of this amount, $10.7 million was recorded as an increase in the current year provision for income taxes with the remainder being reflected through other comprehensive income. The Company reviews its valuation allowance related to deferred tax assets and will reverse this valuation allowance, partially or totally, when, and if, appropriate under ASC 740. The Company is in a net deferred tax liability position in Canada. The future reversal of existing Canadian deferred tax liabilities are of the appropriate character and timing such that all of its Canadian deferred tax assets are considered more likely than not realizable.
The reconciliation of the statutory rate to the Company’s effective income tax rate for the periods presented is as follows:
| Year Ended December 29, 2012 |
Year Ended December 31, 2011 |
October 13, 2010 to January 1, 2011 |
January 3, 2010 to October 12, 2010 |
|||||||||||||||
| Successor | Predecessor | |||||||||||||||||
| Statutory rate |
(35.0 | )% | (35.0 | )% | (35.0 | )% | (35.0 | )% | ||||||||||
| State income tax, net of federal income tax benefit |
(0.3 | )% | (2.3 | )% | (3.3 | )% | (4.4 | )% | ||||||||||
| Tax liability on remitted and unremitted foreign earnings |
12.4 | % | 0.2 | % | (4.2 | )% | 36.8 | % | ||||||||||
| Goodwill impairment |
— | % | 12.4 | % | — | % | — | % | ||||||||||
| Foreign rate differential |
(2.8 | )% | 0.7 | % | 0.6 | % | (2.3 | )% | ||||||||||
| Valuation allowance |
32.7 | % | 10.7 | % | 53.2 | % | 9.0 | % | ||||||||||
| Foreign tax credit and withholding taxes |
7.3 | % | 1.8 | % | — | % | — | % | ||||||||||
| Non-deductible merger transaction costs |
— | % | — | % | 3.2 | % | 3.3 | % | ||||||||||
| Other |
2.8 | % | 2.3 | % | 0.6 | % | 0.5 | % | ||||||||||
|
|
|
|
|
|
|
|
|
|||||||||||
| Effective rate |
17.1 | % | (9.2 | )% | 15.1 | % | 7.9 | % | ||||||||||
|
|
|
|
|
|
|
|
|
|||||||||||
It is the Company’s intent to remit all earnings from its foreign subsidiary and, as of December 29, 2012, the Company had repatriated all foreign earnings. Accordingly, a deferred tax liability is not necessary.
A reconciliation of the unrecognized tax benefits for the periods presented is as follows (in thousands):
| Year Ended December 29, 2012 |
Year Ended December 31, 2011 |
October 13, 2010 to January 1, 2011 |
January 3, 2010 to October 12, 2010 |
|||||||||||||||
| Successor | Predecessor | |||||||||||||||||
| Unrecognized tax benefits, beginning of year |
$ | 7,860 | $ | 4,465 | $ | 2,775 | $ | 964 | ||||||||||
| Gross increases for tax positions of prior years |
707 | 3,594 | — | — | ||||||||||||||
| Gross increases for tax positions of the current year |
81 | — | 1,690 | 2,140 | ||||||||||||||
| Gross decreases for tax positions of prior years |
(142 | ) | (177 | ) | — | — | ||||||||||||
| Settlements |
(1,360 | ) | (22 | ) | — | (329 | ) | |||||||||||
|
|
|
|
|
|
|
|
|
|||||||||||
| Unrecognized tax benefits, end of year |
$ | 7,146 | $ | 7,860 | $ | 4,465 | $ | 2,775 | ||||||||||
|
|
|
|
|
|
|
|
|
|||||||||||
F-30
Table of Contents
As of December 29, 2012 and December 31, 2011, the Company recorded $0.1 million and $0.2 million, respectively, of accrued interest related to uncertain tax positions.
As of December 29, 2012, the Company is subject to U.S. federal income tax examinations for the tax years 2008 through 2011 and to non-U.S. income tax examinations for the tax years of 2005 through 2011. In addition, the Company is subject to state and local income tax examinations for the tax years 2006 through 2011. The Company had unrecognized tax benefits and accrued interest that would affect the Company’s effective tax rate if recognized of approximately $1.2 million and $3.4 million as of December 29, 2012 and December 31, 2011, respectively. The Company is currently undergoing examinations of its U.S. federal, non-U.S. federal and certain state income tax returns. During 2012, the Company agreed to U.S. federal tax adjustments of $1.3 million related to the 2009 tax year. The final outcome of any other examinations are not yet determinable; however, management anticipates that adjustments to unrecognized tax benefits, if any, would not result in a material change to the results of operations, financial condition, or liquidity.
Parent files consolidated income tax returns on behalf of Associated Materials and its subsidiaries. Associated Materials and each of its subsidiaries entered into a tax sharing agreement under which federal income taxes are computed by the Company and each of its subsidiaries on a separate return basis. As of December 29, 2012 and December 31, 2011, there were no amounts due to or payable from Parent related to the tax sharing agreement.
14. STOCKHOLDERS’ EQUITY
Parent has two classes of capital stock, preferred stock and common stock. As of December 29, 2012, there are 5 million shares of preferred stock, par value $0.01 per share, authorized. There were no preferred shares issued and outstanding as of December 29, 2012 or December 31, 2011. As of December 29, 2012, there are 200 million shares of common stock, par value $0.01 per share, authorized. Parent has 55,686,894 and 55,662,894 shares of common stock issued and outstanding as of December 29, 2012 and December 31, 2011, respectively.
In September 2011, Jerry W. Burris, President and Chief Executive Officer of the Company, purchased 220,000 shares of common stock at a fair market value of $5 per share. As consideration for a portion of the purchase price, the Company accepted a $0.8 million promissory note from Mr. Burris. The note accrued interest at 1.63% per annum and had a maturity date of March 31, 2014. A principal payment of $0.1 million was made on March 31, 2012. The balance of the note receivable, including accrued interest, was $0.7 million and $0.8 million as of December 29, 2012 and December 31, 2011, respectively. The outstanding principal amount of and accrued interest on the promissory note were repaid in full by Mr. Burris on June 27, 2013.
15. STOCK PLANS
On October 13, 2010, Parent’s board of directors adopted the AMH Investment Holdings Corp. 2010 Stock Incentive Plan (“2010 Plan”). The 2010 Plan is an incentive compensation plan that permits grants of equity-based compensation awards to employees, directors and consultants of the Company. Awards under the 2010 Plan may be in the form of stock options (either incentive stock options or non-qualified stock options) or other stock-based awards, including restricted stock awards and stock appreciation rights. The maximum number of shares reserved for the grant or settlement of awards under the 2010 Plan is 6,150,076 shares of Parent common stock, subject to adjustment in the event of any share dividend or split, reorganization, recapitalization, merger, consolidation, spin-off, combination, or any extraordinary dividend or other similar corporate transaction. Any shares subject to awards which terminate or lapse without payment of consideration may be granted again under the 2010 Plan. In the event of a change in control, Parent’s compensation committee may, at its discretion,
F-31
Table of Contents
accelerate the vesting or cause any restrictions to lapse with respect to outstanding awards, or may cancel such awards for fair value, or may provide for the issuance of substitute awards.
Options granted under the 2010 Plan were awarded at exercise prices at or above the fair market value of such stock on the date of grant. Each option holder was granted awards with time-based vesting and performance-based vesting provisions. Subject to the option holder’s continued employment on each vesting date, the time-based options vest with respect to 20% of the shares on each anniversary of the grant date, with accelerated vesting of all unvested shares in the event of a change in control, as defined in the 2010 Plan. Subject to the option holder’s continued employment on each vesting date, the performance-based options vest based on the achievement of Adjusted EBITDA targets as established by Parent’s compensation committee annually with respect to 20% of the shares per year over a five-year period, or if the target for a given year is not achieved, the option may vest if the applicable Adjusted EBITDA target is achieved in the next succeeding year. In addition, the performance-based options also provide that in the event of a change in control, that portion of the option that was scheduled to vest in the year in which the change in control occurs and in any subsequent years shall become vested immediately prior to such change in control. Each option award has a contractual life of ten years.
The stock underlying the options awarded under the 2010 Plan is governed by the stockholders agreement of Parent. Stock purchased as a result of the exercise of options is subject to a call right by Parent, and as a result, other than in limited circumstances, stock issued upon the exercise of the option may be repurchased at the right of Parent. This repurchase feature results in no compensation expense recognized in connection with options granted by Parent, until such time as the exercise of the options could occur without repurchase of the shares by Parent, which is only likely to occur upon a liquidity event, change in control or the completion of an initial public offering of shares of Parent’s common stock. Upon such liquidity event, change in control or initial public offering, the repurchase feature, with respect to outstanding option awards, is removed and compensation expense related to all option awards, to the extent vested, is recognized immediately.
Stock option activity during the year ended December 29, 2012 is summarized below:
| Shares | Weighted Average Exercise Price |
Remaining Contractual Term (Years) |
||||||||||
| Options outstanding December 31, 2011 |
4,444,489 | $ | 11.94 | |||||||||
| Granted |
1,192,839 | 10.15 | ||||||||||
| Exercised |
— | — | ||||||||||
| Forfeited |
(1,125,658 | ) | 12.60 | |||||||||
|
|
|
|
|
|||||||||
| Options outstanding December 29, 2012 |
4,511,670 | $ | 11.30 | 8.6 | ||||||||
|
|
|
|
|
|
|
|||||||
| Options exercisable December 29, 2012 |
985,658 | $ | 12.80 | 8.2 | ||||||||
|
|
|
|
|
|
|
|||||||
The fair value of the options granted during 2012, 2011 and 2010 was estimated at the date of the grant using the Black-Scholes model. The weighted average assumptions and fair value of the options were as follows:
| Year Ended December 29, 2012 |
Year Ended December 31, 2011 |
October 13, 2010 to January 1, 2011 |
||||||||||
| Dividend yield |
— | % | — | % | — | % | ||||||
| Annual risk-free rate |
1.69 | % | 1.92 | % | 2.17 | % | ||||||
| Expected life of options (years) |
8.27 | 8.57 | 8.37 | |||||||||
| Volatility |
51.0 | % | 54.8 | % | 52.3 | % | ||||||
| Weighted average fair value of options granted per share |
$ | 1.74 | $ | 2.51 | $ | 3.88 | ||||||
F-32
Table of Contents
The expected dividend yield is based on Parent’s historical and expected future dividend policy. The annual risk-free interest rate is based on zero coupon treasury bond rates corresponding to the expected life of the awards. The expected lives of the awards are based on the contractual term, the vesting period and the expected lives used by a peer group with similar option terms. Due to the fact that the shares of common stock of both Parent and the Predecessor’s then indirect parent company have not and do not trade publicly, the expected volatility assumption was derived by referring to changes in the common stock prices of several peer companies (with respect to industry, size and leverage) over the same timeframe as the expected life of the awards.
In September 2011, Parent’s board of directors modified certain performance-based and time-based options held by eligible participants to reduce the exercise price of such options. The number of options repriced was 2.4 million to 43 employees, with a weighted average exercise price prior to repricing of $19.25 and an average remaining contractual life of 9.3 years. The compensation cost relating to this repricing resulted in additional unrecognized non-cash expense of $1.3 million that may be recognized over the remaining life of the options subject to vesting conditions.
In June 2011, Parent’s board of directors modified certain outstanding performance-based options held by eligible participants to reduce the Adjusted EBITDA target of such options for the portion of the award vesting in 2011 and to defer the establishment of Adjusted EBITDA targets for subsequent tranches, which will be set at an amount equal to or greater than the Company’s budgeted Adjusted EBITDA as determined by Parent’s board of directors within 90 days of the commencement of each fiscal year. The number of options included in the modification was 0.5 million to 8 employees, with a weighted average exercise price of $10.00 and an average remaining contractual life of 9.3 years. There was no incremental compensation cost related to this modification.
All of the outstanding options issued pursuant to the Predecessor’s equity plans to acquire shares of the Company’s then direct and indirect parent companies’ common stock (except those options that were subject to vesting solely upon the achievement of certain internal rates of return in their investment in the Predecessor by our previous investors) became vested immediately prior to the Merger. Each vested option was redeemed for an amount of cash equal to the product of (1) the number of shares of common stock subject to each option as of the effective time of the Merger multiplied by (2) the excess, if any, of $133.95 over the exercise price per share of common stock subject to such option. Total cash paid to redeem outstanding options and warrants in connection with the Merger was $43.9 million, which was included in the Successor’s statement of cash flows as part of the acquisition in investing activities. The remaining unvested options under the Predecessor’s equity plans were cancelled in exchange for a nominal payment. In addition, immediately prior to the Merger, certain of the option awards were modified to eliminate provisions which caused variability in the number of shares underlying the options. In accordance with ASC 718, the Company determined the fair value of the options at the date of modification and recognized stock compensation expense for the amounts in excess of previously recorded amounts. The fair value of the modification, along with the fair value of an in-the-money stock option award granted to the Company’s then Chief Executive Officer immediately prior to the Merger, totaled $38.0 million, which was recorded in the Predecessor’s results of operations during the fourth quarter of 2010.
Grants of restricted stock have been awarded to certain officers and board members under the 2010 Plan. The awards vest at various dates with vesting periods up to five years. The weighted average fair value of restricted share awards granted in 2012 and 2011 was $4.25 and $5.89,
F-33
Table of Contents
respectively, and was calculated using the estimated market value of the shares on the date of grant. No restricted stock grants were made in 2010. The following table summarizes the Company’s restricted stock award activity for the year ended December 29, 2012:
| Shares | Weighted Average Fair Value Per Share |
|||||||
| Nonvested at December 31, 2011 |
24,000 | $ | 4.25 | |||||
| Granted |
27,000 | 4.25 | ||||||
| Vested |
(24,000 | ) | 4.25 | |||||
| Forfeited |
— | — | ||||||
|
|
|
|
|
|||||
| Nonvested at December 29, 2012 |
27,000 | $ | 4.25 | |||||
|
|
|
|
|
|||||
As of December 29, 2012, there was $12.7 million of unrecognized compensation cost related to Parent’s stock based awards granted under the 2010 Plan and this cost is expected to be recognized at the time of a liquidity event, IPO or earlier exercise. Compensation cost of $0.1 million and $0.7 million was incurred related to Parent’s stock-based compensation plans recorded during 2012 and 2011, respectively, which was primarily included in selling, general and administrative expenses in the accompanying Consolidated Statements of Operations. The Company did not receive any cash as a result of vesting and exercise of stock-based compensation awards for the year ended December 29, 2012.
16. RETIREMENT PLANS
The Company sponsors defined benefit pension plans which cover hourly workers at its West Salem, Ohio plant, and hourly union employees at its Woodbridge, New Jersey plant as well as a defined benefit retirement plan covering U.S. salaried employees, which was frozen in 1998 and subsequently replaced with a defined contribution plan (the “Domestic Plans”). The Company also sponsors a defined benefit pension plan covering the Canadian salaried employees and hourly union employees at the Lambeth, Ontario plant, a defined benefit pension plan for the hourly union employees at its Burlington, Ontario plant and a defined benefit pension plan for the hourly union employees at its Pointe Claire, Quebec plant (the “Foreign Plans”).
The Company also provides postretirement benefits other than pension (“OPEB plans”) including health care or life insurance benefits to certain U.S. and Canadian retirees and in some cases, their spouses and dependents. The Company’s postretirement benefit plans in the U.S. include an unfunded health care plan for hourly workers at the Company’s former steel siding plant in Cuyahoga Falls, Ohio. With the closure of this facility in 1991, no additional employees are eligible to participate in this plan. There are three other U.S. unfunded plans covering either life insurance or health care benefits for small frozen groups of retirees. The Company’s foreign postretirement benefit plan provides life insurance benefits to active members at its Pointe Claire, Quebec plant and a closed group of Canadian salaried retirees. The actuarial valuation measurement date for the defined pension plans and postretirement benefits other than pension is December 31.
The Company sponsors defined contribution plans, which are qualified as tax-exempt plans. The plans cover all full-time, non-union employees with matching contributions of up to 3.5% of eligible compensation in both the United States and Canada, depending on length of service and levels of contributions. The Company’s pre-tax contributions to its defined contribution plans were $2.4 million for the year ended December 29, 2012 and $1.8 million for the year ended December 31, 2011. The Company did not make any matching contributions for the successor period October 13, 2010 to January 1, 2011 or for the predecessor period January 3, 2010 to October 12, 2010.
F-34
Table of Contents
The change in benefit obligation and plan assets for the Company’s defined benefit pension and OPEB plans are as follows (in thousands):
| December 29, 2012 | December 31, 2011 | |||||||||||||||||||||||
| Domestic Plans |
Foreign Plans |
OPEB Plans | Domestic Plans |
Foreign Plans |
OPEB Plans | |||||||||||||||||||
| Change in projected benefit obligation: |
||||||||||||||||||||||||
| Projected benefit obligation at beginning of period |
$ | 68,462 | $ | 72,700 | $ | 6,245 | $ | 59,435 | $ | 67,119 | $ | 6,408 | ||||||||||||
| Service cost |
752 | 2,421 | 13 | 620 | 2,575 | 11 | ||||||||||||||||||
| Interest cost |
3,056 | 3,925 | 233 | 3,095 | 3,782 | 272 | ||||||||||||||||||
| Plan amendments |
5 | — | — | — | 457 | — | ||||||||||||||||||
| Actuarial loss |
5,417 | 8,813 | 109 | 8,441 | 2,495 | 95 | ||||||||||||||||||
| Participant contributions |
— | 329 | 7 | — | 349 | 8 | ||||||||||||||||||
| Benefits paid |
(3,469 | ) | (4,269 | ) | (589 | ) | (3,129 | ) | (2,322 | ) | (582 | ) | ||||||||||||
| Retiree drug subsidy reimbursement |
— | — | 41 | — | — | 41 | ||||||||||||||||||
| Effect of foreign exchange |
— | 1,775 | 8 | — | (1,755 | ) | (8 | ) | ||||||||||||||||
|
|
|
|
|
|
|
|
|
|
|
|
|
|||||||||||||
| Projected benefit obligation at end of period |
74,223 | 85,694 | 6,067 | 68,462 | 72,700 | 6,245 | ||||||||||||||||||
|
|
|
|
|
|
|
|
|
|
|
|
|
|||||||||||||
| Change in plan assets: |
||||||||||||||||||||||||
| Fair value of assets at beginning of period |
42,943 | 54,122 | — | 42,038 | 53,983 | — | ||||||||||||||||||
| Actual return on plan assets |
5,194 | 4,515 | — | 14 | (2,445 | ) | — | |||||||||||||||||
| Employer contributions |
3,254 | 5,950 | 582 | 4,020 | 5,837 | 574 | ||||||||||||||||||
| Participant contributions |
— | 329 | 7 | — | 349 | 8 | ||||||||||||||||||
| Benefits paid |
(3,469 | ) | (4,269 | ) | (589 | ) | (3,129 | ) | (2,322 | ) | (582 | ) | ||||||||||||
| Effect of foreign exchange |
— | 1,318 | — | — | (1,280 | ) | — | |||||||||||||||||
|
|
|
|
|
|
|
|
|
|
|
|
|
|||||||||||||
| Fair value of assets at end of period |
47,922 | 61,965 | — | 42,943 | 54,122 | — | ||||||||||||||||||
|
|
|
|
|
|
|
|
|
|
|
|
|
|||||||||||||
| Funded status |
$ | (26,301 | ) | $ | (23,729 | ) | $ | (6,067 | ) | $ | (25,519 | ) | $ | (18,578 | ) | $ | (6,245 | ) | ||||||
|
|
|
|
|
|
|
|
|
|
|
|
|
|||||||||||||
| Accumulated Benefit Obligation |
$ | 74,223 | $ | 78,413 | $ | 6,067 | $ | 68,462 | $ | 66,884 | $ | 6,245 | ||||||||||||
|
|
|
|
|
|
|
|
|
|
|
|
|
|||||||||||||
The amounts recognized in consolidated balance sheets and other comprehensive income (loss) for the Company’s defined benefit pension and OPEB plans are as follows (in thousands):
| December 29, 2012 | December 31, 2011 | |||||||||||||||||||||||
| Domestic Plans |
Foreign Plans |
OPEB Plans | Domestic Plans |
Foreign Plans |
OPEB Plans | |||||||||||||||||||
| Balance sheets: |
||||||||||||||||||||||||
| Accrued liabilities |
$ | — | $ | — | $ | (565 | ) | $ | — | $ | — | $ | (580 | ) | ||||||||||
| Other liabilities |
(26,301 | ) | (23,729 | ) | (5,502 | ) | (25,519 | ) | (18,578 | ) | (5,665 | ) | ||||||||||||
|
|
|
|
|
|
|
|
|
|
|
|
|
|||||||||||||
| Total recognized |
$ | (26,301 | ) | $ | (23,729 | ) | $ | (6,067 | ) | $ | (25,519 | ) | $ | (18,578 | ) | $ | (6,245 | ) | ||||||
|
|
|
|
|
|
|
|
|
|
|
|
|
|||||||||||||
| Accumulated other comprehensive income (loss): |
||||||||||||||||||||||||
| Net actuarial loss (gain) |
$ | 9,331 | $ | 15,111 | $ | 99 | $ | 5,888 | $ | 7,116 | $ | (10 | ) | |||||||||||
| Net prior service cost |
5 | 401 | — | — | 423 | — | ||||||||||||||||||
|
|
|
|
|
|
|
|
|
|
|
|
|
|||||||||||||
| Total recognized |
$ | 9,336 | $ | 15,512 | $ | 99 | $ | 5,888 | $ | 7,539 | $ | (10 | ) | |||||||||||
|
|
|
|
|
|
|
|
|
|
|
|
|
|||||||||||||
F-35
Table of Contents
For the defined benefit pension plans, the estimated net actuarial loss (gain) to be amortized from accumulated other comprehensive loss into periodic benefit cost over the next fiscal year is $0.7 million. Estimated amortization of prior service cost from accumulated other comprehensive loss for 2013 is nominal. For the OPEB plans, there is no net actuarial loss (gain) or prior service cost to be amortized from accumulated other comprehensive loss into periodic benefit cost over the next fiscal year.
The components of net periodic benefit cost for the Company’s pension benefit plans are as follows (in thousands):
| Year Ended December 29, 2012 |
Year Ended December 31, 2011 |
October 13, 2010 to January 1, 2011 |
January 3, 2010 to October 12, 2010 |
|||||||||||||||||||||||||||||||
| Successor | Predecessor | |||||||||||||||||||||||||||||||||
| Domestic Plans |
Foreign Plans |
Domestic Plans |
Foreign Plans |
Domestic Plans |
Foreign Plans |
Domestic Plans |
Foreign Plans |
|||||||||||||||||||||||||||
| Service cost |
$ | 752 | $ | 2,421 | $ | 620 | $ | 2,575 | $ | 165 | $ | 560 | $ | 567 | $ | 1,568 | ||||||||||||||||||
| Interest cost |
3,056 | 3,925 | 3,095 | 3,782 | 647 | 809 | 2,447 | 2,801 | ||||||||||||||||||||||||||
| Expected return on assets |
(3,224 | ) | (3,726 | ) | (3,380 | ) | (3,947 | ) | (688 | ) | (836 | ) | (2,364 | ) | (2,695 | ) | ||||||||||||||||||
| Amortization of prior service cost |
— | 21 | — | 21 | — | — | 23 | 35 | ||||||||||||||||||||||||||
| Amortization of net actuarial loss (gain) |
4 | 45 | (12 | ) | — | — | — | 1,003 | 151 | |||||||||||||||||||||||||
|
|
|
|
|
|
|
|
|
|
|
|
|
|
|
|
|
|||||||||||||||||||
| Net periodic benefit cost |
$ | 588 | $ | 2,686 | $ | 323 | $ | 2,431 | $ | 124 | $ | 533 | $ | 1,676 | $ | 1,860 | ||||||||||||||||||
|
|
|
|
|
|
|
|
|
|
|
|
|
|
|
|
|
|||||||||||||||||||
The components of other comprehensive income (loss) for the Company’s pension benefit plans are as follows (in thousands):
| Year Ended December 29, 2012 |
Year Ended December 31, 2011 |
October 13, 2010 to January 1, 2011 |
January 3, 2010 to October 12, 2010 |
|||||||||||||||||||||||||||||||
| Successor | Predecessor | |||||||||||||||||||||||||||||||||
| Domestic Plans |
Foreign Plans |
Domestic Plans |
Foreign Plans |
Domestic Plans |
Foreign Plans |
Domestic Plans |
Foreign Plans |
|||||||||||||||||||||||||||
| Net actuarial loss (gain) |
$ | 3,447 | $ | 8,040 | $ | 11,807 | $ | 8,627 | $ | (5,930 | ) | $ | (1,512 | ) | $ | 7,597 | $ | 7,983 | ||||||||||||||||
| Prior service cost |
5 | — | — | 443 | — | — | — | — | ||||||||||||||||||||||||||
| Amortization of prior service cost |
— | (21 | ) | — | (21 | ) | — | — | (23 | ) | (35 | ) | ||||||||||||||||||||||
| Amortization of net actuarial (loss) gain |
(4 | ) | (45 | ) | 12 | — | — | — | (1,003 | ) | (151 | ) | ||||||||||||||||||||||
|
|
|
|
|
|
|
|
|
|
|
|
|
|
|
|
|
|||||||||||||||||||
| Total recognized |
$ | 3,448 | $ | 7,974 | $ | 11,819 | $ | 9,049 | $ | (5,930 | ) | $ | (1,512 | ) | $ | 6,571 | $ | 7,797 | ||||||||||||||||
|
|
|
|
|
|
|
|
|
|
|
|
|
|
|
|
|
|||||||||||||||||||
F-36
Table of Contents
The components of net periodic benefit cost for the Company’s OPEB Plans are as follows (in thousands):
| Year Ended December 29, 2012 |
Year Ended December 31, 2011 |
October 13, 2010 to January 1, 2011 |
January 3, 2010 to October 12, 2010 |
|||||||||||||||
| Successor | Predecessor | |||||||||||||||||
| Service cost |
$ | 13 | $ | 11 | $ | 3 | $ | 7 | ||||||||||
| Interest cost |
233 | 272 | 53 | 226 | ||||||||||||||
| Amortization of prior service cost |
— | — | — | 6 | ||||||||||||||
| Amortization of net actuarial loss (gain) |
1 | (3 | ) | — | 19 | |||||||||||||
|
|
|
|
|
|
|
|
|
|||||||||||
| Net periodic benefit cost |
$ | 247 | $ | 280 | $ | 56 | $ | 258 | ||||||||||
|
|
|
|
|
|
|
|
|
|||||||||||
The components of other comprehensive income (loss) for the Company’s OPEB Plans are as follows (in thousands):
| Year Ended December 29, 2012 |
Year Ended December 31, 2011 |
October 13, 2010 to January 1, 2011 |
January 3, 2010 to October 12, 2010 |
|||||||||||||||
| Successor | Predecessor | |||||||||||||||||
| Net actuarial loss (gain) |
$ | 109 | $ | 96 | (109 | ) | $ | 344 | ||||||||||
| Amortization of prior service cost |
— | — | — | (6 | ) | |||||||||||||
| Amortization of net actuarial (loss) gain |
(1 | ) | 3 | — | (19 | ) | ||||||||||||
|
|
|
|
|
|
|
|
|
|||||||||||
| Total recognized |
$ | 108 | $ | 99 | $ | (109 | ) | $ | 319 | |||||||||
|
|
|
|
|
|
|
|
|
|||||||||||
The weighted average assumptions used to determine projected benefit obligation for the Company’s pension and OPEB plans are:
| December 29, 2012 |
December 31, 2011 |
|||||||
| Discount rate: | ||||||||
| Domestic plans |
3.97 | % | 4.54 | % | ||||
| Foreign plans |
4.48 | % | 5.17 | % | ||||
| OPEB plans |
3.43 | % | 4.10 | % | ||||
| Compensation increases: | ||||||||
| Domestic plans |
— | % | — | % | ||||
| Foreign plans |
3.50 | % | 3.50 | % | ||||
The weighted average assumptions used to determine projected net periodic benefit cost for the Company’s pension and OPEB plans are:
| Year Ended December 29, 2012 |
Year Ended December 31, 2011 |
October 13, 2010 to January 1, 2011 |
January 3, 2010 to October 12, 2010 |
|||||||||||||||
| Successor | Predecessor | |||||||||||||||||
| Discount rate: |
||||||||||||||||||
| Domestic plans |
4.54 | % | 5.31 | % | 4.70 | % | 5.77 | % | ||||||||||
| Foreign plans |
5.17 | % | 5.40 | % | 5.30 | % | 6.25 | % | ||||||||||
| OPEB plans |
4.10 | % | 4.75 | % | 4.12 | % | 5.21 | % | ||||||||||
| Long-term rate of return on assets: |
||||||||||||||||||
| Domestic plans |
7.50 | % | 8.00 | % | 8.00 | % | 8.00 | % | ||||||||||
| Foreign plans |
6.50 | % | 7.00 | % | 7.00 | % | 7.00 | % | ||||||||||
| Compensation increases: |
||||||||||||||||||
| Domestic plans |
— | % | — | % | — | % | 3.75 | % | ||||||||||
| Foreign plans |
3.50 | % | 3.50 | % | 3.50 | % | 3.50 | % | ||||||||||
F-37
Table of Contents
The following table presents health care cost trend rates used to determine net periodic benefit cost for the Company’s OPEB plans, as well as information regarding the ultimate cost trend and the year in which their ultimate rate is reached:
| Year Ended December 29, 2012 |
Year Ended December 31, 2011 |
October 13, 2010 to January 1, 2011 |
January 3, 2010 to October 12, 2010 |
|||||||||||||||
| Successor | Predecessor | |||||||||||||||||
| Assumed health care cost trend rate medical claims |
7.5 | % | 8.0 | % | 8.0 | % | 8.5 | % | ||||||||||
| Ultimate health care cost trend |
5.0 | % | 5.0 | % | 5.0 | % | 5.0 | % | ||||||||||
| Ultimate year health care cost trend rate is achieved |
2018 | 2018 | 2017 | 2017 | ||||||||||||||
A one-percentage-point increase (decrease) in the assumed health care cost-trend rates has the following effects on postretirement obligations at December 29, 2012 (in thousands):
| 1% Increase | 1% Decrease | |||||||
| Increase (decrease) in accumulated postretirement benefit obligation |
$ | 389 | $ | (338 | ) | |||
| Increase (decrease) in aggregate service and interest cost |
14 | (12 | ) | |||||
The discounts rates used for the Company’s domestic plans were set on a plan by plan basis and reflect the market rate for high-quality fixed-income U.S. debt instruments that are rated AA or higher by a recognized ratings agency as of the annual measurement date. The discount rate is subject to change each year. In selecting the assumed discount rate, the Company considered current available rates of return expected to be available during the period to maturity of the pension and other postretirement benefit obligations. The discount rate for the Company’s foreign plans was selected on the same basis as described above for the domestic plans, except that the discount rate was evaluated using the spot rates generated by a Canadian corporate AA bond yield curve.
The Company’s financial objectives with respect to its pension plan assets are to provide growth, income from plan assets and benefits to its plan participants. The investment portfolio is designed to maximize investment returns within reasonable and prudent levels of risk, and to maintain sufficient liquidity to meet benefit obligations on a timely basis. The expected return on plan assets takes into consideration expected long-term inflation, historical returns and estimated future long-term returns based on capital market assumptions applied to the asset allocation strategy. The expected return on plan assets assumption considers asset returns over a full market cycle. Target allocations for the Domestic Plans are 60% equities, 35% fixed income and 5% cash and cash equivalents. For the Foreign Plans, target allocations are 60% equities and 40% fixed income.
The fair values of domestic pension plan assets as of December 29, 2012 by asset category are (in thousands):
| December 29, 2012 | ||||||||||||||||
| Quoted Prices in Active Markets for Identical Assets (Level 1) |
Significant Other Observable Inputs (Level 2) |
Significant Unobservable Inputs (Level 3) |
Total | |||||||||||||
| Equity Securities |
$ | 30,297 | $ | — | $ | — | $ | 30,297 | ||||||||
| Mutual Funds |
— | 7,057 | — | 7,057 | ||||||||||||
| Government Securities |
— | 8,612 | — | 8,612 | ||||||||||||
| Money Funds |
— | 1,923 | — | 1,923 | ||||||||||||
| Cash |
33 | — | — | 33 | ||||||||||||
|
|
|
|
|
|
|
|
|
|||||||||
| Total |
$ | 30,330 | $ | 17,592 | $ | — | $ | 47,922 | ||||||||
|
|
|
|
|
|
|
|
|
|||||||||
F-38
Table of Contents
The fair values of domestic pension plan assets as of December 31, 2011 by asset category are (in thousands):
| December 31, 2011 | ||||||||||||||||
| Quoted Prices in Active Markets for Identical Assets (Level 1) |
Significant Other Observable Inputs (Level 2) |
Significant Unobservable Inputs (Level 3) |
Total | |||||||||||||
| Equity Securities |
$ | 26,533 | $ | — | $ | — | $ | 26,533 | ||||||||
| Mutual Funds |
— | 6,529 | — | 6,529 | ||||||||||||
| Government Securities |
— | 7,698 | — | 7,698 | ||||||||||||
| Money Funds |
— | 2,141 | — | 2,141 | ||||||||||||
| Cash |
42 | — | — | 42 | ||||||||||||
|
|
|
|
|
|
|
|
|
|||||||||
| Total |
$ | 26,575 | $ | 16,368 | $ | — | $ | 42,943 | ||||||||
|
|
|
|
|
|
|
|
|
|||||||||
The fair values of foreign pension plan assets as of December 29, 2012 by asset category are (in thousands):
| December 29, 2012 | ||||||||||||||||
| Quoted Prices in Active Markets for Identical Assets (Level 1) |
Significant Other Observable Inputs (Level 2) |
Significant Unobservable Inputs (Level 3) |
Total | |||||||||||||
| Pooled Funds |
$ | — | $ | 61,562 | $ | — | $ | 61,562 | ||||||||
| Cash |
403 | — | — | 403 | ||||||||||||
|
|
|
|
|
|
|
|
|
|||||||||
| Total |
$ | 403 | $ | 61,562 | $ | — | $ | 61,965 | ||||||||
|
|
|
|
|
|
|
|
|
|||||||||
The fair values of foreign pension plan assets as of December 31, 2011 by asset category are (in thousands):
| December 31, 2011 | ||||||||||||||||
| Quoted Prices in Active Markets for Identical Assets (Level 1) |
Significant Other Observable Inputs (Level 2) |
Significant Unobservable Inputs (Level 3) |
Total | |||||||||||||
| Pooled Funds |
$ | — | $ | 54,106 | $ | — | $ | 54,106 | ||||||||
| Cash |
16 | — | — | 16 | ||||||||||||
|
|
|
|
|
|
|
|
|
|||||||||
| Total |
$ | 16 | $ | 54,106 | $ | — | $ | 54,122 | ||||||||
|
|
|
|
|
|
|
|
|
|||||||||
Equity Securities: Equity securities classified as Level 1 investments primarily include common stock of large, medium and small sized corporations and international equities. These investments are comprised of securities listed on an exchange, market or automated quotation system for which quotations are readily available. The valuation of these securities was determined based on the closing price reported on the active market on which the individual securities were traded.
Mutual Funds and Government Securities: Mutual funds and government securities classified as Level 2 investments primarily include government debt securities and bonds. The valuation of investments classified as Level 2 was determined using a market approach based upon quoted prices for similar assets and liabilities in active markets based on pricing models which incorporate information from market sources and observed market movements.
F-39
Table of Contents
Money Funds: Money funds classified as Level 2 investments seek to maintain the net asset value (“NAV”) per share at $1.00. Money funds are valued under the amortized cost method which approximates current market value. Under this method, the securities are valued at cost when purchased and thereafter, a constant proportionate amortization of any discount or premium is recorded until the maturity of the security.
Pooled Funds: Pooled funds held by the Company’s foreign plans classified as Level 2 investments are reported at their NAV. These pooled funds use the close or last trade price as fair value of the investments to determine the daily transactional NAV for purchases and redemptions by its unit holders as determined by the fund’s trustee based on the underlying securities in the fund.
Estimated future benefit payments are as follows (in thousands):
| Pension Plans | OPEB Plans | |||||||||||||||
| Domestic Plans |
Foreign Plans |
Gross | Medicare Prescription Drug Subsidy |
|||||||||||||
| 2013 |
$ | 3,182 | $ | 3,168 | $ | 565 | $ | (35 | ) | |||||||
| 2014 |
3,283 | 3,254 | 560 | (35 | ) | |||||||||||
| 2015 |
3,446 | 3,696 | 531 | (35 | ) | |||||||||||
| 2016 |
3,568 | 3,876 | 497 | (33 | ) | |||||||||||
| 2017 |
3,698 | 3,773 | 462 | (33 | ) | |||||||||||
| 2018—2022 |
20,927 | 21,069 | 1,902 | (150 | ) | |||||||||||
The Company expects to make $3.0 million, $8.6 million and $0.6 million in contributions to the Domestic Plans, Foreign Plans and OPEB Plans, respectively, in 2013. Although a decline in market conditions, changes in current pension law and uncertainties regarding significant assumptions used in the actuarial valuations may have a material impact on future required contributions to the Company’s pension plans, the Company currently does not expect funding requirements to have a material adverse impact on current or future liquidity.
Actuarial valuations require significant estimates and assumptions made by management, primarily the funding interest rate, discount rate and expected long-term return on plan assets. These assumptions are all susceptible to changes in market conditions. The funding interest rate and discount rate are based on representative bond yield curves maintained and monitored by an independent third party. In determining the expected long-term rate of return on plan assets, the Company considers historical market and portfolio rates of return, asset allocations and expectations of future rates of return.
17. LEASE COMMITMENTS
Commitments for future minimum lease payments under non-cancelable operating leases, principally for manufacturing and distribution facilities and certain equipment, are as follows (in thousands):
| 2013 |
$ | 36,526 | ||
| 2014 |
30,601 | |||
| 2015 |
20,775 | |||
| 2016 |
14,432 | |||
| 2017 |
10,962 | |||
| Thereafter |
18,319 | |||
|
|
|
|||
| Total future minimum lease payments |
$ | 131,615 | ||
|
|
|
F-40
Table of Contents
Lease expense was $40.1 million for the year ended December 29, 2012, $40.8 million for the year ended December 31, 2011, $8.3 million for the successor period October 13, 2010 to January 1, 2011 and $30.5 million for the predecessor period January 3, 2010 to October 12, 2010. The Company’s facility lease agreements typically contain renewal options.
During the second quarter ended July 2, 2011, the Company purchased previously leased equipment via a buy-out option and paid the lessor the present value of the remaining lease payments, the residual value and sales and personal property taxes. As a result, the Company recorded a charge of $0.8 million within selling, general and administrative expenses for the year ended December 31, 2011. The charge represents the excess of cash paid over the estimated fair values of the purchased equipment. The estimated fair values of the purchased equipment have been recorded within property, plant and equipment and are depreciated over their estimated remaining useful lives.
18. COMMITMENTS AND CONTINGENCIES
The Company is involved from time to time in litigation arising in the ordinary course of business, none of which, after giving effect to its existing insurance coverage, is expected to have a material adverse effect on its financial position, results of operations or liquidity. From time to time, the Company is also involved in proceedings and potential proceedings relating to environmental and product liability matters.
Environmental Claims
The Woodbridge, New Jersey facility is currently the subject of an investigation and/or remediation before the New Jersey Department of Environmental Protection (“NJDEP”) under ISRA Case No. E20030110 for the Company’s wholly owned subsidiary Gentek Building Products, Inc. (“Gentek”). The facility is currently leased by Gentek. Previous operations at the facility resulted in soil and groundwater contamination in certain areas of the property. In 1999, the property owner and Gentek signed a remediation agreement with NJDEP, pursuant to which the property owner and Gentek agreed to continue an investigation/remediation that had been commenced pursuant to a Memorandum of Agreement with NJDEP. Under the remediation agreement, NJDEP required posting of a remediation funding source of approximately $100,000 that was provided by Gentek under a self-guarantee as of December 31, 2011. In March 2012, the self-guarantee was replaced by a $228,000 standby letter of credit provided to the NJDEP. Although investigations at this facility are ongoing and it appears probable that a liability will be incurred, the Company cannot currently estimate the amount of liability that may be associated with this facility as the delineation process has not been completed. The Company believes this matter will not have a material adverse effect on its financial position, results of operations or liquidity.
Product Liability Claims
On September 20, 2010, the Company and Gentek were named as defendants in an action filed in the United States District Court for the Northern District of Ohio, captioned Donald Eliason, et al. v. Gentek Building Products, Inc., et al (the “Eliason complaint”). The complaint was filed by a number of individual plaintiffs on behalf of themselves and a putative nationwide class of owners of steel and aluminum siding products manufactured by the Company and Gentek or their predecessors. The plaintiffs assert a breach of express and implied warranty, along with related causes of action, claiming that an unspecified defect in the siding causes paint to peel off the metal and that the Company and Gentek have failed adequately to honor their warranty obligations to repair, replace or refinish the defective siding. Plaintiffs seek unspecified actual and punitive damages, restitution of monies paid to the defendants and an injunction against the claimed unlawful practices, together with attorneys’ fees, costs and interest. Since such time that the Eliason complaint was filed, seven additional putative class actions have been filed.
F-41
Table of Contents
On January 26, 2012, the Company filed a motion to coordinate or consolidate the actions as a multidistrict litigation. Plaintiffs in all cases agreed to a temporary stay while the Judicial Panel on Multidistrict Litigation considered the motion. On April 17, 2012, the Panel issued an order denying the Company’s motion to consolidate on the basis that since all plaintiffs’ have agreed to voluntarily dismiss their actions and re-file their cases in the Northern District of Ohio, there is no need to formally order the consolidation. On May 3, 2012, a complaint was filed in the Northern District of Ohio, consolidating the five actions that previously had been pending in other states (the “Patrick action”). On July 20, 2012, plaintiffs in the three actions already pending in the Northern District of Ohio filed a motion to consolidate those actions with the Patrick action, but specifically requesting that the first-filed action by plaintiff Eliason be permitted to proceed under a separate caption and on its own track. That same day, the Court issued an order requiring the parties to advise if any party objects to consolidation and requiring the parties to submit a joint consolidated pretrial schedule within ten days. Defendants filed a motion consenting to consolidation but requesting that all cases be consolidated under a single caption and proceed on a single track. On September 6, 2012, the Court issued an order granting defendants’ request for consolidation of all cases under a single caption, proceeding on a single track. The Court also ordered plaintiffs to file their single consolidated amended complaint by September 19, 2012, which plaintiffs did.
The Court also conducted a case management conference on September 5, 2012. At that conference, the Court deferred setting most case deadlines to permit the parties to attempt to resolve the case by mediation. A non-binding mediation was held on November 13, 2012. Subsequent to the mediation, on February 13, 2013, the Company entered into a Settlement Agreement and Release of Claims (the “Settlement”) with the named plaintiffs. A preliminary approval hearing was held by the Court on March 4, 2013, and the Settlement was preliminarily approved by the Court on March 5, 2013. The Settlement remains subject to final approval by the Court.
The Settlement provides for the certification of a class for settlement purposes only of commercial and residential property owners who purchased steel siding manufactured and warranted by the Company during the period January 1, 1991 to the date on which notice of the proposed Settlement is first sent to settlement class members and whose siding allegedly experienced “Steel Peel,” which is characterized for the purposes of settlement by the separation of any layer of the finish on the steel siding from the steel siding itself. Subject to the terms and conditions of the Settlement, the Company has agreed that (1) the first time an eligible settlement class member submits a valid Steel Peel warranty claim for siding, the Company will, at its option, repair or replace the siding or, at such class member’s option, make a cash settlement payment to such class member equal to the cost to the Company of the repair or replacement option selected by the Company; (2) the second time such class member submits a valid Steel Peel warranty claim for the same siding, the same options will be available; and (3) the third time such a claim is submitted, such class member may elect to have the Company either refinish or replace the siding or may elect to receive a one-time $8,000 payment. If the $8,000 payment option is chosen, the Company will have no further obligation to such class member in connection with the warranty.
Under the Settlement, the Company has agreed to pay the sum of $2.5 million to compensate class counsel for attorneys’ fees and litigation expenses incurred and to be incurred in connection with the lawsuit. The Company will also pay the costs associated with executing the notice provisions of the Settlement, which are estimated to be approximately $0.6 million. The Company expects to incur additional warranty costs associated with the Settlement; however, the Company does not believe the incremental costs, which currently cannot be estimated for recognition purposes, will be material.
The Settlement does not constitute an admission of liability, culpability, negligence or wrongdoing on the part of the Company, and the Company believes it has valid defenses to the claims asserted. Upon final approval by the court, the Settlement will release all claims that were or could have been asserted against the Company in the lawsuit or that relate to any aspect of the subject matter of the lawsuit.
F-42
Table of Contents
Other environmental claims and product liability claims are administered by the Company in the ordinary course of business, and the Company maintains pollution and remediation and product liability insurance covering certain types of claims. Although it is difficult to estimate the Company’s potential exposure to these matters, the Company believes that the resolution of these matters will not have a material adverse effect on its financial position, results of operations or liquidity.
19. BUSINESS SEGMENTS
The Company is in the business of manufacturing and distributing exterior residential building products. The Company has a single operating segment and a single reportable segment. The Company’s chief operating decision maker is considered to be the Chief Executive Officer. The chief operating decision maker allocates resources and assesses performance of the business and other activities at the single operating segment level. The following table sets forth a summary of net sales by principal product offering (in thousands):
| Year Ended December 29, 2012 |
Year Ended December 31, 2011 |
October 13, 2010 to January 1, 2011 |
January 3, 2010 to October 12, 2010 |
|||||||||||||||
| Successor | Predecessor | |||||||||||||||||
| Vinyl windows |
$ | 357,267 | $ | 362,570 | $ | 118,778 | $ | 316,102 | ||||||||||
| Vinyl siding products |
227,374 | 224,388 | 41,504 | 181,904 | ||||||||||||||
| Metal products |
174,111 | 178,398 | 35,226 | 147,321 | ||||||||||||||
| Third-party manufactured products |
302,966 | 320,852 | 55,511 | 196,587 | ||||||||||||||
| Other products and services |
80,803 | 73,307 | 18,230 | 56,024 | ||||||||||||||
|
|
|
|
|
|
|
|
|
|||||||||||
| $ | 1,142,521 | $ | 1,159,515 | $ | 269,249 | $ | 897,938 | |||||||||||
|
|
|
|
|
|
|
|
|
|||||||||||
The Company operates principally in the United States and Canada. Net sales and long-lived assets by country were determined based on the location of the selling subsidiary as follows (in thousands):
| Year Ended December 29, 2012 |
Year Ended December 31, 2011 |
October 13, 2010 to January 1, 2011 |
January 3, 2010 to October 12, 2010 |
|||||||||||||||
| Successor | Predecessor | |||||||||||||||||
| Net Sales: |
||||||||||||||||||
| United States |
$ | 904,791 | $ | 911,854 | $ | 220,937 | $ | 688,129 | ||||||||||
| Canada |
237,730 | 247,661 | 48,312 | 209,809 | ||||||||||||||
|
|
|
|
|
|
|
|
|
|||||||||||
| $ | 1,142,521 | $ | 1,159,515 | $ | 269,249 | $ | 897,938 | |||||||||||
|
|
|
|
|
|
|
|
|
|||||||||||
| December 29, 2012 |
December 31, 2011 |
|||||||
| Long-lived Assets: |
||||||||
| United States |
$ | 69,183 | $ | 83,417 | ||||
| Canada |
39,269 | 43,176 | ||||||
|
|
|
|
|
|||||
| $ | 108,452 | $ | 126,593 | |||||
|
|
|
|
|
|||||
20. EARNINGS PER SHARE
Basic earnings per share is computed by dividing net income (loss) by the corresponding weighted average number of shares of common stock outstanding for the period. The dilutive effect of restricted stock and the potential exercise of outstanding stock options to purchase shares of common
F-43
Table of Contents
stock is calculated using the treasury stock method, except when the effect would be anti-dilutive. The computation for diluted earnings per share for the years ended December 29, 2012 and December 31, 2011 and the successor period October 13, 2010 to January 1, 2011 excludes approximately 4.5 million, 4.5 million and 5.9 million shares, respectively, due to their anti-dilutive effects. The following table sets forth the computation of the Company’s basic and diluted earnings per share for the periods presented (in thousands, except share and per share amounts):
| Year Ended December 29, 2012 |
Year Ended December 31, 2011 |
October 13, 2010 to January 1, 2011 |
January 3, 2010 to October 12, 2010 |
|||||||||||||||
| Successor | Predecessor | |||||||||||||||||
| Numerator: |
||||||||||||||||||
| Net loss |
$ | (38,355 | ) | $ | (202,791 | ) | $ | (65,020 | ) | $ | (71,274 | ) | ||||||
| Denominator (basic and diluted): |
||||||||||||||||||
| Weighted average shares of common stock outstanding |
55,642,894 | 55,290,857 | 54,860,707 | 1,721,076 | ||||||||||||||
| Earnings per share (basic and diluted): |
||||||||||||||||||
| Loss per share |
$ | (0.69 | ) | $ | (3.67 | ) | $ | (1.19 | ) | $ | (41.41 | ) | ||||||
21. SUBSEQUENT EVENTS
Amendment of ABL Facilities
On April 18, 2013, Associated Materials, Holdings, certain direct or indirect wholly owned U.S. and Canadian restricted subsidiaries of Associated Materials designated as a borrower or guarantor under the Revolving Credit Agreement, certain of the lenders party to the Revolving Credit Agreement, UBS AG, Stamford Branch and UBS AG Canada Branch, as administrative and collateral agents, and Wells Fargo Capital Finance, LLC, as co-collateral agent, amended and restated the Revolving Credit Agreement (as so amended and restated, the “Amended and Restated Revolving Credit Agreement”), which amendment and restatement, among other things:
| Ÿ | reduced the interest rate margins in respect of the loans made under such Amended and Restated Revolving Credit Agreement by 75 basis points; |
| Ÿ | fixed the commitment fee at a rate of 37.5 basis points for the tranche A revolving credit commitments in lieu of a rate of 50 basis points, which stepped down to 37.5 basis points based on utilization of the tranche A revolving credit commitments; |
| Ÿ | extended the maturity of the loans and commitments under such Amended and Restated Credit Agreement to the earlier of (1) April 18, 2018 and (2) 90 days prior to the maturity of the 9.125% notes; |
| Ÿ | permitted the offering of the new notes (as defined below), which required the proceeds of such offering in excess of $40.0 million to be used to prepay the outstanding borrowings under the Company’s tranche B revolving credit commitments and terminate the Company’s existing $12.0 million tranche B revolving credit commitments; |
| Ÿ | increased availability under the Canadian borrowing base by conducting reappraisals of the Company’s Canadian real property and equipment, providing the Company with incremental liquidity based on current appraised values of such real property and equipment; |
| Ÿ | after the prepayment and termination of the tranche B revolving credit commitments upon the issuance and sale of the new notes (as defined below), reduced the trigger to test the springing minimum fixed charge coverage ratio to only when excess borrowing availability is less than the greater of (1) 10% (from 12.5% under the pre-amendment Revolving Credit Agreement) of the sum of (x) the lesser of (A) the U.S. tranche A defined borrowing base and (B) the U.S. tranche |
F-44
Table of Contents
| A revolving credit commitments and (y) the lesser of (A) the Canadian tranche A defined borrowing base and (B) the Canadian tranche A revolving credit commitments and (2) $20.0 million for a period of five consecutive business days until the 30th consecutive day when excess availability exceeds the above threshold; and |
| Ÿ | made certain other amendments to the Revolving Credit Agreement. |
Additional 9.125% Senior Secured Notes
On May 1, 2013, Associated Materials and its wholly owned subsidiary, AMH New Finance, Inc., issued and sold $100.0 million in aggregate principal amount of additional 9.125% notes (the “new notes”) at an issue price of 106.00% of the principal amount of the new notes in a private placement.
The Company used the net proceeds of the offering to repay outstanding borrowings under its ABL facilities, including the prepayment and termination of the Company’s existing tranche B revolving credit commitments, thereby reducing the Company’s total credit commitment by $12.0 million to $213.0 million, and for other general corporate purposes. The new notes were issued as additional notes under the same indenture, dated as of October 13, 2010, governing the $730.0 million aggregate principal amount of 9.125% notes issued on October 13, 2010 (the “existing notes”), as supplemented by a supplemental indenture. The new notes are consolidated with and form a single class with the existing notes and have the same terms as to status, redemption, collateral and otherwise (other than issue date, issue price and first interest payment date) as the existing notes.
The Company has evaluated subsequent events through July 15, 2013, which is the date the consolidated financial statements were available for issuance.
F-45
Table of Contents
ASSOCIATED MATERIALS GROUP, INC.
CONDENSED CONSOLIDATED BALANCE SHEETS
(In thousands)
| September 28, 2013 |
December 29, 2012 |
|||||||
| (unaudited) | ||||||||
| Assets |
||||||||
| Current assets: |
||||||||
| Cash and cash equivalents |
$ | 10,204 | $ | 9,594 | ||||
| Accounts receivable, net |
167,452 | 121,387 | ||||||
| Inventories |
152,031 | 117,965 | ||||||
| Income taxes receivable |
79 | 2,690 | ||||||
| Deferred income taxes |
8,734 | 8,734 | ||||||
| Prepaid expenses and other current assets |
11,716 | 8,771 | ||||||
|
|
|
|
|
|||||
| Total current assets |
350,216 | 269,141 | ||||||
| Property, plant and equipment, at cost |
169,000 | 162,536 | ||||||
| Less accumulated depreciation |
66,110 | 54,084 | ||||||
|
|
|
|
|
|||||
| Property, plant and equipment, net |
102,890 | 108,452 | ||||||
| Goodwill |
477,500 | 482,613 | ||||||
| Other intangible assets, net |
575,154 | 599,644 | ||||||
| Other assets |
24,387 | 22,434 | ||||||
|
|
|
|
|
|||||
| Total assets |
$ | 1,530,147 | $ | 1,482,284 | ||||
|
|
|
|
|
|||||
| Liabilities and Stockholders’ Equity |
||||||||
| Current liabilities: |
||||||||
| Accounts payable |
$ | 123,834 | $ | 74,311 | ||||
| Accrued liabilities |
97,462 | 75,297 | ||||||
| Deferred income taxes |
4,544 | 3,469 | ||||||
| Income taxes payable |
1,371 | 5,697 | ||||||
|
|
|
|
|
|||||
| Total current liabilities |
227,211 | 158,774 | ||||||
| Deferred income taxes |
129,944 | 130,777 | ||||||
| Other liabilities |
145,503 | 153,473 | ||||||
| Long-term debt |
836,523 | 808,205 | ||||||
| Commitments and contingencies |
||||||||
| Stockholders’ equity: |
||||||||
| Common stock |
557 | 557 | ||||||
| Capital in excess of par |
554,770 | 554,647 | ||||||
| Note receivable from officer for purchase of common stock |
— | (736 | ) | |||||
| Accumulated other comprehensive loss |
(26,213 | ) | (17,247 | ) | ||||
| Accumulated deficit |
(338,148 | ) | (306,166 | ) | ||||
|
|
|
|
|
|||||
| Total stockholders’ equity |
190,966 | 231,055 | ||||||
|
|
|
|
|
|||||
| Total liabilities and stockholders’ equity |
$ | 1,530,147 | $ | 1,482,284 | ||||
|
|
|
|
|
|||||
See accompanying notes to Condensed Consolidated Financial Statements.
F-46
Table of Contents
ASSOCIATED MATERIALS GROUP, INC.
CONDENSED CONSOLIDATED STATEMENTS OF OPERATIONS
(In thousands except share and per share amounts)
| Nine Months Ended | ||||||||
| September 28, 2013 |
September 29, 2012 |
|||||||
| Net sales |
$ | 873,464 | $ | 852,379 | ||||
| Cost of sales |
664,569 | 648,975 | ||||||
|
|
|
|
|
|||||
| Gross profit |
208,895 | 203,404 | ||||||
| Selling, general and administrative expenses |
176,753 | 178,463 | ||||||
|
|
|
|
|
|||||
| Income from operations |
32,142 | 24,941 | ||||||
| Interest expense, net |
59,554 | 56,688 | ||||||
| Foreign currency loss |
555 | 220 | ||||||
|
|
|
|
|
|||||
| Loss before income taxes |
(27,967 | ) | (31,967 | ) | ||||
| Income tax expense |
4,015 | 4,991 | ||||||
|
|
|
|
|
|||||
| Net loss |
(31,982 | ) | (36,958 | ) | ||||
|
|
|
|
|
|||||
| Per share data: |
||||||||
| Loss per share (basic and diluted) |
$ | (0.57 | ) | $ | (0.66 | ) | ||
| Weighted average shares outstanding (basic and diluted) |
55,664,994 | 55,638,894 | ||||||
See accompanying notes to Condensed Consolidated Financial Statements.
F-47
Table of Contents
ASSOCIATED MATERIALS GROUP, INC.
CONDENSED CONSOLIDATED STATEMENTS OF COMPREHENSIVE LOSS
(In thousands)
| Nine Months Ended | ||||||||
| September 28, 2013 |
September 29, 2012 |
|||||||
| Net loss |
$ | (31,982 | ) | $ | (36,958 | ) | ||
| Other comprehensive income (loss): |
||||||||
| Pension and other postretirement benefit adjustments, net of tax |
478 | 40 | ||||||
| Foreign currency translation adjustments, net of tax |
(9,444 | ) | 13,103 | |||||
|
|
|
|
|
|||||
| Total comprehensive loss |
$ | (40,948 | ) | $ | (23,815 | ) | ||
|
|
|
|
|
|||||
See accompanying notes to Condensed Consolidated Financial Statements.
F-48
Table of Contents
ASSOCIATED MATERIALS GROUP, INC.
CONDENSED CONSOLIDATED STATEMENTS OF CASH FLOWS
(In thousands)
| Nine Months Ended | ||||||||
| September 28, 2013 |
September 29, 2012 |
|||||||
| (unaudited) | ||||||||
| Operating Activities |
||||||||
| Net loss |
$ | (31,982 | ) | $ | (36,958 | ) | ||
| Adjustments to reconcile net loss to net cash used in operating activities: |
||||||||
| Depreciation and amortization |
32,617 | 39,402 | ||||||
| Deferred income taxes |
1,187 | (732 | ) | |||||
| Provision for losses on accounts receivable |
622 | 1,505 | ||||||
| Amortization of deferred financing costs and premium on senior notes |
3,505 | 3,350 | ||||||
| Loss (gain) on sale or disposal of assets |
93 | (15 | ) | |||||
| Other non-cash charges |
129 | 82 | ||||||
| Changes in operating assets and liabilities: |
||||||||
| Accounts receivable |
(47,578 | ) | (38,132 | ) | ||||
| Inventories |
(35,070 | ) | (35,341 | ) | ||||
| Accounts payable and accrued liabilities |
73,006 | 61,623 | ||||||
| Income taxes receivable / payable |
(1,846 | ) | (5,403 | ) | ||||
| Other assets and liabilities |
(9,092 | ) | (3,485 | ) | ||||
|
|
|
|
|
|||||
| Net cash used in operating activities |
(14,409 | ) | (14,104 | ) | ||||
| Investing Activities |
||||||||
| Capital expenditures |
(8,899 | ) | (3,720 | ) | ||||
| Supply center acquisition |
(348 | ) | — | |||||
| Proceeds from the sale of assets |
49 | 88 | ||||||
|
|
|
|
|
|||||
| Net cash used in investing activities |
(9,198 | ) | (3,632 | ) | ||||
| Financing Activities |
||||||||
| Borrowings under ABL facilities |
123,944 | 147,574 | ||||||
| Payments under ABL facilities |
(200,944 | ) | (131,353 | ) | ||||
| Proceeds from issuance of common stock |
742 | 80 | ||||||
| Issuance of senior notes |
106,000 | — | ||||||
| Financing costs |
(5,445 | ) | (225 | ) | ||||
|
|
|
|
|
|||||
| Net cash provided by financing activities |
|
24,297
|
|
|
16,076
|
| ||
| Effect of exchange rate changes on cash and cash equivalents |
|
(80 |
) |
|
(55 |
) | ||
|
|
|
|
|
|||||
| Net increase (decrease) in cash and cash equivalents |
|
610
|
|
|
(1,715 |
) | ||
| Cash and cash equivalents at beginning of period |
|
9,594 |
|
|
11,374 |
| ||
|
|
|
|
|
|||||
| Cash and cash equivalents at end of period |
$ | 10,204 | $ | 9,659 | ||||
|
|
|
|
|
|||||
| Supplemental information: |
||||||||
| Cash paid for interest |
$ | 35,700 | $ | 36,474 | ||||
|
|
|
|
|
|||||
| Cash paid for income taxes |
$ | 4,438 | $ | 11,149 | ||||
|
|
|
|
|
|||||
See accompanying notes to Condensed Consolidated Financial Statements.
F-49
Table of Contents
ASSOCIATED MATERIALS GROUP, INC.
NOTES TO CONDENSED CONSOLIDATED FINANCIAL STATEMENTS
FOR THE NINE MONTHS ENDED SEPTEMBER 28, 2013
(UNAUDITED)
1. BASIS OF PRESENTATION
Associated Materials Group, Inc., formerly known as AMH Investment Holdings Corp. (“Parent”) was incorporated in Delaware on September 3, 2010. On October 13, 2010, through a series of mergers, Associated Materials, LLC (“Associated Materials”) became a 100% owned indirect subsidiary of Parent, which has no material assets or operations other than its 100% ownership of Associated Materials Incorporated, formerly known as AMH Intermediate Holdings Corp. (“Holdings”), which in turn has no material assets or operations other than its 100% ownership of Associated Materials. Parent and, where appropriate, its subsidiaries are collectively referred to as the “Company.” The Company is controlled by investment funds affiliated with Hellman & Friedman LLC (“H&F”). In July 2013, Parent changed its name to “Associated Materials Group, Inc.” Parent is controlled by investment funds affiliated with H&F.
The Condensed Consolidated Financial Statements of the Company have been prepared in accordance with generally accepted accounting principles in the United States of America for interim financial reporting. Accordingly, they do not include all of the information and footnotes required by generally accepted accounting principles in the United States of America for complete financial statements. In the opinion of management, these interim condensed consolidated financial statements contain all of the normal recurring accruals and adjustments considered necessary for a fair presentation of the unaudited results for the nine months ended September 28, 2013 and September 29, 2012. These financial statements should be read in conjunction with the Company’s annual audited financial statements and notes thereto for the year ended December 29, 2012. A detailed description of the Company’s significant accounting policies and management judgments is located in the annual audited financial statements for the year ended December 29, 2012. The Company’s contract with Window World, Inc. expired in December 2012 and was renewed in July 2013.
Associated Materials was founded in 1947 when it first introduced residential aluminum siding under the Alside® name and is a leading, vertically integrated manufacturer and distributor of exterior residential building products in the United States (“U.S.”) and Canada. The Company produces a comprehensive offering of exterior building products, including vinyl windows, vinyl siding, vinyl railing and fencing, aluminum trim coil, aluminum and steel siding and related accessories, which are produced at the Company’s 11 manufacturing facilities. The Company also sells complementary products that are manufactured by third parties, such as roofing materials, cladding materials, insulation, exterior doors, equipment and tools, and provides installation services. Because most of the Company’s building products are intended for exterior use, sales tend to be lower during periods of inclement weather. Weather conditions in the first quarter of each calendar year usually result in that quarter producing significantly less net sales and net cash flows from operations than in any other period of the year. Consequently, the Company has historically had losses or small profits in the first quarter and reduced profits from operations in the fourth quarter of each calendar year. Therefore, the results of operations for any interim period are not necessarily indicative of the results of operations for a full year.
The Company has evaluated subsequent events through November 15, 2013, which is the date the Condensed Consolidated Financial Statements were available for issuance.
Recent Accounting Pronouncements
In July 2013, the Financial Accounting Standards Board (“FASB”) issued Accounting Standards Update (“ASU”) No. 2013-11, Presentation of an Unrecognized Tax Benefit When a Net Operating Loss Carryforward, a Similar Tax Loss, or a Tax Credit Carryforward Exists (“ASU 2013-11”). ASU 2013-11 eliminates diversity in practice in the presentation of unrecognized tax benefits. ASU 2013-11 requires an
F-50
Table of Contents
unrecognized tax benefit, or a portion of an unrecognized tax benefit to be presented as a reduction to the related deferred tax asset for a net operating loss carryforward, a similar tax loss or a tax credit carryforward, unless a net operating loss carryforward, a similar tax loss or a tax credit carryforward is not available at the reporting date under the governing tax law to settle taxes that would result from the disallowance of the tax position, or the entity does not intend to use the deferred tax asset for such purpose. ASU 2013-11 is effective for fiscal years and interim periods within those years, beginning after December 15, 2013. The Company does not believe that the adoption of the provisions of ASU 2013-11 will have a material impact on its consolidated financial position, results of operations or cash flows.
In February 2013, the FASB issued ASU No. 2013-02, Comprehensive Income (Topic 220): Reporting of Amounts Reclassified Out of Accumulated Other Comprehensive Income (“ASU 2013-02”). ASU 2013-02 requires the disclosure of additional information about reclassification adjustments, including (1) changes in accumulated other comprehensive income balances by component and (2) significant items reclassified out of accumulated other comprehensive income. Required disclosures include disaggregation of the total change of each component of other comprehensive income and the separate presentation of reclassification adjustments and current-period other comprehensive income. In addition, ASU 2013-02 requires the presentation of information about significant items reclassified out of accumulated other comprehensive income by component either on the face of the statement where net income is presented or as a separate disclosure in the notes to the financial statements. The new disclosure requirements are effective, prospectively, for fiscal years, and interim periods within those years, beginning after December 15, 2012. ASU 2013-02 concerns presentation and disclosure only. Adoption of the provisions of ASU 2013-02 at the beginning of 2013 did not have an impact on the Company’s consolidated financial position, results of operations or cash flows.
In July 2012, the FASB issued ASU No. 2012-02, Intangibles—Goodwill and Other (Topic 350): Testing Indefinite-Lived Intangible Assets for Impairment (“ASU 2012-02”). ASU 2012-02 permits an entity first to assess qualitative factors to determine whether it is more likely than not that an indefinite-lived intangible asset is impaired. If an entity determines that it is not more likely than not that the asset is impaired, the entity will have the option not to calculate annually the fair value of an indefinite-lived intangible asset. The more-likely-than-not threshold is defined as having a likelihood of more than 50 percent. ASU 2012-02 is effective for annual and interim impairment tests performed for fiscal years beginning after September 15, 2012, with early adoption permitted. Adoption of the provisions of ASU 2012-02 at the beginning of 2013 did not have an impact on the Company’s consolidated financial position, results of operations or cash flows.
2. ALLOWANCE FOR DOUBTFUL ACCOUNTS
The Company maintains an allowance for doubtful accounts for estimated losses resulting from the inability of its customers to make required payments. The allowance for doubtful accounts is based on review of the overall condition of accounts receivable balances and review of significant past due accounts. If the financial condition of the Company’s customers were to deteriorate, resulting in an impairment of their ability to make payments, additional allowances may be required. Account balances are charged off against the allowance for doubtful accounts after all means of collection have been exhausted and the potential for recovery is considered remote. Accounts receivable that are not expected to be collected within one year, net of the related allowance for doubtful accounts, are included in other assets in the Condensed Consolidated Balance Sheets.
F-51
Table of Contents
Allowance for doubtful accounts on accounts receivable consists of the following (in thousands):
| September 28, 2013 |
December 29, 2012 |
|||||||
| Allowance for doubtful accounts, current |
$ | 3,408 | $ | 3,737 | ||||
| Allowance for doubtful accounts, non-current |
5,150 | 5,434 | ||||||
|
|
|
|
|
|||||
| $ | 8,558 | $ | 9,171 | |||||
|
|
|
|
|
|||||
3. INVENTORIES
Inventories are valued at the lower of cost (first in, first out) or market. Inventories consist of the following (in thousands):
| September 28, 2013 |
December 29, 2012 |
|||||||
| Raw materials |
$ | 30,903 | $ | 26,749 | ||||
| Work-in-progress |
11,008 | 11,589 | ||||||
| Finished goods |
110,120 | 79,627 | ||||||
|
|
|
|
|
|||||
| $ | 152,031 | $ | 117,965 | |||||
|
|
|
|
|
|||||
4. GOODWILL AND OTHER INTANGIBLE ASSETS
The Company reviews goodwill for impairment on an annual basis at the beginning of the fourth quarter, or more frequently if events or circumstances change that would impact the value of these assets. The Company did not recognize any impairment losses of its goodwill during the nine months ended September 28, 2013 and September 29, 2012.
The changes in the carrying amount of goodwill are as follows (in thousands):
| Goodwill | ||||
| Balance at December 29, 2012 |
$ | 482,613 | ||
| Foreign currency translation |
(5,113 | ) | ||
|
|
|
|||
| Balance at September 28, 2013 |
$ | 477,500 | ||
|
|
|
|||
The Company’s other intangible assets consist of the following (in thousands):
| September 28, 2013 | December 29, 2012 | |||||||||||||||||||||||
| Cost | Accumulated Amortization |
Net Carrying Value |
Cost | Accumulated Amortization |
Net Carrying Value |
|||||||||||||||||||
| Amortized customer bases |
$ | 329,597 | $ | 77,031 | $ | 252,566 | $ | 331,582 | $ | 57,897 | $ | 273,685 | ||||||||||||
| Amortized non-compete agreements |
20 | 10 | 10 | 10 | 5 | 5 | ||||||||||||||||||
|
|
|
|
|
|
|
|
|
|
|
|
|
|||||||||||||
| Total amortized intangible assets |
329,617 | 77,041 | 252,576 | 331,592 | 57,902 | 273,690 | ||||||||||||||||||
| Non-amortized trade names |
322,578 | — | 322,578 | 325,954 | — | 325,954 | ||||||||||||||||||
|
|
|
|
|
|
|
|
|
|
|
|
|
|||||||||||||
| Total intangible assets |
$ | 652,195 | $ | 77,041 | $ | 575,154 | $ | 657,546 | $ | 57,902 | $ | 599,644 | ||||||||||||
|
|
|
|
|
|
|
|
|
|
|
|
|
|||||||||||||
The Company’s non-amortized intangible assets consist of the Alside®, Revere®, Gentek®, Preservation® and Alpine® trade names and are tested for impairment at least annually at the beginning of the fourth quarter and on a more frequent basis if there are indications of potential impairment. The Company did not recognize any impairment losses of its other intangible assets during the nine months ended September 28, 2013 and September 29, 2012.
F-52
Table of Contents
Finite lived intangible assets are amortized on a straight-line basis over their estimated useful lives. The estimated average amortization period for amortized customer bases and amortized non-compete agreements is 13 years and 3 years, respectively. Amortization expense related to other intangible assets was $19.6 million and $19.7 million for the nine months ended September 28, 2013 and September 29, 2012, respectively.
5. MANUFACTURING RESTRUCTURING COSTS
The Company recorded a manufacturing restructuring liability related to the discontinued use of the warehouse facility adjacent to the Ennis manufacturing plant. The accretion of related lease obligations was reported within selling, general and administrative expenses in the Condensed Consolidated Statements of Operations. Changes in the manufacturing restructuring liability are as follows (in thousands):
| Nine Months Ended | ||||||||
| September 28, 2013 |
September 29, 2012 |
|||||||
| Balance at the beginning of the period |
$ | 3,387 | $ | 4,086 | ||||
| Accretion of related lease obligations |
394 | 399 | ||||||
| Payments |
(924 | ) | (992 | ) | ||||
|
|
|
|
|
|||||
| Balance at the end of the period |
$ | 2,857 | $ | 3,493 | ||||
|
|
|
|
|
|||||
The remaining restructuring liability was included in accrued liabilities and other liabilities in the Condensed Consolidated Balance Sheets and will continue to be paid over the lease term, which ends April 2020.
6. PRODUCT WARRANTY COSTS
Consistent with industry practice, the Company provides to homeowners limited warranties on certain products, primarily related to window and siding product categories. Changes in the warranty reserve are as follows (in thousands):
| Nine Months Ended | ||||||||
| September 28, 2013 |
September 29, 2012 |
|||||||
| Balance at the beginning of the period |
$ | 97,471 | $ | 101,163 | ||||
| Provision for warranties issued and changes in estimates for pre-existing warranties |
5,155 | 8,269 | ||||||
| Claims paid |
(5,725 | ) | (6,225 | ) | ||||
| Foreign currency translation |
(437 | ) | 552 | |||||
|
|
|
|
|
|||||
| Balance at the end of the period |
$ | 96,464 | $ | 103,759 | ||||
|
|
|
|
|
|||||
7. EXECUTIVE OFFICERS’ SEPARATION AND HIRING COSTS
On February 20, 2012, David S. Nagle was appointed President, AMI Distribution. On February 24, 2012, Stephen E. Graham resigned from his position as Senior Vice President—Chief Financial Officer and Secretary of the Company. On February 27, 2012, the Company entered into an employment agreement with Paul Morrisroe, pursuant to which he agreed to serve as the Company’s Senior Vice President and Chief Financial Officer. The Company’s Senior Vice President of Human Resources, John F. Haumesser, resigned from his position effective April 19, 2012 and was succeeded by James T. Kenyon, who was named Senior Vice President and Chief Human Resources Officer on June 4, 2012.
F-53
Table of Contents
The Company recorded $1.2 million for separation and hiring costs, including payroll taxes, certain benefits and related professional fees, for the nine months ended September 28, 2013. Separation and hiring costs were $2.9 million for the nine months ended September 29, 2012. These separation and hiring costs have been recorded as a component of selling, general and administrative expenses. As of September 28, 2013, remaining separation costs payable to the Company’s former executives of $1.3 million are accrued, which will be paid at various dates through 2014.
On June 17, 2013, a third-party relocation company, acting as the Company’s agent, entered into separate agreements with Jerry W. Burris, the Company’s Chief Executive Officer and President, (the “Burris Relocation Agreement”), and Paul Morrisroe, the Company’s Chief Financial Officer, (the “Morrisroe Relocation Agreement”, and together with the Burris Relocation Agreement, the “Relocation Agreements”), pursuant to which such relocation company purchased Mr. Burris’ former primary residence for $1.2 million and Mr. Morrisroe’s former primary residence for $0.5 million. The Relocation Agreements were entered into in furtherance of the relocation arrangements in Mr. Burris’ and Mr. Morrisroe’s respective employment agreements, which were entered into to permit Mr. Burris and Mr. Morrisroe to reside, on a full-time basis, near the Company’s corporate headquarters. The purchase prices of $1.2 million and $0.5 million, respectively, for Mr. Burris’ and Mr. Morrisroe’s former residences were determined based on independent third-party appraisals of the market value of the residences. Pursuant to their respective employment agreements and the Relocation Agreements, the Company paid Mr. Burris and Mr. Morrisroe, make-whole payments of $0.8 million and $0.1 million, respectively, to compensate each executive for the loss recognized on the sale his respective residence, which is included in the separation and hiring costs disclosed above. The assets acquired are recorded in prepaid expenses and other current assets in the Condensed Consolidated Balance Sheets. Pursuant to these transactions, the Company also assumed mortgage balances for Mr. Burris and Mr. Morrisroe of $1.2 million and $0.4 million, respectively, which were included in accrued liabilities in the Condensed Consolidated Balance Sheets. The Company sold Mr. Morrisroe’s former residence in August 2013.
8. LONG-TERM DEBT
Long-term debt consists of the following (in thousands):
| September 28, 2013 |
December 29, 2012 |
|||||||
| 9.125% notes |
$ | 835,523 | $ | 730,000 | ||||
| Borrowings under the ABL facilities |
1,000 | 78,205 | ||||||
|
|
|
|
|
|||||
| Total long-term debt |
$ | 836,523 | $ | 808,205 | ||||
|
|
|
|
|
|||||
9.125% Senior Secured Notes due 2017
In October 2010, Associated Materials and AMH New Finance, Inc. (collectively, the “Issuers”) issued and sold $730.0 million of 9.125% Senior Secured Notes due 2017 (“9.125% notes”). The 9.125% notes bear interest at a rate of 9.125% per annum and are unconditionally guaranteed, jointly and severally, by each of the Issuers’ direct and indirect domestic subsidiaries that guarantees the Company’s obligations under the senior secured asset-based revolving credit facilities (the “ABL facilities”). Interest payments are remitted on a semi-annual basis on May 1 and November 1 of each year.
On May 1, 2013, the Issuers, issued and sold an additional $100.0 million in aggregate principal amount of 9.125% notes (the “new notes”) at an issue price of 106.00% of the principal amount of the new notes in a private placement. The new notes were issued as additional notes under the same indenture, dated as of October 13, 2010, governing the $730.0 million aggregate principal amount of 9.125% notes issued in October 2010 (the “existing notes”), as supplemented by a supplemental
F-54
Table of Contents
indenture. The new notes are consolidated with and form a single class with the existing notes and have the same terms as to status, redemption, collateral and otherwise (other than issue date, issue price and first interest payment date) as the existing notes. The debt premium related to the issuance of the new notes is being amortized into interest expense over the life of the new notes. The unamortized premium of $5.5 million is included in the long-term debt balance for the 9.125% notes. The effective interest rate of the new notes, including the premium, is 7.5% as of September 28, 2013.
Pursuant to the terms of a registration rights agreement, the Issuers and the guarantors have agreed to use their commercially reasonable efforts to register notes having substantially identical terms as the new notes with the Securities and Exchange Commission as part of an offer to exchange freely tradable exchange notes for the new notes. On September 30, 2013, the Issuers offered to exchange up to $100.0 million aggregate principal amount of 9.125% Senior Secured Notes due 2017 and the related guarantees (the “exchange notes”), which have been registered under the Securities Act for any and all of the new notes. All of the new notes were exchanged for exchange notes on October 31, 2013.
These notes have an estimated fair value, classified as Level 1, of $887.1 million (at carrying value of $830.0 million) and $742.8 million (at carrying value of $730.0 million) based on quoted market prices as of September 28, 2013 and December 29, 2012, respectively.
ABL Facilities
On April 18, 2013, Associated Materials, Holdings, certain direct or indirect wholly owned U.S. and Canadian restricted subsidiaries of the Company designated as a borrower or guarantor under the revolving credit agreement governing the ABL facilities, certain of the lenders party to the revolving credit agreement governing the ABL facilities, UBS AG, Stamford Branch and UBS AG Canada Branch, as administrative and collateral agents, and Wells Fargo Capital Finance, LLC, as co-collateral agent, amended and restated the revolving credit agreement (the “Amended and Restated Revolving Credit Agreement”) governing the ABL facilities in the amount of $225.0 million (comprised of a $150.0 million U.S. facility and a $75.0 million Canadian facility) pursuant to a revolving credit agreement maturing on the date that is the earlier of (i) April 18, 2018 and (ii) 90 days prior to the maturity date of the existing notes. The $150.0 million U.S. facility consisted of $141.5 million of U.S. tranche A revolving credit commitments and $8.5 million of U.S. tranche B revolving credit commitments. The $75.0 million Canadian facility consisted of $71.5 million of Canadian tranche A revolving credit commitment and $3.5 million of Canadian tranche B revolving credit commitments. During the nine months ended September 28, 2013, the Company terminated the tranche B revolving credit commitments of $12.0 million in accordance with the Amended and Restated Revolving Credit Agreement and wrote off $0.5 million of deferred financing fees related to the ABL facilities.
Interest Rate and Fees
At the Company’s option, the U.S. and Canadian tranche A revolving credit loans under the Amended and Restated Revolving Credit Agreement governing the ABL facilities bear interest at the rate equal to (1) the London Interbank Offered Rate (“LIBOR”) (for eurodollar loans under the U.S. facility) or the Canadian Dealer Offered Rate (“CDOR”) (for loans under the Canadian facility), plus an applicable margin of 2.00%, or (2) the alternate base rate (for alternate base rate loans under the U.S. facility, which is the highest of a prime rate, the Federal Funds Effective Rate plus 0.50% and a one-month LIBOR rate plus 1.0% per annum) or the alternate Canadian base rate (for loans under the Canadian facility, which is the higher of a Canadian prime rate and the 30-day CDOR plus 1.0%), plus an applicable margin of 1.00%, in each case, which interest rate margin may vary in 25 basis point increments between three pricing levels determined by reference to the average excess availability in respect of the U.S. and
F-55
Table of Contents
Canadian tranche A revolving credit loans. In addition to paying interest on outstanding principal under the ABL facilities, the Company is required to pay a commitment fee in respect of the U.S. and Canadian tranche A revolving credit loans, payable quarterly in arrears, of 0.375%.
Borrowing Base
Availability under the U.S. and Canadian facilities are subject to a borrowing base, which is based on eligible accounts receivable and inventory of certain of the Company’s U.S. subsidiaries and eligible accounts receivable, inventory and, with respect to the Canadian tranche A revolving credit loans, equipment and real property, of certain of the Company’s Canadian subsidiaries, after adjusting for customary reserves established or modified from time to time by and at the permitted discretion of the administrative agent thereunder. To the extent that eligible accounts receivable, inventory, equipment and real property decline, the borrowing base will decrease and the availability under the ABL facilities may decrease below $213.0 million. In addition, if the amount of outstanding borrowings and letters of credit under the U.S. and Canadian facilities exceeds the borrowing base or the aggregate revolving credit commitments, the Company is required to prepay borrowings to eliminate the excess.
Guarantors
All obligations under the U.S. facility are guaranteed by each existing and subsequently acquired direct and indirect wholly owned material U.S. restricted subsidiary of the Company and the direct parent of the Company, other than certain excluded subsidiaries (“U.S. guarantors”). All obligations under the Canadian facility are guaranteed by each existing and subsequently acquired direct and indirect wholly owned material Canadian restricted subsidiary of the Company, other than certain excluded subsidiaries (“Canadian guarantors,” and together with U.S. guarantors, “ABL guarantors”) and the U.S. guarantors.
Security
The U.S. security agreement provides that all obligations of the U.S. borrowers and the U.S. guarantors are secured by a first-priority perfected security interest in substantially all of the present and future property and assets of the Company, including a first-priority security interest in the capital stock of the Company and a second-priority security interest in the capital stock of each direct, material wholly owned restricted subsidiary of the Company. The Canadian security agreement provides that all obligations of the Canadian borrowers and the Canadian guarantors are secured by the U.S. ABL collateral and a first-priority perfected security interest in substantially all of the Company’s Canadian assets, including a first-priority security interest in the capital stock of the Canadian borrowers and each direct, material wholly owned restricted subsidiary of the Canadian borrowers and Canadian guarantors.
Covenants, Representations and Warranties
The Amended and Restated Revolving Credit Agreement contains customary representations and warranties and customary affirmative and negative covenants, including, with respect to negative covenants, among other things, restrictions on indebtedness, liens, investments, fundamental changes, asset sales, dividends and other distributions, prepayments or redemption of junior debt, transactions with affiliates and negative pledge clauses. There are no financial covenants included in the Amended and Restated Revolving Credit Agreement, other than a springing fixed charge coverage ratio of at least 1.00 to 1.00, which will be tested only when excess availability is less than the greater of (i) 10.0% of the sum of (x) the lesser of (A) the U.S. tranche A borrowing base and (B) the U.S. tranche A revolving credit commitments and (y) the lesser of (A) the Canadian tranche A borrowing base and (B) the Canadian tranche A revolving credit commitments and (ii) $20.0 million for a period of five consecutive business days until the 30th consecutive day when excess availability exceeds the above threshold.
F-56
Table of Contents
As of September 28, 2013, there was $1.0 million drawn under the Company’s ABL facilities and $182.0 million available for additional borrowings. The weighted average per annum interest rate applicable to borrowings under the U.S. portion of the ABL facilities was 4.3% as of September 28, 2013. The Company had letters of credit outstanding of $11.0 million as of September 28, 2013 primarily securing insurance policy deductibles, certain lease facilities and the Company’s purchasing card program.
9. STOCKHOLDERS’ EQUITY
Parent has two classes of capital stock, preferred stock and common stock. As of September 28, 2013, there are 5 million shares of preferred stock, par value $0.01 per share, authorized. There were no preferred shares issued and outstanding as of September 28, 2013 or December 29, 2012. As of September 28, 2013, there are 200 million shares of common stock, par value $0.01 per share, authorized. Parent has 55,777,894 and 55,686,894 shares of common stock issued and outstanding as of September 28, 2013 and December 29, 2012, respectively.
In September 2011, Jerry W. Burris, President and Chief Executive Officer of the Company, purchased 220,000 shares of common stock at a fair market value of $5 per share. As consideration for a portion of the purchase price, the Company accepted a $0.8 million promissory note from Mr. Burris. The note accrued interest at 1.63% per annum and had a maturity date of March 31, 2014. A principal payment of $0.1 million was made on March 31, 2012. The outstanding principal amount of and accrued interest on the promissory note were repaid in full by Mr. Burris on June 27, 2013.
10. INCOME TAXES
The Company’s provision for income taxes in interim periods is computed by applying the appropriate estimated annual effective tax rates to income or loss before income taxes for the period. The Company adjusts its effective tax rate each quarter to be consistent with the estimated annual effective tax rate and records the tax impact of certain unusual or infrequently occurring items, including changes in judgment about valuation allowances and effects of changes in tax laws or rates, in the interim period in which they occur. The components of the effective tax rate are as follows (in thousands, except percentage):
| Nine Months Ended | ||||||||
| September 28, 2013 |
September 29, 2012 |
|||||||
| Income (loss) before income taxes |
$ | (27,967 | ) | $ | (31,967 | ) | ||
| Income tax expense |
4,015 | 4,991 | ||||||
| Effective tax rate |
(14.4 | )% | (15.6 | )% | ||||
The effective tax rates for the nine months ended September 28, 2013 and September 29, 2012 are lower than the statutory rate, primarily as a result of operating losses in the U.S. with no tax benefit recognized due to the valuation allowance on U.S. deferred tax assets, partially offset by income tax expense on foreign income.
F-57
Table of Contents
11. ACCUMULATED OTHER COMPREHENSIVE LOSS
Changes in accumulated other comprehensive loss by component, net of tax, for the nine months ended September 28, 2013 are as follows (in thousands):
| Defined Benefit Pension and Other Postretirement Plans |
Foreign Currency Translation |
Accumulated Other Comprehensive Loss |
||||||||||
| Balance at the beginning of the period |
$ | (23,287 | ) | $ | 6,040 | $ | (17,247 | ) | ||||
| Other comprehensive loss before reclassifications |
— | (9,444 | ) | (9,444 | ) | |||||||
| Reclassifications out of accumulated other comprehensive loss |
478 | — | 478 | |||||||||
|
|
|
|
|
|
|
|||||||
| Balance at the end of the period |
$ | (22,809 | ) | $ | (3,404 | ) | $ | (26,213 | ) | |||
|
|
|
|
|
|
|
|||||||
Reclassifications out of accumulated other comprehensive loss for the nine months ended September 28, 2013 consist of the following (in thousands):
| Nine Months Ended September 28, 2013 |
||||
| Defined Benefit Pension and other Post Retirement Plans: |
||||
| Amortization of unrecognized prior service costs |
$ 15 | |||
| Amortization of unrecognized cumulative actuarial net loss |
568 | |||
|
|
|
|||
| Total before tax |
583 | |||
| Tax benefit |
(105) | |||
|
|
|
|||
| Net of tax |
$ 478 | |||
|
|
|
|||
Amortization of prior service costs and actuarial losses are included in the computation of net periodic benefit cost for the Company’s pension and other postretirement benefit plans.
12. RETIREMENT PLANS
The Company sponsors defined benefit pension plans which cover hourly workers at its West Salem, Ohio plant, and hourly union employees at its Woodbridge, New Jersey plant as well as a defined benefit retirement plan covering U.S. salaried employees, which was frozen in 1998 and subsequently replaced with a defined contribution plan (the “Domestic Plans”). The Company also sponsors a defined benefit pension plan covering the Canadian salaried employees and hourly union employees at the Lambeth, Ontario plant, a defined benefit pension plan for the hourly union employees at its Burlington, Ontario plant and a defined benefit pension plan for the hourly union employees at its Pointe Claire, Quebec plant (the “Foreign Plans”).
The Company also provides postretirement benefits other than pension (“OPEB plans”) including health care or life insurance benefits to certain U.S. and Canadian retirees and in some cases, their spouses and dependents. The Company’s postretirement benefit plans in the U.S. include an unfunded health care plan for hourly workers at the Company’s former steel siding plant in Cuyahoga Falls, Ohio. With the closure of this facility in 1991, no additional employees are eligible to participate in this plan. There are three other U.S. unfunded plans covering either life insurance or health care benefits for small frozen groups of retirees. The Company’s foreign postretirement benefit plan provides life insurance benefits to active members at its Pointe Claire, Quebec plant and a closed group of Canadian salaried retirees. The actuarial valuation measurement date for the defined benefit pension plans and postretirement benefits other than pension is December 31.
F-58
Table of Contents
Components of net periodic benefit cost for the Company’s defined benefit pension plans and OPEB plans are as follows (in thousands):
| Nine Months Ended | ||||||||||||||||||||||||
| September 28, 2013 | September 29, 2012 | |||||||||||||||||||||||
| Domestic Plans |
Foreign Plans |
OPEB Plans | Domestic Plans |
Foreign Plans |
OPEB Plans | |||||||||||||||||||
| Net periodic benefit cost: |
||||||||||||||||||||||||
| Service cost |
$ | 774 | $ | 2,119 | $ | 9 | $ | 564 | $ | 1,814 | $ | 9 | ||||||||||||
| Interest cost |
2,177 | 2,844 | 138 | 2,292 | 2,940 | 175 | ||||||||||||||||||
| Expected return on assets |
(2,661 | ) | (2,946 | ) | — | (2,418 | ) | (2,791 | ) | — | ||||||||||||||
| Amortization of unrecognized: |
||||||||||||||||||||||||
| Prior service costs |
— | 15 | — | — | 16 | — | ||||||||||||||||||
| Cumulative actuarial net loss |
180 | 394 | (6 | ) | 3 | 34 | — | |||||||||||||||||
|
|
|
|
|
|
|
|
|
|
|
|
|
|||||||||||||
| Net periodic benefit cost |
$ | 470 | $ | 2,426 | $ | 141 | $ | 441 | $ | 2,013 | $ | 184 | ||||||||||||
|
|
|
|
|
|
|
|
|
|
|
|
|
|||||||||||||
Although changes in market conditions, current pension law and uncertainties regarding significant assumptions used in the actuarial valuations may have a material impact on future required contributions to the Company’s pension plans, the Company currently does not expect funding requirements to have a material adverse impact on current or future liquidity.
The actuarial valuations require significant estimates and assumptions to be made by management, primarily the funding interest rate, discount rate and expected long-term return on plan assets. These assumptions are all susceptible to changes in market conditions. The funding interest rate and discount rate are based on representative bond yield curves maintained and monitored by independent third parties. In determining the expected long-term rate of return on plan assets, the Company considers historical market and portfolio rates of return, asset allocations and expectations of future rates of return.
13. Commitments and Contingencies
The Company is involved from time to time in litigation arising in the ordinary course of business, none of which, after giving effect to existing insurance coverage, is expected to have a material adverse effect on the Company’s financial position, results of operations or liquidity. From time to time, the Company is also involved in proceedings and potential proceedings relating to environmental and product liability matters.
Environmental Claims
The Woodbridge, New Jersey facility is currently the subject of an investigation and/or remediation before the New Jersey Department of Environmental Protection (“NJDEP”) under ISRA Case No. E20030110 for the Company’s indirect wholly owned subsidiary, Gentek Building Products, Inc. (“Gentek”). The facility is currently leased by Gentek. Previous operations at the facility resulted in soil and groundwater contamination in certain areas of the property. In 1999, the property owner and Gentek signed a remediation agreement with NJDEP, pursuant to which the property owner and Gentek agreed to continue an investigation/remediation that had been commenced pursuant to a Memorandum of Agreement with NJDEP. Under the remediation agreement, NJDEP required posting of a remediation funding source of approximately $100,000 that was provided by Gentek under a self-guarantee as of December 31, 2011. In March 2012, the self-guarantee was replaced by a $228,000 standby letter of credit provided to the NJDEP. In May 2013, the amount of the standby letter of credit was increased to $339,500. Although investigations at this facility are ongoing and it appears probable that a liability will be incurred, the Company cannot currently estimate the amount of liability that may be associated with this facility as the delineation process has not been completed. The Company believes this matter will not have a material adverse effect on the Company’s financial position, results of operations or liquidity.
F-59
Table of Contents
Product Liability Claims
On September 20, 2010, the Company and its subsidiary, Gentek Buildings Products, Inc. (“Gentek”), were named as defendants in an action filed in the United States District Court for the Northern District of Ohio, captioned Donald Eliason, et al. v. Gentek Building Products, Inc., et al (the “Eliason complaint”). The complaint was filed by a number of individual plaintiffs on behalf of themselves and a putative nationwide class of owners of steel and aluminum siding products manufactured by the Company and Gentek or their predecessors. The plaintiffs assert a breach of express and implied warranty, along with related causes of action, claiming that an unspecified defect in the siding causes paint to peel off the metal and that the Company and Gentek have failed adequately to honor their warranty obligations to repair, replace or refinish the defective siding. Plaintiffs seek unspecified actual and punitive damages, restitution of monies paid to the defendants and an injunction against the claimed unlawful practices, together with attorneys’ fees, costs and interest. Since such time that the Eliason complaint was filed, seven additional putative class actions have been filed.
On September 6, 2012, the Court issued an order granting defendants’ request for consolidation of all cases under a single caption, proceeding on a single track. The Court also ordered plaintiffs to file their single consolidated amended complaint by September 19, 2012, which plaintiffs did.
On February 13, 2013, the Company entered into a Settlement Agreement and Release of Claims (the “Settlement”) with the named plaintiffs. The Settlement was preliminarily approved by the Court on March 5, 2013. On August 1, 2013 following a fairness hearing the Court issued a final judgment and order approving the Settlement (“Final Judgment and Order”). The Settlement will be effective on September 2, 2013 when the time period for appealing the Final Judgment and Order ends.
The Settlement provides for the certification of a class for settlement purposes only of commercial and residential property owners who purchased steel siding manufactured and warranted by the Company during the period January 1, 1991 to March 15, 2013 (the date on which notice of the proposed Settlement was first sent to settlement class members) and whose siding allegedly experienced “Steel Peel,” which is characterized for the purposes of settlement by the separation of any layer of the finish on the steel siding from the steel siding itself. Subject to the terms and conditions of the Settlement, the Company has agreed that (1) the first time an eligible settlement class member submits a valid Steel Peel warranty claim for siding, the Company will, at its option, repair or replace the siding or, at such class member’s option, make a cash settlement payment to such class member equal to the cost to the Company of the repair or replacement option selected by the Company; (2) the second time such class member submits a valid Steel Peel warranty claim for the same siding, the same options will be available; and (3) the third time such a claim is submitted, such class member may elect to have the Company either refinish or replace the siding or may elect to receive a one-time $8,000 payment. If the $8,000 payment option is chosen, the Company will have no further obligation to such class member in connection with the warranty.
Under the Settlement, the Company has agreed to pay the sum of $2.5 million to compensate class counsel for attorneys’ fees and litigation expenses incurred and to be incurred in connection with the lawsuit. The Company also paid $0.6 million associated with executing the notice provisions of the Settlement. The Company recognized settlement costs related to the attorneys’ fees and notice costs as of December 29, 2012. The Company did not recognize additional settlement costs during its interim period ended September 28, 2013. The Company expects to incur additional warranty costs associated with the Settlement, however, the Company does not believe the incremental costs, which currently cannot be estimated for recognition purposes, will be material.
F-60
Table of Contents
The Settlement does not constitute an admission of liability, culpability, negligence or wrongdoing on the Company’s part, and the Company believes it has valid defenses to the claims asserted. Upon final approval by the court, the Settlement will release all claims that were or could have been asserted against the Company in the lawsuit or that relate to any aspect of the subject matter of the lawsuit.
Other environmental claims and product liability claims are administered by the Company in the ordinary course of business, and the Company maintains pollution and remediation and product liability insurance covering certain types of claims. Although it is difficult to estimate the Company’s potential exposure to these matters, the Company believes that the resolution of these matters will not have a material adverse effect on its financial position, results of operations or liquidity.
14. BUSINESS SEGMENTS
The Company is in the business of manufacturing and distributing exterior residential building products. The Company has a single operating segment and a single reportable segment. The Company’s chief operating decision maker is considered to be the Chief Executive Officer. The chief operating decision maker allocates resources and assesses performance of the business and other activities at the single operating segment level. Net sales by principal product offering are as follows (in thousands):
| Nine Months Ended | ||||||||
| September 28, 2013 |
September 29, 2012 |
|||||||
| Vinyl windows |
$ | 271,063 | $ | 261,201 | ||||
| Vinyl siding products |
165,317 | 175,340 | ||||||
| Metal products |
128,129 | 133,923 | ||||||
| Third-party manufactured products |
235,758 | 223,794 | ||||||
| Other products and services |
73,197 | 58,121 | ||||||
|
|
|
|
|
|||||
| $ | 873,464 | $ | 852,379 | |||||
|
|
|
|
|
|||||
15. EARNINGS PER SHARE
Basic earnings per share is computed by dividing net income (loss) by the corresponding weighted average number of shares of common stock outstanding for the period. The dilutive effect of restricted stock and the potential exercise of outstanding stock options to purchase shares of common stock is calculated using the treasury stock method, except when the effect would be anti-dilutive. The computation for diluted earnings per share for the nine months ended September 28, 2013 and September 29, 2012 excludes 4.5 million shares and 4.3 million shares, respectively, due to their anti-dilutive effects. The following table sets forth the computation of the Company’s basic and diluted earnings per share for the periods presented (in thousands except share and per share amounts):
| Nine Months Ended | ||||||||
| September 28, 2013 |
September 29, 2012 |
|||||||
| Numerator: |
||||||||
| Net loss |
$ | (31,982 | ) | $ | (36,958 | ) | ||
| Denominator: |
||||||||
| Weighted average shares common stock outstanding (basic and diluted) |
55,664,994 | 55,638,894 | ||||||
| Earnings per share: |
||||||||
| Loss per share (basic and diluted) |
$ | (0.57 | ) | $ | (0.66 | ) | ||
F-61
Table of Contents
Shares
Associated Materials Group, Inc.
Common Stock
PROSPECTUS
, 2013
| Goldman, Sachs & Co. | Barclays | UBS Investment Bank |
| Deutsche Bank Securities |
Through and including , 2013 (the 25th day after the date of this prospectus), all dealers effecting transactions in these securities, whether or not participating in this offering, may be required to deliver a prospectus. This is in addition to a dealer’s obligation to deliver a prospectus when acting as an underwriter and with respect to an unsold allotment or subscription.
Table of Contents
PART II
INFORMATION NOT REQUIRED IN PROSPECTUS
| Item 13. | Other Expenses of Issuance and Distribution |
The following table sets forth the costs and expenses, other than the underwriting discount, payable by the registrant in connection with the sale and distribution of the securities being registered. All amounts are estimated except the SEC registration fee, the FINRA filing fee and the NYSE or Nasdaq, as applicable, listing fee.
| Amount to be paid | ||||
| SEC Registration Fee |
$ | 13,640 | ||
| FINRA Filing Fee |
* | |||
| Initial NYSE or Nasdaq, as applicable, Listing Fee |
* | |||
| Legal Fees and Expenses |
* | |||
| Accounting Fees and Expenses |
* | |||
| Printing and Engraving Expenses |
* | |||
| Blue Sky Fees and Expenses |
* | |||
| Transfer Agent and Registrar Fees |
* | |||
| Miscellaneous Expenses |
* | |||
|
|
|
|||
| Total |
$ | * | ||
|
|
|
|||
| * | To be listed in amendment. |
| Item 14. | Indemnification of Directors and Officers |
Section 102(b)(7) of the Delaware General Corporation Law (the “DGCL”) allows a corporation to provide in its certificate of incorporation that a director of the corporation will not be personally liable to the corporation or its stockholders for monetary damages for breach of fiduciary duty as a director, except where the director breached the duty of loyalty, failed to act in good faith, engaged in intentional misconduct or knowingly violated a law, authorized the payment of a dividend or approved a stock repurchase in violation of Delaware corporate law or obtained an improper personal benefit. Our amended and restated certificate of incorporation will provide for this limitation of liability.
Section 145 of the DGCL (“Section 145”), provides, among other things, that a Delaware corporation may indemnify any person who was, is or is threatened to be made, party to any threatened, pending or completed action, suit or proceeding, whether civil, criminal, administrative or investigative (other than an action by or in the right of such corporation), by reason of the fact that such person is or was an officer, director, employee or agent of such corporation or is or was serving at the request of such corporation as a director, officer, employee or agent of another corporation or enterprise. The indemnity may include expenses (including attorneys’ fees), judgments, fines and amounts paid in settlement actually and reasonably incurred by such person in connection with such action, suit or proceeding, provided such person acted in good faith and in a manner he or she reasonably believed to be in or not opposed to the corporation’s best interests and, with respect to any criminal action or proceeding, had no reasonable cause to believe that his or her conduct was unlawful. A Delaware corporation may indemnify any persons who were or are a party to any threatened, pending or completed action or suit by or in the right of the corporation by reason of the fact that such person is or was a director, officer, employee or agent of another corporation or enterprise. The indemnity may include expenses (including attorneys’ fees) actually and reasonably incurred by such person in connection with the defense or settlement of such action or suit, provided such person acted in good faith and in a manner he or she reasonably believed to be in or not opposed to the corporation’s best interests, provided further that no indemnification is permitted without judicial
II-1
Table of Contents
approval if the officer, director, employee or agent is adjudged to be liable to the corporation. Where an officer or director is successful on the merits or otherwise in the defense of any action referred to above, the corporation must indemnify him or her against the expenses (including attorneys’ fees) which such officer or director has actually and reasonably incurred.
Section 145 further authorizes a corporation to purchase and maintain insurance on behalf of any person who is or was a director, officer, employee or agent of the corporation or is or was serving at the request of the corporation as a director, officer, employee or agent of another corporation or enterprise, against any liability asserted against such person and incurred by such person in any such capacity, or arising out of his or her status as such, whether or not the corporation would otherwise have the power to indemnify such person under Section 145.
Our amended and restated bylaws will provide that we must indemnify and advance expenses to our directors and officers to the full extent authorized by the DGCL.
Further, prior to the completion of the offering, we expect to enter into indemnification agreements with each of our directors and executive officers that may be broader than the specific indemnification provisions contained in our amended and restated bylaws or the DGCL. Such agreements may require us, among other things, to advance expenses and otherwise indemnify our executive officers and directors against certain liabilities that may arise by reason of their status or service as executive officers or directors, to the fullest extent permitted by law. We intend to enter into indemnification agreements with any new directors and executive officers in the future.
The indemnification rights set forth above shall not be exclusive of any other right which an indemnified person may have or hereafter acquire under any statute, any provision of our amended and restated certificate of incorporation, our amended and restated bylaws, agreement, vote of stockholders or disinterested directors or otherwise. Notwithstanding the foregoing, we shall not be obligated to indemnify a director or officer in respect of a proceeding (or part thereof) instituted by such director or officer, unless such proceeding (or part thereof) has been authorized by the board of directors pursuant to the applicable procedure outlined in the amended and restated bylaws.
Section 174 of the DGCL provides, among other things, that a director, who willfully or negligently approves of an unlawful payment of dividends or an unlawful stock purchase or redemption, may be held jointly and severally liable for such actions. A director who was either absent when the unlawful actions were approved or dissented at the time may avoid liability by causing his or her dissent to such actions to be entered in the books containing the minutes of the meetings of the board of directors at the time such action occurred or immediately after such absent director receives notice of the unlawful acts.
We expect to maintain standard policies of insurance that provide coverage (1) to our directors and officers against loss rising from claims made by reason of breach of duty or other wrongful act and (2) to us with respect to indemnification payments that we may make to such directors and officers.
The underwriting agreement provides for indemnification by the underwriters of us and our officers and directors, and by us of the underwriters, for certain liabilities arising under the Securities Act or otherwise in connection with this offering.
| Item 15. | Recent Sales of Unregistered Securities |
Within the past three years, the Registrant has issued and sold the following unregistered securities of the Registrant:
1. On September 3, 2010, in connection with the incorporation of the Registrant, 10 shares of common stock were issued to Hellman & Friedman Capital Partners VI, L.P. for no consideration.
II-2
Table of Contents
2. On October 13, 2010, in connection with the Merger, the Registrant issued 53,504,421 shares of common stock to the H&F Investors for aggregate consideration of $535,044,210.
3. On October 13, 2010, in connection with the Merger, the Registrant issued $5.0 million in aggregate principal amount of 0.50% Subordinated Convertible Promissory Notes due 2011 (the “convertible notes”) to the H&F Investors with a maturity date of April 13, 2011.
4. On October 13, 2010, in connection with the Merger, the Registrant issued 1,346,276 shares of common stock to certain of its directors and officers for aggregate consideration of $13,462,760.
5. On November 19, 2010, the Registrant issued 10,000 shares of common stock to Mr. Snyder for aggregate consideration of $100,000, which amount the Registrant instructed Mr. Snyder to pay directly to the H&F Investors as a partial prepayment by the Registrant of the outstanding principal of and accrued interest on the convertible notes.
6. On April 13, 2011, upon conversion of the convertible notes, the Registrant issued 491,229 shares to the H&F Investors in full repayment of the outstanding principal of and accrued interest on the convertible notes of $4,912,290.
7. On September 12, 2011, the Registrant issued 220,000 shares of common stock to Mr. Burris for aggregate consideration of $1,100,000, consisting of a promissory note issued by Mr. Burris to repay the principal amount thereof of $800,000, plus interest thereon, within a fixed term and $300,000 in cash. The promissory note was secured by a pledge of such shares by Mr. Burris. Mr. Burris repaid the promissory note in full on June 27, 2013.
8. Since October 12, 2010, the Registrant has granted its directors, officers and employees (a) a total of 9,566,474 options to purchase shares of common stock at a weighted average exercise price of $15.29 per share, none of which have been exercised and 4,631,471 of which have been forfeited, (b) 187,958 shares of common stock and (c) 18,000 deferred stock units. No purchase price was paid by such directors, officers and employees in exchange for these issuances. In September 2011, the Registrant modified 2,379,774 of the options granted since October 13, 2010 that were held by eligible participants to reduce the exercise price of such options. The modification did not change the number of options outstanding but reduced the weighted average exercise of the modified options from $19.25 price before the repricing to $11.17 after the repricing.
9. In June 2011, the Registrant modified certain outstanding performance-based options held by eligible participants to reduce the Adjusted EBITDA target of such options for the portion of the award vesting in 2011 and to defer the establishment of Adjusted EBITDA targets for subsequent tranches, which will be set at an amount equal to or greater than the Company’s budgeted Adjusted EBITDA as determined by Parent’s board of directors within 90 days of the commencement of each fiscal year. As a result, 542,208 performance-based options were cancelled with 108,442 of those cancelled options immediately reissued. The Registrant expects to re-issue the remaining performance-based options in accordance with the vesting period of each tranche.
The issuances of the securities described in paragraphs (1), (2), (3), (4), (5), (6) and (7) above were exempt from registration under the Securities Act in reliance on Section 4(2) of the Securities Act as transactions by an issuer not involving any public offering. Such securities were issued to accredited investors who acquired the securities for investment only and not with a view toward the public sale or distribution thereof.
The issuances of the securities described in paragraphs (8) and (9) above were effected without registration in reliance on Rule 701 under the Securities Act for securities sold under a written compensatory benefit plan or contract for the participation of the Registrant’s directors, officers, employees, consultants and advisors.
II-3
Table of Contents
| Item 16. | Exhibits and Financial Statement Schedules |
(a) Exhibits. See Exhibit Index immediately following the signature page hereto which is incorporated by reference as if fully set forth herein.
(b) Financial Statement Schedules. The following financial statement schedule is included herein: Schedule I—Condensed Financial Information of Registrant.
REPORT OF INDEPENDENT REGISTERED PUBLIC ACCOUNTING FIRM
To the Board of Directors of
Associated Materials Group, Inc.
We have audited the accompanying consolidated balance sheets of Associated Materials Group, Inc. and subsidiaries (the “Company”) as of December 29, 2012 and December 31, 2011, and the related consolidated statements of operations, comprehensive loss, stockholders’ equity, and cash flows for the years ended December 29, 2012 and December 31, 2011 and the period from October 13, 2010 to January 1, 2011. We have also audited the consolidated statements of operations, comprehensive loss, stockholders’ (deficit), and cash flows of AMH Holdings II, Inc. and subsidiaries (the “Predecessor”) for the period from January 3, 2010 to October 12, 2010 and have issued our report thereon dated July 15, 2013 (included elsewhere in this Registration Statement). Our audits also included the financial statement schedule listed in Item 16 (b) of this Registration Statement. This financial statement schedule is the responsibility of the Company’s management. Our responsibility is to express an opinion based on our audits. In our opinion, such financial statement schedule, when considered in relation to the basic financial statements taken as a whole, presents fairly in all material respects the information set forth therein.
| /s/ Deloitte & Touche LLP |
| Cleveland, Ohio July 15, 2013 |
II-4
Table of Contents
SCHEDULE I—CONDENSED FINANCIAL INFORMATION OF REGISTRANT
ASSOCIATED MATERIALS GROUP, INC.
(PARENT COMPANY ONLY)
CONDENSED BALANCE SHEETS
(In thousands)
| December 29, 2012 |
December 31, 2011 |
|||||||
| ASSETS |
||||||||
| Investments in and amounts due from subsidiaries |
$ | 231,055 | $ | 270,464 | ||||
|
|
|
|
|
|||||
| Total assets |
$ | 231,055 | $ | 270,464 | ||||
|
|
|
|
|
|||||
| LIABILITIES AND STOCKHOLDERS’ EQUITY |
||||||||
| Commitments and contingencies |
||||||||
| Stockholders’ Equity: |
||||||||
| Common stock |
557 | 556 | ||||||
| Capital in excess of par |
554,647 | 554,552 | ||||||
| Note receivable from officer for purchase of common stock |
(736 | ) | (804 | ) | ||||
| Accumulated other comprehensive loss |
(17,247 | ) | (16,029 | ) | ||||
| Accumulated deficit |
(306,166 | ) | (267,811 | ) | ||||
|
|
|
|
|
|||||
| Total stockholders’ equity |
$ | 231,055 | $ | 270,464 | ||||
|
|
|
|
|
|||||
See accompanying notes to condensed financial statements.
II-5
Table of Contents
ASSOCIATED MATERIALS GROUP, INC.
(PARENT COMPANY ONLY)
CONDENSED STATEMENTS OF COMPREHENSIVE LOSS
(In thousands)
| Year Ended December 29, 2012 |
Year Ended December 31, 2011 |
October 13, 2010 to January 1, 2011 |
January 3, 2010 to October 12, 2010 |
|||||||||||||||
| Successor | Predecessor | |||||||||||||||||
| Equity in loss of subsidiaries |
$ | (38,367 | ) | $ | (202,789 | ) | $ | (65,015 | ) | $ | (71,274 | ) | ||||||
| Interest income (expense), net |
12 | (2 | ) | (5 | ) | — | ||||||||||||
|
|
|
|
|
|
|
|
|
|||||||||||
| Loss before income taxes |
(38,355 | ) | (202,791 | ) | (65,020 | ) | (71,274 | ) | ||||||||||
| Income tax expense |
— | — | — | — | ||||||||||||||
|
|
|
|
|
|
|
|
|
|||||||||||
| Net loss |
$ | (38,355 | ) | $ | (202,791 | ) | $ | (65,020 | ) | $ | (71,274 | ) | ||||||
|
|
|
|
|
|
|
|
|
|||||||||||
| Other comprehensive income (loss) |
(1,218 | ) | (26,014 | ) | 9,985 | (9,640 | ) | |||||||||||
|
|
|
|
|
|
|
|
|
|||||||||||
| Total comprehensive loss |
$ | (39,573 | ) | $ | (228,805 | ) | $ | (55,035 | ) | $ | (80,914 | ) | ||||||
|
|
|
|
|
|
|
|
|
|||||||||||
See accompanying notes to condensed financial statements.
II-6
Table of Contents
ASSOCIATED MATERIALS GROUP, INC.
(PARENT COMPANY ONLY)
CONDENSED STATEMENTS OF CASH FLOWS
(In thousands)
| Year Ended December 29, 2012 |
Year Ended December 31, 2011 |
October 13, 2010 to January 1, 2011 |
January 3, 2010 to October 12, 2010 |
|||||||||||||||
| OPERATING ACTIVITIES |
||||||||||||||||||
| Net loss |
$ | (38,355 | ) | $ | (202,791 | ) | $ | (65,020 | ) | $ | (71,274 | ) | ||||||
| Interest (income) expense, net |
(12 | ) | 2 | 5 | — | |||||||||||||
| Equity in loss of subsidiaries |
38,367 | 202,789 | 65,015 | 71,274 | ||||||||||||||
|
|
|
|
|
|
|
|
|
|||||||||||
| Net cash provided by operating activities |
— | — | — | — | ||||||||||||||
| INVESTING ACTIVITIES |
||||||||||||||||||
| Investments in subsidiaries |
(80 | ) | (300 | ) | (553,507 | ) | — | |||||||||||
|
|
|
|
|
|
|
|
|
|||||||||||
| Net cash used in investing activities |
(80 | ) | (300 | ) | (553,507 | ) | — | |||||||||||
| FINANCING ACTIVITIES |
||||||||||||||||||
| Proceeds from the issuance of common stock |
80 | 300 | 548,507 | — | ||||||||||||||
| Proceeds from convertible notes |
— | — | 5,000 | — | ||||||||||||||
|
|
|
|
|
|
|
|
|
|||||||||||
| Net cash provided by financing activities |
80 | 300 | 553,507 | — | ||||||||||||||
| Effect of exchange rate changes on cash and cash equivalents |
— | — | — | — | ||||||||||||||
|
|
|
|
|
|
|
|
|
|||||||||||
| Net increase in cash and cash equivalents |
— | — | — | — | ||||||||||||||
| Cash and cash equivalents at beginning of the period |
— | — | — | — | ||||||||||||||
|
|
|
|
|
|
|
|
|
|||||||||||
| Cash and cash equivalents at end of the period |
$ | — | $ | — | $ | — | $ | — | ||||||||||
|
|
|
|
|
|
|
|
|
|||||||||||
See accompanying notes to condensed financial statements.
II-7
Table of Contents
ASSOCIATED MATERIALS GROUP, INC.
(PARENT COMPANY ONLY)
NOTES TO CONDENSED FINANCIAL STATEMENTS
1. ACCOUNTING POLICIES
BASIS OF PRESENTATION
These condensed parent company financial statements have been prepared in accordance with Rule 12-04, Schedule I of Regulation S-X as the restricted net assets of Associated Materials Group, Inc. and its subsidiaries exceeds 25% of the consolidated net assets of Associated Materials Group, Inc. (“Parent”) and its consolidated subsidiaries (together, the “Company”). Parent is a holding company and conducts substantially all of its business operations through its subsidiary, Associated Materials, LLC. The parent/subsidiary relationship consists primarily of capital contributions.
The financial statements for the years ended December 29, 2012 and December 31, 2011 and the period October 13, 2010 to January 1, 2011 have been presented to reflect the financial results of the Company subsequent to the Merger (the “Successor”). The financial statements for the period January 3, 2010 to October 12, 2010 have been presented to reflect the financial results of the Company and its former direct and indirect parent companies, Associated Materials Holdings, LLC, AMH and AMH II (together, the “Predecessor”). The Company’s financial position, results of operations and cash flows prior to the date of the Merger include the activity and results of its former direct and indirect parent companies, which principally consisted of borrowings and related interest expense, and are presented as the results of the Predecessor. The results of operations, including the Merger and results thereafter, are presented as the results of the Successor.
The Company operates on a 52/53 week fiscal year that ends on the Saturday closest to December 31st. The Company’s 2012, 2011 and 2010 fiscal years ended on December 29, 2012, December 31, 2011 and January 1, 2011, respectively, and included 52 weeks of operations.
Principles of Consolidation
The Parent on a standalone basis has accounted for all subsidiaries using the equity method of accounting to reflect its ownership interest. The accounting policies used in the preparation of the parent-only financial statements are generally consistent with those used in the preparation of the consolidated financial statements of the Company. These parent-only financial statements and notes presented should be read in conjunction with the consolidated financial statements of the Company (“consolidated financial statements”).
2. STOCKHOLDERS’ EQUITY
Parent has two classes of capital stock, preferred stock and common stock. As of December 29, 2012, there are 5 million shares of preferred stock, par value $0.01 per share, authorized. There were no preferred shares issued and outstanding as of December 29, 2012 or December 31, 2011. As of December 29, 2012, there are 200 million shares of common stock, par value $0.01 per share, authorized. Parent has 55,686,894 and 55,662,894 shares of common stock issued and outstanding as of December 29, 2012 and December 31, 2011, respectively.
In September 2011, Jerry W. Burris, President and Chief Executive Officer of the Company, purchased 220,000 shares of common stock at a fair market value of $5 per share. As consideration for a portion of the purchase price, the Company accepted a $0.8 million promissory note from Mr. Burris. The note accrued interest at 1.63% per annum and had a maturity date of March 31, 2014. A principal payment of $0.1 million was made on March 31, 2012. The balance of the note receivable, including accrued interest, was $0.7 million and $0.8 million as of December 29, 2012 and
II-8
Table of Contents
December 31, 2011, respectively. The outstanding principal amount of and accrued interest on the promissory note were repaid in full by Mr. Burris on June 27, 2013.
3. LONG-TERM DEBT
0.50% Subordinated Convertible Promissory Notes due 2011
On October 13, 2010, in connection with the Merger, Parent issued 0.50% Subordinated Convertible Promissory Notes due 2011 (the “convertible notes”) to certain investment funds affiliated with H&F (the “H&F Investors”) with a maturity date of April 13, 2011. The aggregate principal amount of the convertible notes was $5.0 million. Interest was payable on the convertible notes quarterly in arrears on January 10, April 10, July 10 and October 10 of each year, with the first payment made on January 10, 2011. Any interest payable on the convertible notes on any interest payment date was paid by adding an amount equal to the interest payable on such interest payment date to the then outstanding principal amount on such interest payment date.
In November 2010, Parent issued 10,000 shares of common stock to a director pursuant to a stock subscription agreement. Parent instructed the director to pay the $100,000 subscription price to the H&F Investors as a partial prepayment by Parent of the outstanding principal of and accrued interest on the convertible notes. As a result, the outstanding principal amount of the convertible notes was $4.9 million at January 1, 2011.
In April 2011, upon conversion of the convertible notes by the H&F Investors, Parent issued 491,229 shares of Parent common stock to the H&F Investors in full repayment of the outstanding principal of and accrued interest on the convertible notes of $4.9 million.
| Item 17. | Undertakings |
(1) The undersigned registrant hereby undertakes to provide to the underwriters at the closing specified in the underwriting agreement certificates in such denominations and registered in such names as required by the underwriters to permit prompt delivery to each purchaser.
(2) Insofar as indemnification for liabilities arising under the Securities Act of 1933 may be permitted to directors, officers and controlling persons of the registrant pursuant to the foregoing provisions, or otherwise, the registrant has been advised that in the opinion of the Securities and Exchange Commission such indemnification is against public policy as expressed in the Securities Act of 1933 and is, therefore, unenforceable. In the event that a claim for indemnification against such liabilities (other than the payment by the registrant of expenses incurred or paid by a director, officer or controlling person of the registrant in the successful defense of any action, suit or proceeding) is asserted by such director, officer or controlling person in connection with the securities being registered, the registrant will, unless in the opinion of its counsel the matter has been settled by controlling precedent, submit to a court of appropriate jurisdiction the question of whether such indemnification by it is against public policy as expressed in the Securities Act of 1933 and will be governed by the final adjudication of such issue.
(3) The undersigned registrant hereby undertakes that:
(a) For purposes of determining any liability under the Securities Act, the information omitted from the form of prospectus as filed as part of this Registration Statement in reliance upon Rule 430A and contained in a form of prospectus filed by the registrant pursuant to Rule 424(b)(1) or (4) or 497(h) under the Securities Act shall be deemed to be part of this Registration Statement as of the time it was declared effective.
(b) For the purpose of determining any liability under the Securities Act, each post-effective amendment that contains a form of prospectus shall be deemed to be a new Registration Statement relating to the securities offered therein, and the offering of such securities at that time shall be deemed to be the initial bona fide offering thereof.
II-9
Table of Contents
Signatures
Pursuant to the requirements of the Securities Act of 1933, we have duly caused this Amendment No. 3 to the Registration Statement on Form S-1 to be signed on its behalf by the undersigned, thereunto duly authorized, in the City of Cuyahoga Falls, State of Ohio, on November 15, 2013.
| ASSOCIATED MATERIALS GROUP, INC. | ||
| By: | /s/ Jerry W. Burris | |
| Name: | Jerry W. Burris | |
| Title: | President and Chief Executive Officer | |
Pursuant to the requirements of the Securities Act of 1933, this registration statement and power of attorney have been signed by the following persons in the capacities indicated on November 15, 2013.
| Signature |
Title | |
| /s/ Jerry W. Burris Jerry W. Burris |
President and Chief Executive Officer (Principal Executive Officer) | |
| /s/ Paul Morrisroe Paul Morrisroe |
Senior Vice President and Chief Financial Officer (Principal Financial Officer and Principal Accounting Officer) | |
| * Erik D. Ragatz |
Chairman of the Board of Directors | |
| * Lawrence M. Blackburn |
Director | |
| * Charles A. Carroll |
Director | |
| * Dana R. Snyder |
Director | |
| * Robert B. Henske |
Director | |
| * Adam B. Durrett |
Director | |
| *By: |
/s/ Jerry W. Burris | |
| Jerry W. Burris | ||
| Attorney-in-Fact | ||
II-10
Table of Contents
EXHIBIT INDEX
| Exhibit |
Description | |
| 1.1† | Form of Underwriting Agreement. | |
| 3.1† | Form of Amended and Restated Certificate of Incorporation of Associated Materials Group, Inc. | |
| 3.2† | Form of Amended and Restated Bylaws of Associated Materials Group, Inc. | |
| 4.1† | Form of Stock Certificate for Common Stock. | |
| 5.1 | Form of Opinion of Simpson Thacher & Bartlett LLP. | |
| 10.1 | Amended and Restated Revolving Credit Agreement, dated as of April 18, 2013, among Associated Materials, LLC, AMH Intermediate Holdings Corp. (f/k/a Carey Intermediate Holdings Corp.), Gentek Holdings, LLC, Gentek Building Products, Inc., AMH New Finance, Inc. (f/k/a Carey New Finance, Inc.), Associated Materials Canada Limited, Gentek Canada Holdings Limited, Gentek Building Products Limited Partnership and several lenders and agents party thereto (incorporated by reference to Exhibit 10.1 to Associated Materials, LLC’s Quarterly Report on Form 10-Q, filed with the SEC on May 10, 2013). | |
| 10.2 | Amendment No. 1 to Revolving Credit Agreement and US Security Agreement, dated April 26, 2012, among Associated Materials, LLC, Associated Materials Incorporated (f/k/a AMH Intermediate Holdings Corp. and Carey Intermediate Holdings Corp.), Gentek Holdings, LLC, Gentek Building Products, Inc., AMH New Finance, Inc. (f/k/a Carey New Finance, Inc.), Associated Materials Canada Limited, Gentek Canada Holdings Limited, Gentek Building Products Limited Partnership and several Lenders and Agents thereto (incorporated by reference to Exhibit 99.1 to Associated Materials, LLC’s Current Report on Form 8-K, filed with the SEC on May 2, 2012). | |
| 10.3 | Omnibus Amendment to Canadian Loan Documents, dated April 26, 2012, among Associated Materials Canada Limited, Gentek Canada Holdings Limited, Gentek Building Products Limited Partnership and the Canadian Collateral Agent (incorporated by reference to Exhibit 99.2 to Associated Materials, LLC’s Current Report on Form 8-K, filed with the SEC on May 2, 2012). | |
| 10.4 | Indenture, dated as of October 13, 2010, among Carey Acquisition Corp., Carey New Finance, Inc., Associated Materials, LLC, the guarantors named therein and Wells Fargo Bank, National Association, as trustee and notes collateral agent (incorporated by reference to Exhibit 4.1 to Associated Materials, LLC’s Annual Report on Form 10-K, filed with the SEC on April 1, 2011). | |
| 10.5 | Form of 9.125% Senior Secured Note due 2017 (incorporated by reference to Exhibit 4.2 to Associated Materials, LLC’s Annual Report on Form 10-K, filed with the SEC on April 1, 2011). | |
| 10.6 | Notes Security Agreement, dated as of October 13, 2010, among Associated Materials, LLC, the other grantors named therein and Wells Fargo Bank, National Association, as notes collateral agent (incorporated by reference to Exhibit 10.10 to Associated Materials, LLC’s Annual Report on Form 10-K, filed with the SEC on April 1, 2011). | |
| 10.7 | Notes Pledge Agreement, dated as of October 13, 2010, among Associated Materials, LLC, the other pledgors named therein and Wells Fargo Bank, National Association, as collateral agent (incorporated by reference to Exhibit 10.11 to Associated Materials, LLC’s Annual Report on Form 10-K, filed with the SEC on April 1, 2011). | |
| 10.8 | US Security Agreement, dated as of October 13, 2010, among Carey Intermediate Holdings Corp., Associated Materials, LLC, the other grantors named therein and UBS AG, Stamford Branch, as US collateral agent (incorporated by reference to Exhibit 10.2 to Associated Materials, LLC’s Annual Report on Form 10-K, filed with the SEC on April 1, 2011). | |
Table of Contents
| Exhibit |
Description | |
| 10.9 | US Pledge Agreement, dated as of October 13, 2010, among Carey Intermediate Holdings Corp., Associated Materials, LLC, the other pledgors named therein and UBS AG, Stamford Branch, as US collateral agent (incorporated by reference to Exhibit 10.3 to Associated Materials, LLC’s Annual Report on Form 10-K, filed with the SEC on April 1, 2011). | |
| 10.10 | US Guarantee, dated as of October 13, 2010, among Carey Intermediate Holdings Corp., Associated Materials, LLC, the other guarantors named therein and UBS AG, Stamford Branch, as US collateral agent (incorporated by reference to Exhibit 10.4 to Associated Materials, LLC’s Annual Report on Form 10-K, filed with the SEC on April 1, 2011). | |
| 10.11 | Canadian Security Agreement, dated as of October 13, 2010, among Associated Materials Canada Limited, Gentek Canada Holdings Limited, Gentek Building Products Limited Partnership, the other grantors named therein and UBS AG Canada Branch, as Canadian collateral agent (incorporated by reference to Exhibit 10.5 to Associated Materials, LLC’s Annual Report on Form 10-K, filed with the SEC on April 1, 2011). | |
| 10.12 | Canadian Pledge Agreement, dated as of October 13, 2010, among Associated Materials Canada Limited, Gentek Canada Holdings Limited, Gentek Building Products Limited Partnership, the other pledgors named therein and UBS AG Canada Branch, as Canadian collateral agent (incorporated by reference to Exhibit 10.6 to Associated Materials, LLC’s Annual Report on Form 10-K, filed with the SEC on April 1, 2011). | |
| 10.13 | Canadian Pledge Agreement, dated as of October 13, 2010, between Gentek Building Products, Inc. and UBS AG, Stamford Branch, as US collateral agent (incorporated by reference to Exhibit 10.7 to Associated Materials, LLC’s Annual Report on Form 10-K, filed with the SEC on April 1, 2011). | |
| 10.14 | Canadian Guarantee, dated as of October 13, 2010, among Associated Materials Canada Limited, Gentek Canada Holdings Limited, Gentek Building Products Limited Partnership, the other guarantors named therein and UBS AG Canada Branch, as Canadian collateral agent (incorporated by reference to Exhibit 10.8 to Associated Materials, LLC’s Annual Report on Form 10-K, filed with the SEC on April 1, 2011). | |
| 10.15 | Intercreditor Agreement, dated as of October 13, 2010, between UBS AG, Stamford Branch, as collateral agent under the revolving loan documents, and Wells Fargo Bank, National Association, as collateral agent under the indenture and notes collateral documents (incorporated by reference to Exhibit 10.9 to Associated Materials, LLC’s Annual Report on Form 10-K, filed with the SEC on April 1, 2011). | |
| 10.16 | First Supplemental Indenture, dated as of May 1, 2013, among Associated Materials, LLC, AMH New Finance, Inc., the guarantors named therein and Wells Fargo Bank, National Association, as trustee and notes collateral agent (incorporated by reference to Exhibit 4.1 to Associated Materials, LLC’s Quarterly Report on Form 10-Q, filed with the SEC on May 10, 2013). | |
| 10.17 | Registration Rights Agreement, dated as of May 1, 2013, among Associated Materials, LLC, AMH New Finance, Inc., the guarantors named therein, Deutsche Bank Securities Inc., UBS Securities LLC, SunTrust Robinson Humphrey, Inc. and Wells Fargo Securities, LLC (incorporated by reference to Exhibit 4.2 to Associated Materials, LLC’s Quarterly Report on Form 10-Q, filed with the SEC on May 10, 2013). | |
| 10.18* | Stockholders Agreement, dated as of October 13, 2010, among Carey Investment Holdings Corp., Carey Intermediate Holdings Corp., Associated Materials, LLC and the stockholders and holders of options signatory thereto (incorporated by reference to Exhibit 10.12 to Associated Materials, LLC’s Annual Report on Form 10-K, filed with the SEC on April 1, 2011). | |
Table of Contents
| Exhibit |
Description | |
| 10.19* | Associated Materials Group, Inc. 2010 Stock Incentive Plan (incorporated by reference to Exhibit 10.13 to Associated Materials, LLC’s Annual Report on Form 10-K, filed with the SEC on April 1, 2011). | |
| 10.20* | Form of Stock Option Agreement (Time Vesting Option) for awards made under the 2010 Stock Incentive Plan (incorporated by reference to Exhibit 10.14 to Associated Materials, LLC’s Annual Report on Form 10-K, filed with the SEC on April 1, 2011). | |
| 10.21* | Form of Stock Option Agreement (Performance Vesting Option) for awards made under the 2010 Stock Incentive Plan (incorporated by reference to Exhibit 10.15 to Associated Materials, LLC’s Annual Report on Form 10-K, filed with the SEC on April 1, 2011). | |
| 10.22* | Executive Cash Incentive Plan (incorporated by reference to Exhibit 10.2 to Associated Materials, LLC’s Quarterly Report on Form 10-Q, filed with the SEC on May 10, 2013). | |
| 10.23*† | Associated Materials Group, Inc. 2013 Stock Incentive Plan. | |
| 10.24*† | Form of Stock Option Agreement (Time Vesting Option) for awards made under the 2013 Stock Incentive Plan. | |
| 10.25*† | Form of Stock Option Agreement (Performance Vesting Option) for awards made under the 2013 Stock Incentive Plan. | |
| 10.26* | Form of Restricted Stock Award Agreement for awards made under the 2010 Stock Incentive Plan (incorporated by reference to Exhibit 10.26 to Associated Materials Group, Inc.’s Amendment No. 1 to Registration Statement on Form S-1, filed with the SEC on August 22, 2013). | |
| 10.27* | Form of Restricted Stock Award Agreement for awards made under the 2013 Stock Incentive Plan (incorporated by reference to Exhibit 10.27 to Associated Materials Group, Inc.’s Amendment No. 1 to Registration Statement on Form S-1, filed with the SEC on August 22, 2013). | |
| 10.28* | Form of Deferred Stock Unit Agreement for awards made under the 2010 Stock Incentive Plan (incorporated by reference to Exhibit 10.28 to Associated Materials Group, Inc.’s Amendment No. 2 to Registration Statement on Form S-1, filed with the SEC on September 18, 2013). | |
| 10.29* | Employment Agreement, dated as of September 12, 2011, between Associated Materials, LLC and Jerry W. Burris (incorporated by reference to Exhibit 10.1 to Associated Materials, LLC’s Current Report on Form 8-K, filed with the SEC on September 12, 2011). | |
| 10.30* | Employment Agreement, dated as of October 13, 2010, between Associated Materials, LLC and Stephen Graham (incorporated by reference to Exhibit 10.17 to Associated Materials, LLC’s Annual Report on Form 10-K, filed with the SEC on April 1, 2011). | |
| 10.31* | Employment Agreement, dated as of August 1, 2011, between Associated Materials, LLC and Robert C. Gaydos (incorporated by reference to Exhibit 10.1 to Associated Materials, LLC’s Current Report on Form 8-K, filed with the SEC on August 3, 2011). | |
| 10.32* | Amended and Restated Employment Agreement, dated as of February 20, 2012, between Associated Materials, LLC and Brad Beard (incorporated by reference to Exhibit 10.19 to Associated Materials, LLC’s Annual Report on Form 10-K, filed with the SEC on March 30, 2012). | |
| 10.33* | Employment Agreement, dated as of October 13, 2010, between Associated Materials, LLC and John F. Haumesser (incorporated by reference to Exhibit 10.20 to Associated Materials, LLC’s Annual Report on Form 10-K, filed with the SEC on April 1, 2011). | |
| 10.34* | Employment Agreement, dated as of February 27, 2012, between Associated Materials, LLC and Paul Morrisroe (incorporated by reference to Exhibit 10.1 to Associated Materials, LLC’s Current Report on Form 8-K, filed with the SEC on March 1, 2012). | |
| 10.35* | Employment Agreement, dated as of February 10, 2012, between Associated Materials, LLC and David S. Nagle (incorporated by reference to Exhibit 10.26 to Associated Materials, LLC’s Annual Report on Form 10-K, filed with the SEC on March 30, 2012). | |
Table of Contents
| Exhibit |
Description | |
| 10.36* | Agreement, dated June 17, 2013, between Jerry W. Burris and Choice Relocation Management, LLC (incorporated by reference to Exhibit 10.26 to Associated Materials, LLC’s Registration Statement on Form S-4, filed with the SEC on July 24, 2013). | |
| 10.37* | Agreement, dated June 17, 2013, between Paul Morrisroe and Choice Relocation Management, LLC (incorporated by reference to Exhibit 10.27 to Associated Materials, LLC’s Registration Statement on Form S-4, filed with the SEC on July 24, 2013). | |
| 10.38* | Form of Indemnification Agreement between Associated Materials Group, Inc. and directors and executive officers of Associated Materials Group, Inc. (incorporated by reference to Exhibit 10.38 to Amendment No. 2 to Associated Materials Group, Inc.’s Registration Statement on Form S-1, filed with the SEC on September 18, 2013). | |
| 10.39* | Amendment No. 1 to Employment Agreement, dated as of October 25, 2013, between Associated Materials, LLC and David S. Nagle (incorporated by reference to Exhibit 10.1 to Associated Material, LLC’s Quarterly Report on Form 10-Q, filed with the SEC on November 8, 2013). | |
| 10.40† | Form of Tax Receivable Agreement. | |
| 21.1 | Subsidiaries of the Registrant (incorporated by reference to Exhibit 21.1 to Associated Materials Group, Inc.’s Registration Statement on Form S-1, filed with the SEC on July 15, 2013). | |
| 23.1 | Consent of Simpson Thacher & Bartlett LLP (included in Exhibit 5.1). | |
| 23.2 | Consent of Deloitte & Touche LLP. | |
| 24.1 | Power of Attorney (incorporated by reference to Exhibit 24.1 to Amendment No. 2 to Associated Materials Group, Inc.’s Registration Statement on Form S-1, filed with the SEC on September 18, 2013). | |
| † | To be filed by amendment. |
| * | Management contract or compensatory plan or arrangement. |