Attached files
| file | filename |
|---|---|
| 8-K - TRUSTCO BANK CORP NY 8-K 11-14-2013 - TRUSTCO BANK CORP N Y | form8k.htm |
Exhibit 99(a)

Robert J. McCormick, President and Chief Executive Officer Robert T. Cushing, Executive Vice President and Chief Financial Officer Scot R. Salvador, Executive Vice President and Chief Banking Officer November 14, 2013

Forward Looking Statements * Note: Data in this presentation was obtained from SNL Financial and from the Company’s SEC filings. This presentation contains “forward-looking statements” within the meaning of the Private Securities Litigation Reform Act of 1995 (the “Act”). Forward-looking statements can be identified by words such as “believes,” “anticipates,” “expects,” “should,” “may,” “plans,” “estimates,” and similar references; however, such words are not the exclusive means of identifying such statements. Examples of forward-looking statements include, but are not limited to: (i) projections of revenues, expenses, income or loss, earnings or loss per share, and other financial items; (ii) statements of plans, objectives, and expectations of TrustCo or its management or Board of Directors; (iii) statements of future economic performance; and (iv) statements of underlying assumptions. Forward-looking statements are based on TrustCo’s current expectations and assumptions regarding its business, the economy, and other future conditions. Because forward- looking statements relate to the future, they are subject to inherent uncertainties, risks, and changes in circumstances that are difficult to predict. TrustCo’s actual results may differ materially from those contemplated by the forward-looking statements, which are neither statements of historical fact nor guarantees or assurances of future performance. Factors that could cause actual results to differ from those discussed in the forward-looking statements include, but are not limited to: (1) local, regional, national, and international economic conditions and the impact they may have on us and our customers; (2) volatility and disruption in national and international financial markets; (3) government intervention in the U.S. financial system; (4) changes in the level of non-performing assets and charge-offs; (5) changes in estimates of future reserve requirements; (6) adverse conditions in the securities markets that lead to impairment in the value of securities in our investment portfolio; (7) inflation, interest rate, securities market, and monetary fluctuations; (8) the timely development and acceptance of new products and services; (9) changes in consumer spending, borrowings, and savings habits; (10) technological changes; (11) the ability to increase market share and control expenses; (12) changes in the competitive environment among banks and other financial service providers; (13) the effect of changes in laws and regulations with which we and our subsidiaries must comply, including those under the Dodd-Frank Wall Street Reform and Consumer Protection Act and the Basel III update to the Basel Accords that is under development; (14) the effect of changes in accounting policies and practices, as may be adopted by regulatory agencies, as well as the Public Company Accounting Oversight Board, the Financial Accounting Standards Board, and other accounting standard setters; (15) the costs and effects of legal and regulatory developments including the resolution of legal proceedings or regulatory or other governmental inquiries and the results of regulatory examinations or reviews; and (16) our success at managing the risks involved in the foregoing items; and (17) the other factors that are described in the Company’s Annual Report on Form 10-K and Quarterly Reports on Form 10-Q under the heading “Risk Factors.” Any forward-looking statement made by the Company speaks only as of the date on which it is made. Factors or events that could cause the Company’s actual results to differ may emerge from time to time, and it is not possible for the Company to predict all of them. The Company undertakes no obligation to publicly update any forward-looking statement, whether as a result of new information, future developments, or otherwise, except as may be required by law.

* TrustCo Bank Corp NY New York community-focused financial services company with additional market presence in Florida, Massachusetts, New Jersey and Vermont Provides core banking products and services to local businesses and retail customers Strategy of building solid deposit franchise with low cost, core deposit base has led to strong, consistent balance sheet and net income growth Source: Company data, SNL Financial Year Founded: 1902 Branches: 139 (86 in NY; 46 in FL; 4 in MA; 2 in NJ; 1 in VT) Branches: 139 (86 in NY; 46 in FL; 4 in MA; 2 in NJ; 1 in VT) Branches: 139 (86 in NY; 46 in FL; 4 in MA; 2 in NJ; 1 in VT) Branches: 139 (86 in NY; 46 in FL; 4 in MA; 2 in NJ; 1 in VT) Headquarters: Glenville, NY Market Data (as of 11/8/13) Financial Data (as of 9/30/13) Closing Price $6.80 Assets: $4.5 Billion Market Capitalization $642M Net Loans: $2.8 Billion Shares Outstanding 94.5M Deposits: $3.9 Billion Dividend Yield: 3.86% Tangible Common Equity: $354 Million Institutional Ownership: 55.8% Insider Ownership: 4.3%

* Strategy and Philosophy for Continued Growth Deposit and Loan Portfolio Growth Superior Asset Quality Increasing Market Share in New Markets Generated through our expanded branch network Intense customer service focus Simple, low cost products Centralized portfolio lending process Conservative lending criteria History of strong portfolio management One of the fastest growing deposit franchises and branch networks in central Florida¹ Improving Efficiency Ratio Effective cost controls producing world class results Florida market consists of the counties of Brevard, Charlotte, Hillsborough, Lake, Manatee, Orange, Osceola, Palm Beach, Polk, Sarasota, Seminole and Volusia Source: FDIC, SNL Financial

* Branch Franchise Overview New York – 14 Counties, 86 Branches Massachusetts – 1 County, 4 Branches New Jersey – 1 County, 2 Branches Vermont – 1 County, 1 Branch Florida – 12 Counties, 46 Branches As of September 30, 2013

* Branch Growth Strategy Since 2000, the Company has increased its network by 85 branches, bringing the total to 139 All new branches opened on a de novo basis Expansion included growth in five states, with a focus on Florida and Downstate New York We have built a platform for steady and conservative growth Rebuilding deposits per branch TrustCo now has a footprint with economic and geographic diversification Source: SEC Filings; Company Documents
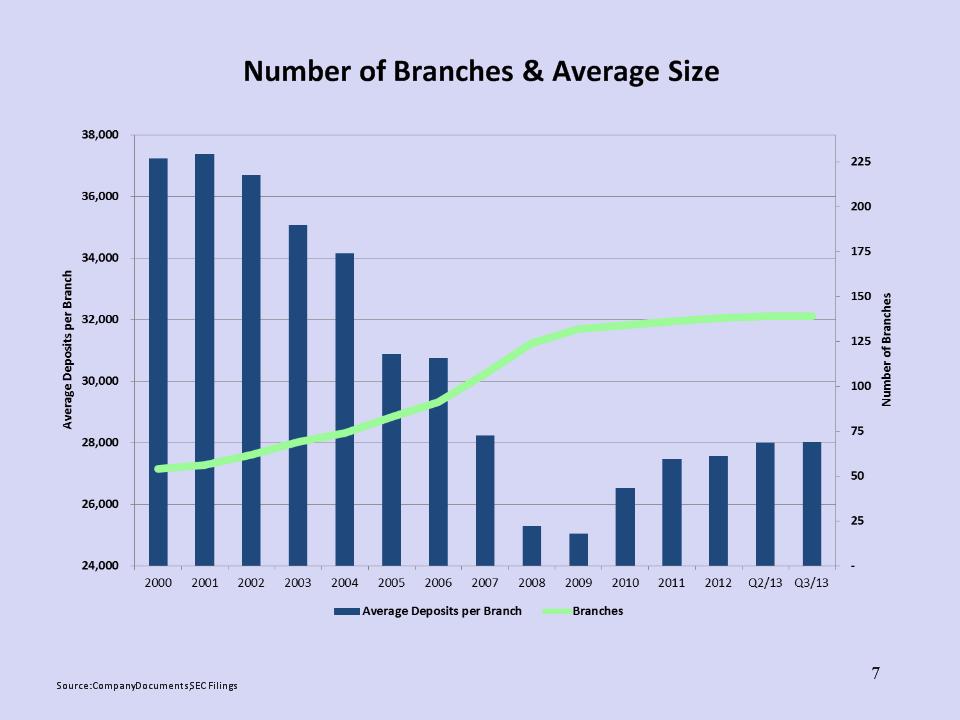
* Number of Branches & Average Size Source: Company Documents, SEC Filings

* Detail of Loan Portfolio 1-4 Family Composition September 30, 2013 The portfolio is comprised of loans that are fully-documented using comprehensive underwriting criteria without sole reliance on credit scores All originations are taken at branch locations by company employees Residential portfolio increased 9.7% year over year Residential delinquency rate superior to peers Average loan size is approximately $95,000 Company chose not to compete against exotic offerings that were commonly offered between 2005 to 2007, e.g. no Alt-A or Subprime products or programs Aggregate: $2.6 Billion Note: Data as of September 30, 2013 Source: Company Documents, Call Report, SEC Filings

Credit Quality * Source: Company Documents, SEC Filings

* Investment Portfolio and Interest Rate Risk Strive to achieve a 60/40 split on loans to investments Investment Securities High level of liquidity well in excess of $1 billion (including cash) Vast majority of securities are available for sale High credit quality portfolio No derivatives, trust preferred or exotic instruments Interest Rate Risk Loans are funded through core deposits No borrowings Deposit lives exceed asset lives Successfully navigated many interest rate environments

* Investment Strategy and Composition 2013 plan consistent with prior years Focus on short-term investments (1-5 average life) Primarily investing in government sponsored agency and mortgage backed securities Continue to evaluate investing in other investment classes Investment Composition U. S. government sponsored enterprises 191,294 States and political subdivisions 9,360 Mortgage-backed securities and collateralized mortgage obligations-residential 624,573 Corporate bonds & other securities 63,485 SBA guaranteed participation certificates 104,809 Total 993,521 September 30, 2013 (Market value, dollars in thousands)

* Capital Ratios as of September 30, 2013 Trustco Bank Source: SEC Filings; SNL Financial