Attached files
| file | filename |
|---|---|
| EX-31.1 - EXHIBIT 31.1 - EMERGENT CAPITAL, INC. | d609820dex311.htm |
| EX-23.1 - EXHIBIT 23.1 - EMERGENT CAPITAL, INC. | d609820dex231.htm |
| EX-31.2 - EXHIBIT 31.2 - EMERGENT CAPITAL, INC. | d609820dex312.htm |
| EX-32.1 - EXHIBIT 32.1 - EMERGENT CAPITAL, INC. | d609820dex321.htm |
| EX-32.2 - EXHIBIT 32.2 - EMERGENT CAPITAL, INC. | d609820dex322.htm |
Table of Contents
UNITED STATES
SECURITIES AND EXCHANGE COMMISSION
Washington, D.C. 20549
Form 10-K/A
Amendment No. 1
(Mark One)
| þ | ANNUAL REPORT PURSUANT TO SECTION 13 OR 15(d) OF THE SECURITIES EXCHANGE ACT OF 1934 |
For the fiscal year ended December 31, 2012
or
| ¨ | TRANSITION REPORT PURSUANT TO SECTION 13 OR 15(d) OF THE SECURITIES EXCHANGE ACT OF 1934 |
For the transition period from to
Commission file number: 001-35064
IMPERIAL HOLDINGS, INC.
(Exact name of registrant as specified in its charter)
| Florida | 30-0663473 | |
| (State or other jurisdiction of incorporation or organization) |
(I.R.S. Employer Identification No.) |
701 Park of Commerce Boulevard, Suite 301
Boca Raton, Florida 33487
(Address of principal executive offices, including zip code)
(561) 995-4200
(Registrant’s telephone number, including area code)
Securities registered pursuant to Section 12(b) of the Act:
| Title of Each Class |
Name of Each Exchange on Which Registered | |
| Common Stock, par value $0.01 per share | New York Stock Exchange |
Securities registered pursuant to Section 12(g) of the Act:
None
Indicate by check mark if the registrant is a well-known seasoned issuer, as defined in Rule 405 of the Securities Act. Yes ¨ No þ
Indicate by check mark if the registrant is not required to file reports pursuant to Section 13 or Section 15(d) of the Exchange Act. Yes ¨ No þ
Indicate by check mark whether the registrant: (1) has filed all reports required to be filed by Section 13 or 15(d) of the Securities Exchange Act of 1934 during the preceding 12 months (or for such shorter period that the registrant was required to file such reports) and (2) has been subject to such filing requirements for the past 90 days. Yes þ No ¨
Indicate by check mark whether the registrant has submitted electronically and posted on its corporate Website, if any, every Interactive Data File required to be submitted and posted pursuant to Rule 405 of Regulation S-T during the preceding 12 months (or for such shorter period that the registrant was required to submit and post such files). Yes þ No ¨
Indicate by check mark if disclosure of delinquent filers pursuant to Item 405 of Regulation S-K is not contained herein and will not be contained, to the best of registrant’s knowledge, in definitive proxy or information statements incorporated by reference in Part III of this Form 10-K or any amendment to this Form 10-K. ¨
Indicate by check mark whether the registrant is a large accelerated filer, an accelerated filer, a non-accelerated filer, or a smaller reporting company. See the definitions of “large accelerated filer,” “accelerated filer” and “smaller reporting company” in Rule 12b-2 of the Exchange Act. (Check one):
| Large accelerated filer | ¨ | Accelerated filer | ¨ | |||
| Non-accelerated filer | þ (Do not check if a smaller reporting company) | Smaller reporting company | ¨ | |||
Indicate by check mark whether the registrant is a shell company (as defined in Rule 12b-2 of the Exchange Act). Yes ¨ No þ
The aggregate market value of the voting and non-voting common stock held by non-affiliates of the registrant on June 30, 2012 was $68,690,983.
The number of shares of the registrant’s common stock outstanding as of March 22, 2013 was 21,206,121.
DOCUMENTS INCORPORATED BY REFERENCE:
Portions of the registrant’s definitive proxy statement relating to the 2013 annual meeting of shareholders are incorporated by reference into Part III of the Company’s Annual Report on Form 10-K, as amended by this Amendment No. 1 on Form 10-K/A.
Table of Contents
Explanatory Note
This Amendment No. 1 to the Annual Report on Form 10-K of Imperial Holdings, Inc. (the “Company”) for the year ended December 31, 2012, filed with the Securities and Exchange Commission (“SEC”) on March 28, 2013 (the “Original Filing”), is filed solely for the purpose of filing Exhibits 23.1, 31.1, 31.2, 32.1 and 32.2. Other than the foregoing and corresponding updates to the Exhibit Index, no changes have been made from the Original Filing.
The certifications pursuant to Section 302 and Section 906 of the Sarbanes-Oxley Act of 2002, filed as Exhibits 31.1, 31.2, 32.1 and 32.2, respectively, to the Original Filing, have been revised, re-executed and re-filed as of the date of this Amendment No. 1.
This Amendment No. 1 on Form 10-K does not reflect events occurring after the filing of the Original Filing, and no attempt has been made herein to modify or update the other disclosures that may have been affected by subsequent events. Accordingly, this Amendment No. 1 should be read in conjunction with our other filings with the SEC.
Table of Contents
IMPERIAL HOLDINGS, INC.
2012 Form 10-K Annual Report
Table of Contents
CAUTIONARY STATEMENT REGARDING FORWARD-LOOKING STATEMENTS
This Annual Report on Form 10-K contains forward-looking statements that are subject to risks and uncertainties. All statements other than statements of historical fact included in this Annual Report on Form 10-K are forward-looking statements. Forward-looking statements give our current expectations and projections relating to our financial condition, results of operations, plans, objectives, future performance and business. You can identify forward-looking statements by the fact that they do not relate strictly to historical or current facts. These statements may include words such as “anticipate,” “estimate,” “expect,” “project,” “plan,” “intend,” “believe,” “may,” “will,” “should,” “can have,” “likely” and other words and terms of similar meaning in connection with any discussion of the timing or nature of future operating or financial performance or other events. These forward-looking statements are not historical facts, and are based on current expectations, estimates and projections about the Company’s industry, management’s beliefs and certain assumptions made by management, many of which, by their nature, are inherently uncertain and beyond the Company’s control. Accordingly, readers are cautioned that any such forward-looking statements are not guarantees of future performance and are subject to certain risks, uncertainties and assumptions that are difficult to predict. Although the Company believes that the expectations reflected in such forward-looking statements are reasonable as of the date made, results may prove to be materially different. Unless otherwise required by law, the Company disclaims any obligation to update its view of any such risks or uncertainties or to announce publicly the result of any revisions to the forward-looking statements made in this report.
Factors that could cause our actual results to differ materially from those indicated in our forward-looking statements include, but are not limited to, the following:
| • | our results of operations; |
| • | continuing costs associated with the USAO investigation, SEC investigation, derivative actions, the class action lawsuits and similar matters; |
| • | adverse developments, including financial ones, associated with the USAO and SEC investigations, derivative actions or class action lawsuits or similar matters; |
| • | our inability to obtain financing on favorable terms or at all; |
| • | our ability to continue to make premium payments on the life insurance policies that we own; |
| • | obligations, including payments that may be undertaken by the Company to settle derivative actions or class action lawsuits; |
| • | loss of business due to negative press from the USAO investigation, SEC investigation, Non-Prosecution Agreement, class action lawsuits or otherwise; |
| • | failure to enter into definitive settlement agreements or settle the class action lawsuits and related litigation on the terms contemplated by the Term Sheet for Global Settlement Regarding Imperial Holdings, Inc. Matters; |
| • | costs in excess of our directors’ & officers’ insurance coverage; |
| • | refusal by our directors’ and officers’ insurance carriers to reimburse us for claims submitted; |
| • | loss of revenue associated with the termination of our premium finance business; |
| • | further adjustments to the discount rates used to value the life insurance policies that we own; |
| • | inaccurate estimates regarding the likelihood and magnitude of death benefits related to life insurance policies that we own; |
| • | changes in mortality rates and inaccurate assumptions about life expectancies; |
| • | changes in life expectancy calculation methodologies by third party medical underwriters; |
| • | changes to actuarial life expectancy tables; |
Table of Contents
| • | lack of mortalities of insureds of the life insurance policies that we own; |
| • | increased carrier challenges to the validity of our life insurance policies; |
| • | delays in the receipt of death benefits from our portfolio of life insurance policies; |
| • | costs related to obtaining death benefits from our portfolio of life insurance policies; |
| • | the effect on our financial condition as a result of any lapse of life insurance policies; |
| • | deterioration of the market for life insurance policies and life settlements; |
| • | our inability to re-sell the life insurance policies we own at favorable prices, if at all; |
| • | adverse developments associated with uncooperative co-trustees; |
| • | loss of the services of any of our executive officers; |
| • | adverse court decisions interpreting insurable interest or the obligation of a life insurance carrier to return premiums upon a successful rescission or contest; |
| • | our inability to continue to grow our businesses; |
| • | changes in laws and regulations applicable to premium finance transactions, life settlements or structured settlements; |
| • | increased competition for the acquisition of structured settlements; |
| • | adverse developments in capital markets; |
| • | disruption of our information technology systems; |
| • | our failure to maintain the security of personally identifiable information pertaining to our customers and counterparties; |
| • | regulation of life settlement transactions as securities; |
| • | our limited operating experience; |
| • | refusal by our lender protection insurer to pay claims; |
| • | deterioration in the credit worthiness of the life insurance companies that issue the policies serving as collateral for our premium finance loans; |
| • | increases in premiums on life insurance policies that we own or finance; |
| • | changes in current tax law regarding the treatment of structured settlements; |
| • | our ability to grow our database of structured settlement holders; |
| • | the effects of United States involvement in hostilities with other countries and large-scale acts of terrorism, or the threat of hostilities or terrorist acts; and |
| • | changes in general economic conditions, including inflation, changes in interest or tax rates and other factors. |
See “Risk Factors” for more information. All written and oral forward-looking statements attributable to the Company, or persons acting on its behalf, are expressly qualified in their entirety by these cautionary statements. You should evaluate all forward-looking statements made in this Annual Report on Form 10-K in the context of these risks and uncertainties. The Company cautions you that the important factors referenced above may not contain all of the factors that are important to you.
All statements in this Annual Report on Form 10-K to “Imperial,” “Company,” “we,” “us,” or “our” refer to Imperial Holdings, Inc. and its consolidated subsidiaries unless the context suggests otherwise.
Table of Contents
PART I
Overview
We were founded in December 2006 as a Florida limited liability company and in connection with our initial public offering, on February 3, 2011, Imperial Holdings, Inc. succeeded to the business of Imperial Holdings, LLC and its assets and liabilities.
Imperial Holdings, Inc. (the “Company” or “Imperial”) operates in two reportable business segments: life finance (formerly referred to as premium finance) and structured settlements. In the life finance business, the Company earns revenue/income from changes in the fair value of life insurance policies that the Company acquires and receipt of death benefits with respect to matured life insurance policies it owns, as well as from interest accruing on outstanding loans and loan origination fees recognized over the life of outstanding loans. In the structured settlement business, the Company purchases structured settlement receivables at a discounted rate and sells these receivables to third parties.
In February 2011, the Company completed the sale of 17,602,614 shares of common stock in its initial public offering at a price of $10.75 per share. The Company received net proceeds of approximately $174.2 million after deducting the underwriting discounts and commissions and its offering expenses.
Recent Developments
On September 27, 2011, the Company was informed that it was being investigated by the U.S. Attorney’s Office for the District of New Hampshire (the “USAO Investigation”). At that time, the Company was informed that, among other individuals, its former president and chief operating officer, former general counsel, three former life finance sales executives, two vice presidents and a funding manager were considered “targets” of the USAO Investigation. The USAO Investigation focused on the Company’s premium finance loan business
On February 17, 2012, the Company received a subpoena issued by the staff of the U.S. Securities and Exchange Commission (the “SEC”) seeking documents from 2007 through the present, generally related to the Company’s premium finance business and corresponding financial reporting. The SEC is investigating whether any violations of federal securities laws have occurred and the Company has been cooperating with the SEC regarding this matter. The Company is unable to predict what action, if any, might be taken in the future by the SEC or its staff as a result of the matters that are the subject of the subpoena or what impact, if any, the cost of responding to the subpoena might have on the Company’s financial position, results of operations, or cash flows. The Company has not established any provision for losses in respect of this matter.
On April 30, 2012, the Company entered into a Non-Prosecution Agreement (the “Non-Prosecution Agreement”) with the USAO, which agreed not to prosecute the Company for its involvement in the making of misrepresentations on life insurance applications in connection with its premium finance business or any potential securities fraud claims related to its premium finance business. In the Non-Prosecution Agreement, the USAO and the Company agreed among other things, that the following facts are true and correct: (i) at all relevant times (x) certain insurance companies required that the prospective insured applying for a life insurance policy, and sometimes the agent, disclose information relating to premium financing on applications for life insurance policies, and (y) the questions typically required the prospective insured to disclose if he or she intended to seek premium financing in connection with the policy and sometimes required the agent to disclose if he or she was aware of any such intent on the part of the applicant; (ii) in connection with a portion of the Company’s retail operation known as “retail non-seminar” that began in December 2006 and was discontinued in January 2009, Imperial had a practice of disclosing on applications that the prospective insured was seeking premium financing when the life insurance company allowed premium financing from Imperial; however, in certain circumstances, Imperial internal life agents facilitated and/or made misrepresentations on applications that the prospective insured was not seeking premium financing when the insurance carrier was likely to deny the
1
Table of Contents
policy on the basis of premium financing; and (iii) to the extent that external agents, brokers and insureds caused other misrepresentations to be made in life insurance applications in connection with the retail non-seminar business, Imperial failed to appropriately tailor controls to prevent potential fraudulent practices in that business. As of December 31, 2012, the Company had 12 policies in its portfolio that once served as collateral for premium finance loans derived through the retail non-seminar business.
In connection with the Non-Prosecution Agreement, Imperial voluntarily agreed to terminate its premium finance business, which historically accounted for the majority of the Company’s revenues and terminated certain senior sales staff associated with the premium finance business. Additionally, the Company paid the United States Government $8.0 million, and agreed to cooperate fully with the USAO’s ongoing investigation and to refrain from and self-report any criminal conduct. The Non-Prosecution Agreement has a term of three years until April 30, 2015, but after April 30, 2014 the Company may petition the USAO to forego the final year of the Non-Prosecution Agreement, if we otherwise comply with all of our obligations under the Non-Prosecution Agreement. Should the USAO conclude that Imperial has not abided by its obligations under the Non-Prosecution Agreement, the USAO could choose to terminate the Non-Prosecution Agreement, resume its investigation of the Company, or bring charges against Imperial.
On August 2, 2012, the Board of Directors of the Company appointed Andrew Dakos, Phillip Goldstein and Gerald Hellerman to serve as directors of the Company in connection with a settlement (the “Settlement”) with Opportunity Partners L.P. (“Opportunity”). The Settlement resulted in Opportunity withdrawing its demand for a special meeting of shareholders, which it had submitted to the Company on May 23, 2012 and agreeing to dismiss its lawsuit to compel an annual meeting of shareholders. In connection with the Settlement, Walter Higgins and A. Penn Wyrough resigned from the Board of Directors. On August 14, 2012, Antony Mitchell, the Company’s chief executive officer, resigned as Chairman of the Board (though he continues to serve as a director and as the Company’s chief executive officer) and Mr. Goldstein was elected Chairman. On January 14, 2013, David Buzen resigned from the Board of Directors and on March 12, 2013, Robert Rosenberg informed the Board of Directors that he would not stand for re-election at the Company’s annual meeting of shareholders.
As of December 31, 2012, the Company had approximately $20.3 million of cash, cash equivalents, and marketable securities including $1.2 million in restricted cash. This limited cash position was primarily as a result of the legal and other costs of the defense and investigation of the Company and certain employees in connection with the USAO Investigation, SEC investigation and related shareholder litigation, which required significant, unbudgeted cash outlays. As previously reported in earlier periodic reports filed with the SEC, the Company anticipated a liquidity shortfall in the second quarter of 2013. Accordingly, to avoid lapsing policies, the Company sought additional capital and, on March 27, 2013, Greenwood Asset Portfolio, LLC (“Greenwood”), a subsidiary of the Company, borrowed $45 million in aggregate principal amount under the terms of an eighteen-month bridge facility. The facility was funded by entities affiliated with certain of the Company’s shareholders and is secured by substantially all of the Company’s life insurance policies. Principal was borrowed under the facility at 92% resulting in net proceeds before transaction expenses of $41.4 million. After transaction expenses, up to 25% of the proceeds of the facility may be used by the Company for general corporate purposes, with the balance used by Greenwood to pay premiums on the life insurance policies it owns. Interest under the facility accrues at 12% per annum for nine months and thereafter increases by 600 basis points to 18% per annum for the remainder of the term of the facility. The Company intends to replace this facility, which is pre-payable at par without penalty, and refinance the bridge facility with more permanent capital once it is sourced. There can be no assurance, however, that we will be able to obtain capital on more favorable terms or at all.
Life Finance Business
Overview
Our life finance segment is comprised of our life settlements and our legacy premium finance loan businesses. The Company historically provided premium finance loans for individual life insurance policies and, commencing in 2011, began using its life settlement provider licenses to purchase life insurance policies. In a
2
Table of Contents
premium finance transaction, a life insurance policyholder obtains a loan, usually through an irrevocable life insurance trust established by the insured, to pay insurance premiums for a fixed period of time. A premium finance loan allows a policyholder to maintain coverage under the policy without having to make premium payments during the term of the loan. As described above, on April 30, 2012, the Company voluntarily terminated its premium finance business in connection with the Non-Prosecution Agreement with the USAO. We had effectively suspended originating premium finance loans, however, as of the end of the third quarter of 2011.
The Company takes title to life insurance policies through two separate channels. First, we acquire life insurance policies when a borrower defaults on a premium finance loan originated by us, and we foreclose on the policy. Second, we acquire life insurance policies through purchases directly from the original policy owners (the secondary market) or from institutional investors (the tertiary market). As of December 31, 2012, the Company had obtained the necessary licenses to purchase life insurance policies directly from original policy owners in 25 states. To conserve capital, we only purchased 2 policies in 2012 in an effort to continue to maintain the premium outlays necessary to keep our portfolio of life insurance policies in-force.
During the time period in which we were originating premium finance loans, our typical loan was approximately two years in duration and was collateralized by the underlying life insurance policy. Approximately 75.9% of loans originated were insured by lender protection insurance, which every credit facility that we entered into since December 2007 required us to obtain for each loan originated under such credit facility. This coverage provides insurance on the value of the underlying life insurance policy serving as collateral underlying the loan should our borrower default. Subject to the terms and conditions of the lender protection insurance policy, in the event of a payment default by the borrower, our lender protection insurer has the right to direct control or take beneficial ownership of the life insurance policy and we are paid an amount equal to the insured value of the life insurance policy serving as collateral underlying the loan. The life insurance policies that served as collateral for our premium finance loans were predominately universal life policies that had an average death benefit of approximately $4.8 million and insured persons over age 75. Generally, the borrower was an irrevocable life insurance trust established by the insured, which is both the legal owner and beneficiary of a life insurance policy serving as collateral for a premium finance loan. As used throughout this Annual Report on Form 10-K, references to “borrower” refer to the entity or individual executing the note in a premium finance transaction.
A borrower was not required to make any payment on the premium finance loan until maturity. At the end of the loan term, the borrower either repaid the loan in full (including all interest and fees) or defaulted under the loan. In the event of default, subject to loan terms and conditions, we generally foreclosed on the policy serving as collateral for the loan, and, correspondingly, the borrower typically relinquished control of the policy to us. If we acquired the policy upon a loan default, we either held it for investment, sought to sell the policy, or, if the loan was insured, we were paid an amount equal to the insured value of the policy, which may have been equal to or less than the contractual amount we were owed under the loan. The amounts received in respect of claims were used to repay our lenders from whom, prior to 2011, we borrowed funds to extend premium finance loans to borrowers. As of December 31, 2012, we had 22 premium finance loans outstanding, 5 of which had collateral whose value was insured.
We historically retained for investment a number of the policies that we acquired upon foreclosure and, at December 31, 2012, 171 policies in our life settlement portfolio were previously premium financed. Following our initial public offering, we used equity capital to fund premium finance loans. However, in instances where we retained policies that served as collateral for a loan that was insured, in order to retain the policy on our balance sheet, we would typically be required to pay our lender protection insurer in order for the insurer to release its subrogation rights to the policy. When we choose to retain a policy for investment, we are responsible for all future premium payments required to prevent the policy from lapsing.
Our premium finance borrowers were generally referred to us through independent insurance agents and brokers although, prior to January 2009, we originated some premium finance loans that were sold by life
3
Table of Contents
insurance agents that we employed. In certain of these instances, the life insurance agents employed by the Company worked with external brokers and agents to obtain insurance for policyholders with the Company extending a premium finance loan to a borrower. We refer to these instances as the “retail non-seminar business,” which began in December 2006 and was discontinued in January 2009. In total, the Company originated 114 premium finance loans as part of the retail non-seminar business. As of December 31, 2012, the Company had 12 policies in its portfolio that once served as collateral for premium finance loans derived through the retail non-seminar business.
As of December 31, 2012, the weighted average discount rate used in valuing the policies in our life settlement portfolio was 24.01% and the fair value of our investment in life insurance policies was approximately $113.4 million. The discount rate used in valuing the policies ranged from 14.80% to 33.80%. Our valuation of insurance policies is a critical component of our estimate for the fair value of our investments in life settlements (life insurance policies). We currently use a probabilistic method of valuing life insurance policies, meaning the individual insured’s probability of survival and probability of death are applied to the required premium and net death benefit of the policy to extrapolate the likely cash flows over the life expectancy. These likely cash flows are then discounted using a net present value formula. We believe this to be the preferred valuation method at the present time in the industry. The most significant assumptions that we must make to value a life insurance policy are the appropriate discount rate and life expectancies. Please see “Management’s Discussion and Analysis of Financial Condition and Results of Operations—Critical Accounting Policies,” for a more detailed discussion of how we determine the fair value of life settlements.
Sources of Revenue/Income
For the years ended December 31, 2012, 2011 and 2010, 21.7% , 71.2% and 87.6%, respectively, of our revenue was generated from our life finance segment. We generated revenue/income from this segment in the form of unrealized change in fair value of life settlements, agency fees, interest income, origination fee income, servicing income and gain on maturities of life settlements with subrogation rights, net that we own as follows:
| • | Unrealized Change in Fair Value of Life Settlements—When the Company acquires certain life insurance policies we initially record these investments at the transaction price, which is the fair value of the policy for those acquired upon relinquishment or the amount paid for policies acquired for cash. The fair value of the investment in insurance policies is evaluated at the end of each reporting period. Changes in the fair value of the investment based on evaluations are recorded as unrealized changes in fair value of life settlements in our consolidated statement of operations. During the years ended December 31, 2012, 2011 and 2010, the Company recorded a loss of approximately $5.7 million, a gain of $570,000 and a gain of approximately $10.2 million, respectively on the unrealized changes in fair value of life insurance policies it acquired. |
| • | Gain on Maturities of Life Settlements with Subrogation Rights, net. When the Company exercised its right to foreclose on collateral for loans insured by the Company’s lender protection insurer, the insurer had the right to direct control or take beneficial ownership of the life insurance policy, subject to the terms and conditions of the lender protection insurance policy, including notice and timing requirements. Under these circumstances, the insurer maintained its salvage collection and subrogation rights, which provided a remedy for the insurer to seek to recover the amount of the lender protection claim paid plus premiums paid by it, expenses and interest thereon. In those instances where the Company foreclosed on the collateral, the lender protection insurer has been covering the cost of the ongoing premiums needed to maintain certain of these life insurance policies. However, the lender protection insurer may elect at any time to discontinue the payment of premiums, which would result in the policies lapsing if the Company does not otherwise pay the premiums. Because the lender protection insurer controls whether a policy will lapse, and the amount of the lender protection insurer’s salvage collection and subrogation claim rights on any individual life insurance policy could, and in time will likely, equal or exceed the cash flow received by the Company with respect to any such policy, the Company views these policies as having uncertain value. For these reasons, the |
4
Table of Contents
| Company does not rely on these policies for revenue generation, and these policies are considered contingent assets and not included in the amount of life settlements on the accompanying consolidated balance sheet. The Company accounts for the maturities of life settlements with subrogation rights (net of subrogation expenses) as contingent gains in accordance with ASC 450, Contingencies and recognizes the revenue from the maturities of these policies when all contingencies are resolved. During the year ended December 31, 2012, 2011 and 2010, the Company recognized income of approximately $6.1 million, $3.2 million and $0, respectively, net of subrogation rights in receipt of death benefits with respect to matured life insurance policies. |
| • | Servicing Income. We receive income from servicing life insurance policies controlled by a third party. These services include verifying premiums are paid and correctly applied and updating files for medical history and ongoing premiums. For the year ended December 31, 2012, 2011 and 2010, we earned approximately $1.2 million, $1.8 million and $413,000 in servicing income, respectively. |
| • | Origination Fees. We charged a loan origination fee on each premium finance loan we funded. The origination fee accrues over the term of the loan and is due upon the date of maturity or upon repayment of the loan. During the years ended December 31, 2012, 2011 and 2010, approximately $500,000, $6.5 million and $19.9 million, respectively, of our revenue from our life finance segment was from origination fees. As a result of the voluntary termination of our premium finance business, we will cease accruing origination fee income once our outstanding premium finance loans mature. |
| • | Agency Fees. For each premium finance loan, Imperial Life and Annuity Services, LLC (“Imperial Life and Annuity”), a licensed insurance agency and our wholly-owned subsidiary, received an agency fee from the referring insurance agent. During the years ended December 31, 2012, 2011 and 2010, approximately $0, $6.5 million and $10.1 million, respectively, of our revenue from our life finance segment was from agency fees. As a result of the voluntary termination of our premium finance business, we will not receive any revenue from agency fees and Imperial Life and Annuity has voluntarily surrendered all its insurance agency licenses during the year ended December 31, 2012. |
| • | Interest Income. We record interest income that accrues over the life of the loan and is due upon the date of maturity or upon repayment of the loan. The interest rates are typically floating rates that are calculated at the one-month LIBOR rate plus an applicable margin. In addition, our premium finance loans have a floor interest rate and are capped at 16.0% per annum. For loans with floating rates, each month the interest rate is recalculated to equal one-month LIBOR plus the applicable margin, and then, if necessary, adjusted so as to remain at or above the stated floor rate and at or below the capped rate of 16.0% per annum. The weighted average per annum interest rate for premium finance loans outstanding as of December 31, 2012, 2011 and 2010 were 13.4% , 12.5% and 11.4%, respectively. During the years ended December 31, 2012, 2011 and 2010 approximately $2.0 million, $8.3 million and $18.7 million, respectively, of our revenue from our life finance segment was from interest income. As a result of the voluntary termination of our premium finance business, we will cease earning interest income from this type of loan once our outstanding premium finance loans mature. |
Repayment of Premium Finance Loans
The following table shows the method of repayment for loans maturing during the following periods:
| Year Ended December 31, | ||||||||||||
| 2012 | 2011 | 2010 | ||||||||||
| Repaid by the borrower |
2 | — | 3 | |||||||||
| Repaid from death benefit during term of loan |
— | — | 1 | |||||||||
| Repaid from lender protection insurance claims |
85 | 131 | 419 | |||||||||
|
|
|
|
|
|
|
|||||||
| 87 | 131 | 423 | ||||||||||
5
Table of Contents
Cost of Financing
Every credit facility we entered into since December 2007 for our legacy premium finance business required us to obtain lender protection insurance for each loan originated under such credit facility. This coverage provides insurance on the value of the underlying life insurance policy serving as collateral for the loan should our borrower default. Subject to the terms and conditions of the lender protection insurance policy, in the event of a payment default by the borrower, our lender protection insurer has the right to direct control or take beneficial ownership of the life insurance policy and we are paid an amount equal to the insured value of the life insurance policy serving as collateral for the loan. The cost for lender protection insurance ranged from 8.5% to 11% per annum of the principal balance of the loan. As of December 31, 2012, 22.7% of our outstanding premium finance loans had collateral whose value is insured. After December 31, 2010, we ceased originating premium finance loans with lender protection insurance and began funding loans with our own equity. In connection with the Non-Prosecution Agreement, we have since ceased originating premium finance loans altogether.
On December 24, 2012, we paid off all outstanding amounts under our last remaining premium finance credit facility and accordingly had no debt outstanding as of December 31, 2012 under the credit facilities used in our life finance segment to finance our legacy premium finance operations.
Underwriting Procedures
We considered and analyzed a variety of factors in evaluating each potential premium financing transaction. Our underwriting procedures required that the policyholder provide supporting documentation of the policyholder’s insurable interest in the life of the insured. Our guidelines generally required that every borrower have an existing, in-force, life insurance policy and provide proof of at least one prior premium payment from their own funds prior to our funding of a loan and applicants were generally required to sign an unconditional personal guaranty as to various matters related to the funding of the loan, including as to the accuracy of the information provided in the life insurance policy application, as further support for our underwriting procedures, including our assessment of whether the applicant was engaged in a stranger originated life insurance transaction. In the event of a default under the guaranty, the guarantor guaranteed the payment of all outstanding principal and accrued and unpaid interest under the premium finance loan, any early termination fees, costs and expenses payable (including, but not limited to, reasonable attorneys’ fees) as well as any and all costs and expenses to enforce the guaranty (including, but not limited to, reasonable attorneys’ fees). To date, we have never collected on a personal guaranty. Our premium finance legal group reviewed loan applications and assessed the validity of the applicants’ insurable interest in the life of an insured before a loan was funded.
Servicing
Our servicing department administers all premium payments, loan satisfaction and policy relinquishment processes for policies we own as well as for policies controlled by third parties. They maintain contact with insureds, trustees and referring agents or brokers to obtain current information on policy status. Our servicing department also updates the medical histories of insureds. They periodically request updated medical records from physicians and also contact each insured to obtain updated health information.
With respect to the administration of the policy relinquishment processes, our servicing department sends notices prior to the loan maturity date alerting the borrower that the loan is maturing. In the event of a default, our servicing department will send an agreement to the borrower and its beneficiaries requesting that they agree to relinquish ownership of the policy and all interests therein to us in exchange for a release of the obligation to pay amounts due. If we are unable to come to an agreement with the borrower regarding the relinquishment of the policy, we may enforce our security interests in the beneficial interests in the trust that owns the policy pursuant to which we can exercise control over the trust holding the policy in order to direct its disposition.
6
Table of Contents
Structured Settlements Business
Overview
Structured settlements refer to a contract between a plaintiff and defendant whereby the plaintiff agrees to settle a lawsuit (usually a personal injury, product liability or medical malpractice claim) in exchange for periodic payments over time. A defendant’s payment obligation with respect to a structured settlement is usually assumed by a casualty insurance company. This payment obligation is then satisfied by the casualty insurer through the purchase of an annuity from a highly rated life insurance company, which provides a high credit quality stream of payments to the plaintiff.
Recipients of structured settlements are permitted to sell their deferred payment streams to a structured settlement purchaser pursuant to state statutes that require certain disclosures, notice to the obligors and state court approval. Through such sales, we purchase a certain number of fixed (life contingent or non life-contingent), scheduled future settlement payments on a discounted basis in exchange for a single lump sum payment, thereby serving the liquidity needs of structured settlement holders.
We train our structured settlements purchasing team to work with a prospective client to review the transaction documentation and to assess a client’s needs. Our underwriting group is responsible for reviewing all proposed purchases and analyzing the associated documentation. We have also developed a nationwide network of law firms to facilitate the required court approval process for structured settlements. The average cycle time for transactions closing in the year ended December 31, 2012 starting from submission of the paper work to funding the transaction was 63 days. This cycle includes the evaluation and structuring of the transaction, an economic review, pricing and coordination of the court process.
Marketing
Brand awareness is critical to growing market share. We have a primary target market consisting of individuals 18 to 49 years of age with middle class income or lower.
We primarily market through the internet and television although, in 2012, we significantly reduced our spending on television based marketing in order to conserve capital. Our direct response television campaign consists of nationally placed 15 or 30 second commercials that air during our call center hours on several syndicated and cable networks. Typically, we experience a high volume of calls immediately after we air a television advertisement. Therefore, we attempt to space our advertisements to maintain a steady stream of inbound calls that our purchasing team is able to process. In addition to our direct response television campaign, we buy marketing on internet search engines. These advertisements produce leads with contact information that are routed to our purchasing staff for follow-up. We also send letters monthly to most of the leads in our database containing information about us and our services.
We have built a proprietary database of clients and prospective clients. From December 2006 to December 31, 2012, we have purchased a total of 869 structured settlements from existing customers in repeat transactions. When our call center staff is not answering inbound calls, they call contacts in the database to generate business. As our database and pool of customers grow, we expect to complete more transactions and our cost of marketing per transaction should decrease.
The following table shows the number of transactions we have completed and our average marketing cost per transaction (dollars in thousands):
| Year Ended December 31, | ||||||||||||
| 2012 | 2011 | 2010 | ||||||||||
| Number of transactions originated |
965 | 873 | 565 | |||||||||
| Average marketing cost per transaction |
$ | 5.0 | $ | 7.0 | $ | 9.0 | ||||||
| Average amount paid for settlements purchased |
$ | 25.46 | $ | 23.26 | $ | 23.49 | ||||||
7
Table of Contents
We believe this cost per transaction will continue to trend down over time. Additionally, our transactions with repeat customers are generally more profitable than with new customers due to the reduction in transaction costs. As our database grows, it provides more purchasing opportunities. The following table shows the number and percentage of our total structured settlement transactions completed with repeat customers for the three-month periods indicated:
| Three Months Ended | ||||||||||||||||||||||||||||||||||||||||||||||||||||
| Dec 31 2009 |
Mar 31 2010 |
June 30 2010 |
Sep 30 2010 |
Dec 31 2010 |
Mar 31 2011 |
June 30 2011 |
Sep 30 2011 |
Dec 31 2011 |
Mar 31 2012 |
June 30 2012 |
Sep 30 2012 |
Dec 31 2012 |
||||||||||||||||||||||||||||||||||||||||
| Number of transactions with repeat customers |
20 | 24 | 25 | 49 | 56 | 48 | 92 | 78 | 89 | 70 | 99 | 94 | 70 | |||||||||||||||||||||||||||||||||||||||
| Percentage of total transactions |
17 | % | 22 | % | 18 | % | 34 | % | 31 | % | 30 | % | 38 | % | 37 | % | 35 | % | 29 | % | 38 | % | 37 | % | 35 | % | ||||||||||||||||||||||||||
Funding
We believe that we have various funding options for the purchase of structured settlements.
| • | Origination. We generally originate the purchase of structured settlement receivables and either finance or sell the structured settlements we acquire. In September 2010, we entered into an arrangement to provide us up to $50.0 million to finance the purchase of non-life contingent structured settlements and in December 2012, we entered into a forward purchase and sale agreement to sell up to $40.0 million of life-contingent structured settlement receivables. At December 31, 2012, only $6.8 million and $6.6 million in commitments remained under our $50.0 million and $40.0 million facility respectively. We also have other parties to whom we have sold non-life contingent structured settlement assets and to whom we believe we can sell such assets in the future. |
| • | Balance sheet. When we purchase structured settlements, we may hold them for investment, servicing the asset and collecting the periodic payments or we may finance or sell such assets through our arrangements described above. |
Sources of Revenue
During the years ended December 31, 2012, 2011 and 2010, 72.8%, 27.0% and 12.4%, respectively, of our revenue was generated from our structured settlement segment. Most of our revenue from structured settlements currently is earned from the sale of structured settlements that we originate and mark-to-market adjustments. When we sell assets, the revenue consists of the difference between the sale proceeds and our carrying value. If we retain structured settlements on our balance sheet, we earn interest income over the life of the asset based on the discount rate used to determine the purchase price. During the years ended December 31, 2012, 2011 and 2010, 95.3%, 93.2% and 95.2%, respectively, of our revenue from our structured settlement segment was generated from the sale of structured settlements and mark-to-market adjustments and 2.4%, 4.6% and 3.5%, respectively, was generated from interest income. The following table shows the number of transactions we have
8
Table of Contents
originated, the face value of undiscounted future payments purchased, the weighted average purchase discount rate, the number of transactions sold and the weighted average discount rate at which the assets were sold (dollars in thousands):
| Year Ended December 31, | ||||||||||||
| 2012 | 2011 | 2010 | ||||||||||
| Number of transactions originated |
965 | 873 | 565 | |||||||||
| Face value of undiscounted future payments purchased |
$ | 130,136 | $ | 96,628 | $ | 47,207 | ||||||
| Weighted average purchase discount rate |
18.7 | % | 18.2 | % | 19.4 | % | ||||||
| Number of transactions sold |
939 | 601 | 630 | |||||||||
| Weighted average sale discount rate |
10.6 | % | 10.5 | % | 8.9 | % | ||||||
Underwriting Procedures, Transaction Timeline and Process
We review all proposed structured settlement transactions and analyze the transaction documentation. We identify any statutory requirements, as well as any issues that could affect the structured settlement receivables, such as liens, judgments or bankruptcy filings. We also confirm the existence and value of the structured settlement receivables, that the purchase conforms to our established internal or external counterparty credit guidelines and that all applicable statutory requirements are complied with.
Each structured settlement transaction requires a court order approving the transaction. The individual court hearings are administered by a number of outside attorneys with whom we have developed relationships.
As of December 31, 2012, our typical structured settlement transaction was completed in an average of 63 days from the date of initial contact by the client. The following events would occur during such period:
| • | The individual who has a structured settlement seeks a lump-sum payment based on the settlement. |
| • | After analyzing the settlement structure, we offer to provide a lump-sum amount to the individual in exchange for a set number of payments. |
| • | We complete our underwriting process. Upon satisfactory review, counsel secures a court date and notifies interested parties, including any beneficiaries, owners and issuers of the pending transaction. |
| • | A court hearing is held and the judge approves or denies the motion to sell and assign to us the agreed-upon portion of the individual’s structured settlement. |
| • | Final review of the court-approved transaction takes place and we fund the payment to the individual. |
Business Strategy
While we continue to assess our business strategy in light of our exit from the premium finance business, our current liquidity position, and the obligations we have undertaken in the Non-Prosecution Agreement, our primary objective is to maintain and, ultimately, grow shareholder value. Going forward, we intend to pursue the following strategies:
| • | Source Long-Term Capital. Our portfolio of life insurance policies requires significant cash outlays in order to pay the premiums necessary to keep policies in force. While we believe the bridge facility provides us with sufficient liquidity to continue to fund our portfolio of life insurance policies in the short-term, we will need to source more permanent capital to repay the bridge facility and pay premiums until the portfolio begins to generate sufficient positive cash flows. We intend to continue to diligently monitor our cash position and proactively seek to manage any impending liquidity shortfall, whether by raising additional debt or equity, selling certain of the life insurance policies that we own, further reducing operating expenses, allowing certain life insurance policies that we own with a lower return profile to lapse or a combination of all of the above. |
9
Table of Contents
| • | Maintain and selectively grow our portfolio of life insurance policies. Subject to our cash management needs, we plan to continue to maintain our portfolio of life insurance policies and selectively grow our portfolio. We believe that our ability to value life insurance policies and our licenses to purchase policies directly from insureds positions us well to buy policies at attractive prices. We intend to hold the policies to maturity, though we may occasionally sell policies on the tertiary market as our cash management needs dictate or when the need to re-balance the portfolio or the opportunity for a strategic sale arises. |
| • | Continue to expand structured settlement market presence. We expect to continue to build and enhance our database of structured settlements through a combination of advertising campaigns and targeted marketing efforts. |
Regulation
Life Settlements
The sale and solicitation of life insurance is highly regulated by the laws and regulations of individual states and other applicable jurisdictions. The purchase of a policy directly from a policy owner is referred to as a life settlement and is regulated on a state-by-state basis. At December 31, 2012, we maintained licenses to transact life settlements in 25 of the states that currently require a license and could conduct business in 35 states and the District of Columbia. Our primary regulator is the Florida Office of Insurance Regulation. A majority of the state laws and regulations concerning life settlements are based on the Model Act and Model Regulation adopted by the National Association of Insurance Commissioners (NAIC) and the Model Act adopted by the National Conference of Insurance Legislators (NCOIL). The NAIC and NCOIL models include provisions which relate to: (i) provider and broker licensing requirements; (ii) reporting requirements; (iii) required contract provisions and disclosures; (iv) privacy requirements; (v) fraud prevention measures; (vi) criminal and civil remedies; (vii) marketing requirements; (viii) the time period in which policies cannot be sold in life settlement transactions; and (viii) other rules governing the relationship between policy owners, insured persons, insurer, and others.
Premium Financing Transactions
The making, enforcement and collection of premium finance loans is subject to extensive regulation. These regulations vary widely, but often require that premium finance lenders be licensed by the applicable jurisdiction and that certain disclosures be made to insureds, regulate the amount of late fees and finance charges that may be charged if a borrower is delinquent on its payments, and allow imposition of potentially significant penalties on lenders for violations of that jurisdiction’s insurance premium finance laws. In connection with the Non-Prosecution Agreement, we terminated our premium finance business and we are no longer originating loans that are subject to these regulations.
Structured Settlements
Each structured settlement transaction requires a court order approving the transaction. These “transfer petitions,” as they are known, are brought pursuant to specific, state structured settlement protection acts (SSPAs). These SSPAs vary somewhat but generally require (i) that the seller receive detailed disclosure statements regarding all key transaction terms; (ii) a three to ten day “cooling-off period” before which the seller cannot sign an agreement to sell their structured settlement payments; and (iii) a requirement that the entire transaction be reviewed and approved by a state court judge. The parties to the transaction must satisfy the court that the proposed transfer is in the best interests of the seller, taking into consideration the welfare and support of his dependents. Generally, a seller does not sell the entire amount of his settlement in one transaction. Once an order approving the sale is issued, the payments from the annuity provider are made directly to the purchaser of the structured settlement pursuant to the terms of the order.
10
Table of Contents
The National Association of Settlement Purchasers and the National Structured Settlements Trade Association are the principal structured settlement trade organizations, which have developed and promoted model legislation regarding transfers of settlements, referred to as the Structured Settlement Model Act. While most SSPAs are similar to the Structured Settlement Model Act, any SSPA may place fewer or additional affirmative obligations (such as notice or additional disclosure requirements) on the purchaser, require more extensive or less extensive findings on the part of the court issuing the transfer order, contain additional prohibitions on the actions of the purchaser or the provisions of a settlement purchase agreement, have different effective dates, require shorter or longer notice periods and otherwise vary in substance from the Model Act.
Competition
Life Settlements
Competition in the life settlement space comes through two channels: other life settlement providers and institutional investors. To be a life settlement provider and transact with the original holder of a life insurance policy requires, in most instances, a license on a state-by-state basis. The life settlement business is highly fragmented and, therefore, competition is diverse. Often, life settlement providers are originating on behalf of institutional investors who do not maintain the necessary licenses to transact in the secondary market for life insurance. These investors may have significantly more resources than the Company and can generally also transact directly in the tertiary market.
Structured Settlements
Competition in the structured settlement market is primarily based upon marketing, referrals and quality of customer service. Based on our industry knowledge, we believe that we are one of the larger acquirers of structured settlements in the United States. Our main competitors include J.G. Wentworth & Company, Inc. and Peachtree Settlement Funding, which recently merged but continue to operate in the marketplace as distinct entities.
Employees
At December 31, 2012, we employed 119 full-time employees and no part-time employees. None of our employees is subject to any collective bargaining agreement. We believe that our employee relations are good.
Risk Factors Relating to Our General Business
The Company may not be able to raise long-term capital in a timely manner on favorable terms or at all.
The defense and investigation of the Company and certain employees in connection with the USAO Investigation, SEC investigation and related shareholder litigation has necessitated the expenditure of significant amounts of the Company’s capital. For the year ended December 31, 2012, the Company expensed an aggregate of $22.3 million in legal costs related to these matters and expects to continue to expend significant resources through 2013. The capital expended was not originally budgeted for these purposes. As a result of legal expenses incurred, the Company did not have sufficient resources to acquire additional life insurance policies for its portfolio as originally budgeted for purchase. Further, its cash on hand for the payments of premiums necessary to maintain its portfolio was reduced.
We estimate that we will need to pay $27.7 million in premiums to keep our current portfolio of life insurance policies in force through December 31, 2013 and an additional $26.3 million to keep the portfolio in force through 2014. As of December 31, 2012, we had approximately $20.3 million of cash and cash equivalents, including cash, and marketable securities and anticipated a liquidity shortfall in the second quarter of 2013. Accordingly, to avoid lapsing policies on March 27, 2013, a subsidiary of the Company borrowed $45 million in
11
Table of Contents
aggregate principal amount under an 18-month bridge facility provided by entities affiliated with certain of the Company’s shareholders. While this facility, which is secured by substantially all of the Company’s life insurance policies, should provide the Company with adequate liquidity to pay premiums on its portfolio of life insurance through 2013, the Company will still need to source permanent capital to repay the bridge facility. There can be no assurance, however, that the Company will be able to repay or refinance the bridge facility on favorable terms or at all. If the Company cannot obtain necessary financing to repay the bridge facility, it may need to sell policies that it owns, but there can be no assurance that the Company can consummate any sales or that, if consummated, sales of policies will be at or above their carrying values.
The Company has not settled the shareholder and D&O carrier litigation and resumption of the litigation or the indemnification and advancement obligations that the Company expects to undertake to settle this litigation could have a material adverse affect on the Company’s business, financial condition and results of operations.
On December 18, 2012, attorneys for the Company signed a Term Sheet for Global Settlement Regarding Imperial Holdings, Inc. Matters (the “Term Sheet”). In addition to the Company’s attorneys, the Term Sheet was signed by attorneys representing the plaintiffs in the class action lawsuits and derivative actions instituted against the Company, as well attorneys for the Company’s director and officer liability insurance carriers (“D&O Carriers”), certain individual defendants named in the class actions and the underwriters in the Company’s initial public offering. The Term Sheet sets forth the terms upon which each of the parties represented by the signatories would be willing to settle the class action litigation and derivative actions, as well as the declaratory relief action filed by our primary D&O Carrier, respectively. The Term Sheet is non-binding and subject to certain contingencies. As of the filing of this Annual Report, such settlement agreements have not been executed. While the Company has been and expects to continue to work in good faith with the other parties to execute settlement agreements as soon as is practicable, the Company can give no assurance that the parties will enter into the settlement agreements, that executed settlement agreements will receive the requisite court approvals, or that the Company will not be required to resume the defense of these matters. Protracted litigation, regardless of its outcome, could have a material adverse effect on the Company’s business, financial condition and results of operations.
Additionally and among other things, the term sheet contemplates that the Company will agree to advance the cost of legal expenses and otherwise indemnify certain individuals who would otherwise be entitled to coverage under portions of the Company’s director and officer liability insurance policies, including individuals who have been identified as “targets” of the USAO Investigation. The costs, individually or in the aggregate, of advancing for legal expenses on behalf of these individuals is currently not quantifiable, but could be substantial especially if any such individual is indicted as part of the USAO Investigation. These obligations will likely further strain the Company’s liquidity position and could have a material adverse affect on the Company’s financial position and results of operations.
The SEC Investigation could materially and adversely affect our business, our financial condition and results of operations.
On February 17, 2012, the Company received a subpoena issued by the staff of the SEC seeking documents from 2007 through the present, generally related to the Company’s premium finance business and corresponding financial reporting. The SEC is investigating whether any violations of federal securities laws have occurred and the Company has been cooperating with the SEC regarding this matter. The Company is unable to predict what action, if any, might be taken in the future by the SEC or its staff as a result of the matters that are the subject of the subpoena or what impact, if any, the cost of responding to the subpoena might have on the Company’s financial position, results of operations, or cash flows. The Company has not established any provision for losses in respect of this matter. Additionally, no assurance can be given that the ultimate outcome of the SEC Investigation will not result in administrative, civil or other proceedings or sanctions against the Company or our employees by the SEC or any other state or federal regulatory agencies. Such proceedings may result in the imposition of fines and penalties, actions against the Company or its employees, modifications to business
12
Table of Contents
practices and compliance programs or the imposition of sanctions against the Company. Protracted investigations could also impose substantial costs and distractions, regardless of its outcome. There can be no assurance that any final resolution of this and any similar matters will not have a material and adverse effect on the Company’s financial condition and results of operations.
Negative press from the USAO Investigation, the SEC Investigation and shareholder litigation or otherwise could have a material adverse effect on our business, financial condition and results of operations.
The negative press resulting from the USAO Investigation, SEC Investigation and shareholder litigation matters have harmed the Company’s reputation and could otherwise result in a loss of future business with our counterparties and business partners. It could also adversely affect the public’s perception of us and lead to reluctance by new parties to do business with us. For example, on October 7, 2011, we were informed by a commercial bank that it had decided to end all banking relationships with us. The abrupt termination of our commercial banking relationship resulted in operational difficulties and prevented the Company from transacting with any structured settlement financing counterparty for most of the fourth quarter of 2011. Other business partners and customers have also curtailed their relationships with us. As a result of these actions, we have experienced higher costs of doing business due to less favorable terms and/or the need to find alternative partners. We cannot assure you that additional business partners and customers will not similarly attempt to end or curtail their relationships with us or that potential financing sources will be willing to extend capital to the Company.
In general, the life finance and structured settlement industries periodically receive negative press from the media and consumer advocacy groups and as a result of litigation involving industry participants. A sustained campaign of negative press resulting from media or consumer advocacy groups, industry litigation or other factors could adversely affect the public’s perception of these industries as a whole, and lead to reluctance to sell assets to us or to provide us with third party financing. We also have received negative press from competitors. Any such negative press could have a material adverse effect on our business, financial condition and results of operations.
The USAO Investigation, the SEC Investigation, the shareholder litigation and other factors may make the market price of our stock highly volatile.
The market price of our common stock could fluctuate substantially in the future. This volatility may subject our stock price to material fluctuations due to the factors discussed in this “Risk Factors” section, and other factors including market reaction to the fair market value of our portfolio; rumors or dissemination of false information; changes in coverage or earnings estimates by analysts; our ability to meet analysts’ or market expectations; and sales of common stock by existing stockholders. For example, after the announcement of the USAO Investigation, our stock price dropped significantly.
The loss of any of our key personnel could have a material adverse effect on our business, financial condition and results of operations.
Our success depends to a significant degree upon the continuing contributions of our key executive officers, including Antony Mitchell, our chief executive officer. Mr. Mitchell has significant experience operating businesses in structured settlements and life finance transactions, which are highly regulated industries. If we should lose Mr. Mitchell such loss could have a material adverse effect on our business, financial condition and results of operations. Moreover, we do not maintain key man life insurance with respect to any of our executives.
Contractions in the market for life insurance policies could make it more difficult for us to opportunistically sell policies that we own.
A potential sale of a life insurance policy owned by us depends significantly on the market for life insurance, which may contract or disappear depending on the impact of potential government regulation, future
13
Table of Contents
economic conditions and/or other market variables. The secondary and tertiary markets for life insurance policies incurred a significant slowdown in 2008, which has continued through the present. Historically, many investors who invest in life insurance policies are foreign investors who are attracted by potential investment returns from life insurance policies issued by United States life insurers with high ratings and financial strength as well as by the view that such investments are non-correlated assets—meaning changes in the equity or debt markets should not affect returns on such investments. Changes in the value of the United States dollar and corresponding exchange rates as well as changes to the ratings of United States life insurers can cause foreign investors to suffer a reduction in the value of their United States dollar denominated investments and reduce their demand for such products. Additionally, we believe increased carrier litigation as well as criminal investigations involving the life settlement market, have significantly depleted the investor base. Any of the above factors could result in a further contraction of the market, which could make it more difficult for us to opportunistically sell our life insurance policies.
We compete with a number of other finance companies and may encounter additional competition.
There are a number of finance companies that compete with us. Many are significantly larger and possess considerably greater financial, marketing, management and other resources than we do. The life finance business and structured settlement business could also prove attractive to new entrants. As a consequence, competition in these sectors may increase. In addition, existing competitors may increase their market penetration and purchasing activities in one or more of the sectors in which we participate. Increased competition could result in reduced origination volume, increased acquisition costs, changes to discount rates and/or margin compression, each of which could materially adversely affect our revenue, which would have a material adverse effect on our business, financial condition and results of operations.
Failure to maintain the security of personally identifiable and other information, non-compliance with our contractual or other legal obligations regarding such information, or a violation of the Company’s privacy and security policies with respect to such information, could adversely affect us.
In connection with our business, we collect and retain significant volumes of certain types of personally identifiable and other information pertaining to our customers, and counterparties. The legal, regulatory and contractual environment surrounding information security and privacy is constantly evolving. A significant actual or potential theft, loss, fraudulent use or misuse of customer, counterparty, employee or our data by cybercrime or otherwise, non-compliance with our contractual or other legal obligations regarding such data or a violation of our privacy and security policies with respect to such data could adversely impact our reputation and could result in significant costs, fines, litigation or regulatory action.
We have limited operating experience.
Our business operations began in December 2006 and, in connection with the Non-Prosecution Agreement, we terminated our premium finance business, which had been our primary business since our inception. Consequently, we have limited operating history in both of our business segments generally, and our original business plan may no longer be viable, which makes it difficult to evaluate our business and future prospects. We intend to shift our life finance segment towards increased investment in life settlements. However, since our inception, we have had limited experience managing and dealing in life insurance policies. Therefore, the historical performance of our operations may be of limited relevance in predicting future performance. Furthermore, if we are unable to successfully refocus our life finance segment, our results of operations and financial condition could be materially and adversely affected.
Changes to statutory, licensing and regulatory regimes governing premium financing, life settlements or structured settlements, including the means by which we conduct such business, could have a material adverse effect on our activities and revenues.
Changes to statutory, licensing and regulatory regimes could result in the enforcement of stricter compliance measures or adoption of additional measures on us or on the insurance companies or annuity providers that stand
14
Table of Contents
behind the insurance policies that collateralize our premium finance loans and the structured settlements that we purchase, either of which could have a material adverse impact on our business activities and revenues. Any change to the regulatory regime covering the resale of any of these asset classes, including any change specifically applicable to our activities or to investor eligibility, could restrict our ability to finance, acquire or sell these assets or could lead to significantly increased compliance costs.
In addition, we are subject to various federal and state regulations regarding the solicitation of customers. The Federal Communications Commission and Federal Trade Commission have issued rules that provide for a national “do not call” registry. Under these rules, companies are prohibited from contacting any individual who requests to have his or her phone number added to the registry, except in certain limited instances. In February 2009, we received a citation for violating these rules. In the event we violate these rules in the future, we could be subject to a significant fine per violation or each day of a continuing violation, which could have a material adverse effect on our business, financial condition and results of operations.
Disasters, disruptions and other impairment of our information technologies and systems could adversely affect our business.
Our businesses depend upon the use of sophisticated information technologies and systems, including third-party hosted services and data facilities that we do not control. While we have developed certain disaster recovery plans and backup systems, these plans and systems are not fully redundant. A system disruption caused by a natural disaster, cybercrime or other impairment could have a material adverse effect on our results of operations and may cause delays, loss of critical data and reputational harm, and could otherwise prevent us from servicing our portfolio of life insurance policies or managing our structured settlements business.
Regulation of life settlement transactions as securities under the federal securities laws could lead to increased compliance costs and could adversely affect our ability to acquire or sell life insurance policies.
The SEC issued a task force report in July 2010 recommending that sales of life insurance policies in life settlement transactions be regulated as securities for purposes of the federal securities laws. To date, the SEC has not made such a recommendation to Congress. However, if the statutory definitions of “security” were amended to encompass life settlements, we could become subject to additional extensive regulatory requirements under the federal securities laws, including the obligation to register sales and offerings of life settlements with the SEC as public offerings under the Securities Act of 1933 and, potentially, the obligation to register as an “investment company” pursuant to the Investment Company Act of 1940.
Any legislation implementing such regulatory change or a change in the transactions that are characterized as life settlement transactions could lead to significantly increased compliance costs, increased liability risk and adversely affect our ability to acquire or sell life insurance policies in the future, which could have a material adverse effect on our business, financial condition and results of operations.
Risk Factors Related to Life Finance Transactions
The life insurance policies that we own or that secure our premium finance loans may be subject to contest, rescission and/or non-cooperation by the issuing life insurance company, which may have a material adverse effect on our business, financial condition and results of operations.
All states require that the initial purchaser of a new life insurance policy insuring the life of an individual have an “insurable interest,” meaning a stake in the insured’s health and wellbeing, rather than the insured’s death, in such individual’s life at the time of original issuance of the policy. Whether an insurable interest exists in the context of the purchase of a life insurance policy is critical because, in the absence of a valid insurable interest, life insurance policies are unenforceable under most states’ laws. Where a life insurance policy has been issued to a policyholder without an insurable interest in the life of the individual who is insured, the life insurance company may be able to void or rescind the policy. Even if the insurance company cannot void or
15
Table of Contents
rescind the policy, however, the insurable interest laws of a number of states provide that persons with an insurable interest on the life of the insured may have the right to recover a portion or all of the death benefit payable under a policy from a person who has no insurable interest on the life of the insured. These claims can generally only be brought if the policy was originally issued to a person without an insurable interest in the life of the insured.
Many states have enacted statutes prohibiting stranger-originated life insurance, or STOLI, in which an individual purchases a life insurance policy with the intention of selling it to a third-party investor, who lacks an insurable interest in the insured’s life. Some insurance carriers have contested policies as STOLI arrangements, specifically citing the existence of certain nonrecourse premium financing arrangements as a basis to challenge the validity of the policies used to collateralize the financing. Additionally, if an insurance carrier alleges that there were misrepresentations or fraud in the application process for an insurance policy, they may sue us or others to contest or rescind that policy. If the underlying policy for a premium finance loan we have made or a policy that we own is subject to a successful contestation or rescission, the fair value of the collateral or policy could be reduced to zero and the ability to sell an affected policy could be negatively impaired. Generally, life insurance policies may only be rescinded by the issuing life insurance company within the contestability period, which, in most states is two years. Lack of insurable interest can in some instances form the basis of loss of right to payment under a life insurance policy for many years beyond the contestability period and insurance carriers have been known to challenge claims for death benefits for more than five years from issuance of the policy.
As of December 31, 2012, 18.2%, 63.6%, 90.9% and 100%, respectively, of our premium finance loans outstanding were originated within one month, three months, six months and one year, respectively, of the issuance of the underlying life insurance policy. From time to time, insurance carriers have challenged the validity of a policies owned by us or that once served as the underlying collateral for a premium finance loan made by us. Although, to date, the impact on our business from these challenges has not been significant, the USAO Investigation, the SEC Investigation and the Non-Prosecution Agreement may cause us to experience more challenges to policies by insurers attempting to use such investigations and the Non-Prosecution Agreement as grounds for rescinding or contesting a policy. Any such future challenges to the policies that we own or hold as collateral for our premium finance loans may result in a cloud over title and collectability, increased costs, delays in payment of life insurance proceeds or even the voiding of a policy, and could have a material adverse effect on our business, financial condition and results of operations.
Additionally, if an insurance company successfully rescinds or contests a policy, the insurance company may not be required to refund all or, in some cases, any of the insurance premiums paid for the policy. While defending an action to contest or rescind a policy, premium payments may have to continue to be made to the life insurance company. Additionally, in the case of a policy that serves or served as collateral for a premium finance loan, the issuing insurance company may refuse to cooperate with us by not providing information, processing notices and/or paperwork required to document the transaction. Hence, in the case of a contest or rescission, premiums paid to the carrier (including those paid during the pendency of a contest or rescission action) may not be refunded. If they are not, we may suffer a complete loss with respect to a policy, which may adversely affect our business, financial condition and results of operations.
Premium financed life insurance policies are susceptible to a higher risk of fraud and misrepresentation on life insurance applications, which increases the risk of contest, rescission or non-cooperation by issuing life insurance carriers.
While fraud and misrepresentation by applicants and potential insureds in completing life insurance applications (especially with respect to the health and medical history and condition of the potential insured as well as the applicant’s net worth) exist generally in the life insurance industry, such risk of fraud and misrepresentation is heightened in connection with life insurance policies for which the premiums are financed through premium finance loans. In particular, there is a risk that applicants and potential insureds may not answer truthfully or completely to any questions related to whether the life insurance policy premiums will be financed through a premium finance loan or otherwise, the applicants’ purpose for purchasing the policy or the applicants’
16
Table of Contents
intention regarding the future sale or transfer of the life insurance policy. Such risk may be further increased to the extent life insurance agents communicate to applicants and potential insureds regarding potential premium finance arrangements or transfer of life insurance policies through payment defaults under premium finance loans. In the ordinary course of business, our sales team received inquiries from life insurance agents and brokers regarding the availability of premium finance loans for their clients. However, any communication between the life insurance agent and the potential policyholder or insured is beyond our control and we may not know whether a life insurance agent discussed with the potential policyholder or the insured the possibility of a premium finance loan by us or the subsequent transfer of the life insurance policy. Consequently, notwithstanding the representations and certifications we obtain from the policyholders, insureds and the life insurance agents, there is a risk that we may finance premiums for policies subject to contest or rescission by the insurance carrier based on fraud or misrepresentation in any information provided to the life insurance company, including the life insurance application.
Misrepresentations, fraud, omissions or lack of insurable interest can also, in some instances, form the basis of loss of right to payment under a life insurance. Based on statements made in the Non-Prosecution Agreement, there is a risk that policies underlying our outstanding loans or that we own may increasingly be challenged by insurance carriers. Any such future challenges to the policies that we own or hold as collateral for our premium finance loans may result in increased costs, delays in payment of life insurance proceeds or even the voiding of a policy, a reduction in the fair value of a loan or policy and could have a material adverse effect on our business, financial condition and results of operations.
As of December 31, 2012, of the 214 policies in our life settlement portfolio, 171 policies were previously premium financed. The Company acquired 12 of those life settlements as a result of defaults under premium finance loans originated as part of the retail non-seminar business.
Our success in operating our life finance business is dependent on making accurate assumptions about life expectancies and maintaining adequate cash balances to pay premiums.
If we purchase a life settlement or retain a life insurance policy as a result of a borrower’s default under a premium finance loan, we will be responsible for paying all premiums necessary to keep the policy in force. We estimate that we will need to pay $27.7 million in premiums to keep our current portfolio of life insurance policies in force through 2013 and an additional $26.3 to keep the portfolio in force through 2014. As of December 31, 2012, we had approximately $20.3 million of cash, cash equivalents, and marketable securities including $1.2 million of restricted cash. By using cash reserves to pay premiums for retained life insurance policies, we will have less or no cash available for other business purposes. Therefore, our cash flows and the required amount of our cash reserves to pay premiums will become dependent on our assumptions about life expectancies being accurate.
Life expectancies are estimates of the expected longevity or mortality of an insured and are inherently uncertain. A life expectancy obtained on an insured for a life insurance policy may not be predictive of the future longevity or mortality of the insured. Inaccurate forecasting of an insured’s life expectancy could result from, among other things: (i) advances in medical treatment (e.g., new cancer treatments) resulting in deaths occurring later than forecasted; (ii) inaccurate diagnosis or prognosis; (iii) changes to life style habits or the individual’s ability to fight disease, resulting in improved health; (iv) reliance on outdated or incomplete age or health information about the insured, or on information that is inaccurate (whether or not due to fraud or misrepresentation by the insured); or (v) improper or flawed methodology or assumptions in terms of modeling or crediting of medical conditions. In forecasting estimated life expectancies, we utilize third party medical underwriters to evaluate the medical condition and life expectancy of each insured. The firms that provide health assessments and life expectancy information may depend on, among other things, actuarial tables and model inputs for insureds and third-party information from independent physicians who, in turn, may not have personally performed a physical examination of any of the insureds and may have relied solely on reports provided to them by attending physicians with whom they were authorized to communicate. The accuracy of this information has not been and will not be independently verified by us or our service providers.
17
Table of Contents
As described further in “Management’s Discussion and Analysis of Financial Condition and Results of Operations,” the Company utilizes life expectancy reports from two life expectancy providers, 21st Services, LLC (“21st Services”) and AVS Underwriting LLC (“AVS”). On January 22, 2013, 21st Services announced significant revisions to its underwriting methodology. On February 4, 2013, 21st Services then announced that it was correcting errors discovered in its revised methodology. According to the provider, these revisions have generally been understood to lengthen the average reported life expectancy furnished by 21st Services by 19% and, accordingly, will likely negatively impact the valuation of the Company’s portfolio of life insurance policies. However, the Company has not received life expectancy reports from 21st Services that utilize its revised methodology and the fair value of the Company’s portfolio of life insurance policies at December 31, 2012 does not take into account changes to life expectancy estimates that may result from 21st Services updated methodology. While the Company is still evaluating the general impact that these revisions might have on the value of its portfolio, the Company may determine to cease utilizing, or adjust the weighting of, 21st Services reports as an input into its fair value model in future periods as market practice responds to the adjusted methodology. Additionally, the Company’s other life expectancy provider, AVS Underwriting LLC (“AVS”), filed for federal bankruptcy protection under Chapter 11 on February 12, 2013. The Company cannot, at this time, predict what impact the bankruptcy filing will have on the Company’s ability to procure life expectancy reports from AVS in the future, AVS’s ability to continue its operations or whether other market participants will continue to use AVS life expectancy reports for valuation purposes going forward. As a result of these developments, the Company may need to adjust the application of life expectancy reports in its fair value methodology or source reports from different life expectancy providers in future periods, which could have a material impact on the Company’s fair value calculations.
If life expectancy valuations underestimate the longevity of the insureds, the actual maturity date of the life insurance policies may therefore be longer than projected. Consequently, we may not have sufficient cash for payment of insurance premiums and we may allow the policies to lapse or be forced to sell policies, resulting in a loss of our investment in those policies, or if we continue to fund premium payments, the time period within which we could expect to receive a return of our investment in such life insurance policies may be extended, either of which could have a material adverse effect on our business, financial condition and results of operations.
Additionally, if widely used mortality tables are adjusted, as they were in 2008, to generally assume prolonged life expectancies, the fair value of our portfolio of life insurance policies could be adversely affected, which may have a material adverse effect on our business, operations and financial results. Further, updated life expectancy reports may indicate that an insured’s health has improved since the Company last procured a life expectancy report, which would generally result in a decrease in the fair value of the life insurance policy insuring the life of that insured.
Uncooperative co-trustees may impair the Company’s ability to service its life insurance policies.
In certain instances, change of ownership forms in respect of life insurance policies that the Company has acquired through foreclosures associated with defaulted premium finance loans have not been processed by the applicable insurance carrier and remain in their original trusts. In these instances, although the Company has, among other things, contractual rights entitling it to direct the proceeds of the policies and there is a professional co-trustee authorized to exercise all rights over the policies, it may still need the cooperation of the non-professional co-trustee to obtain information from the insurance carrier necessary to service the policy. Without this information, it is possible that a policy could lapse, as was the case with one policy in the quarter ended September 30, 2012. As a result of this lapse, the Company suffered a complete loss on its investment. While the value of this policy was immaterial, further lapses could have a material adverse affect on the Company’s financial position and results of operations.
18
Table of Contents
The timing of receipt of expected death benefits from our portfolio of life insurance policies could be volatile, which could have a material adverse effect on our cash flows and liquidity.
Timely receipt of expected cash flows from mortalities is necessary in order for us to service our portfolio of life insurance policies and manage our cash balances. Cash flow volatility generally is inversely correlated to the size of a life settlement portfolio, meaning that the more lives in the portfolio, the less cash flow volatility. We have terminated our premium finance business and also have significantly reduced our purchases of life insurance policies. As a result, our portfolio is smaller than previously anticipated and thus subject to more volatility than we had previously anticipated, which may have a material adverse effect on our business, financial condition and results of operation.
Delays in payment and non-payment of life insurance policy proceeds can occur for many reasons and any such delays may have a material adverse effect on our business, financial condition and results of operations.
A number of arguments may be made by former beneficiaries (including but not limited to spouses, ex-spouses and descendants of the insured) under a life insurance policy, by the beneficiaries of the trust holding the policy, by the estate or legal heirs of the insured or by the insurance company issuing such policy, to deny or delay payment of proceeds following the death of an insured, including arguments related to lack of mental capacity of the insured, contestability or suicide provisions in a policy. In addition, the insurable interest and life settlement laws of certain states may prevent or delay the liquidation of the life insurance policy serving as collateral for a loan. The statements in the Non-Prosecution Agreement may make such delays more likely and may increase carrier challenges to paying out death claims. Furthermore, if the death of an insured cannot be verified and no death certificate can be produced, the related insurance company may not pay the proceeds of the life insurance policy until the passage of a statutory period (usually five to seven years) for the presumption of death without proof. Such delays in payment or non-payment of policy proceeds may have a material adverse effect on our business, financial condition and results of operations.
Our Life Finance segment is highly regulated; changes in regulation, the USAO Investigation and the SEC Investigation could materially adversely affect our ability to conduct our business.
Our Life Finance segment is highly regulated. Generally, as a condition to the issuance of licenses held by the Company’s subsidiaries in the Life Finance segment, we and/or our licensed subsidiaries submit to potential state regulatory examinations. Our life settlement provider subsidiary is still undergoing an examination by the Florida Office of Insurance Regulation that was initiated after we became aware of the USAO Investigation. To the extent that other state insurance or other regulators initiate their own investigations as a result of the USAO Investigation, the SEC Investigation, or the Florida Office of Insurance Regulation or such other regulators take other action such as imposing fines or rescinding our license in response thereto, our ability to conduct the businesses comprising our life finance segment may be materially and adversely affected, which could have a material adverse effect on our business, results of operations and financial condition.
Some life insurance companies are opposed to the financing of life insurance policies.
Some life insurance companies and their trade associations have voiced concerns about the life settlement and premium finance industries generally and the transfer of life insurance policies to investors. These life insurance companies may oppose the transfer of a policy to, or honoring of a life insurance policy held by, third parties unrelated to the original insured/owner, especially when they may believe the premiums for such life insurance policies might have been financed, directly or indirectly, by investors that lacked an insurable interest in the continuing life of the insured. If the life insurance companies seek to contest or rescind life insurance policies acquired by us based on such aversion to the financing of life insurance policies, we may experience a substantial loss with respect to the related premium finance loans and the underlying life insurance policies, which could have a material adverse effect on our business, financial condition and results of operations. These life insurance companies and their trade associations may also seek additional state and federal regulation of the
19
Table of Contents
life settlement and premium finance industries. If additional life settlement regulations were adopted, we may experience material adverse effects on our business, financial condition and results of operations.
Uncertainty in valuing the life insurance policies we own or that collateralize our premium finance loans can affect the fair value of the life insurance policies. If the fair value of the life insurance policies decreases, we will incur losses with respect to the policies we own, and losses with respect to our premium finance loans if the fair value of the collateral is less than the carrying value of the loan.
We evaluate all of our premium finance loans for impairment, on a monthly basis, based on the fair value of the underlying life insurance policies, as the collectability is primarily dependent on the fair value of the policy serving as collateral. For loans without lender protection insurance, the fair value of the policy is determined using our valuation model, which is a Level 3 fair value measurement. See “Management’s Discussion and Analysis of Financial Condition and Results of Operations—Critical Accounting Policies—Fair Value Measurement Guidance.” For loans with lender protection insurance, the insured value is also considered when determining the fair value of the life insurance policy. The lender protection insurer limits the amount of coverage to an amount equal to or less than its determination of the value of the life insurance policy underlying our premium finance loan based on the lender protection insurer’s own models and assumptions. For all loans, the amount of impairment, if any, is calculated as the difference in the fair value of the life insurance policy and the carrying value of the loan. A loan impairment valuation is established as losses on our loans are estimated and charged to the provision for losses on loans receivable, and the provision is charged to earnings. Once established, the loan impairment valuation cannot be reversed to earnings.
A large portion of our borrowers may default by not paying off the loan and relinquish ownership of the life insurance policy to us in exchange for our release of the underlying loan. When we obtain ownership of a life insurance policy, either by purchasing the policy on the secondary or tertiary markets or when one of our premium finance borrowers defaults, we record the investment in the policy as an investment in life settlements at fair value as of the date of relinquishment. At the end of each reporting period, we re-value the life insurance policies we own. To the extent that the calculation results in an adjustment to the fair value of the policy, we record this as a unrealized change in fair value of our investment in life insurance policies. This evaluation of the fair value of life insurance policies is inherently subjective as it requires estimates and assumptions that are susceptible to significant revision as more information becomes available. Using our valuation model, we determine the fair value of life insurance policies on a discounted cash flow basis. The most significant assumptions that we estimate are the life expectancy of the insured, expected premium payments and the discount rate. The discount rate is based upon current information about market interest rates, the credit exposure to the insurance company that issued the life insurance policy and our estimate of the risk margin an investor in the policy would require. We estimate the life expectancy of an insured by analyzing medical reviews from third-party medical underwriters, who evaluate the health of the insured by examining the insured’s historical and current medical records. We then calculate a mortality impairment factor for the insured as that factor which, when applied to our mortality table, reproduces the same life expectancy for that insured. We use the resulting mortality impairment factor to generate a series of probabilistic future cash flows for the policy, which we then discount and aggregate to arrive at the fair value of the policy. If we are unable to accurately estimate any of these factors, or if the actuarial tables are revised (as they were in 2008), we may have to write down the fair value of our investments in life settlements, which could materially and adversely affect our results of operations and our financial condition.
Insurable interest concerns regarding a life insurance policy can also adversely impact its fair value. A claim or the perceived potential for a claim for rescission or a challenge to insurable interest by an insurance company or by persons with an insurable interest in the insured of a portion of or all of the policy death benefit can negatively impact the fair value of a life insurance policy. If the USAO Investigation, SEC Investigation or Non-Prosecution Agreement cause us to experience more challenges to life insurance than we otherwise would experience, those challenges could negatively impact the fair value of the life insurance policies that we own.
20
Table of Contents
If the calculation of fair value results in a decrease in value, we record this reduction as a loss. As and when loan impairment valuations are established due to the decline in the fair value of the policies collateralizing our loans, our net income will be reduced by the amount of such impairment valuations in the period in which the valuations are established. If we determine that it is appropriate to increase the discount rate further or adjust other inputs to our fair value model further, if we are otherwise unable to accurately estimate the assumptions in our valuation model, or if other factors cause the fair value of our life insurance policies to decrease, the carrying value of our assets may be materially adversely affected and may materially and adversely effect our business, financial condition and results of operations.
If a regulator or court decides that trusts that are formed to own many of the life insurance policies that serve as collateral for our premium finance loans do not have an insurable interest in the life of the insured, such determination could have a material adverse effect on our business, financial condition and results of operations.
Generally, there are two forms of insurable interests in the life of an individual, familial and financial. Additionally, an individual is deemed to have an insurable interest in his or her own life. It is also a common practice for an individual, as a grantor or settlor, to form an irrevocable trust to purchase and own a life insurance policy insuring the life of the grantor or settlor, where the beneficiaries of the trust are persons who themselves, by virtue of certain familial relationships with the grantor or settlor, also have an insurable interest in the life of the insured. In the event of a payment default on our premium finance loan, we will generally acquire life insurance policies owned by trusts (or the beneficial interests in the trust itself) that we believe had an insurable interest in the life of the related insureds. However, a state insurance regulatory authority or a court may determine that the trust or policy owner does not have an insurable interest in the life of the insured or that we, as lender, only have a limited insurable interest, which may be less than the amounts due to us. Any such determination could result in our being unable to receive the proceeds of the life insurance policy, which could lead to a total loss of all amounts loaned in the premium finance transaction or a total loss on our investment in life settlements. Any such loss or losses could have a material adverse effect on our business, financial condition and results of operations.
Bankruptcy of the insured, a beneficiary of the trust owning the life insurance policy or the trust itself could prevent a claim under our lender protection insurance policy.
In many instances, individuals establish an irrevocable trust to hold and own their life insurance policy for estate planning reasons. The majority of the premium finance borrowers are trusts owning life insurance policies. A bankruptcy of the insured, a bankruptcy of a beneficiary of a trust owning the life insurance policy or a bankruptcy of the trust itself could prevent us from acquiring the life insurance policy following an event of default under the related premium finance loan, unless consent of the applicable bankruptcy court is obtained or it is determined that the automatic stay generally arising following a bankruptcy filing is not applicable.
Our lender protection insurance policies have significant exclusions and limitations.
As of December 31, 2012, we had 5 loans outstanding that were covered by our lender protection insurance. Coverage under our lender protection insurance policies is not comprehensive and each of these policies is subject to significant exclusions, limitations and coverage gaps. In the event that any of the exclusions or limitations to coverage set forth in the lender protection insurance policies are applicable or there is a coverage gap, there will be no coverage for any losses we may suffer, which would have a material adverse effect on our business, financial condition and results of operations. The coverage exclusions include, but are not limited to:
| • | the lapse of the related life insurance policy due to the failure to pay sufficient premiums during the term of the applicable premium finance loan; |
| • | certain losses relating to situations where the life insured has died and there has been a bankruptcy or insolvency of the life insurance company that issued the applicable policy; |
21
Table of Contents
| • | any loss caused by our fraudulent, illegal, criminal, malicious or grossly negligent acts; |
| • | a surrender of the related life insurance policy to the issuing life insurance carrier or the sale of such policy or the beneficial interest therein, in each case without the prior written consent of the lender protection insurer; |
| • | our failure to timely obtain necessary rights, free and clear of any lien or encumbrance, with respect to the applicable life insurance policy as required under the lender protection insurance policy; |
| • | our failure to timely submit a properly completed proof of loss certificate to the lender protection insurance policy insurer; |
| • | our failure to timely notify the lender protection insurance policy insurer of: |
| • | the occurrence of certain prohibited acts, as described in the lender protection insurance policy, or |
| • | material non-compliance of the related loan with applicable laws, in each case after obtaining actual knowledge of such events; |
| • | our making of a claim under the lender protection insurance policy knowing the same to be fraudulent; or |
| • | the related life insurance policy being contested prior to the effective date of the related coverage certificate issued under the lender protection insurance policy and we have actual knowledge of such contest. |
While we do not believe the conduct outlined in the Non-Prosecution Agreement resulted in a violation of the terms of any of our lender protection insurance policies, following the announcement of the USAO Investigation and entry into the Non-Prosecution Agreement, our lender protection insurer communicated to the Company that it was reserving its rights under our various lender protection insurance policies.
Failure to perfect a security interest in the underlying life insurance policy or the beneficial interests therein could result in our interest being subordinated to other creditors.
Payment by the related premium finance loan borrower of amounts owed pursuant to each loan is secured by the underlying life insurance policy or by the beneficial interests in a trust established to hold the insurance policy. If we fail to perfect a security interest in such policy or beneficial interests, our interest in such policy or beneficial interests may be subordinated to those of other parties, including, in the event of a bankruptcy or insolvency, a bankruptcy trustee, receiver or conservator.
We are dependent on the creditworthiness of the life insurance companies that issue the policies serving as collateral for our premium finance loans. If a life insurance company defaults on its obligation to pay death benefits on a policy we own, we would experience a loss of our investment, which could have a material adverse effect on our business, financial condition and results of operations.
We are dependent on the creditworthiness of the life insurance companies that issue the policies that we own or that serve as collateral for our premium finance loans. We assume the credit risk associated with life insurance policies issued by various life insurance companies. Furthermore, there is a concentration of life insurance companies that issue the policies that we own or that serve as collateral for our premium finance loans. Approximately 23% of the policies that we owned as of December 31, 2012 were secured by life insurance policies issued by four life insurance companies. The failure or bankruptcy of any such life insurance company or annuity company could have a material adverse impact on our financial condition and results of operation. A life insurance company’s business tends to track general economic and market conditions that are beyond its control, including extended economic recessions or interest rate changes. Changes in investor perceptions regarding the strength of insurers generally and the policies or annuities they offer can adversely affect our ability to sell or finance our assets. Adverse economic factors and volatility in the financial markets may have a material adverse effect on a life insurance company’s business and credit rating, financial condition and operating results, and an
22
Table of Contents
issuing life insurance company may default on its obligation to pay death benefits on the life insurance policies that we own or that serve as collateral for our premium finance loans. In such event, we would experience a loss of our investment in such life insurance policies, which could have a material adverse effect on our business, financial condition and results of operations.
If a life insurance company is able to increase the premiums due on life insurance policies that we own or finance, it will adversely affect our returns on such life insurance policies.
To keep the life insurance policies that we own or finance in force, insurance premiums due must be timely paid. If a life insurance company is able to increase the cost of insurance charged for any of the life insurance policies that we own or finance, the amounts required to be paid for insurance premiums due for these life insurance policies may increase, requiring us to incur additional costs for the life insurance policies, which may adversely affect returns on such life insurance policies and consequently reduce the secondary market value of such life insurance policies. Failure to pay premiums on the life insurance policies when due will result in termination or “lapse” of the life insurance policies. The insurer may in a “lapse” situation view reinstatement of a life insurance policy as tantamount to the issuance of a new life insurance policy and may require the current owner to have an insurable interest in the life of the insured as of the date of the reinstatement. In such event, we would experience a loss of our investment in such life insurance policy.
Risk Factors Related to Structured Settlements
We are dependent on third parties to purchase our structured settlements. Any inability to sell structured settlements or, in the alternative, to access additional capital to purchase structured settlements, may have a material adverse effect on our ability to grow our business, our financial condition and results of operations.
We are dependent on third parties to purchase our structured settlements. Our ability to grow our business depends upon our ability to sell our structured settlements at favorable discount rates and to establish alternative financing arrangements.
We may not be able to continue to sell our structured settlements to third parties at favorable discount rates or obtain financing through borrowings or other means on acceptable terms to satisfy our cash requirements. We were unable to obtain such financing through most of the fourth quarter of 2011. Any future inability to obtain financing or the unavailability of third party purchasers could have a material adverse effect on our future ability to grow our business.
Any change in current tax law could have a material adverse effect on our business, financial condition and results of operations.
The use of structured settlements is largely the result of the favorable federal income tax treatment of such transactions. In 1979, the Internal Revenue Service issued revenue rulings that the income tax exclusion of personal injury settlements applied to related periodic payments. Thus, claimants receiving installment payments as compensation for a personal injury were exempt from all federal income taxation, provided certain conditions were met. This ruling, and its subsequent codification into federal tax law in 1982, resulted in the proliferation of structured settlements as a means of settling personal injury lawsuits. Changes to tax policies that eliminate this exemption of structured settlements from federal taxation could have a material adverse effect on our future profitability. If the tax treatment for structured settlements were changed adversely by a statutory change or a change in interpretation, the dollar volume of structured settlements could be reduced significantly, which would also reduce the level of our structured settlement business. In addition, if there were a change in the federal tax code that would result in adverse tax consequences for the assignment or transfer of structured settlements, such change could have a material adverse effect on our business, financial condition and results of operations.
23
Table of Contents
Fluctuations in discount rates or interest rates may decrease our yield on structured settlement transactions.
Our profitability is directly affected by levels of and fluctuations in interest rates. Such profitability is largely determined by the difference between the discount rate at which we purchase the structured settlements and the discount rate at which we can resell these assets or the interest rate at which we can finance those assets. We may not be able to continue to purchase structured settlements at current or historical discount rates. Structured settlements are purchased at effective yields which are fixed, while rates at which structured settlements are sold, with the exception of forward purchase arrangements, are generally a function of the prevailing market rates for short-term borrowings. As a result, decreases in the discount rate at which we purchase structured settlements or increases in prevailing market interest rates after structured settlements are acquired could have a material adverse effect on our yield on structured settlement transactions, which could have a material adverse effect on our business, financial condition and results of operations.
The insolvency of a holder of a structured settlement could have an adverse effect on our business, financial condition and results of operations.
Our rights to scheduled payments in structured settlement transactions will be adversely affected if any holder of a structured settlement, the special purpose vehicle to which an insurance company assigns its obligations to make payments under the settlement (the “Assumption Party”) or the annuity provider becomes insolvent and/or becomes a debtor in a case under the Bankruptcy Code.
If a holder of a structured settlement were to become a debtor in a case under the Bankruptcy Code, a court could hold that the scheduled payments transferred by the holder under the applicable settlement purchase agreement would not constitute property of the estate of the claimant under the Bankruptcy Code. If, however, a trustee in bankruptcy or other receiver were to assert a contrary position, such as by requiring us (or any securitization vehicle) to establish our right to those payments under federal bankruptcy law or by persuading courts to recharacterize the transaction as secured loans, such result could have a material adverse effect on our business. If the rights to receive the scheduled payments are deemed to be property of the bankruptcy estate of the claimant, the trustee may be able to avoid assignment of the receivable to us.
Furthermore, a general creditor or representative of the creditors (such as a trustee in bankruptcy) of an Assumption Party could make the argument that the payments due from the annuity provider are the property of the estate of such Assumption Party (as the named owner thereof). To the extent that a court would accept this argument, the resulting delays or reductions in payments on our receivables could have a material adverse effect on our business, financial condition and results of operations.
If the identities of structured settlement holders become readily available, it could have an adverse effect on our structured settlement business, financial condition and results of operations.
Brand awareness is critical to growing market share. We expect to continue to build and enhance our database of structured settlements through a combination of commercial and internet advertising campaigns and targeted marketing efforts. If the identities of structured settlement holders in our database were to become readily available to our competitors or to the general public, we could face increased competition and the value of our proprietary database would be diminished, which would have a negative effect on our structured settlement business, financial condition and results of operations.
Adverse judicial developments could have an adverse effect on our business, financial condition and results of operation.
Adverse judicial developments have occasionally occurred in the structured settlement industry, especially with regard to anti-assignment concerns and issues associated with non-disclosure of material facts and associated misconduct. For example, in the 2008 case of 321 Henderson Receivables, LLC v. Tomahawk, the
24
Table of Contents
California County Superior Court (Fresno County, Case No. 08CECG00797—July 2008 Order (unreported)) ruled that (i) certain structured settlement sales were barred by anti-assignment provisions in the settlement documents, (ii) the transfers were loans, not sales, that violated California’s usury laws and (iii) for similar reasons numerous other court-approved structured settlement sales may be void. Although the Tomahawk decision was subsequently reversed by the California Court of Appeal, the Superior Court decision had a negative effect on the structured settlement industry by casting doubt on the ability of a structured settlement recipient to sell portions of the payment streams. Any similar adverse judicial developments calling into doubt such laws and regulations could materially and adversely affect our investments in structured settlements.
Risk Factors Relating to Our Common Stock
Provisions in our executive officers’ employment agreements could impede an attempt to replace or remove our directors or otherwise effect a change of control, which could diminish the price of our common stock.
We have entered into employment agreements with certain of our executive officers. The agreement for our chief executive officer provides for substantial payments upon the occurrence of certain triggering events, including a material diminution of his base salary or responsibilities. These payments are equal to three times the sum of his base salary and the average of the three years’ annual cash bonus, unless the triggering event occurs during the first three years of their respective employment agreements, in which case the payments are equal to six times base salary. These payments may deter any transaction that would result in a change in control, which could diminish the price of our common stock.
Provisions in our articles of incorporation and bylaws could impede an attempt to replace or remove our directors or otherwise effect a change of control, which could diminish the price of our common stock.
Our articles of incorporation and bylaws contain provisions that may entrench directors and make it more difficult for shareholders to replace directors even if the shareholders consider it beneficial to do so. In particular, shareholders are required to provide us with advance notice of shareholder nominations and proposals to be brought before any annual meeting of shareholders, which could discourage or deter a third party from conducting a solicitation of proxies to elect its own slate of directors or to introduce a proposal. In addition, our articles of incorporation eliminate our shareholders’ ability to act without a meeting and require the holders of not less than 50% of the voting power of our common stock to call a special meeting of shareholders.
These provisions could delay or prevent a change of control that a shareholder might consider favorable. For example, these provisions may prevent a shareholder from receiving the benefit from any premium over the market price of our common stock offered by a bidder in a potential takeover. Even in the absence of an attempt to effect a change in management or a takeover attempt, these provisions may adversely affect the prevailing market price of our common stock if they are viewed as discouraging changes in management and takeover attempts in the future. Furthermore, our articles of incorporation and our bylaws provide that the number of directors shall be fixed from time to time by our board of directors, provided that the board shall consist of at least three and no more than fifteen members.
Certain laws of the State of Florida could impede a change of control, which could diminish the price of our common stock.
As a Florida corporation, we are subject to the Florida Business Corporation Act, which provides that a person who acquires shares in an “issuing public corporation,” as defined in the statute, in excess of certain specified thresholds generally will not have any voting rights with respect to such shares unless such voting rights are approved by the holders of a majority of the votes of each class of securities entitled to vote separately, excluding shares held or controlled by the acquiring person. The Florida Business Corporation Act also contains a statute which provides that an affiliated transaction with an interested shareholder generally must be approved
25
Table of Contents
by (i) the affirmative vote of the holders of two thirds of our voting shares, other than the shares beneficially owned by the interested shareholder, or (ii) a majority of the disinterested directors.
One of our subsidiaries, Imperial Life Settlements, LLC, a Delaware limited liability company, is licensed as a viatical settlement provider and is regulated by the Florida Office of Insurance Regulation. As a Florida viatical settlement provider, Imperial Life Settlements, LLC is subject to regulation as a specialty insurer under certain provisions of the Florida Insurance Code. Under applicable Florida law, no person can finally acquire, directly or indirectly, 10% or more of the voting securities of a viatical settlement provider or its controlling company without the written approval of the Florida Office of Insurance Regulation. Accordingly, any person who acquires beneficial ownership of 10% or more of our voting securities will be required by law to notify the Florida Office of Insurance Regulation no later than five days after any form of tender offer or exchange offer is proposed, or no later than five days after the acquisition of securities or ownership interest if no tender offer or exchange offer is involved. Such person will also be required to file with the Florida Office of Insurance Regulation an application for approval of the acquisition no later than 30 days after the same date that triggers the 5-day notice requirement.
The Florida Office of Insurance Regulation may disapprove the acquisition of 10% or more of our voting securities by any person who refuses to apply for and obtain regulatory approval of such acquisition. In addition, if the Florida Office of Insurance Regulation determines that any person has acquired 10% or more of our voting securities without obtaining its regulatory approval, it may order that person to cease the acquisition and divest itself of any shares of our voting securities which may have been acquired in violation of the applicable Florida law. Due to the requirement to file an application with and obtain approval from the Florida Office of Insurance Regulation, purchasers of 10% or more of our voting securities may incur additional expenses in connection with preparing, filing and obtaining approval of the application, and the effectiveness of the acquisition will be delayed pending receipt of approval from the Florida Office of Insurance Regulation.
The Florida Office of Insurance Regulation may also take disciplinary action against Imperial Life Settlements, LLC’s license if it finds that an acquisition of our voting securities is made in violation of the applicable Florida law and would render the further transaction of business hazardous to our customers, creditors, shareholders or the public.
| Item 1B. | Unresolved Staff Comments |
None.
| Item 2. | Properties |
Our principal executive offices are located at 701 Park of Commerce Boulevard, Boca Raton, Florida 33487 and consist of approximately 21,000 square feet of leased office space. We consider our facilities to be adequate for our current operations.
| Item 3. | Legal Proceedings |
Litigation
The SEC Investigation
We are subject to an investigation by the SEC. We received a subpoena issued by the staff of the SEC on February 17, 2012, seeking documents from 2007 through the present that are generally related to the Company’s premium finance business and corresponding financial reporting. The SEC is investigating whether any violations of federal securities laws have occurred and the Company is cooperating with the SEC regarding this matter. The Company is unable to predict the outcome of the SEC Investigation or estimate the amount of any
26
Table of Contents
possible sanction, which could include a fine, penalty, or court order prohibiting specific conduct, any of which could be material. No provision for losses has been recorded for this exposure.
Class Action Litigation, Derivative Demands and the Insurance Coverage Declaratory Relief Complaint
The Class Action Litigation
Initially on September 29, 2011, the Company, and certain of its officers and directors were named as defendants in a putative securities class action filed in the Circuit Court of the 15th Judicial Circuit in and for Palm Beach County, Florida, entitled Martin J. Fuller v. Imperial Holdings, Inc. et al. Also named as defendants were the underwriters of the Company’s initial public offering. That complaint asserted claims under Sections 11, 12 and 15 of the Securities Act of 1933, as amended, alleging that the Company should have but failed to disclose in the registration statement for its initial public offering purported wrongful conduct relating to its life finance business which gave rise to the USAO Investigation. On October 21, 2011, an amended complaint was filed that asserts claims under Sections 11, 12 and 15 of the Securities Act of 1933, based on similar allegations. On October 25, 2011, defendants removed the case to the United States District Court for the Southern District of Florida.
On October 31, 2011, another putative class action case was filed in the Circuit Court of the 15th Judicial Circuit in and for Palm Beach County, Florida, entitled City of Roseville Employees Retirement System v. Imperial Holdings, et al, naming the same defendants and also bringing claims under Sections 11, 12 and 15 of the Securities Act based on similar allegations. On November 28, 2011, defendants removed the case to the United States District Court for the Southern District of Florida. The plaintiffs in the Fuller and City of Roseville cases moved to remand their cases back to state court. Those motions were fully briefed and argued.
On November 18, 2011, a putative class action case was filed in the United States District Court for the Southern District of Florida, entitled Sauer v. Imperial Holdings, Inc., et al, naming the same defendants and bringing claims under Sections 11 and 15 of the Securities Act of 1933 based on similar allegations.
On December 14, 2011, another putative class action case filed in United States District Court for the Southern District of Florida, entitled Pondick v. Imperial Holdings, Inc., et al., naming the same defendants and bringing claims under Sections 11, 12, and 15 of the Securities Act of 1933 based on similar allegations.
On February 24, 2012, the four putative class actions were consolidated and designated: Fuller v. Imperial Holdings et al. in the United States District Court for the Southern District of Florida, and lead plaintiffs were appointed.
In addition, the underwriters of the Company’s initial public offering have asserted that the Company is required by its Underwriting Agreement to indemnify the underwriters’ expenses and potential liabilities in connection with the litigation.
The Insurance Coverage Declaratory Relief Complaint
On June 13, 2012, Catlin Insurance Company (UK) Ltd. (“Catlin”) filed a declaratory relief action against the Company in the United States District Court for the Southern District of Florida. The complaint seeks a determination that there is no coverage under Catlin’s primary Directors, Officers and Company Liability Policy (the “Policy”) issued to the Company for the period February 3, 2012 to February 3, 2012, based on a prior and pending litigation exclusion (the “Exclusion”). Catlin also seeks a determination that it is entitled to reimbursement of the approximately $0.8 million in defense costs and fees advanced to the Company in the first quarter of 2012 under the Policy if it is determined that the Exclusion precludes coverage. As of the filing of this Annual Report on Form 10-K, the Company has not yet been served with the complaint.
Derivative Damands
On November 16, 2011, the Company’s Board of Directors received a shareholder derivative demand from Harry Rothenberg (the “Rothenberg Demand”), which was referred to the special committee for a thorough
27
Table of Contents
investigation of the issues, occurrences and facts relating to, connected to, and arising from the USAO Investigation referenced in the Rothenberg Demand. On May 8, 2012, the Company’s Board of Directors received a derivative demand made by another shareholder, Robert Andrzejczyk (the “Andrzejczyk Demand”). The Andrzejczyk Demand, like the Rothenberg Demand was referred to the special committee, which determined that it did not contain any allegations that differed materially from those alleged in the Rothenberg Demand. On July 20, 2012, the Company (as nominal defendant) and certain of the Company’s officers, directors, and a former director were named as defendants in a shareholder derivative action filed in the Circuit Court of the 15th Judicial Circuit in and for Palm Beach County, Florida, entitled Robert Andrzejczyk v. Imperial Holdings, Inc. et al. The complaint alleges, among other things, that the Special Committee’s refusal of the Andrzejczyk Demand was improper.
The Proposed Settlement
On December 18, 2012, attorneys for the Company signed a Term Sheet for Global Settlement Regarding Imperial Holdings, Inc. Matters (the “Term Sheet”) setting forth the terms upon which each of the parties to the matters described in “Class Action Litigation, Derivative Demands and the Insurance Coverage Declaratory Relief Complaint” would be willing to settle the class action litigation and derivative actions as well as the declaratory relief action filed by Catlin, respectively. In addition to the Company’s attorneys, the Term Sheet was signed by attorneys representing the plaintiffs in the class action lawsuits and derivative actions instituted against the Company as well attorneys for the Company’s director and officer liability insurance carriers (“D&O Carriers”), certain individual defendants named in the class actions and the underwriters in the Company’s initial public offering.
While non-binding and subject to certain contingencies, the Term Sheet provides that each of the parties will endeavor to enter into definitive settlement agreements in respect of the class action litigation, derivative action and insurance coverage declaratory relief complaint. Although definitive settlement agreements have not been executed as of the filing of this Annual Report on Form 10-K, the Company does expect to continue to work in good faith with the other parties to the Term Sheet to execute settlement agreements as soon as is practicable.
The terms of the class action settlement include a cash payment of $12.0 million, of which $11.0 million is to be contributed by the Company’s primary and excess D&O Carriers and the issuance of two million warrants for shares of the Company’s stock. In addition, the underwriters in Company’s initial public offering are to waive their rights to indemnity and contribution by the Company.
The derivative actions would be settled for implementation of certain compliance reforms. The Term Sheet also contemplates payment by the Company’s primary D&O carrier of $1.5 million for legal fees in respect of the derivative actions and the contribution of $500,000 in the Company’s stock.
In addition, the Term Sheet contemplates that the Company will contribute $500,000 to a trust to cover certain claims under its director and officer liability insurance policies.
The proposed settlement also requires the Company to advance legal fees to and indemnify certain individuals covered under the policies. The obligation to advance and indemnify on behalf of these individuals, while currently unquantifiable, may be substantial and could have a material adverse effect on the Company’s financial position and results of operations.
Other Matters
In addition to the proceedings above, we are party to various legal proceedings that arise in the ordinary course of business. From time to time, we also finance the cost of a policyholder’s defense of litigation initiated by a carrier to challenge the policyholder’s life insurance policy. While we cannot predict with certainty the
28
Table of Contents
outcome of these proceedings, we believe that the resolution of these other proceedings will not, based on information currently available to us, have a material adverse effect on our financial position or results of operations.
Item 4. Mine Safety Disclosures.
Not applicable.
PART II
Item 5. Market for Registrant’s Common Equity, Related Shareholder Matters and Issuer Purchases of Equity Securities
Shares of our common stock began trading on the New York Stock Exchange, or NYSE, under the symbol “IFT” on February 8, 2011.
The following table shows the high and low sales prices for our common stock for the periods indicated, as reported by the NYSE:
| 2012 | ||||||||
| High | Low | |||||||
| 1st Quarter |
$ | 2.80 | $ | 1.74 | ||||
| 2nd Quarter |
4.25 | 2.57 | ||||||
| 3rd Quarter |
4.15 | 3.24 | ||||||
| 4th Quarter |
4.80 | 3.11 | ||||||
| 2011 | ||||||||
| High | Low | |||||||
| 1st Quarter |
$ | 11.30 | $ | 10.00 | ||||
| 2nd Quarter |
10.48 | 9.19 | ||||||
| 3rd Quarter |
10.24 | 1.55 | ||||||
| 4th Quarter |
2.77 | 1.48 | ||||||
As of March 22, 2013, we had 9 holders of record of our common stock.
29
Table of Contents
Stock Performance Graph
The line graph below compares the cumulative total stockholder return in our common stock between February 8, 2011 (the day shares of our common stock began trading on the NYSE) and December 31, 2012, with cumulative total return on the Russell MicroCap Index and the Nasdaq Financial Index. This graph assumes a $100 investment in each of Imperial Holdings, Inc., the Russell Microcap Index and the Nasdaq Financial Index at the close of trading on February 8, 2011. The graph assumes our closing sales price on February 8, 2011 of $10.81 per share as the initial value of our common stock. We selected these indices because they include companies with similar market capitalizations to ours. We believe these are the most appropriate comparisons since we have no comparable publicly traded industry “peer” group operating in the life settlement industry.
The comparisons shown in the graph below are based upon historical data. We caution that the stock price performance shown in the graph below is not necessarily indicative of, nor is it intended to forecast, the potential future performance of our common stock.
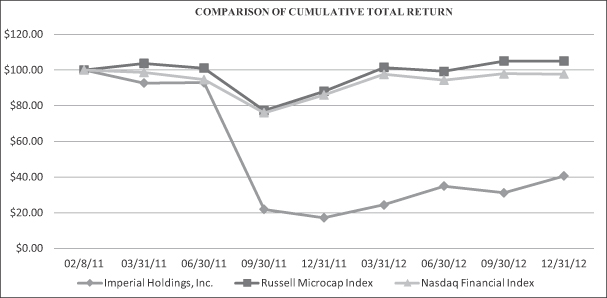
| 02/8/11 | 03/31/11 | 06/30/11 | 09/30/11 | 12/31/11 | 03/31/12 | 06/30/12 | 09/30/12 | 12/31/12 | ||||||||||||||||||||||||||||
| Imperial Holdings, Inc. |
$ | 100.00 | $ | 93.89 | $ | 93.99 | $ | 22.20 | $ | 17.39 | $ | 24.70 | $ | 35.43 | $ | 31.54 | $ | 41.17 | ||||||||||||||||||
| Russell Microcap Index |
$ | 100.00 | $ | 103.72 | $ | 101.11 | $ | 77.33 | $ | 88.09 | $ | 101.49 | $ | 99.20 | $ | 105.11 | $ | 105.03 | ||||||||||||||||||
| Nasdaq Financial Index |
$ | 100.00 | $ | 98.65 | $ | 94.64 | $ | 76.10 | $ | 86.00 | $ | 97.52 | $ | 94.36 | $ | 97.84 | $ | 97.76 | ||||||||||||||||||
The performance graph above is being furnished solely to accompany this Annual Report on Form 10-K pursuant to Item 201(e) of Regulation S-K, is not being filed for purposes of Section 18 of the Securities Exchange Act of 1934, as amended, and is not to be incorporated by reference into any of our filings, whether made before or after the date hereof, regardless of any general incorporation language in such filing.
Dividend Policy
We do not expect to pay any cash dividends on our common stock for the foreseeable future. We currently intend to retain any future earnings to finance our operations. Any future determination to pay cash dividends on
30
Table of Contents
our common stock will be at the discretion of our board of directors and will be dependent on our earnings, financial condition, operating results, capital requirements, any contractual, regulatory and other restrictions on the payment of dividends by us or by our subsidiaries to us, and other factors that our board of directors deems relevant.
We are a holding company and have no direct operations. Our ability to pay dividends in the future depends on the ability of our operating subsidiaries to pay dividends to us. Our existing debt facilities restrict the ability of certain of our special purpose subsidiaries to pay dividends. In addition, future debt arrangements may contain certain prohibitions or limitations on the payment of dividends.
Equity Compensation Plans
Prior to our initial public offering, in February 2011, our board of directors and shareholders approved the Imperial Holdings 2010 Omnibus Incentive Plan. The purpose of the Omnibus Plan is to attract, retain and motivate participating employees and to attract and retain well-qualified individuals to serve as members of the board of directors, consultants and advisors through the use of incentives based upon the value of our common stock. Awards under the Omnibus Plan may consist of incentive awards, stock options, stock appreciation rights, performance shares, performance units, and shares of common stock, restricted stock, restricted stock units or other stock-based awards as determined by the compensation committee. The Omnibus Plan provides that an aggregate of 1,200,000 shares of common stock are reserved for issuance under the Omnibus Plan, subject to adjustment as provided in the Omnibus Plan. Prior to our initial public offering, we had no equity compensation plan.
Recent Sales of Unregistered Securities
None.
Purchases of Equity Securities by the Issuer and Affiliated Purchasers
None.
31
Table of Contents
| Item 6. | Selected Financial Data |
The following table sets forth our selected historical consolidated financial and operating data as of such dates and for such periods indicated below. These selected historical consolidated results are not necessarily indicative of results to be expected in any future period. You should read the following financial information together with the other information contained in this Annual Report on Form 10-K, including “Management’s Discussion and Analysis of Financial Condition and Results of Operations” and the financial statements and related notes.
The selected historical income statement data for the years ended December 31, 2012, 2011 and 2010 and balance sheet data as of December 31, 2012 and 2011 were derived from our audited consolidated financial statements included elsewhere in this Annual Report on Form 10-K.
| Historical | ||||||||||||||||||||
| Years Ended December 31, | ||||||||||||||||||||
| 2012 | 2011 | 2010 | 2009 | 2008 | ||||||||||||||||
| (in thousands except per share data) | ||||||||||||||||||||
| Income |
||||||||||||||||||||
| Agency fee income |
$ | — | $ | 6,470 | $ | 10,149 | $ | 26,114 | $ | 48,004 | ||||||||||
| Interest income |
2,014 | 8,303 | 18,660 | 21,483 | 11,914 | |||||||||||||||
| Interest and dividends on investment securities available for sale |
391 | 640 | — | — | — | |||||||||||||||
| Origination fee income |
500 | 6,480 | 19,938 | 29,853 | 9,399 | |||||||||||||||
| Realized gain on sale of structured settlements |
11,509 | 5,817 | 6,595 | 2,684 | 443 | |||||||||||||||
| Realized gain on life settlements, net |
151 | 5 | 1,951 | — | — | |||||||||||||||
| Gain on forgiveness of debt |
— | 5,023 | 7,599 | 16,410 | — | |||||||||||||||
| Unrealized change in fair value of life settlements |
(5,660 | ) | 570 | 10,156 | — | — | ||||||||||||||
| Unrealized change in fair value of structured settlements |
1,823 | 5,302 | 2,477 | — | — | |||||||||||||||
| Change in equity investments |
— | — | (1,284 | ) | — | — | ||||||||||||||
| Servicing fee income |
1,183 | 1,814 | 413 | — | — | |||||||||||||||
| Gain on maturities of life settlements |
6,090 | 3,188 | — | — | — | |||||||||||||||
| Other income |
1,082 | 602 | 242 | 71 | 47 | |||||||||||||||
|
|
|
|
|
|
|
|
|
|
|
|||||||||||
| Total income |
19,083 | 44,214 | 76,896 | 96,615 | 69,807 | |||||||||||||||
|
|
|
|
|
|
|
|
|
|
|
|||||||||||
| Expenses |
||||||||||||||||||||
| Interest expense |
1,255 | 8,524 | 28,155 | 33,755 | 12,752 | |||||||||||||||
| Provision for losses on loans receivable |
515 | 7,589 | 4,476 | 9,830 | 10,768 | |||||||||||||||
| Loss on loan payoffs and settlements, net |
125 | 3,837 | 4,981 | 12,058 | 2,738 | |||||||||||||||
| Amortization of deferred costs |
1,867 | 6,076 | 24,465 | 18,339 | 7,569 | |||||||||||||||
| Department of Justice settlement |
— | 8,000 | — | — | — | |||||||||||||||
| Selling, general and administrative expenses* |
59,994 | 49,386 | 30,516 | 31,269 | 41,566 | |||||||||||||||
|
|
|
|
|
|
|
|
|
|
|
|||||||||||
| Total expenses |
63,756 | 83,412 | 92,593 | 105,251 | 75,393 | |||||||||||||||
|
|
|
|
|
|
|
|
|
|
|
|||||||||||
| Loss before income taxes |
(44,673 | ) | (39,198 | ) | (15,697 | ) | (8,636 | ) | (5,586 | ) | ||||||||||
| Benefit for income taxes |
(39 | ) | — | — | — | — | ||||||||||||||
|
|
|
|
|
|
|
|
|
|
|
|||||||||||
| Net loss |
$ | (44,634 | ) | $ | (39,198 | ) | $ | (15,697 | ) | $ | (8,636 | ) | $ | (5,586 | ) | |||||
|
|
|
|
|
|
|
|
|
|
|
|||||||||||
| Loss per share: |
||||||||||||||||||||
| Basic(1) |
$ | (2.10 | ) | $ | (2.03 | ) | $ | (4.36 | ) | $ | (2.40 | ) | $ | (1.55 | ) | |||||
|
|
|
|
|
|
|
|
|
|
|
|||||||||||
| Diluted(1) |
$ | (2.10 | ) | $ | (2.03 | ) | $ | (4.36 | ) | $ | (2.40 | ) | $ | (1.55 | ) | |||||
|
|
|
|
|
|
|
|
|
|
|
|||||||||||
| Weighted average shares outstanding: |
||||||||||||||||||||
| Basic(1) |
21,205,747 | 19,352,063 | 3,600,000 | 3,600,000 | 3,600,000 | |||||||||||||||
|
|
|
|
|
|
|
|
|
|
|
|||||||||||
| Diluted(1) |
21,205,747 | 19,352,063 | 3,600,000 | 3,600,000 | 3,600,000 | |||||||||||||||
|
|
|
|
|
|
|
|
|
|
|
|||||||||||
| (1) | As of February 3, 2011, the Company had 3,600,000 shares of common stock outstanding. The impact of the Company’s corporate conversion has been applied on a retrospective basis to January 1, 2008 to determine earnings per share for the years ended December 31, 2011, 2010, 2009, and 2008. As of December 31, 2012, there were 21,206,121 issued and outstanding shares. |
| * | See our Consolidated Statements of Operations in Part II, Item 8. Financial Statements and Supplemental Data for detail of selling general and administrative expenses. |
32
Table of Contents
| Historical | ||||||||||||||||||||
| Years Ended December 31, | ||||||||||||||||||||
| 2012 | 2011 | 2010 | 2009 | 2008 | ||||||||||||||||
| (In thousands except share data) | ||||||||||||||||||||
| ASSETS | ||||||||||||||||||||
| Assets |
||||||||||||||||||||
| Cash and cash equivalents |
$ | 7,001 | $ | 16,255 | $ | 14,224 | $ | 15,891 | $ | 7,644 | ||||||||||
| Restricted cash |
1,162 | 691 | 691 | — | 2,221 | |||||||||||||||
| Certificate of deposit—restricted |
— | 891 | 880 | 670 | 659 | |||||||||||||||
| Investment securities available for sale, at estimated fair value |
12,147 | 57,242 | — | — | — | |||||||||||||||
| Agency fees receivable, net of allowance for doubtful accounts |
— | — | 561 | 2,165 | 8,871 | |||||||||||||||
| Deferred costs, net |
7 | 1,874 | 10,706 | 26,323 | 26,650 | |||||||||||||||
| Prepaid expenses and other assets |
14,165 | 3,277 | 1,868 | 887 | 4,180 | |||||||||||||||
| Deposits—other |
2,855 | 761 | 692 | 982 | 476 | |||||||||||||||
| Interest receivable, net |
822 | 5,758 | 13,140 | 21,034 | 8,604 | |||||||||||||||
| Loans receivable, net |
3,044 | 29,376 | 90,026 | 189,111 | 148,744 | |||||||||||||||
| Structured settlement receivables at estimated fair value |
1,680 | 12,376 | 1,446 | — | — | |||||||||||||||
| Structured settlement receivables at cost, net |
1,574 | 1,553 | 1,090 | 472 | 1,141 | |||||||||||||||
| Investment in life settlements, at estimated fair value |
113,441 | 90,917 | 17,138 | 4,306 | — | |||||||||||||||
| Investment in life settlement fund |
— | — | — | 542 | — | |||||||||||||||
| Fixed assets, net |
232 | 585 | 876 | — | — | |||||||||||||||
| Investment in affiliate |
2,212 | 1,043 | 79 | 1,337 | 1,850 | |||||||||||||||
|
|
|
|
|
|
|
|
|
|
|
|||||||||||
| Total assets |
$ | 160,342 | $ | 222,599 | $ | 153,417 | $ | 263,720 | $ | 211,040 | ||||||||||
|
|
|
|
|
|
|
|
|
|
|
|||||||||||
| LIABILITIES AND STOCKHOLDERS’/MEMBERS’ EQUITY | ||||||||||||||||||||
| Liabilities |
||||||||||||||||||||
| Accounts payable and accrued expenses |
6,606 | 16,336 | 3,425 | 3,170 | 5,533 | |||||||||||||||
| Payable for purchase of structured settlements |
— | — | 224 | — | — | |||||||||||||||
| Other liabilities |
20,796 | 4,279 | 7,984 | — | — | |||||||||||||||
| Lender protection insurance claims received in advance |
— | — | 31,154 | — | — | |||||||||||||||
| Interest payable |
— | 5,505 | 13,820 | 12,627 | 5,563 | |||||||||||||||
| Notes payable and debenture payable, net of discount |
— | 19,277 | 91,609 | 231,064 | 183,462 | |||||||||||||||
| Income taxes payable |
6,295 | 6,295 | — | — | — | |||||||||||||||
|
|
|
|
|
|
|
|
|
|
|
|||||||||||
| Total liabilities |
33,697 | 51,692 | 148,216 | 246,861 | 194,558 | |||||||||||||||
| Stockholders’/Members’ Equity |
||||||||||||||||||||
| Member units—preferred (zero authorized in the aggregate as of December 31, 2012 and 2011, respectively and 500,000 authorized in the aggregate as of December 31, 2010, 2009 and 2008, respectively): |
||||||||||||||||||||
| Member units—Series A preferred (zero issued and outstanding as of December 31, 2012 and 2011, respectively and 90,796 issued and outstanding as of December 31, 2010, 2009 and 2008, respectively) |
— | — | 4,035 | 4,035 | — | |||||||||||||||
| Member units—Series B preferred (zero issued and outstanding as of December 31, 2012 and 2011, respectively and 25,000 issued and outstanding as of December 31, 2010, 2009 and 2008, respectively) |
— | — | 2,500 | 5,000 | — | |||||||||||||||
| Member units—Series C preferred (zero issued and outstanding as of December 31, 2012 and 2011, respectively and 70,000 issued and outstanding as of December 31, 2010, 2009 and 2008, respectively) |
— | — | 7,000 | — | — | |||||||||||||||
| Member units—Series D preferred (zero issued and outstanding as of December 31, 2012 and 2011, respectively and 7,000 issued and outstanding as of December 31, 2010, 2009 and 2008, respectively) |
— | — | 700 | — | — | |||||||||||||||
| Member units—Series E preferred (zero issued and outstanding as of December 31, 2012 and 2011, respectively and 73,000 issued and outstanding as of December 31, 2010, 2009 and 2008, respectively) |
— | — | 7,300 | — | — | |||||||||||||||
| Member units—common (zero authorized; zero issued and outstanding as of December 31, 2012 and 2011, respectively and 500,000 authorized; 337,500 issued and outstanding as of December 31, 2010, 2009 and 2008, respectively) |
— | — | 11,462 | 19,924 | 19,945 | |||||||||||||||
| Common stock (80,000,000 authorized; 21,206,121 and 21,202,614 issued and outstanding as of December 31, 2012 and 2011, respectively and zero authorized and zero issued and outstanding as of December 31, 2010, 2009 and 2008 respectively) |
212 | 212 | — | — | — | |||||||||||||||
| Additional paid-in-capital |
238,064 | 237,755 | — | — | ||||||||||||||||
| Accumulated other comprehensive loss |
(3 | ) | (66 | ) | — | — | — | |||||||||||||
| Accumulated deficit |
(111,628 | ) | (66,994 | ) | (27,796 | ) | (12,100 | ) | (3,463 | ) | ||||||||||
|
|
|
|
|
|
|
|
|
|
|
|||||||||||
| Total stockholders’/members’ equity |
126,645 | 170,907 | 5,201 | 16,859 | 16,482 | |||||||||||||||
|
|
|
|
|
|
|
|
|
|
|
|||||||||||
| Total liabilities and stockholders’/members’ equity |
$ | 160,342 | $ | 222,599 | $ | 153,417 | $ | 263,720 | $ | 211,040 | ||||||||||
|
|
|
|
|
|
|
|
|
|
|
|||||||||||
33
Table of Contents
Life Finance Segment—Selected Operating Data (dollars in thousands
| For the Twelve Months Ended December 31, |
||||||||||||
| 2012 | 2011 | 2010 | ||||||||||
| Period Acquisitions—Policies Owned |
||||||||||||
| Number of policies acquired |
31 | 151 | 33 | |||||||||
| Average age of insured at acquisition |
75.5 | 78.0 | 77.5 | |||||||||
| Average life expectancy—Calculated LE (Years) |
13.2 | 10.4 | 12.8 | |||||||||
| Average death benefit |
$ | 5,354 | $ | 4,929 | $ | 5,176 | ||||||
| Aggregate purchase price |
$ | 5,708 | $ | 56,889 | $ | 4,010 | ||||||
| End of Period—Policies Owned |
||||||||||||
| Number of policies owned |
214 | 190 | 41 | |||||||||
| Average Life Expectancy—Calculated LE (Years) |
10.6 | 10.6 | 13.2 | |||||||||
| Aggregate Death Benefit |
$ | 1,073,156 | $ | 935,466 | $ | 195,782 | ||||||
| Aggregate fair value |
$ | 113,441 | $ | 90,917 | $ | 17,138 | ||||||
| Monthly premium—average per policy |
$ | 10.9 | $ | 10.7 | $ | 6.4 | ||||||
| End of Period Loan Portfolio |
||||||||||||
| Loans receivable, net |
$ | 3,044 | $ | 29,376 | $ | 90,026 | ||||||
| Number of policies underlying loans receivable |
22 | 138 | 325 | |||||||||
| Aggregate death benefit of policies underlying loans receivable |
$ | 89,650 | $ | 653,493 | $ | 1,517,161 | ||||||
| Number of loans with insurance protection |
5 | 91 | 304 | |||||||||
| Loans receivable, net (insured loans only) |
$ | 91 | $ | 20,785 | $ | 84,996 | ||||||
| Average Per Loan: |
||||||||||||
| Age of insured in loans receivable |
75.5 | 75.0 | 75.3 | |||||||||
| Life expectancy of insured (years) |
15.7 | 15.6 | 15.3 | |||||||||
| Monthly premium |
$ | 5 | $ | 6 | $ | 7 | ||||||
| Loan receivable, net |
$ | 138 | $ | 213 | $ | 277 | ||||||
| Interest rate |
13.0 | % | 12.3 | % | 11.4 | % | ||||||
| Period Originations: |
||||||||||||
| Number of loans originated (by type): |
||||||||||||
| Type 1* |
— | 44 | 93 | |||||||||
| Type 2** |
— | 11 | 4 | |||||||||
| Principal balance of loans originated |
$ | — | $ | 18,385 | $ | 20,536 | ||||||
| Aggregate death benefit of policies underlying loans originated |
$ | — | $ | 311,850 | $ | 462,350 | ||||||
| Average Per Origination During Period: |
||||||||||||
| Age of insured at origination |
— | 75.7 | 74.0 | |||||||||
| Life expectancy of insured (years) |
— | 14.5 | 14.1 | |||||||||
| Monthly premium (year of origination) |
$ | — | $ | 11 | $ | 14 | ||||||
| Death benefit of policies underlying loans originated |
$ | — | $ | 5,377 | $ | 4,766 | ||||||
| Principal balance of the loan |
$ | — | $ | 334 | $ | 212 | ||||||
| Interest rate charged |
— | 14.0 | % | 11.5 | % | |||||||
| Agency fee |
$ | — | $ | 110 | $ | 103 | ||||||
| Agency fee as % of principal balance |
||||||||||||
| Type 1* |
— | 39.0 | % | 49.3 | % | |||||||
| Type 2** |
— | 20.7 | % | 30.1 | % | |||||||
| Origination fee |
$ | — | $ | 80 | $ | 88 | ||||||
| Annualized origination fee as % of principal balance |
— | 24.3 | % | 22.8 | % | |||||||
| * | We define Type 1 loans as loans that are collateralized by life insurance policies that have been in force less than two years. |
| ** | We define Type 2 loans as loans that are collateralized by life insurance policies that have been in force longer than two years. |
34
Table of Contents
Structured Settlements Segment—Selected Operating Data (dollars in thousands):
| For the Twelve Months Ended December 31, |
||||||||||||
| 2012 | 2011 | 2010 | ||||||||||
| Period Originations: |
||||||||||||
| Number of transactions |
965 | 873 | 565 | |||||||||
| Number of transactions from repeat customers |
333 | 307 | 154 | |||||||||
| Average purchase discount rate |
18.7 | % | 18.2 | % | 19.4 | % | ||||||
| Face value of undiscounted future payments purchased |
$ | 130,136 | $ | 96,628 | $ | 47,207 | ||||||
| Amount paid for settlements purchased |
$ | 24,571 | $ | 20,303 | $ | 12,506 | ||||||
| Marketing costs |
$ | 5,023 | $ | 6,087 | $ | 5,077 | ||||||
| Selling, general and administrative (excluding marketing costs) |
$ | 16,524 | $ | 15,864 | $ | 7,888 | ||||||
| Average Per Origination During Period: |
||||||||||||
| Face value of undiscounted future payments purchased |
$ | 135 | $ | 111 | $ | 84 | ||||||
| Amount paid for settlement purchased |
$ | 25 | $ | 23 | $ | 22 | ||||||
| Time from funding to maturity (months) |
132.1 | 152.1 | 133.8 | |||||||||
| Marketing cost per transaction |
$ | 5 | $ | 7 | $ | 9 | ||||||
| Segment selling, general and administrative (excluding marketing costs) per transaction |
$ | 17 | $ | 18 | $ | 14 | ||||||
| Period Sales: |
||||||||||||
| Number of transactions originated and sold |
939 | 601 | 630 | |||||||||
| Realized gain on sale of structured settlements |
$ | 11,509 | $ | 5,817 | $ | 6,595 | ||||||
| Average sale discount rate |
10.6 | % | 10.5 | % | 8.9 | % | ||||||
| End of Period Portfolio: |
||||||||||||
| Number of transactions on balance sheet |
90 | 356 | 84 | |||||||||
Item 7. Management’s Discussion and Analysis of Financial Condition and Results of Operations
You should read the following discussion in conjunction with the consolidated financial statements and accompanying notes and the information contained in other sections of this Annual Report on Form 10-K, particularly under the headings “Risk Factors,” “Selected Financial Data” and “Business.” This discussion and analysis is based on the beliefs of our management, as well as assumptions made by, and information currently available to, our management. The statements in this discussion and analysis concerning expectations regarding our future performance, liquidity and capital resources, as well as other non-historical statements in this discussion and analysis, are forward-looking statements. See “Cautionary Statement Regarding Forward-Looking Statements.” These forward-looking statements are subject to numerous risks and uncertainties, including those described under “Risk Factors.” Our actual results could differ materially from those suggested or implied by any forward-looking statements.
Business Overview
We were founded in December 2006 as a Florida limited liability company and in connection with our initial public offering, in February 2011, Imperial Holdings, Inc. succeeded to the business of Imperial Holdings, LLC and its assets and liabilities.
Imperial Holdings, Inc. (the “Company” or “Imperial”) operates in two reportable business segments: life finance (formerly referred to as premium finance) and structured settlements. In the life finance business, the
35
Table of Contents
Company earns revenue/income from changes in the fair value of life insurance policies that the Company acquires and receipt of death benefits with respect to matured life insurance policies it owns as well as from interest accruing on outstanding loans and loan origination fees recognized over the life of outstanding loans. In the structured settlement business, the Company purchases structured settlement receivables at a discounted rate and sells these receivables to third parties.
In February 2011, the Company sold 17,602,614 shares of common stock in its initial public offering at a price of $10.75 per share. The Company received net proceeds of approximately $174.2 million after deducting the underwriting discounts and commissions and its offering expenses.
See “Business” in this Annual Report on Form 10-K for additional information regarding our business and operations.
Recent Developments, Uncertainties & Outlook
At the time of the Company’s initial public offering, the Company intended to hold the majority of the life insurance policies it acquired to maturity while selectively trading in and out of certain policies. In light of the USAO Investigation, the SEC Investigation, the related shareholder litigation and the related unbudgeted expenses incurred by the Company, the Company is currently focused on raising long-term capital and maintaining and realizing upon its portfolio of life insurance policies. Accordingly, the Company does not currently intend to expend significant resources acquiring policies and expects that earnings in its life finance segment going forward will be driven by maturities in its portfolio of life insurance policies and through unrealized changes in the fair value of its life insurance policies. At December 31, 2012, the Company had approximately $20.3 million of cash and cash equivalents, and marketable securities, with projected premiums of $27.7 million and $26.3 million in 2013 and 2014, respectively. Based on internal projections at December 31, 2012, the Company anticipated a liquidity shortfall in the second quarter of 2013. On March 27, 2013, a subsidiary of the Company borrowed $45 million in aggregate principal amount under an 18-month senior secured bridge facility. The Company believes that the proceeds of this facility will provide the Company with the resources to continue to pay premiums on its portfolio of life insurance policies and fund its operations through December 31, 2013 while the Company continues its efforts to source more permanent capital.
Proposed Settlement of Shareholder Litigation
On December 18, 2012, attorneys for Imperial signed a Term Sheet for Global Settlement Regarding Imperial Holdings, Inc. Matters (the “Term Sheet”). Also signing the Term Sheet were attorneys representing the plaintiffs in the previously disclosed class action lawsuits and derivative actions instituted against the Company as well attorneys for Imperial’s director and officer liability insurance carriers (“D&O Carriers”), certain individual defendants named in the class actions and the underwriters in Imperial’s initial public offering. The Term Sheet provides the terms upon which each of the parties represented by the signatories would be willing to settle the class action litigation and derivative actions as well as the declaratory relief action filed by Catlin, Imperial’s primary D&O Carrier.
While non-binding and subject to certain contingencies, the terms of the class action settlement include a cash payment of $12.0 million, of which $11.0 million is to be contributed by Imperial’s primary and excess D&O Carriers, and the issuance of two million warrants for shares of the Company’s stock with an estimated value of $3.1 million at the date of the signing of the Term Sheet. The value of the warrants will be re-assessed at issuance. The warrants will have a five-year term with an exercise price of $10.75 and will be issued when the settlement proceeds are distributed to the claimants. In addition, the underwriters in Imperial’s initial public offering are to waive their rights to indemnity and contribution by Imperial. The Company established a reserve related to the proposed settlement of $15.1 million, which is included in other liabilities and a receivable for insurance recoverable from the Company’s D&O Carrier of $11.0 million, which is included in prepaid and other assets. The $4.1 million net effect of the settlement is included in legal fees in the statement of operations for the year ended December 31, 2012.
36
Table of Contents
The derivative would be settled for implementation of certain compliance reforms. The Term Sheet also contemplates payment by Imperial’s primary D&O carrier of $1.5 million for legal fees in respect of the derivative actions and the contribution of $500,000 in Imperial stock.
In addition, the Term Sheet contemplates that Imperial will contribute $500,000 to a trust to cover certain claims under its director and officer liability insurance policies.
The Company established a reserve related to the proposed derivative settlement and insurance trust of $2.5 million, which is included in other liabilities and a receivable for insurance recoverable from the Company’s D&O Carrier of $1.5 million, which is included in prepaid and other assets. The net effect of the settlement of $1.0 million is included in legal fees in the statement of operations for the year ended December 31, 2012.
The proposed settlement also requires Imperial to advance legal fees to and indemnify certain individuals covered under the policies. The obligation to advance and indemnify on behalf of these individuals, while currently unquantifiable, may be substantial and could have a material adverse effect on the Company’s financial position and results of operations.
Use of Updated Life Expectancies, Change in Mortality Table & Recent Announcements by Life Expectancy Providers
During the second half of 2012, the Company began receiving updated life expectancy reports on the insureds represented in the Company’s portfolio of life insurance policies from both its historical provider of life expectancy reports, AVS Underwriting LLC (“AVS”), and another third party life expectancy provider, 21st Services, LLC (“21st Services”). The procurement of these reports was undertaken in anticipation of a potential financing transaction as the Company believes that potential lenders in any long-term financing will likely require updated life expectancy reports and that such lenders may establish a loan-to-value ratio or borrowing base in any financing based off of a composite mortality factor or “blend” of life expectancy results furnished by these two providers. Additionally, the Company believes that many participants in the secondary and tertiary markets have utilized a blend by these life expectancy providers in pricing life insurance policies and that using a second life expectancy provider mitigates the effects of potential underwriting biases. Having taken these factors into consideration, the Company determined to input a composite mortality factor based off of AVS and 21st Services into its fair value model beginning in the third quarter. See Valuation of Insurance Policies in this Management’s Discussion and Analysis of Financial Condition and Results of Operations.
The Company does not expect that it will ever receive updated life expectancy reports on 100% its policies as it anticipates a portion of the insureds represented by its portfolio to be unresponsive to requests for updated medical information. This information is generally required by life expectancy providers to issue new life expectancy reports. The Company believes that insureds who have deteriorated in health are generally less likely to be responsive to requests for updated medical information. As a result, the periodic updating of life expectancy reports may conservatively skew fair value estimates lower as any health deteriorations experienced by unresponsive insureds would not be reflected in the life expectancy inputs that are used to calculate the value of the Company’s investment in life settlements.
At December 31, 2012 , the Company had received updated life expectancies on 149 policies, which were blended and inputted in the Company’s fair value model at December 31, 2012. In cases where the Company did not receive updated life expectancy reports, the results of original AVS life expectancy reports together with life expectancy reports from 21st Services that were obtained when the original AVS life expectancy reports were obtained have been blended. Additionally and in consultation with third party actuarial consultants, the Company lengthened the life expectancy inputs to its fair value model on 45 policies with life expectancy reports that were more than two years old at December 31, 2012 based on the average lengthening reported on the 149 policies where update life expectancy reports were received. Had the Company not implemented such an adjustment on
37
Table of Contents
affected policies, the fair value of the Company’s portfolio would have increased from the reported amount by $5.8 million. Additionally, the Company replaced its mortality table with a modified version of the 2008 Valuation Basic Table in the third quarter of 2012 as the third party that developed the Company’s previously used table has ceased operations. The Company believes that the table utilized in the third quarter is consistent with tables used by other market participants and did not have a material impact on the valuation of the Company’s life insurance policies.
On January 22, 2013, 21st Services announced significant revisions to its underwriting methodology. On February 4, 2013, 21st Services then announced that it was correcting errors discovered in its previously announced revised methodology. According to the provider, these revisions have generally been understood to lengthen the average reported life expectancy furnished by 21st Services by 19% and, accordingly, will likely negatively impact the valuation of the Company’s portfolio of life insurance policies. However, the Company has not received life expectancy reports from 21st Services that utilize its revised methodology and the fair value of the Company’s portfolio of life insurance policies at December 31, 2012 does not take into account changes to life expectancy estimates that may result from 21st Services updated methodology. While the Company is still evaluating the general impact that these revisions might have on the value of its portfolio, the Company may determine to cease utilizing, or adjust the weighting of, 21st Services reports as an input into its fair value model in future periods as market practice responds to the adjusted methodology. Additionally, the Company’s other life expectancy provider, AVS Underwriting LLC (“AVS”), filed for federal bankruptcy protection under Chapter 11 on February 12, 2013. The Company cannot, at this time, predict what impact the bankruptcy filing will have on the Company’s ability to procure life expectancy reports from AVS in the future, AVS’s ability to continue its operations or whether other market participants will continue to use AVS life expectancy reports for valuation purposes going forward. As a result of these developments, the Company may need to adjust the application of life expectancy reports in its fair value methodology or source reports from different life expectancy providers in future periods, which could have a material impact on the Company’s fair value calculations and materially and adversely effect our business, financial condition and results of operations.
Principal Revenue and Expense Items
Components of Revenue / Income
Unrealized change in fair value of Life Settlements and Structured Settlement Receivables
We have elected to carry our investments in life settlements at fair value. As of July 1, 2010, we elected to adopt the fair value option, in accordance with ASC 825, Financial Instruments, to record certain newly-acquired structured settlement receivables at fair value. Any change in fair value upon re-measurement of these investments is recorded through our unrealized change in fair value of life settlements and structured settlement receivables.
Gain on Sale of Structured Settlements
We purchase a certain number of fixed (life-contingent or non life-contingent), scheduled future settlement payments on a discounted basis in exchange for a single lump sum payment. We negotiate a purchase price that is calculated as the present value of the future payments to be purchased, discounted at a rate equal to our required investment yield. From time to time, we sell portfolios of structured settlements to institutional investors. The sale price is calculated as the present value of the future payments to be sold, discounted at a negotiated yield. We record any amounts of sale proceeds in excess of our carrying value as a gain on sale.
Gain on Maturities of Life Settlements with Subrogation Rights, net
The Company accounts for the maturities of life settlements with subrogation rights (net of subrogation expenses) as contingent gains in accordance with ASC 450, Contingencies and recognizes the revenue from the maturities of these policies when all contingencies are resolved.
38
Table of Contents
Interest Income
We receive interest income that accrues over the life of the premium finance loan and is due upon the date of maturity or upon repayment of the loan. Substantially all of the interest rates we charged on our premium finance loans are floating rates that were calculated at the one-month LIBOR rate plus an applicable margin. In addition, our premium finance loans have a floor interest rate and are capped at 16.0% per annum. For loans with floating rates, each month the interest rate is recalculated to equal one-month LIBOR plus the applicable margin, and then, if necessary, adjusted so as to remain at or above the stated floor rate and at or below the capped rate of 16.0% per annum. Interest income is recognized using the effective interest method over the life of the loan.
The weighted average per annum interest rate for premium finance loans outstanding as of the dates below is as follows:
| Year Ended December 31, | ||||||||||||
| 2012 | 2011 | 2010 | ||||||||||
| Weighted average per annum interest rate |
13.4 | % | 12.5 | % | 11.4 | % | ||||||
Interest income also includes interest earned on structured settlement receivables. Until we sell our structured settlement receivables, the structured settlements are held on our balance sheet. Purchase discounts are accreted into interest income using the effective-interest method. As a result of the voluntary termination of our premium finance business, we will cease earning interest income from premium finance loans once our outstanding premium finance loans mature.
Servicing Income
We receive income from servicing life insurance policies controlled by a third party. These services include verifying premiums are paid and correctly applied and updating files for medical history and ongoing premiums.
Gain on Sale of Life Settlements
Gain on sale of life settlements includes gain from company-owned life settlements and gains from sales on behalf of third parties.
Origination Fee Income
We charged our borrowers an origination fee as part of the premium finance loan origination process. It was a one-time fee that is added to the loan amount and is due upon the date of maturity or upon repayment of the loan. Origination fees are recognized on an effective-interest method over the term of the loan.
Origination fees as a percentage of the principal balance of loans originated during the periods below are as follows:
| Year Ended December 31, | ||||||||||||
| 2012 | 2011 | 2010 | ||||||||||
| Origination fees as a percentage of the principal balance of the loans |
— | % | 25.0 | % | 41.5 | % | ||||||
| Origination fees per annum as a percentage of the principal balance of the loan |
— | % | 24.3 | % | 22.7 | % | ||||||
As a result of the voluntary termination of our premium finance business, we will cease accruing origination fee income once our outstanding premium finance loans mature.
39
Table of Contents
Agency Fee Income
In connection with our premium finance business, we earned agency fees that were paid by the referring life insurance agents. Because agency fees were not paid by the borrower, such fees do not accrue over the term of the loan. Referring insurance agents paid the agency fees to our subsidiary, Imperial Life and Annuity Services, LLC, a licensed insurance agency, for the due diligence performed in underwriting the premium finance transaction. The amount of the agency fee paid by a referring life insurance agent was negotiated with the referring agents based on a number of factors, including the size of the policy and the amount of premiums on the policy. Agency fees as a percentage of the principal balance of loans originated during the periods below are as follows:
| Year Ended December 31, | ||||||||||||
| 2012 | 2011 | 2010 | ||||||||||
| Agency fees as a percentage of the principal balance of the loans originated |
— | % | 33.0 | % | 48.8 | % | ||||||
As a result of the voluntary termination of our premium finance business, we did not receive any revenue from agency fees in 2012 and Imperial Life and Annuity Services, LLC has voluntarily surrendered all its insurance agency licenses during the year ended December 31, 2012.
Components of Expenses
Interest Expense
Interest expense is interest accrued monthly on credit facility borrowings that were used to fund premium finance loans and promissory notes that were used to fund operations and corporate expenses. Interest is generally compounded monthly and payable as the collateralized loans mature.
Our weighted average interest rate for our credit facilities and promissory notes outstanding as of the dates indicated below is as follows:
| December 31, | ||||||||||||
| 2012 | 2011 | 2010 | ||||||||||
| Weighted average interest rate under credit facilities |
0.0 | % | 15.7 | % | 17.1 | % | ||||||
| Weighted average interest rate under promissory note |
0.0 | % | 0.0 | % | 16.5 | % | ||||||
| Total weighted average interest rate |
0.0 | % | 15.7 | % | 17.0 | % | ||||||
Provision for Losses on Loans Receivable
We specifically evaluate all loans for impairment, on a monthly basis, based on the fair value of the underlying life insurance policies as collectability is primarily collateral dependent. The fair value of the life insurance policy is determined using our valuation model, which is a Level 3 fair value measurement. For loans with lender protection insurance, the insured value is also considered when determining the fair value of the life insurance policy. The insured value is not directly correlated to any portion of the loan, such as principal, accrued interest, accreted origination income, or other fees, which may be charged or incurred on these types of loans. The insured value is the amount we would receive in the event that we filed a lender protection insurance claim. The lender protection insurer limits the insured value to an amount equal to or less than its determination of the value of the life insurance policy underlying our premium finance loan based on its own models and assumptions, which may be equal to or less than the carrying value of the loan receivable. For all loans, the amount of loan impairment, if any, is calculated as the difference in the fair value of the life insurance policy and the carrying value of the loan receivable. Loan impairments are charged to the provision for losses on loans receivable in our consolidated statement of operations.
In some instances, we make a loan to an insured whereby we immediately record a loan impairment valuation adjustment against the principal of the loan. Loans that experience an immediate impairment are made
40
Table of Contents
when the transaction components that are not included in the loan, such as agency fees, offset or exceed the amount of the impairment.
For loans that matured and were not repaid at maturity, the borrower typically relinquishes ownership of the policy to us in exchange for our release of the debt (or we enforce our security interests in the beneficial interests in the trust that owns the policy). For loans that have lender protection insurance, we make a claim against the lender protection insurance policy and, subject to policy terms and conditions, the insurer has the right to direct control or take beneficial ownership of the policy upon payment of our claim.
For loans that had lender protection insurance and matured during the years ended December 31, 2012 and 2011, 88 and 131 loans were not repaid at maturity, respectively, all of which were submitted to our lender protection insurer and 95.5% and 100% paid by such insurer. The net carrying value of the loans (which includes principal, accrued interest income, and accrued origination fees, net of impairment) at the time of payoff during the years ended December 31, 2012 and 2011 was $25.3 million and $49.7 million, respectively. The amount of cash received by us for those loans was $25.6 million and $51.5 million, respectively. This resulted in a gain during the years ended December 31, 2012 and 2011 of $29,000 and $737,000, respectively. This gain was primarily attributable to the insurance amount at the time of payoff exceeding the contractual amounts due under the terms of the loan agreement. Therefore, the amount of claims paid by the lender protection insurer was in excess of 100% of the net carrying value of the loans. The following table provides information on the insured loans that were not repaid at maturity for the periods indicated below (dollars in thousands):
| Year Ended December 31, 2012 |
Year Ended December 31, 2011 |
|||||||
| Number of loans matured |
89 | 138 | ||||||
| Number of loans impaired at maturity |
61 | 52 | ||||||
| Loans not repaid at maturity |
88 | 131 | ||||||
| Claims submitted to lender protection insurer |
88 | 131 | ||||||
| Claims paid by lender protection insurer |
85 | 131 | ||||||
| Amount of claims paid |
$ | 25,646 | $ | 51,480 | ||||
| Net carrying value of loans at payoff |
$ | 25,303 | $ | 49,706 | ||||
| Gain on LPIC payoffs (all loans) |
29 | 737 | ||||||
| Gain on LPIC payoffs (impaired loans) |
104 | 607 | ||||||
| Percent of claims paid by lender protection insurer |
95.5 | %* | 100 | % | ||||
| * | Claims have been filed with the LPIC carrier and the Company is pending reimbursement for the remaining 4.5%, a provision for losses on loans receivable of $515,000 was established as collectability of the LPIC claim is uncertain. |
The following table shows the percentage of the total number of loans outstanding with lender protection insurance and the percentage of our total loans receivable balance covered by lender protection insurance as of the dates indicated below:
| December 31, | ||||||||||||
| 2012 | 2011 | 2010 | ||||||||||
| Percentage of total number of loans outstanding with lender protection insurance |
22.7 | % | 65.9 | % | 93.9 | % | ||||||
| Percentage of total loans receivable, net balance covered by lender protection insurance |
3.0 | % | 70.1 | % | 94.1 | % | ||||||
We use a method to determine the loan impairment valuation adjustment, which assumes the “worst case” scenario for the fair value of the collateral based on the insured coverage amount. At the time of loan origination,
41
Table of Contents
we recorded impairment even though no loans are considered non-performing as no payments are due by the borrower. Loans with insured collateral represented 22.7% and 65.9% of our loans as of December 31, 2012 and 2011, respectively.
The following table shows the amount of impairment recorded on loans outstanding with and without lender protection insurance during each period (dollars in thousands):
| Year Ended December 31, 2012 |
Year Ended December 31, 2011 |
|||||||
| Provision for losses on loans receivable with lender protection insurance |
$ | 437 | $ | 57 | ||||
| Provision (recoveries) for losses on loans receivable without lender protection insurance |
— | 7,532 | ||||||
|
|
|
|
|
|||||
| Total provision for losses on loans receivable |
$ | 437 | $ | 7,589 | ||||
Loss on Loan Payoffs and Settlements, Net
When a premium finance loan matures, we record the difference between the net carrying value of the loan receivable (which includes the loan principal balance, accrued interest and accreted origination fees, net of any impairment valuation adjustment) and the cash received, or the fair value of the life insurance policy that is obtained if there is a default and the policy is relinquished, as a gain or loss on loan payoffs and settlements, net. This account was significantly impacted by the Acorn settlement, as discussed below, whereby we recorded a loss on loan payoffs and settlements, net, of zero, $4.1 million and $5.5 million during the years ended December 31, 2012, 2011 and 2010, respectively, under the direct write-off method, as opposed to charging our provision for losses on loan receivables.
Beginning in July 2008, Acorn Capital Group stopped funding under its credit facility with us without any advance notice. Therefore, we did not have access to funds necessary to pay the ongoing premiums on the policies serving as collateral for our borrower’s loans that were financed under the Acorn facility. We did not incur liability with our borrowers because the terms of the Acorn loans provide that we are only required to fund future premiums if our lender provides us with funds. Through December 31, 2011, a total of 119 policies financed under the Acorn facility incurred losses primarily due to non-payment of premiums.
In May 2009, we entered into a settlement agreement with Acorn whereby all obligations under the credit agreement were terminated. Acorn subsequently assigned its rights under the settlement agreement to Asset Based Resource Group, LLC (“ABRG”), an entity that is not related to us. As part of the settlement agreement, we continue to service the original loans and ABRG determines whether or not it will continue to fund the loans. We believe that ABRG will elect to fund the loan only if it believes there is value in the policy serving as collateral for the loan. If ABRG chooses not to continue funding a loan, we have the option to fund the loan or try to sell the loan or related policy to another party. We elect to fund the loan only if we believe there is value in the policy serving as collateral for the loan after considering the costs of keeping the policy in force. Regardless of whether we fund the loan or sell the loan or related policy to another party, our debt under the Acorn facility is forgiven and we record a gain on the forgiveness of debt. If we fund the loan, it remains as an asset on our balance sheet, otherwise it is written off and we record the amount written off as a loss on loan payoffs and settlements, net.
On the notes that were cancelled under the Acorn facility, we had debt forgiven totaling zero and $5.0 million for the years ended December 31, 2012 and 2011, respectively. We recorded these amounts as gain on forgiveness of debt. Partially offsetting these gains, we had loan losses totaling zero and $4.1 million during the years ended December 31, 2012, and 2011, respectively. We recorded these amounts as loss on loan payoffs and settlements, net. As of December 31, 2012, there were no loans that remained outstanding from the original 119 loans financed in the Acorn facility.
42
Table of Contents
The following table highlights the number of loans impacted by the Acorn settlement during the periods indicated below (dollars in thousands):
| Acorn Credit Facility | ||||||||||||||||||||
| Year Ended December 31, | ||||||||||||||||||||
| 2012 | 2011 | 2010 | 2009 | 2008 | ||||||||||||||||
| Number of loans held at end of period |
— | — | 15 | 49 | 112 | |||||||||||||||
| Loans receivable, net, balance at end of period |
$ | — | $ | — | $ | 4,183 | $ | 9,601 | $ | 21,073 | ||||||||||
| Number of loans impacted during period |
— | 15 | 48 | 63 | 7 | |||||||||||||||
The following table highlights the impact of the Acorn settlement on our financial statements during the periods indicated below (dollars in thousands):
| Acorn Credit Facility | ||||||||||||||||||||||||
| Year Ended December 31, | ||||||||||||||||||||||||
| 2012 | 2011 | 2010 | 2009 | 2008 | Total | |||||||||||||||||||
| Gain on forgiveness of debt |
$ | — | $ | 5,023 | $ | 7,599 | $ | 16,410 | $ | — | $ | 29,032 | ||||||||||||
| Loss on loan payoffs and settlements, net |
— | (4,141 | ) | (5,501 | ) | (10,182 | ) | (1,868 | ) | $ | (21,692 | ) | ||||||||||||
|
|
|
|
|
|
|
|
|
|
|
|
|
|||||||||||||
| Impact on net income (loss) |
$ | — | $ | 882 | $ | 2,098 | $ | 6,228 | $ | (1,868 | ) | $ | 7,340 | |||||||||||
The $7.3 million impact on net income is due to 28 policies that we decided to continue to fund the premiums after ABRG elected not to continue to fund the premiums. With respect to the associated loans, we received a gain on forgiveness of debt with no offsetting loss on loan payoffs and settlements, net.
Amortization of Deferred Costs
Deferred costs include premium payments made by us to our lender protection insurer. These expenses are deferred and recognized over the life of the note using the effective interest method. Deferred costs also include credit facility closing costs such as legal and professional fees associated with the establishment of our credit facilities, which deferred costs are recognized over the life of the debt. We expect our deferred costs to decline over time as our portfolio of loans with lender protection insurance matures.
Selling, General and Administrative Expenses
Selling, general, and administrative expenses include salaries and benefits, professional and consulting fees, marketing, depreciation and amortization, bad debt expense, and other related expenses to support our ongoing businesses. As a result of the USAO Investigation, the SEC Investigation and related shareholder litigation, we have incurred significant legal expenses, and we expect to continue to incur significant legal expenses pending the resolution of those matters.
Critical Accounting Policies
Critical Accounting Estimates
The preparation of the financial statements requires us to make judgments, estimates and assumptions that affect the reported amounts of assets and liabilities at the date of the financial statements and the reported amounts of revenues and expenses during the reporting period. We base our judgments, estimates and assumptions on historical experience and on various other factors that are believed to be reasonable under the circumstances. Actual results could differ materially from these estimates under different assumptions and conditions. We evaluate our judgments, estimates and assumptions on a regular basis and make changes accordingly. We believe that the judgments, estimates and assumptions involved in the accounting for the loan impairment valuation, allowance for doubtful accounts, income taxes, valuation of structured settlements and the
43
Table of Contents
valuation of investments in life settlements have the greatest potential impact on our financial statements and accordingly believe these to be our critical accounting estimates. Below we discuss the critical accounting policies associated with the estimates as well as selected other critical accounting policies. For further information on our critical accounting policies, see the discussion in Note 2 to our audited consolidated financial statements.
Life Finance Loans Receivable
We report loans receivable acquired or originated by us at cost, adjusted for any deferred fees or costs in accordance with Financial Accounting Standards Board (“FASB”) Accounting Standards Codification (“ASC”) 310-20, Receivables—Nonrefundable Fees and Other Costs, discounts, and loan impairment valuation. All loans are collateralized by life insurance policies. Interest income is accrued on the unpaid principal balance on a monthly basis based on the applicable rate of interest on the loans.
In accordance with ASC 310, Receivables, we specifically evaluate all loans for impairment based on the fair value of the underlying policies as collectability is primarily collateral dependent. The loans are considered to be collateral dependent as the repayment of the loans is expected to be provided by the underlying insurance policies. In the event of default, the borrower typically relinquishes ownership of the policy to us in exchange for our release of the debt (or we enforce our security interests in the beneficial interests in the trust that owns the policy). For loans that have lender protection insurance, we make a claim against the lender protection insurance policy and, subject to terms and conditions of the lender protection insurance policy, our lender protection insurer has the right to direct control or take beneficial ownership of the policy upon payment of our claim. For loans without lender protection insurance, we have the option of selling the policy or maintaining it on our balance sheet for investment.
We evaluate the loan impairment valuation on a monthly basis based on our periodic review of the estimated value of the underlying collateral. This evaluation is inherently subjective as it requires estimates that are susceptible to significant revision as more information becomes available. The loan impairment valuation is established as losses on loans are estimated and the provision is charged to earnings. Once established, the loan impairment valuation cannot be reversed to earnings.
In order to originate premium finance transactions our lenders required that we procure lender protection insurance. This lender protection insurance mitigates our exposure to losses which may be caused by declines in the fair value of the underlying policies. At the end of each reporting period, for loans that have lender protection insurance, a loan impairment valuation is established if the carrying value of the loan receivable exceeds the amount of coverage. The lender protection insurance program was terminated as of December 31, 2010, and all loans originated after December 31, 2010, do not carry lender protection insurance coverage. Thus, for all loans originated in 2011 and beyond, a loan impairment valuation is established if the carrying value of a loan receivable exceeds the fair value of the underlying collateral. The Company ceased originating loans in the fourth quarter of 2011.
Fair Value Option
As of July 1, 2010, we elected to adopt the fair value option, in accordance with ASC 825, Financial Instruments, to record newly-acquired structured settlements at fair value. We have the option to measure eligible financial assets, financial liabilities, and commitments at fair value on an instrument-by-instrument basis. This option is available when we first recognize a financial asset or financial liability or enter into a firm commitment. Subsequent changes in the fair value of assets, liabilities, and commitments where we have elected the fair value option are recorded in our consolidated statement of operations. We have made this election for our structured settlement assets because it is our intention to sell these assets within the next twelve months, and we believe it significantly reduces the disparity that exists between the GAAP carrying value of these structured settlements and our estimate of their economic value.
44
Table of Contents
Fair Value Measurement Guidance
We follow ASC 820, Fair Value Measurements and Disclosures, which defines fair value as an exit price representing the amount that would be received if an asset were sold or that would be paid to transfer a liability in an orderly transaction between market participants at the measurement date. As such, fair value is a market-based measurement that should be determined based on assumptions that market participants would use in pricing an asset or liability. As a basis for considering such assumptions the guidance establishes a three-level fair value hierarchy that prioritizes the inputs used to measure fair value. Level 1 relates to quoted prices in active markets for identical assets or liabilities. Level 2 relates to observable inputs other than quoted prices included in Level 1. Level 3 relates to unobservable inputs that are supported by little or no market activity and that are significant to the fair value of the assets or liabilities. Our investments in life insurance policies and structured settlements are considered Level 3 assets as there is currently no active market where we are able to observe quoted prices for identical assets and our valuation model incorporates significant inputs that are not observable. Our impaired loans are measured at fair value on a non-recurring basis, as the carrying value is based on the fair value of the underlying collateral. The method used to estimate the fair value of impaired collateral-dependent loans depends on the nature of the collateral. For collateral that has lender protection insurance coverage, the fair value measurement is considered to be Level 3 as the insured value is an observable input to the Company, but not observable to market participants. For collateral that does not have lender protection insurance coverage, the fair value measurement is considered to be Level 3 as the estimated fair value is based on a model whose significant inputs are the life expectancy of the insured and the discount rate, which are not observable.
Ownership of Life Insurance Policies
In the ordinary course of business, a large portion of our borrowers default by not paying off the loan and relinquish ownership of the life insurance policy to us in exchange for our release of the obligation to pay amounts due. We also buy life insurance policies in the secondary and tertiary markets. We account for life insurance policies that we own as investments in life settlements (life insurance policies) in accordance with ASC 325-30, Investments in Insurance Contracts, which requires us to use either the investment method or the fair value method. The election is made on an instrument-by-instrument basis and is irrevocable. We have elected to account for these life insurance policies as investments using the fair value method.
We initially record investments in life settlements at the transaction price. For policies acquired upon relinquishment by our borrowers, we determine the transaction price based on fair value of the acquired policies at the date of relinquishment. The difference between the net carrying value of the loan and the transaction price is recorded as a gain (loss) on loan payoffs and settlement. For policies acquired for cash, the transaction price is the amount paid.
Valuation of Insurance Policies
Our valuation of insurance policies is a critical component of our estimate for the loan impairment valuation and the fair value of our investments in life settlements (life insurance policies). We currently use a probabilistic method of valuing life insurance policies, which we believe to be the preferred valuation method in the industry. The most significant assumptions which we estimate are the life expectancy of the insured and the discount rate.
In determining the life expectancy estimate, we analyze medical reviews from independent secondary market life expectancy providers (each a “LE provider”). An LE provider reviews the medical records and identifies all medical conditions it feels are relevant to the life expectancy of the insured. Debits and credits are then assigned by each LE provider to the individual’s health based on these medical conditions. The debit or credit that an LE provider assigns to a medical condition is derived from the experience of mortality attributed to this condition in the portfolio of lives that it monitors. The health of the insured is summarized by the LE provider into a life assessment of the individual’s life expectancy expressed both in terms of months and in mortality factor.
45
Table of Contents
The resulting mortality factor represents an indication as to the degree to which the given life can be considered more or less impaired than a standard life having similar characteristics (e.g. gender, age, smoking, etc.). For example, a standard insured (the average life for the given mortality table) would carry a mortality rating of 100%. A similar but impaired life bearing a mortality rating of 200% would be considered to have twice the chance of dying earlier than the standard life. Historically, the Company has procured the majority of its life expectancy reports from two life expectancy report providers and only used AVS life expectancy reports for valuation purposes. Beginning in the quarter ended September 30, 2012, the Company began utilizing life expectancy reports from 21st Services for valuation purposes and began averaging or “blending,” the results of the two life expectancy reports to establish a composite mortality factor. However, when “blending” the AVS and 21st Services life expectancy reports, if the difference in the probability of mortality between the reports is greater than 150%, the Company will reduce the higher mortality factor until the difference is 150%.
The probability of mortality for an insured is then calculated by applying the blended life expectancy estimate to a mortality table. The mortality table is created based on the rates of death among groups categorized by gender, age, and smoking status. By measuring how many deaths occur before the start of each year, the table allows for a calculation of the probability of death in a given year for each category of insured people. The probability of mortality for an insured is found by applying the mortality rating from the life expectancy assessment to the probability found in the actuarial table for the insured’s age, sex and smoking status. As discussed above in Use of Updated Life Expectancies and Change in Mortality Table in Management’s Discussion and Analysis of Financial Condition and Results of Operations, the Company has historically applied an actuarial table developed by a third party. However, beginning in the quarter ended September 30, 2012, the Company transitioned to a table developed by the U.S. Society of Actuaries known as the 2008 Valuation Basic Table, or the 2008 VBT. However, because the 2008 VBT table does not account for anticipated improvements in mortality in the insured population, the table was modified in conjunction with outside consultants to reflect these expected mortality improvements. The Company believes that the change in mortality table does not materially impact the valuation of its life insurance policies and that its adoption of a modified 2008 VBT table is consistent with modified tables used by market participants and third party medical underwriters.
The mortality rating is used to create a series of best estimate probabalistic cash flows. This probability represents a mathematical curve known as a mortality curve. This curve is then used to generate a series of expected cash flows over the remaining expected lifespan of the insured and the corresponding policy. A discounted present value calculation is then used to determine the value of the policy. If the insured dies earlier than expected, the return will be higher than if the insured dies when expected or later than expected.
The calculation allows for the possibility that if the insured dies earlier than expected, the premiums needed to keep the policy in force will not have to be paid. Conversely, the calculation also considers the possibility that if the insured lives longer than expected, more premium payments will be necessary. Based on these considerations, each possible outcome is assigned a probability and the range of possible outcomes is then used to create a price for the policy.
As is the case with most market participants at December 31, 2012, the Company used a blend of life expectancies that are provided by two third-party LE providers. These are estimates of an insured’s remaining years. If all of the insured lives in the Company’s life settlement portfolio live six months shorter or longer than the life expectancies provided by these third parties, the change in fair market value would be as follows (dollars in thousands):
| Life Expectancy Months Adjustment |
Value | Change in Value |
||||||
| +6 |
95,658 | (17,783 | ) | |||||
| — |
113,441 | — | ||||||
| -6 |
132,540 | 19,099 | ||||||
46
Table of Contents
As noted above, the Company takes an average, or blend, of the two life expectancy reports to derive a composite mortality factor, unless the difference in the probability of mortality between the reports is greater than 150%. In such instances and as reflected in the fair market value at December 31, 2012, the Company will cap the higher mortality factor at amount that is 150% above the lower mortality factor, which ultimately reduces the mortality factor inputted into the Company’s fair value model. At December 31, 2012, had the Company not implemented such a cap on affected policies, the fair value of the Company’s portfolio would have increased from the reported amount by $9.5 million. Additionally, the Company lengthened the life expectancy inputs to its fair value model on 45 policies with life expectancy reports that were more than two years old at December 31, 2012 based on the average lengthening reported on the 149 policies where update life expectancy reports were received. Had the Company not implemented such an adjustment on affected policies, the fair value of the Company’s portfolio would have increased from the reported amount by $5.8 million.
The Company believes that investors in esoteric assets, such as life insurance policies, typically target yields averaging between 12%—17% for investments of more than a 5 year duration, and had historically used a 15%—17% range of discount rates to value its life insurance policies. In the third quarter of 2011 and in the immediate aftermath of becoming aware of the USAO investigation, the Company substantially increased the discount rates inputted into its fair value model as it believed that USAO Investigation along with certain unfavorable court decisions unrelated to the Company contributed to a contraction in the marketplace that has continued to reverberate. Since that time, the Company has been re-evaluating its discount rates at the end of every reporting period in order to reflect the estimated discount rates that could reasonably be used in a market transaction involving the Company’s portfolio of life insurance policies. In doing so, the Company relies on management insight, engages third party consultants to corroborate its assessment, engages in discussions with other market participants and potential financing sources and extrapolates the discount rate underlying actual sales of policies.
Although the Company believes that its entry into the Non-Prosecution Agreement had a positive effect on the market generally and for premium financed life insurance policies specifically, the Company believes that, when given the choice to invest in a policy that was associated with the Company’s premium finance business and a similar policy without such an association, all else being equal, an investor would have generally opted to invest in the policy that was not associated with the Company’s premium finance business. However, since entering into the Non-Prosecution Agreement, investors have required less of a risk premium to transact in these policies and the Company expects that, in time, investors will continue to require less of a risk premium to transact in policies associated with its premium finance business.
As of December 31, 2012, the Company owned 214 policies with an aggregate investment in life settlements of $113.4 million. Of these 214 policies, 171 were previously premium financed and are valued using discount rates that range from 16.80% to 33.80%. The remaining 43 policies are valued using discount rates that range from 14.80% to 21.30%.
The discount rate incorporates current information about market interest rates, the credit exposure to the insurance company that issued the life insurance policy and our estimate of the risk premium an investor in the policy would require. The extent to which the fair value could vary in the near term has been quantified by evaluating the effect of changes in the weighted average discount rate on the death benefit used to estimate the fair value. If the weighted average discount rate were increased or decreased by 1/2 of 1% and the other assumptions used to estimate fair value remained the same, the change in fair market value would be as follows (dollars in thousands):
| Weighted Average Rate |
Rate Adjustment | Value | Change in Value | |||||||||
| 23.51% |
-.50 | % | 116,300 | 2,859 | ||||||||
| 24.01% |
— | 113,441 | — | |||||||||
| 24.51% |
+.50 | % | 110,694 | (2,747 | ) | |||||||
47
Table of Contents
Future changes in the discount rates we use to value life insurance policies could have a material effect on our yield on life settlement transactions, which could have a material adverse effect on our business, financial condition and results of our operations.
At the end of each reporting period we re-value the life insurance policies using our valuation model in order to update our loan impairment valuation for loans receivable and our estimate of fair value for investments in policies held on our balance sheet. This includes reviewing our assumptions for discount rates and life expectancies as well as incorporating current information for premium payments and the passage of time.
Revenue/Income Recognition
Our primary sources of revenue/income are in the form of unrealized change in fair value of life settlements, agency fees, interest income, and origination fee income, servicing income and realized gains on sales of structured settlements. Our revenue/income recognition policies for these sources of revenue/income are as follows:
| • | Unrealized Change in Fair Value of Life Settlements—When the Company acquires certain life insurance policies we initially record these investments at the transaction price, which is the fair value of the policy for those acquired upon relinquishment or the amount paid for policies acquired for cash. The fair value of the investment in insurance policies is evaluated at the end of each reporting period. Changes in the fair value of the investment based on evaluations are recorded as changes in fair value of life settlements in our consolidated statement of operations. The fair value is determined on a discounted cash flow basis that incorporates current life expectancy assumptions. The discount rate incorporates current information about market interest rates, the credit exposure to the insurance company that issued the life insurance policy and our estimate of the risk premium an investor in the policy would require. |
| • | Agency Fees—Agency fees were paid by the referring life insurance agents based on negotiations between the parties and are recognized at the time a life finance loan is funded. Because agency fees are not paid by the borrower, such fees do not accrue over the term of the loan. A separate origination fee was charged to the borrower which is amortized into income over the life of the loan. |
| • | Interest Income—Interest income on life finance loans is recognized when it is realizable and earned, in accordance with ASC 605, Revenue Recognition. Discounts on structured settlement receivables are accreted over the life of the settlement using the effective interest method. |
| • | Origination Fee Income—Loans often include origination fees which are fees payable to us on the date the loan matures. The fees are negotiated at the inception of the loan on a transaction by transaction basis. The fees are accreted into income over the term of the loan using the effective interest method. |
| • | Servicing Income—We receive income from servicing life insurance policies controlled by a third party. These services include verifying premiums are paid and correctly applied and updating files for medical history and ongoing premiums. |
| • | Realized Gains on Sales of Structured Settlements—Realized gains on sales of structured settlements are recorded when the structured settlements have been transferred to a third party and we no longer have continuing involvement, in accordance with ASC 860, Transfers and Servicing. |
| • | Interest and origination income on impaired loans is recognized when it is realizable and earned in accordance with ASC 605, Revenue Recognition. Persuasive evidence of an arrangement exists through a loan agreement which is signed by a borrower prior to funding and sets forth the agreed upon terms of the interest and origination fees. Interest income and origination income are earned over the term of the loan and are accreted using the effective interest method. The interest and origination fees are fixed and determinable based on the loan agreement. For impaired loans, we do not recognize interest and origination income that we believe is uncollectible. At the end of the reporting period, we review the |
48
Table of Contents
| accrued interest and accrued origination fees in conjunction with our loan impairment analysis to determine our best estimate of uncollectible income that is then reversed. We continually reassess whether the interest and origination income are collectible as the fair value of the collateral typically increases over the term of the loan. Since our loans are due upon maturity, we cannot determine whether a loan is performing or non-performing until maturity. For impaired loans, our estimate of proceeds to be received upon maturity of the loan is generally correlated to our current fair value estimate of the collateral, but also incorporates expected increases in fair value of the collateral over the term of the loan, trends in the market, sales activity for life insurance policies and our experience with loans payoffs. |
Deferred Costs
Deferred costs include costs incurred in connection with acquiring and maintaining credit facilities and costs incurred in connection with securing lender protection insurance. These costs are amortized over the life of the related loan using the effective interest method and are classified as amortization of deferred costs in the accompanying consolidated statement of operations.
Loss in Loan Payoffs and Settlements, Net
When a premium finance loan matures, we record the difference between the net carrying value of the loan and the cash received, or the fair value of the life insurance policy that is obtained in the event of payment default, as a gain or loss on loan payoffs and settlements, net. This account was significantly impacted by the Acorn settlement, as discussed above, whereby we recorded a loss on loan payoffs and settlements, net, of $0 million, $4.1 million and $5.5 million during the years ended December 31, 2012, 2011 and 2010, respectively.
Income Taxes
Prior to our initial public offering in 2011, we converted from a Florida limited liability company to a Florida corporation (the “Conversion”). Prior to the Conversion we were treated as a partnership for federal and state income tax purposes. As a partnership our taxable income and losses were attributed to our members, and accordingly, no provision or liability for income taxes was reflected in the accompanying consolidated financial statements for periods prior to the Conversion.
After the Conversion, we began to account for income taxes in accordance with ASC 740, Income Taxes. Under ASC 740, deferred income taxes are determined based on the estimated future tax effects of differences between the financial statement and tax basis of assets and liabilities given the provisions of enacted tax laws. Deferred income tax provisions and benefits are based on changes to the assets or liabilities from year to year. In providing for deferred taxes, we consider tax regulations of the jurisdictions in which we operate, estimates of future taxable income and available tax planning strategies. If tax regulations, operating results or the ability to implement tax-planning strategies varies adjustments to the carrying value of the deferred tax assets and liabilities may be required. Valuation allowances are based on the “more likely than not” criteria of ASC 740.
At December 31, 2012 and 2011, due to the large losses and the uncertainties that resulted from the USAO Investigation, SEC investigation, Non-Prosecution Agreement and class action lawsuits, we recorded a full valuation allowance against our net deferred tax asset of $27.8 million and $11.1 million, respectively, as it is more likely than not that the net deferred tax asset is not realizable. As a result of these increases in the valuation allowance, we recorded no income tax benefit for 2012 and 2011.
The accounting for uncertain tax positions guidance under ASC 740 requires that we recognize the financial statement benefit of a tax position only after determining that the relevant tax authority would more likely than
49
Table of Contents
not sustain the position following an audit. For tax positions meeting the more-likely-than-not threshold, the amount recognized in the financial statements is the largest benefit that has a greater than 50 percent likelihood of being realized upon ultimate settlement with the relevant tax authority. We recognize interest and penalties (if any) on uncertain tax positions as a component of income tax expense.
In February of 2013 the Company was notified by the Internal Revenue Service of its intention to examine the Company’s partnership return for the year ended December 31, 2010. Audit field work for this examination has not been scheduled.
Stock-Based Compensation
We have adopted ASC 718, Compensation—Stock Compensation. ASC 718 addresses accounting for share-based awards, including stock options, with compensation expense measured using fair value and recorded over the requisite service or performance period of the award. The fair value of equity instruments awarded upon or after the closing of our initial public offering will be determined based on a valuation using an option pricing model which takes into account various assumptions that are subjective. Key assumptions used in the valuation will include the expected term of the equity award taking into account both the contractual term of the award, the effects of expected exercise and post-vesting termination behavior, expected volatility, expected dividends and the risk-free interest rate for the expected term of the award.
Investment Securities Available for Sale
Investment securities available for sale are carried at fair value, inclusive of unrealized gains and losses, and net of discount accretion and premium amortization computed using the level yield method. Net unrealized gains and losses are included in other comprehensive income (loss) net of applicable income taxes. Gains or losses on sales of investment securities available for sale are recognized on the specific identification basis.
Management evaluates securities for other than-temporary-impairment on a quarterly basis. Impairment is evaluated considering numerous factors, and their relative significance varies depending on the situation. Factors considered include the Company’s intent to hold the security until maturity or for a period of time sufficient for a recovery in value, whether it is more likely than not that the Company will be required to sell the security prior to recovery of its amortized cost basis, the length of time and extent to which fair value has been less than amortized cost, the historical and implied volatility of the fair value of the security, failure of the issuer of the security to make scheduled interest or principal payments, any changes to the rating of the security by a rating agency and recoveries or additional declines in fair value subsequent to the balance sheet date.
Gain on Maturities of Life Settlements with Subrogation Rights, net
Every credit facility entered into by subsidiaries of the Company between December 2007 and December 2010 to finance the premium finance lending business required lender protection insurance for each loan originated under such credit facility. Generally, when the Company exercises its right to foreclose on collateral the Company’s lender protection insurer has the right to direct control or take beneficial ownership of the life insurance policy, subject to the terms and conditions of the lender protection insurance policy, including notice and timing requirements. Otherwise, the lender protection insurer maintains its salvage collection and subrogation rights. The lender protection insurer’s salvage collection and subrogation rights generally provide a remedy by which the insurer can seek to recover the amount of the lender protection claim paid plus premiums paid by it, expenses and interest thereon.
In most instances where the Company has foreclosed on the collateral, the lender protection insurer has maintained its salvage collection and subrogation rights, and also covers the cost of the ongoing premiums needed to maintain certain of these life insurance policies. However, the lender protection insurer may elect at
50
Table of Contents
any time to discontinue the payment of premiums, which would result in lapse of the policies if the Company does not otherwise pay the premiums. The Company views these policies as having uncertain value because the lender protection insurer controls what happens to the policy from a payment of premium standpoint, and the amount of the lender protection insurer’s salvage collection and subrogation claim rights on any individual life insurance policy could equal the cash flow received by the Company with respect to any such policy. For these reasons, the Company does not rely on these policies for revenue generation and these policies are considered contingent
The Company accounts for the maturities of life settlements with subrogation rights, net of subrogation expenses as contingent gains in accordance with Accounting Standards Codification (ASC) 450, Contingencies and recognizes the revenue from the maturities of these policies when all contingencies are resolved.
Accounting Changes
Note 2 of the Notes to Consolidated Financial Statements discusses accounting standards adopted in 2012, as well as accounting standards recently issued but not yet required to be adopted and the expected impact of these changes in accounting standards. Any material impact of adoption is discussed in Management’s Discussion and Analysis of Financial Condition and Results of Operations and in the Notes to the Consolidated Financial Statements.
Results of Operations
The following is our analysis of the results of operations for the periods indicated below. This analysis should be read in conjunction with our financial statements, including the related notes to the financial statements. Our results of operations are discussed below in two parts: (i) our consolidated results of operations and (ii) our results of operations by segment.
51
Table of Contents
Consolidated Results of Operations (in thousands)
Imperial Holdings, Inc. and Subsidiaries
CONSOLIDATED STATEMENTS OF OPERATIONS
For the Years Ended December 31,
| 2012 | 2011 | 2010 | ||||||||||
| Income |
||||||||||||
| Agency fee income |
$ | — | $ | 6,470 | $ | 10,149 | ||||||
| Interest income |
2,014 | 8,303 | 18,660 | |||||||||
| Interest and dividends on investment securities available for sale |
391 | 640 | — | |||||||||
| Origination fee income |
500 | 6,480 | 19,938 | |||||||||
| Realized gain on sale of structured settlements |
11,509 | 5,817 | 6,595 | |||||||||
| Realized gain on life settlements, net |
151 | 5 | 1,951 | |||||||||
| Gain on forgiveness of debt |
— | 5,023 | 7,599 | |||||||||
| Unrealized change in fair value of life settlements |
(5,660 | ) | 570 | 10,156 | ||||||||
| Unrealized change in fair value of structured settlements |
1,823 | 5,302 | 2,477 | |||||||||
| Change in equity investments |
— | — | (1,284 | ) | ||||||||
| Servicing fee income |
1,183 | 1,814 | 413 | |||||||||
| Gain on maturities of life settlements with subrogation rights, net |
6,090 | 3,188 | — | |||||||||
| Other income |
1,082 | 602 | 242 | |||||||||
|
|
|
|
|
|
|
|||||||
| Total income |
19,083 | 44,214 | 76,896 | |||||||||
|
|
|
|
|
|
|
|||||||
| Expenses |
||||||||||||
| Interest expense |
1,255 | 8,524 | 28,155 | |||||||||
| Provision for losses on loans receivable |
515 | 7,589 | 4,476 | |||||||||
| Loss on loan payoffs and settlements, net |
125 | 3,837 | 4,981 | |||||||||
| Amortization of deferred costs |
1,867 | 6,076 | 24,465 | |||||||||
| Personnel costs |
16,087 | 18,933 | 12,370 | |||||||||
| Marketing costs |
5,023 | 6,104 | 5,077 | |||||||||
| Department of Justice Settlement |
— | 8,000 | — | |||||||||
| Legal fees |
26,053 | 12,097 | 3,444 | |||||||||
| Professional fees |
6,934 | 5,684 | 3,966 | |||||||||
| Insurance |
2,330 | 756 | 358 | |||||||||
| Other selling, general and administrative expenses |
3,567 | 5,812 | 5,301 | |||||||||
|
|
|
|
|
|
|
|||||||
| Total expenses |
63,756 | 83,412 | 92,593 | |||||||||
|
|
|
|
|
|
|
|||||||
| Loss before income taxes |
(44,673 | ) | (39,198 | ) | (15,697 | ) | ||||||
| Benefit for income taxes |
(39 | ) | — | — | ||||||||
|
|
|
|
|
|
|
|||||||
| Net loss |
$ | (44,634 | ) | $ | (39,198 | ) | $ | (15,697 | ) | |||
|
|
|
|
|
|
|
|||||||
Life finance Segment Results (in thousands)
| For the Year Ended December 31, | ||||||||||||
| 2012 | 2011 | 2010 | ||||||||||
| Income |
$ | 4,024 | $ | 31,499 | $ | 67,366 | ||||||
| Expenses |
17,835 | 38,949 | 68,634 | |||||||||
|
|
|
|
|
|
|
|||||||
| Segment operating loss |
$ | (13,811 | ) | $ | (7,450 | ) | $ | (1,268 | ) | |||
|
|
|
|
|
|
|
|||||||
52
Table of Contents
Structured Settlement Segment Results (in thousands)
| For the Year Ended December 31, | ||||||||||||
| 2012 | 2011 | 2010 | ||||||||||
| Income |
$ | 13,994 | $ | 11,933 | $ | 9,530 | ||||||
| Expenses |
21,547 | 21,951 | 13,066 | |||||||||
|
|
|
|
|
|
|
|||||||
| Segment operating loss |
$ | (7,553 | ) | $ | (10,018 | ) | $ | (3,536 | ) | |||
|
|
|
|
|
|
|
|||||||
Reconciliation of Segment Results to Consolidated Results (in thousands)
| Year Ended December 31, | ||||||||||||
| 2012 | 2011 | 2010 | ||||||||||
| Segment operating loss |
(21,364 | ) | (17,468 | ) | (4,804 | ) | ||||||
| Unallocated income |
||||||||||||
| Interest and dividends on investment securities available for sale |
391 | 640 | — | |||||||||
| Other income |
674 | 142 | — | |||||||||
| Unallocated expenses |
||||||||||||
| Interest expense |
4 | 297 | 3,767 | |||||||||
| Personnel costs |
707 | 2,928 | 4,364 | |||||||||
| Department of Justice |
— | 8,000 | — | |||||||||
| Legal fees |
20,047 | 7,196 | 469 | |||||||||
| Professional fees |
3,202 | 2,730 | 1,581 | |||||||||
| Insurance |
107 | 199 | 95 | |||||||||
| Other selling, general and administrative expenses |
307 | 1,162 | 617 | |||||||||
|
|
|
|
|
|
|
|||||||
| 24,374 | 22,512 | 10,893 | ||||||||||
|
|
|
|
|
|
|
|||||||
| Loss before income taxes |
(44,673 | ) | (39,198 | ) | (15,697 | ) | ||||||
| Benefit for income taxes |
(39 | ) | — | — | ||||||||
|
|
|
|
|
|
|
|||||||
| Net loss |
$ | (44,634 | ) | $ | (39,198 | ) | $ | (15,697 | ) | |||
|
|
|
|
|
|
|
|||||||
2012 Compared to 2011
Net loss for the year ended December 31, 2012 was $44.7 million as compared to a net loss of $39.2 million for the year ended December 31, 2011, an increase of $5.5 million or 14%. Total income was $19.2 million for the year ended December 31, 2012, a 57% decrease over total income of $44.2 million during the year ended in 2011. Total expenses were $63.9 million for the year ended December 31, 2012 compared to total expenses of $83.4 million incurred during the year ended December 31, 2011, a reduction of $19.5 million, or 23%.
In our life finance segment, which includes our premium finance business, its operating loss increased by $6.3 million to $13.8 million. As a result of the voluntary termination of our premium finance business, we had decreases in agency fee income of $6.5 million, interest income of $6.1 million and origination income of $6.0 million. In addition, we recorded a loss in unrealized change in fair value of life settlements, which resulted in a decrease of $6.3 million and a decrease in forgiveness of debt of $5.0 million. These decreases were offset by increase in gain on maturity of life settlements with subrogation rights, net of $2.9 million.
Life finance segment expenses were $18.0 million during the year ended December 31, 2012 compared to $39.0 million during the year ended December 31, 2011, a decline of $21.0 million, or 54%. These declines were driven primarily by a $7.1 million reduction in provision for losses on loans receivable, a $6.9 million reduction
53
Table of Contents
in interest expense, a decline in amortization of deferred costs of $4.2 million, and a decline of $3.7 million in loss on loan payoffs and settlements, net, offset by an increase of $847,000 in selling, general and administrative expenses.
Results of operations in our life finance segment were adversely impacted by the USAO Investigation and related matters. Once the premium finance loans on our balance sheet mature, we will no longer have any revenue generated from interest income and origination income from premium finance loans.
Shortly after the Company was informed on September 27, 2011 that its premium finance loan business was the subject of the USAO Investigation, the Company decided to suspend originating new premium finance loans. During the year ended December 31, 2012, we originated zero loans, compared to 55 loans originated during the year ended December 31, 2011.
As of December 31, 2012, we had loans receivable totaling $3.0 million compared to $29.4 million as of December 31, 2011, a decrease of $26.4 million, or 90%. Loans outstanding declined from 138 to 22. As a result, origination income and interest income, which accrue over the life of the loan and are therefore a function of the amount of loans outstanding, declined from $6.5 million and $7.8 million, respectively, during the year ended December 31, 2011, to $500,000 and $1.7 million, respectively, a reduction of $6.0 million and $6.1 million or 92% and 78% respectively, during the same period in 2012.
During 2011, two individuals covered under policies that were subject to subrogation claims unexpectedly passed away. The Company collected the death benefit on one of these policies in the amount of $3.2 million, net of subrogation expense. For the year ended December 31, 2012, the Company negotiated a settlement in respect of the larger policy and collected approximately $6.1 million, net of subrogation expenses. A gain from the settlement was recorded in accordance with ASC 450, Contingencies in its consolidated statement of operations for the year ended December 31, 2012 as all contingencies were resolved.
Interest expense declined to $1.3 million compared to $8.2 million, a reduction of $6.9 million or 84%, as notes payable declined from $19.3 million as of December 31, 2011 to zero as of December 31, 2012. These notes payable, the majority of which were guaranteed under LPIC which was discontinued as of December 2010, declined as premium finance loans serving as collateral for these notes matured during the year ended December 31, 2012.
Provision for losses on loans receivable was $515,000 during the year ended December 31, 2012, compared to $7.6 million during the year ended December 31, 2011, a decrease of $7.1 million or 93%. This provision records impairments on existing loans in order to adjust the carrying value of the loan receivable to the fair value of the underlying policy or when collectability of the LPIC claim payment is uncertain.
Amortization of deferred costs, which are comprised primarily of upfront premiums previously paid to the LPIC insurer, was $1.9 million during the year ended December 31, 2012 as compared to $6.1 million for 2011, a decrease of $4.2 million, or 69%. Lender protection insurance related costs accounted for $1.5 million and $4.9 million of total amortization of deferred costs during the years ended December 31, 2012 and 2011, respectively. As described previously, the lender protection insurance program was terminated as of December 31, 2010 and 5 loans with lender protection insurance remained outstanding as of December 31, 2012. Only $7,000 of lender protection insurance related costs remains to be amortized.
As of December 31, 2012, the Company owned 214 policies with a fair market value of $113.4 million compared to $90.9 million at December 31, 2011, an increase of $22.5 million or 25%. During the year ended December 31, 2012, the Company acquired 31 life insurance policies compared to 151 policies during the year ended December 31, 2011. Total aggregate death benefit of polices acquired was $166.0 million and $774.3 million for the year ended December 31, 2012 and December 31, 2011, respectively. Of the 31 policies acquired during 2012, 29 were as a result of certain of the Company’s borrowers defaulting on premium finance loans and
54
Table of Contents
relinquishing the underlying policy to the Company, compared to 14 policies acquired in the same manner for 2011. As of December 31, 2012, the aggregate death benefit of the Company’s investment in life settlements is $1.1 billion. During the year ended December 31, 2012, we sold 6 policies and wrote off 1 policy.
Of these 214 policies owned as of December 31, 2012, 171 were previously premium financed and are valued using discount rates that range from 16.80% – 33.80%. The remaining 43 policies are valued using discount rates that range from 14.80% – 21.30%.
Unrealized change in fair value of life settlements was a loss of approximately $5.7 million for the year ended December 31, 2012 compared to a gain of $570,000 for the year ended December 31, 2011, a decrease of $6.3 million. This loss was primarily driven by increased life expectancy inputs to the Company’s fair value model reflected in the updated life expectancy reports procured by the Company in respect of 149 insured lives. These reports showed that, in the aggregate, there was less health impairment and thus longer life expectancies relative to the original life expectancy reports inputted into the Company’s fair value model. The $570,000 unrealized changed in fair value recorded during the year ended December 31, 2011 included $3.0 million attributable to revisions made to the application of our valuation technique and assumptions used in our fair value calculation made in the quarter ended March 31, 2011, as described in Note 2, Principles of Consolidation and Basis of Presentation. During the year ended December 31, 2012, the 29 policies which were acquired as a result of certain of the Company’s borrowers defaulting on premium finance loans and relinquishing the underlying policy to the Company resulted in a decrease in unrealized change in fair value of $264,000 and 6 polices were sold that resulted in a gain of $291,000.
Two updated life expectancy reports show discrepancies with the previously reviewed and relied upon medical records of two insureds, resulting in significant extensions to the insureds’ life expectancies. Unrealized change in fair value of life settlements for these two policies accounted for approximately $3.3 million of the $5.7 million loss for the year ended December 31, 2012.
In our structured settlements segment, total income was $14.0 million for the year ended December 31, 2012 compared to $11.9 million in December 31, 2011, an increase of $2.1 million or 18%. This was due to an increase in transactions sold. During the year ended December 31, 2012, 1,235 structured settlements that were sold that resulted in a gain of $11.5 million compared to 979 structured settlements that were sold that resulted in a gain of $5.8 million during the year ended December 31, 2011. Unrealized change in fair value of structured settlements receivable was $1.8 million for the year ended December 31, 2012 compared to $5.3 million in 2011.
Selling, general and administrative expenses decreased by $400,000 to $21.5 million. Significant expense reductions were made in marketing costs of $1.1 million associated with a reduction in advertising and other promotional activities to drive new business and in other expenses of $1.2 million. These reductions were offset by increases in personnel costs of $400,000, professional fees of $600,000 and D&O insurance of $780,000.
This segment continues to be characterized by high growth in lead generation and sales as well as high operating costs. This led to a segment operating loss of $7.5 million during the year ended December 31, 2012, a decrease of $2.5 million over the segment operating loss of $10.0 million recorded during 2011.
Non-direct segment expense was $24.5 million compared to $22.5 million for the year ended December 31, 2012, an increase of $1.5 million or 7%. This is primarily driven by increases in legal fees of $4.8 million or 32%, offset by a reduction in personnel cost of $2.2 million, which is mainly due to a redistribution of costs directly to Company segments and a reduction in SG&A of $892,000. Total legal expenses for 2012 were $20.0 million and included $14.3 million associated with the USAO Investigation, compared $6.0 million for 2011. This figure includes $5.1 million associated with the proposed settlement of the class action litigation and derivative action. During 2011, expense totaling $8.0 million of the $22.5 million was associated with the settlement of the USAO Investigation.
55
Table of Contents
Due to the USAO Investigation, SEC investigation, Non-Prosecution Agreement and the class action lawsuits and the effect that they and related matters have had on our business, the Company determined that it was more likely than not that the net deferred tax asset at December 31, 2012 and 2011 was not realizable and accordingly, established a 100 percent valuation allowance against it net deferred tax asset at December 31, 2012 and 2011. As a consequence, the Company had no income tax provision or benefit for the years ended December 31, 2012 and 2011.
2011 Compared to 2010
Net loss for the year ended December 31, 2011 was $39.2 million as compared to a net loss of $15.7 million for the year ended December 31, 2010, a decrease of $23.5 million. Total income was $44.2 million for 2011, a 43% decrease over total income of $76.9 million during 2010. Total expenses were $83.4 million for the period compared to total expenses of $92.6 million incurred during 2010, a reduction of $9.2 million, or 10%.
In our life finance segment which includes our premium finance business, its operating loss increased by $6.2 million to $7.5 million, primarily driven by decreases in agency fee income, origination income and interest income totaling $30.6 million. Life finance segment expenses were $38.9 million in 2011 compared to $68.6 million during 2010, a decline of $29.7 million, or 43%. These declines were driven primarily by a $16.2 million reduction in interest expense, a decline in amortization of deferred costs of $18.4 million, and a decline of $1.1 million in loss on loan payoffs and settlements, net offset by an increase of $3.1 million in provision for losses on loan receivables and an increase of $2.9 million in selling, general and administrative expenses.
Results of operations in our life finance segment were adversely impacted by the USAO Investigation and related matters. During 2011, we originated 55 loans using equity capital, compared to 97 loans originated under the LPIC program during the year ended December 31, 2010. All 55 of these loans were originated during the nine months ended September 30, 2011, after which we suspended origination of premium finance loans. In connection with the Non-Prosecution Agreement, we voluntarily terminated our premium finance business and we anticipate that we will no longer be originating any premium finance loans.
This decrease in the number of loans originated resulted in a reduction in agency fees from $10.1 million during 2010 to $6.5 million during 2011, a decrease of $3.6 million. As of December 31, 2011, we had loans receivable totaling $29.4 million compared to $90.0 million as of December 31, 2010, a decrease of $60.6 million, or 67%. Loans outstanding declined from 325 to 138. As a result, origination income and interest income, which accrue over the life of the loan and are therefore a function of the amount of loans outstanding, declined from $19.9 million and $18.7 million, respectively, during the year ended December 31, 2010, to $6.5 million and $7.8 million, respectively, during the year ended December 31, 2011. Offsetting these declines were a reduction of total life finance segment expenses from $68.6 million during the year ended December 31, 2010 to $38.9 million during the year ended December 31, 2011, a decrease of $29.7 million. Interest expense declined to $8.2 million, a reduction of $16.2 million, as notes payable declined from $91.6 million in 2010 to $19.3 million in 2011. Provision for losses on loans receivable was $7.6 million during 2011, compared to $4.5 million during the year ended December 31, 2010. Provision for losses on loans receivable for uninsured loans increased during the year ended December 31, 2011, as a result of the impairment of the collateral based on decreases in the fair value of the collateral underlying those loans. Amortization of deferred costs, which are comprised primarily of upfront premiums previously paid to the LPIC insurer, were $6.1 million during the year ended December 31, 2011 compared to $24.5 million during the year ended December 31, 2010, a decline of $18.4 million. In connection with the Non-Prosecution Agreement, we voluntarily terminated our premium finance business and, as a result, we will no longer be generating agency fees that are tied directly to loan originations. Further, we will no longer generate loan, interest income, or origination income once our remaining loans mature.
As of December 31, 2011, the Company owned 190 policies with an aggregate investment in life settlements of $90.9 million. Of these 190 policies, 145 were previously premium financed and are valued using discount rates that range from 18.65% – 32.25%. The remaining 45 policies are valued using a discount rate of
56
Table of Contents
16.65%. During the year ended December 31, 2011, the Company acquired 151 life insurance policies through purchases in the secondary and tertiary markets and as a result of certain of the Company’s borrowers defaulting on premium finance loans and relinquishing the underlying policy to the Company. Total aggregate death benefit of polices acquired during the year ended December 31, 2011 was $744.3 million.
Unrealized change in fair value of life settlements was an approximately $570,000 gain for the year ended December 31, 2011. This figure was negatively affected by a $14.1 million and $13.5 million reduction in fair value during the three months ended September 30, 2011 and December 31, 2011, respectively, as a result of decreases in the fair value of the Company’s portfolio of life insurance policies, compared to $10.2 million gain for the year ended December 31, 2010. The approximately $570,000 unrealized change in fair value recorded during the year ended December 31, 2011 included $3.0 million attributable to revisions made to the application of our valuation technique and assumptions used in our fair value calculation made in the quarter ended March 31, 2011, as described in Note 2, Principles of Consolidation and Basis of Presentation. These changes impacted the unrealized change in fair value by a gain of $3.0 million on 41 life settlement policies owned as of December 31, 2010.
The Company originated 55 premium finance loans during the year ended December 31, 2011. As a result of the aforementioned changes to the estimated fair value of the loan collateral, the provision for losses on loans receivable for these uninsured loans increased by $7.9 million in the year ended December 31, 2011.
Of the 55 premium finance loans originated during the year ended December 31, 2011, 11 are the Type 2 loans. These loans have an average principal balance of approximately $549,000 compared to approximately $280,000 on Type 1 loans originated during the year ended December 31, 2011. Agency fees as a percent of the principal balance of the loans averaged 39.0% and 20.7% on Type 1 and Type 2 loans, respectively.
In the third quarter of 2011, two individuals covered under policies which were subject to subrogation claims unexpectedly passed away. The Company collected the death benefit on one of these policies in the amount of $3.5 million during the third quarter. The other was the result of an accidental death and the $10.0 million face value of the policy was larger than average. The Company did not collect the $10.0 million death benefit under this policy as of December 31, 2011. The Company accounted for each of these polices as contingent gains in accordance with ASC 450, Contingencies and recognized $3.2 million in death benefits net of subrogation expense of $312,000 in its consolidated statement of operations during the third quarter of 2011. In accordance with ASC 450, the Company expected to recognize death benefits, net of subrogation expenses on the larger policy in the second quarter of 2012. The Company believes these contingent gains to be unpredictable. No expectations for similar gains in the future should be inferred from the events occurring in the third quarter of 2011.
In our structured settlements segment, total income was $11.9 million for the year ended December 31, 2011 compared to $9.5 million in 2010, an increase of $2.4 million. This increase was due to an increase in transactions originated to 873 during the year ended December 31, 2011 compared to 565 transactions originated during the year ended December 31, 2010. Segment SG&A expenses increased by $8.9 million to $22.0 million as we continued to build our infrastructure. This led to a segment operating loss of $10.0 million during 2011 an increase of $6.5 million over segment operating loss of $3.5 million recorded during 2010.
For the period 2011, the unallocated expenses for 2011 were $22.5 million as compared to $10.9 million in 2010 an increase of $ 11.6 million. This increase was primarily due to the USAO Investigation whereby the company paid a penalty of $8.0 million coupled with legal fees of $ 6.0 million offset by a decrease in interest expense of $3.5 million.
Upon the implementation of ASC 740 in 2011, we recorded a one-time deferred tax liability of approximately $4.6 million for the federal and state tax effects of cumulative differences between financial and tax reporting which existed at the time of the Conversion. Pursuant to ASC 740 these deferred taxes were
57
Table of Contents
recorded in income tax expense, In addition, following the Conversion and prior to the initial public offering, one of our founding members entered into a reorganization that allowed us to assume the corporate shareholder’s tax attributes. These tax attributes include approximately $11.2 million of NOLs. Accordingly, in the second quarter we recorded a one-time deferred tax asset of approximately $4.3 million related to these tax attributes and this amount was recorded as an income tax benefit.
Following the conversion and prior to the initial public offering, one of the founding members entered into a reorganization that allowed the Company to assume the corporate shareholder’s tax attributes. These tax attributes include approximately $11.2 million of NOLs. During the second quarter of 2011, the Company completed an evaluation of this transaction and determined that the Company was entitled to assume the NOLs of this founding member. Accordingly, in the second quarter of 2011, the Company recorded a one-time deferred tax asset of approximately $4.3 million related to these tax attributes.
Due to the USAO Investigation and the effect that it and related matters have had on our business, the Company determined that it was more likely than not that the net deferred tax asset at December 31, 2011 was not realizable and accordingly, established a 100 percent valuation allowance against it net deferred tax asset. As a consequence, the Company had no income tax provision or benefit for the year ended December 31, 2011.
Segment Information
We operate our business through two reportable segments: life finance and structured settlements. Our segment data discussed below may not be indicative of our future operations.
58
Table of Contents
Life Finance Business
Our results of operations for our life segment for the periods indicated are as follows (in thousands):
| Year Ended December 31, | ||||||||||||
| 2012 | 2011 | 2010 | ||||||||||
| Life finance |
||||||||||||
| Income |
||||||||||||
| Agency fee income |
$ | — | $ | 6,470 | $ | 10,146 | ||||||
| Interest income |
1,685 | 7,751 | 18,326 | |||||||||
| Origination income |
500 | 6,480 | 19,938 | |||||||||
| Gain on forgiveness of debt |
— | 5,023 | 7,599 | |||||||||
| Unrealized change in fair value of life settlements |
(5,660 | ) | 570 | 10,156 | ||||||||
| Realized gain on life settlements, net |
151 | 5 | 1,951 | |||||||||
| Change in equity investments |
(1,284 | ) | ||||||||||
| Servicing fee income |
1,183 | 1,814 | 403 | |||||||||
| Gain on maturities of life settlements with subrogation rights, net |
6,090 | 3,188 | — | |||||||||
| Other |
75 | 198 | 131 | |||||||||
|
|
|
|
|
|
|
|||||||
| 4,024 | 31,499 | 67,366 | ||||||||||
|
|
|
|
|
|
|
|||||||
| Direct segment expenses |
||||||||||||
| Interest expense |
1,250 | 8,229 | 24,388 | |||||||||
| Provision for losses on loan receivables |
515 | 7,589 | 4,476 | |||||||||
| Loss on loans payoffs and settlements, net |
125 | 3,837 | 4,981 | |||||||||
| Amortization of deferred costs |
1,868 | 6,076 | 24,465 | |||||||||
| Personnel costs |
5,746 | 6,840 | 3,185 | |||||||||
| Marketing costs |
— | 16 | 3 | |||||||||
| Legal fees |
3,676 | 2,658 | 1,537 | |||||||||
| Professional fees |
1,777 | 1,831 | 1,551 | |||||||||
| Insurance |
1,115 | 237 | 110 | |||||||||
| Other selling, general and administrative expenses |
1,763 | 1,636 | 3,938 | |||||||||
|
|
|
|
|
|
|
|||||||
| 17,835 | 38,949 | 68,634 | ||||||||||
|
|
|
|
|
|
|
|||||||
| Segment operating loss |
$ | (13,811 | ) | $ | (7,450 | ) | $ | (1,268 | ) | |||
|
|
|
|
|
|
|
|||||||
2012 Compared to 2011
Income
Agency Fee Income. Agency fee income was zero for the year ended December 31, 2012 compared to $6.5 million for 2011, a decrease of $6.5 million. Agency fee income is earned solely as a function of originating loans. We did not fund any loans during the year ended December 31, 2012, compared to the 55 loans funded during 2011. As a result of the voluntary termination of our premium finance business, we did not receive any revenue from agency fees in 2012 and will not in the future.
Interest Income. Interest income was $1.7 million for the year ended December 31, 2012 compared to $7.8 million for 2011, a decrease of $6.1 million, or 78%. During the years ended December 31, 2012 and December 31, 2011, the Company originated zero and 55 loans respectively. Interest income declined as the balance of loans receivable, net decreased from $29.4 million as of December 31, 2011 to $3.0 million as of December 31, 2012 due to significant loan maturities. There were no significant changes in interest rates. The
59
Table of Contents
weighted average per annum interest rate for life finance loans outstanding as of December 31, 2012 and 2011 was 13.4% and 12.3%, respectively. As a result of the voluntary termination of our premium finance business, we will cease earning interest income once our outstanding premium finance loans mature.
Origination Fee Income. Origination fee income was $500,000 for the year ended December 31, 2012, compared to $6.5 million for 2011, a decrease of $6.0 million, or 92%. Origination fee income decreased due to a decline in the average balance of loans receivable, net, as noted above. Also, the Company reduced origination fees charged after ceasing the LPIC program, under which the majority of origination fees were passed along to the LPIC provider. Origination fees as a percentage of the principal balance of the loans originated was 25.0% during 2011. As a result of the voluntary termination of our premium finance business, we did not originate any loans or origination fees during 2012. We will cease accruing origination fee income once our outstanding premium finance loans mature.
Gain on Forgiveness of Debt. Gain on forgiveness of debt was zero for the year ended December 31 2012 compared to $5.0 million in 2011, a decrease of $5.0 million. These gains arise out of a settlement agreement with Acorn Capital in 2011. Zero loans out of 119 loans financed in the Acorn facility remained outstanding as of December 31, 2012. The gains were largely offset by a loss on loan payoffs, net related to Acorn loans of $4.1 million during 2011.
Unrealized Change in Fair Value of Life Settlements. Unrealized change in fair value of life settlements was a loss of approximately $5.7 million for the year ended December 31, 2012 compared to a gain of $570,000 in 2011, a decrease of $6.3 million. This loss was primarily driven by increased life expectancy inputs to the Company’s fair value model reflected in the updated life expectancy reports procured by the Company in respect of 149 insured lives. These reports showed that, in the aggregate, there was less health impairment and thus longer life expectancies relative to the original life expectancy reports inputted into the Company’s fair value model. The $570,000 unrealized changed in fair value recorded during the year ended December 31, 2011 included $3.0 million attributable to revisions made to the application of our valuation technique and assumptions used in our fair value calculation made in the quarter ended March 31, 2011, as described in Note 2, Principles of Consolidation and Basis of Presentation. During the year ended December 31, 2012, the 29 policies which were acquired as a result of certain of the Company’s borrowers defaulting on premium finance loans and relinquishing the underlying policy to the Company, resulted in a decrease in unrealized change in fair value of $264,000 and 6 polices were sold resulting in a gain of $291,000.
The discount rates used in the fair value calculation for the year ended December 31, 2012 ranged from 14.80% to 33.80% an increase from the range 16.65% to 32.25% rates used during 2011. See Note 14 to the accompanying consolidated financial statements.
Servicing Fee Income. Servicing income was $1.2 million for the year ended December 31, 2012 compared to $1.8 million for 2011, a decrease of $600,000 or 33%. Servicing fee income is earned in providing asset servicing for third parties, which we began providing during the fourth quarter of 2010. This decrease was primarily due to a reduction in the number of policies serviced.
Gain on Maturities of Life Settlements with Subrogation Rights, net. During 2011, two individuals covered under policies that were subject to subrogation claims unexpectedly passed away. The Company collected the death benefit on one of these polices in the amount of $3.2 million, net of subrogation expenses. In 2012 the Company negotiated a settlement in respect to the larger policy and collected approximately $6.1 million, net of subrogation expenses. A gain was reported in accordance with ASC 450, contingencies in its consolidated statement of operations for the year ended December 31, 2012 as all contingencies were resolved.
60
Table of Contents
Expenses
Interest Expense. Interest expense was $1.3 million for the year ended December 31, 2012 compared to $8.2 million for 2011, a decrease of $6.9 million, or 84%. The decrease in interest expense is due to a decline in notes payable from $19.3 million as of December 31, 2011 to zero as of December 31, 2012, a decrease of $19.3 million, or 100%.
Provision for Losses on Loans Receivable. Provision for losses on loans receivable was $515,000 during the year ended December 31, 2012, compared to $7.6 million during 2011, a decrease of $7.1 million or 93%. This provision records impairments on existing loans in order to adjust the carrying value of the loan receivable to the fair value of the underlying policy or when collectability of the LPIC claim payment is uncertain. See Notes 9, 13 and 14 to the accompanying consolidated financial statements.
Loss on Loan Payoffs and Settlements, Net. Loss on loan payoffs and settlements, net, was $125,000 for the year ended December 31, 2012 compared to $3.8 million in 2011, a decrease of $3.7 million, or 97%. In the year ended December 31, 2012, we wrote off zero loans compared to 15 loans written off in 2011, all of which were included in the Acorn settlement. Excluding the impact of the Acorn settlements, we had a loss of $125,000 and a gain of $772,000 on loan payoffs and settlements, net, for the years ended December 31, 2012 and 2011, respectively.
Amortization of Deferred Costs. Amortization of deferred costs was $1.9 million during the year ended December 31, 2012 as compared to $6.1 million for 2011, a decrease of $4.2 million, or 69%. Lender protection insurance related costs accounted for $1.5 million and $4.9 million of total amortization of deferred costs during the years ended December 31, 2012 and 2011, respectively. As described previously, the lender protection insurance program was terminated as of December 31, 2010 and 5 loans with lender protection insurance remained outstanding as of December 31, 2012. Only $7,000 of lender protection insurance related costs remains to be amortized.
Selling, General and Administrative Expenses. SG&A expenses were $14.1 million for the year ended December 31, 2012 compared to $13.2 million for 2011, an increase of $900,000 million or 7%. This was due primarily to an increase in legal expenses of $1.0 million related to two carrier rescission cases and D&O insurance expense of $863,000. These increases were offset by a decrease in personnel costs of $1.1 million mainly attributable to reduction in head count.
Adjustments to our allowance for doubtful accounts for past due agency fees are charged to bad debt expense during 2011. There was no charge to bad debt expense for agency fee receivable for the year ended December 31, 2012. Our determination of the allowance is based on an evaluation of the agency fee receivable, prior collection history, current economic conditions and other inherent risks. The allowance for doubtful accounts for past due agency fees as was $260,000 as of December 31, 2012 and 2011.
2011 Compared to 2010
Income
Agency Fee Income. Agency fee income was $6.5 million for the year ended December 31, 2011 compared to $10.1 million in 2010, a decrease of $3.6 million, or 36%. Agency fee income is earned solely as a function of originating loans. We funded 55 loans during the year ended December 31, 2011, a 43% decrease compared to the 97 loans funded during 2010 under credit facilities with lender protection insurance. The Company began originating loans using equity capital instead of debt in late February 2011 after the completion of our initial public offering. As a result of the voluntary termination of our premium finance business, we will not receive any revenue from agency fees in 2012 and beyond, and Imperial Life and Annuity has begun to voluntarily surrender its insurance agency licenses.
61
Table of Contents
Interest Income. Interest income was $7.8 million for the year ended December 31, 2011 compared to $18.3 million in 2010, a decrease of $10.5 million, or 57%. During the years ended December 31, 2011 and December 31, 2010, the Company originated 55 and 97 loans respectively. Interest income declined as the balance of loans receivable, net decreased from $90.0 million as of December 31, 2010 to $29.4 million as of December 31, 2011 due to significant loan maturities. There were no significant changes in interest rates. The weighted average per annum interest rate for life finance loans outstanding as of December 31, 2011 and 2010 was 12.3% and 11.4%, respectively. As a result of the voluntary termination of our premium finance business, we will cease earning interest income once our outstanding premium finance loans mature.
Origination Fee Income. Origination fee income was $6.5 million for the year ended December 31, 2011, compared to $19.9 million in 2010, a decrease of $13.4 million, or 68%. Origination fee income decreased due to a decline in the average balance of loans receivable, net, as noted above. Also, the Company reduced origination fees charged after ceasing the LPIC program, under which the majority of origination fees were passed along to the LPIC provider. Origination fees as a percentage of the principal balance of the loans originated was 25.0% during 2011 compared to 41.5% in 2010. As a result of the voluntary termination of our premium finance business, we will cease accruing origination fee income once our outstanding premium finance loans mature.
Gain on Forgiveness of Debt. Gain on forgiveness of debt was $5.0 million for the year ended December 31 2011 compared to $7.6 million in 2010, a decrease of $2.6 million, or 34%. These gains arise out of a settlement agreement with Acorn Capital. Zero loans out of 119 loans financed in the Acorn facility remained outstanding as of December 31, 2011. The gains were largely offset by a loss on loan payoffs, net related to Acorn loans of $4.1 million and $5.5 million during the year ended December 31, 2011, and 2010, respectively.
Unrealized Change in Fair Value of Life Settlements. Unrealized change in fair value of life settlements was a gain of approximately $570,000 for the year ended December 31, 2011 compared to $10.2 million for the year ended December 31, 2010. The change in fair value is included in unrealized change in fair value of life settlements in the accompanying consolidated statement of operations. At December 31, 2011, the Company considered the discount rate based on information that was then available and further adjusted discount rates, resulting in a weighted average discount rate of 24.31%.
Servicing Fee Income. Servicing income was $1.8 million for the year ended December 31, 2011 compared to $403,000 in 2010. Servicing fee income is earned in providing asset servicing for third parties, which we began providing during the fourth quarter of 2010.
Gain on Maturities of Life Settlements with Subrogation Rights, net. In the third quarter of 2011, two individuals covered under policies that were subject to subrogation claims passed away. The Company collected the death benefit on one of these policies in the amount of $3.5 million during the third quarter. The other was the result of an accidental death and the $10.0 million face value of the policy was larger than average. The Company had not collected the $10.0 million death benefit under this policy as of December 31, 2011. The Company accounted for the maturities of each of these polices as contingent gains in accordance with ASC 450, Contingencies and recognized $3.2 million in death benefits net of subrogation expenses of $312,000 in its consolidated statement of operations during the third quarter of 2011. In 2012, the Company negotiated a settlement in respect of the larger policy and, in accordance with ASC 450, the Company expects to recognize death benefits, net of subrogation expenses on the larger policy in the second quarter of 2012. See Note 26—Subsequent Events. No expectations for similar gains in the future should be inferred from the events occurring in the third quarter of 2011.
Expenses
Interest Expense. Interest expense was $8.2 million for the year ended December 31, 2011 compared to $24.4 million in 2010, a decrease of $16.2 million, or 66%. The decrease in interest expense was due to a decline in notes payable from $89.2 million as of December 31, 2010 to $19.3 million as of December 31, 2011, a decrease of $69.9 million, or 78%.
62
Table of Contents
Provision for Losses on Loans Receivable. Provision for losses on loans receivable was $7.6 million for the year ended December 31, 2011 compared to $4.5 million in 2010, an increase of $3.1 million. This provision records loan impairments on existing loans in order to adjust the carrying value of the loan receivable to the fair value of the underlying policy. For 2011, the provision for losses on loans receivable increased in the latter half of the year as a result of the decline in the estimated fair value of the collateral due to the higher discount rate we applied in the fair value model. See Notes 10, 15 and 16 to the accompanying consolidated financial statements.
Loss on Loan Payoffs and Settlements, Net. Loss on loan payoffs and settlements, net, was $3.8 million for the year ended December 31, 2011 compared to $5.0 million in 2010, a decrease of $1.2 million, or 23%. In the year ended December 31, 2011, we wrote off 15 loans compared to 22 loans written off in the year ended December 31, 2010, all of which were included in the Acorn settlement. Excluding the impact of the Acorn settlements, we had a gain on loan payoffs and settlements, net, of approximately $772,000 and a $500,000 for the years ended December 31, 2011 and 2010, respectively.
Amortization of Deferred Costs. Amortization of deferred costs was $6.1 million during the year ended December 31, 2011 as compared to $24.5 million in 2010, a decrease of $18.4 million, or 75%. Lender protection insurance related costs accounted for $4.9 million and $20.7 million of total amortization of deferred costs during the years ended December 31, 2011 and 2010, respectively. As described previously, the lender protection insurance program was terminated as of December 31, 2010 and 91 loans with lender protection insurance remained outstanding as of December 31, 2011. Only $1.1 million of lender protection insurance related costs remain to be amortized as of the same date.
Selling, General and Administrative Expenses. Selling, general and administrative expenses were $13.2 million for the year ended December 31, 2011 compared to $10.3 million in 2010, an increase of $2.9 million or 28%. This increase was due primarily to an increase in personnel expenses of $500,000 due to hiring additional employees, $1.1 million in stock-based compensation and employee bonuses in connection with our IPO, expenses related to a work-force reduction at the end of 2011 and an increase in legal fees of $1.1 million.
Adjustments to our allowance for doubtful accounts for past due agency fees are charged to bad debt expense. Our determination of the allowance is based on an evaluation of the agency fee receivable, prior collection history, current economic conditions and other inherent risks. The allowance for doubtful accounts for past due agency fees as of December 31, 2011 was $260,000 as compared to $205,000 as of December 31, 2010. Throughout 2011, we continued to evaluate the collectability of agency fee receivables and recorded approximately $82,000 in bad debt expense during the year ended December 31, 2011.
63
Table of Contents
Structured Settlements
Our results of operations for our structured settlement business segment for the periods indicated are as follows (in thousands):
| Year Ended December 31, | ||||||||||||
| 2012 | 2011 | 2010 | ||||||||||
| Income |
||||||||||||
| Realized gain on sale of structured settlements |
$ | 11,509 | $ | 5,817 | $ | 6,595 | ||||||
| Interest income |
329 | 553 | 334 | |||||||||
| Unrealized change in fair value of structured settlements |
1,822 | 5,302 | 2,477 | |||||||||
| Servicing fee income |
— | — | 11 | |||||||||
| Other income |
334 | 261 | 113 | |||||||||
|
|
|
|
|
|
|
|||||||
| 13,994 | 11,933 | 9,530 | ||||||||||
|
|
|
|
|
|
|
|||||||
| Direct segment expenses |
||||||||||||
| Personnel costs |
9,634 | 9,170 | 4,821 | |||||||||
| Marketing costs |
5,023 | 6,088 | 5,034 | |||||||||
| Legal fees |
2,331 | 2,243 | 1,438 | |||||||||
| Professional fees |
1,955 | 1,418 | 834 | |||||||||
| Insurance |
1,108 | 320 | 153 | |||||||||
| Other selling, general and administrative expenses |
1,496 | 2,712 | 786 | |||||||||
|
|
|
|
|
|
|
|||||||
| 21,547 | 21,951 | 13,066 | ||||||||||
|
|
|
|
|
|
|
|||||||
| Segment operating loss |
$ | (7,553 | ) | $ | (10,018 | ) | $ | (3,536 | ) | |||
|
|
|
|
|
|
|
|||||||
| Consolidated |
||||||||||||
2012 Compared to 2011
Income
Interest Income. Interest income was $329,000 for year ended December 31, 2012 compared to $553,000 for 2011, a decrease of $224,000 or 41% as a result of a reduction of the asset held during the year ended December 31, 2011. Interest income is accretion during the period on the structured settlement assets held on our balance sheet.
Realized Gain on Sale of Structured Settlements. During the year ended December 31, 2012, 1,235 structured settlements were sold which resulted in a gain of $11.5 million compared to 601 structured settlements sold with a gain of $5.8 million during the year ended December 31, 2011. Segment financing costs remained high during the first three quarters of 2012 as a result of the USAO Investigation, which impacted the realized gain on sale of structured settlements.
Unrealized Change in Fair Value of Structured Settlement Receivables. Unrealized change in fair value of investments and structured receivables was $1.8 million for the year ended December 31, 2012 compared to $5.3 million for the same period in 2011. At December 31, 2012 we had 37 structured receivables on our balance sheet compared with 288 structured settlement receivables on our balance sheet as of December 31, 2011. The large decrease was due to the Company’s ability to finance these receivables in the dedicated Imperial Settlements Financing 2010, LLC financing facility during 2012.
64
Table of Contents
Expenses
Selling, General and Administrative Expenses. Selling, general and administrative expenses decreased by $400,000 to $21.5 million for the year ended December 21, 2012. Significant expense reductions were made in marketing costs of $1.1 million associated with a reduction in advertising and other promotional activities to drive new business and in other expenses of $1.2 million. These reductions were offset by increases in personnel costs of $400,000, professional fees of $600,000 and D&O insurance of $780,000.
This segment continues to be characterized by high growth in lead generation and sales, as well as high operating costs. This led to a segment operating loss of $7.5 million during the year ended December 31, 2012, a decrease of $2.5 million over the segment operating loss of $10.0 million recorded during year ended December 31, 2011.
2011 Compared to 2010
Income
Interest Income. Interest income was $553,000 for year ended December 31, 2011 compared to $334,000 for 2010, an increase of $219,000.
Realized Gain on Sale of Structured Settlements. Realized gain on sale of structured settlements was $5.8 million for the year ended December 31, 2011 compared to $6.6 million in 2010. During the year ended December 31, 2011, we sold 601 of structured settlements for a gain of $5.8 million. During the year ended December 31, 2010, we sold 630 structured settlements for a gain of $6.6 million. Included in these 2010 results was a portfolio purchase and sale of 131 transactions that resulted in a gain of $64,000.
Unrealized Change in Fair Value of Structured Settlement Receivables. Unrealized change in fair value of investments and structured receivables was $5.3 million for the year ended December 31, 2011 compared to $2.5 million for the same period in 2010. At December 31, 2011 we had 288 structured receivables on our balance sheet compared with 84 structured settlement receivables on our balance sheet as of December 30, 2010. The large increase was due to the Company’s inability to finance these receivables in the dedicated financing facility
Expenses
Selling, General and Administrative Expenses. Selling, general and administrative expenses $22.0 million for the year ended December 31, 2011 compared to $13.1 million in December 31, 2010, an increase $8.9 million or 68%. This increase was due in part to an increase in personnel expenses of 5.8 million due to due to hiring additional employees throughout 2011 and stock-based compensation and employee bonuses in connection with our initial public offer in 2011. In addition, we recorded additional indirect variable expenses associated with the increase in the number of structured settlements originated during the period, including an increase in advertising of $1.2 million, an increase in legal expenses $804,000, an increase in office supplies professional fees of approximately $512,000 and a net increase in other expenses of approximately $600,000.
Liquidity and Capital Resources
We anticipate that our liquidity needs for 2013 and for 2014 will be in excess of the amounts of cash and cash equivalents held by the Company as of December 31, 2012, as a result of matters associated with the USAO and SEC Investigations and related shareholder litigation. The Company has expended considerable resources resolving the USAO Investigation, as well as responding to the SEC investigation and related litigation, advancing indemnification costs on behalf of certain employees and in conducting an independent investigation of the facts and circumstances surrounding the USAO Investigation. As of December 31, 2012, the Company’s cumulative legal and related fees in respect of these matters were $29.1 million, including $22.3 million paid during the year ended December 31, 2012.
65
Table of Contents
We believe we will continue to spend significant amounts on legal matters related to the USAO and SEC investigations, shareholder litigation and other potential claims over the next year, and possibly beyond. We expect to meet our liquidity needs for the next year primarily through our cash resources and, to a lesser extent, through cash flows from sales and financings of structured settlements. We have only purchased 2 life insurance policies during the 12 months ended December 31, 2012 in an effort to conserve capital, are seeking capital and may also sell certain life insurance policies in our portfolio. We may also seek to reduce our operating expenses in order to preserve the value of our existing portfolio of policies, and/or, under certain scenarios, lapse or sell certain of our policies or some combination of the above. The lapsing of policies, if any, would create losses as such assets would be written down to zero. In connection with the Non-Prosecution Agreement, we have ceased originating new premium finance loans. We expect debt maturities to be covered by cash receipts from LPIC claims as discussed further below, and we do not currently have any material planned capital expenditures.
We estimate that we will need to pay $27.7 million in premiums to keep our current portfolio of life insurance policies in force through 2013. As of December 31, 2012, we had approximately $19.1 million of cash and cash equivalents, and marketable securities, including $1.1 million of restricted cash. Additionally, we have not yet experienced the mortalities of insureds or received the resulting death benefits from our life insurance policies (other than from policies with subrogation rights that are not reported on our balance sheet and that are considered contingent assets). On March 27, 2013, a subsidiary of the Company borrowed $45 million under an 18-month bridge facility. The facility was funded by entities affiliated with certain of the Company’s shareholders, Indaba Capital Management, LLC, Brooklyn Capital Management, LLC, Nantahala Capital Management LLC and NS Advisors LLC, and is secured by substantially all of the Company’s life insurance policies. This facility should provide the Company with adequate liquidity to pay premiums on its portfolio of life insurance through December 31, 2013.
The Company also expects during the next 12 months that, as part of the framework for the settlement embodied by the Term Sheet, it will, among other things, agree to pay $1.0 million of a $12.0 million payment to settle the class action litigation and will agree to contribute $500,000 to a trust to cover certain claims under its director and officer liability insurance policies, which will further stress the Company’s liquidity position. In addition, under the Term Sheet, the Company will undertake to advance legal fees and indemnify certain individuals covered under the director and officer liability insurance policies. The obligation to advance and indemnify on behalf of these individuals, while currently unquantifiable, may be substantial and could have an adverse effect on the Company’s financial position and results of operations.
Financing Arrangements Summary
Bridge Facility
On March 27, 2013, Greenwood, as issuer, and the Company and OLIPP IV, LLC, as guarantors, entered into an indenture with Wilmington Trust Company, as indenture trustee, under which an aggregate principal amount of $45 million in 12% increasing rate senior secured bridge notes were issued (the “Bridge Facility”).
Interest under the Bridge Facility accrues at 12% per annum for the first nine months from the issue date, and increases by 600 basis points thereafter to 18% per annum. Up to 25% of the net proceeds from the Bridge Facility after transaction expenses may be used by the Company for general corporate purposes, including for premium payments on life insurance policies not owned by Greenwood, with the balance used to pay fees and expenses associated with the Bridge Facility and for premiums on life insurance policies owned by Greenwood. The Bridge Facility is guaranteed by the Company and secured by the cash on account at Greenwood and its portfolio of life insurance policies. The Bridge Facility is also secured by pledges of the equity interests of Greenwood’s direct parent and each subsidiary of the Company, other than its licensed life settlement provider, that holds life insurance policies that are not subject to the subrogation rights of the Company’s lender protection insurance carrier.
66
Table of Contents
Notes under the Bridge Facility were issued at 92% of their face amount and are pre-payable at par at any time. The Bridge Facility is subject to mandatory prepayment provisions upon the issuance of additional debt, equity raises and asset sales. Mandatory prepayments are generally at par although certain asset sales and a change of control each trigger a mandatory prepayment obligation at 109%. The Bridge Facility requires the maintenance of a 2 times asset coverage ratio and six months of cash on hand to pay interest on the Bridge Facility and premiums on life insurance policies owned by Greenwood. Upon a failure to maintain requisite cash on hand, the Company may be obligated to sell policies to repay the lenders under the Bridge Facility.
Structured Settlement Financing Arrangements
8.39% Fixed Rate Asset Backed Variable Funding Notes. We formed Imperial Settlements Funding (“ISF”) as a subsidiary of Washington Square Financial, LLC (“WSF”) to serve as a special purpose financing entity to allow us to borrow against certain of our structured settlements and assignable annuities, which we refer to as receivables, to provide us liquidity. On September 24, 2011, we entered into an arrangement to provide financing up to $50 million in financing. Under this arrangement, a subsidiary of Partner Re, Ltd., or the noteholder, became the initial holder of ISF 2011’s 8.39% Fixed Rate Asset Backed Variable Funding Notes issued under a master trust indenture and related indenture supplement, or the indenture, pursuant to which the noteholder has committed to advance up to $50 million upon the terms and conditions set forth in the indenture. The note is secured by the receivables that ISF 2011 acquires from Washington Square from time to time. The note is due and payable on or before January 1, 2057, but principal and interest must be repaid pursuant to a schedule of fixed payments from the receivables that secure the notes. The arrangement generally has a concentration limit of 15% for the providers of the receivables that secure the notes. Wilmington Trust is the collateral trustee.
Upon the occurrence of certain events of default under the indenture, all amounts due under the note are automatically accelerated. ISF 2011 is subject to several restrictive covenants under the terms of the indenture. The restrictive covenants include that ISF 2011 cannot: (i) create, incur, assume or permit to exist any lien on or with respect to any assets other than certain permitted liens, (ii) create, incur, assume, guarantee or permit to exist any additional indebtedness, (iii) declare or pay any dividend or other distribution on account of any equity interests of ISF 2011 other than certain permitted distributions from available cash, (iv) make any repurchase or redemption of any equity interests of ISF 2011 other than certain permitted repurchases or redemptions from available cash, (v) enter into any transactions with affiliates other than the transactions contemplated by the indenture, or (vi) liquidate or dissolve.
During the third quarter of 2011, the Company suspended financing under this agreement, but resumed financing on January 12, 2012 pursuant to an acknowledgement that provided for WSF to make a $258,000 payment in respect of, the transfer of the ownership of certain lock-box accounts associated with the facility. As of December 31, 2012, the Company had available commitments under this facility of $6.8 million. We also have other parties to whom we have sold term-certain structured settlement assets and to whom we believe we can sell such assets in the future.
The Life-contingent Structured Settlement Facility. On December 30, 2011, WSF entered into a forward purchase and sale agreement (“PSA”) to sell up to $40.0 million of life-contingent structured settlement receivables to Compass Settlements, LLC (“Compass”). Subject to predetermined eligibility criteria and on-going funding conditions, Compass committed, in increments of $5.0 million, up to $40.0 million to purchase life-contingent structured settlement receivables from WSF. The PSA obligates WSF to sell the eligible life-contingent structured settlement receivables it originates to Compass on an exclusive basis for twenty-four months, subject to Compass maintaining certain purchase commitment levels. Additionally, the Company agreed to guaranty WSF’s obligation to repurchase any ineligible receivables sold under the PSA and certain other related obligations. As of December 31, 2012, the Company had available commitments under this facility of $6.6 million.
67
Table of Contents
Premium Finance Loan Maturities
The following table summarizes the maturities of our premium finance loans outstanding as of December 31, 2012 (dollars in thousands):
| Year Ending 12/31/2013 |
||||
| Carrying value (loan principal balance, accreted origination fees, and accrued interest receivable) |
$ | 8,073 | ||
| Weighted average per annum interest rate |
13.8 | % | ||
| Per annum origination fee as a percentage of the principal balance of the loan at origination |
12.2 | % | ||
Cash Flows
The following table summarizes our cash flows from operating, investing and financing activities for the years ended December 31, 2012, 2011 and 2010 (in thousands):
| Year Ended December 31, | ||||||||||||
| 2012 | 2011 | 2010 | ||||||||||
| Statement of Cash Flows Data: |
||||||||||||
| Total cash (used in) provided by: |
||||||||||||
| Operating activities |
$ | (38,142 | ) | $ | (46,362 | ) | $ | (27,796 | ) | |||
| Investing activities |
48,636 | (92,542 | ) | 102,956 | ||||||||
| Financing activities |
(19,747 | ) | 140,935 | (76,827 | ) | |||||||
|
|
|
|
|
|
|
|||||||
| (Decrease) increase in cash and cash equivalents |
$ | (9,254 | ) | $ | 2,031 | $ | (1,667 | ) | ||||
|
|
|
|
|
|
|
|||||||
Operating Activities
Net cash used in operating activities for the year ended December 31, 2012 was $38.1 million, a decrease of $8.3 million from $46.4 million of cash used in operation activities in 2011. The decrease was mainly due to a reduction in accounts payable and accrued expenses of $19.1 million and interest payable of $1.3 million as a result of paying down loans outstanding. These were offset by increased structured settlement receivables of $18.4 million, other liabilities of $20.1 million, which is mainly attributable to liabilities associated with the class action and derivative action proposed settlement, prepaid expenses and other assets of $8.8 million that are mainly associated with insurance coverage for Directors and Officers, insurance recoverable related to the class action and derivative proposed settlement and deposits of $2.0 million.
Net cash used in operating activities for the year ended December 31, 2011 was $46.4 million, an increase of $18.6 million from $27.8 million of cash used in operation activities in 2010. The increase was primarily due to a decrease of a $3.1 million in the collection of agency fees, an increase of $3.6 million in payroll and related costs and an $11.9 million increase in legal fees due to the USAO Investigation and other expenses during the period.
Investing Activities
Net cash provided by investing activities for the year ended December 31, 2012 was $48.6 million, an increase of $141.2 million from $92.5 million of cash used in investing activities in 2011. The increase was primarily due to $10.3 million increase in proceeds from the sale and repayment of investment securities available-for-sale, $51.8 million decrease in originations of loans receivable, $45.4 million decrease in cash proceeds from loan payoffs and lender protection insurance claims received in advance and $5.6 million increase in proceeds from sale of life settlements. These were offset by $92.5 million decrease in purchases of investment securities available-for-sale, $11.4 million increase in premiums paid on investments in life settlements and $50.4 million decrease in purchases of life insurance policies.
68
Table of Contents
Net cash used in investing activities for the year ended December 31, 2011 was $92.5 million, an increase of $195.5 million from $103.0 million of cash provided in investing activities in 2010. The increase was primarily due to a $128.0 million increase in purchases of investment securities available-for-sale, a $77.1 million decrease in cash proceeds from loan payoffs and lender protection insurance claims received in advance, a $49.2 million increase in purchases of life insurance policies, and a $15.6 million increase in premiums paid on investments in life settlements, offset by a $69.5 million increase in proceeds from the sale and repayment of investment securities available-for-sale and a decrease of $6.0 million in originations of loans receivable during the period.
Financing Activities
Net cash used in financing activities for the year ended December 31, 2012 was $19.7 million, a decrease of $160.6 million from $140.9 million of cash provided by investing activities in 2011. The decrease was primarily due to a decrease of $174.2 million in proceeds from our initial public offering, net of offering costs, $16.9 million decrease in cash used in the repayment of borrowings under credit facilities, $2.6 million decrease in borrowings from affiliates and a $234,000 decrease in borrowings under credit facilities.
Net cash provided by financing activities for the year ended December 31, 2011 was $140.9 million, an increase of $217.8 million from $76.8 million of cash used in investing activities in 2010. The increase was primarily due to an increase of $174.2 million in proceeds from our initial public offering, net of offering costs and a $93.2 million decrease in cash used in the repayment of borrowings from affiliates offset by a $45.7 million decrease in borrowings under credit facilities and from affiliates during the year ended December 31, 2011.
Contractual Obligations
The following table summarizes our contractual obligations as of December 31, 2012 (in thousands):
| Total | Due in Less than 1 Year |
Due 1-3 Years |
Due 3-5 Years |
More than 5 Years |
||||||||||||||||
| Operating leases |
$ | 1,024,234 | $ | 547,051 | $ | 477,183 | — | — | ||||||||||||
Inflation
Our assets and liabilities are, and will be in the future, interest-rate sensitive in nature. As a result, interest rates may influence our performance far more than does inflation. Changes in interest rates do not necessarily correlate with inflation or changes in inflation rates. We do not believe that inflation had any material impact on our results of operations in the periods presented in our financial statements presented in this report.
Off-Balance Sheet Arrangements
Except as described below in “—Subrogation Rights, Net,” there are no off-balance sheet arrangements between us and any other entity that have, or are reasonably likely to have, a current or future effect on our financial condition, changes in financial condition, revenues or expenses, results of operations, liquidity, capital expenditures or capital resources that is material to stockholders.
Subrogation Rights, Net
As described above in “—Critical Accounting Policies—Gain on Maturities of Life Settlements with Subrogation Rights, Net,” the Company considers policies that it acquired as a result of borrower default as contingent assets and does not include those policies in the amount of life settlement policies on its consolidated balance sheet. In the third quarter of 2011, two individuals covered under policies that were subject to subrogation claims passed away. The Company collected the death benefit on one of these policies in the amount of $3.5 million during the third quarter of 2011.
69
Table of Contents
The other was the result of an accidental death and the $10.0 million face value of the policy was larger than average. In the second quarter of 2012, the Company negotiated a settlement in respect of the larger policy and collected approximately $6.1 million, net of subrogation expenses of 910,000, in respect of the larger policy and reported a gain in accordance with ASC 450, Contingencies in its consolidated statement of operations for the second quarter of 2012. The Company believes these contingent gains to be unpredictable because the lender protection insurer can discontinue paying the premiums necessary to keep policies subject to subrogation and salvage claims in force at any time and the amount of the lender protection insurer’s subrogation and salvage claim on any individual life insurance policy could, and in time will, equal the cash flow received by the Company with respect to any such policy. No expectations for similar gains in the future should be inferred from these contingent gains.
Item 7A. Quantitative and Qualitative Disclosures about Market Risk
Market risk is the risk of potential economic loss principally arising from adverse changes in the fair value of financial instruments. The major components of market risk are credit risk, interest rate risk and foreign currency risk. We have no exposure in our operations to foreign currency risk.
Credit Risk
In our life finance business segment, with respect to life insurance policies collateralizing our loans or that we acquire upon relinquishment, credit risk consists primarily of the potential loss arising from adverse changes in the financial condition of the issuers of the life insurance policies. We manage our credit risk related to these life insurance policy issuers by generally only funding premium finance loans for policies issued by companies that have a credit rating of at least ““A” by Standard & Poor’s, at least “A2” by Moody’s, at least “A” by A.M. Best Company or at least “A-” by Fitch. At December 31, 2012, all of our loan collateral was for policies issued by companies rated “investment grade” (credit ratings of “A+” to “BBB-”) by Standard & Poor’s, and we owned 7 policies issued by a carrier rated below investment grade.
The following table shows the percentage of the total number of loans outstanding with lender protection insurance and the percentage of our total loans receivable balance covered by lender protection insurance as of the dates indicated below:
| December 31, | ||||||||||||
| 2012 | 2011 | 2010 | ||||||||||
| Percentage of total number of loans outstanding with lender protection insurance |
22.7 | % | 65.9 | % | 93.9 | % | ||||||
| Percentage of total loans receivable, net balance covered by lender protection insurance |
3.0 | % | 70.1 | % | 94.1 | % | ||||||
For the loans that had lender protection insurance and that matured during the years ended December 31, 2012 and December 31, 2011, the lender protection insurance claims paid to us were 95.5 % and 94.7 %, respectively, of the contractual amount of the insured loans.
70
Table of Contents
Our premium finance loans are originated with borrowers residing throughout the United States. We do not believe there are any geographic concentrations of loans that would cause them to be similarly impacted by economic or other conditions. However, there is concentration in the life insurance carriers that issued these life insurance policies that serve as our loan collateral. The following table provides information about the life insurance issuer concentrations that exceed 10% of total death benefit of the collateral and 10% of outstanding loan balance as of December 31, 2012:
| Carrier |
Percentage of Total Outstanding Loan Balance |
Percentage of Total Death Benefit |
Moody’s Rating |
S&P Rating |
||||||||||||
| Lincoln National Life Insurance Company |
38.7 | % | 24.3 | % | A2 | AA- | ||||||||||
| Lincoln Benefit Life Company |
21.0 | % | 16.7 | % | A2 | A | ||||||||||
| AXA Equitable Life Insurance Company |
15.8 | % | 29.6 | % | Aa3 | AA- | ||||||||||
As of December 31, 2012, our lender protection insurer, Lexington, had a financial strength rating of “A” with a stable outlook by Standard & Poor’s.
The following table provides information about the life insurance issuer concentrations that exceed 10% of total death benefit and 10% of total fair value of our investments in life settlements as of December 31, 2012:
| Carrier |
Percentage of Total Fair Value |
Percentage of Total Death Benefit |
Moody’s Rating |
S&P Rating |
||||||||||||
| Lincoln National Life Insurance Company |
19.7 | % | 15.2 | % | A2 | AA- | ||||||||||
| AXA Equitable Life Insurance Company |
11.9 | % | 13.5 | % | Aa3 | A+ | ||||||||||
In our structured settlements segment, credit risk consists of the potential loss arising principally from adverse changes in the financial condition of the issuers of the annuities that arise from a structured settlement. Although certain purchasers of structured settlements may require higher credit ratings, we manage our credit risk related to the obligors of our structured settlements by generally requiring that they have a credit rating of “A-” or better by Standard & Poor’s. The risk of default in our structured settlement portfolio is mitigated by the relatively short period of time that we hold structured settlements as investments. We have not experienced any credit losses in this segment and we believe such risk is minimal.
Interest Rate Risk
In our life finance segment, most of our credit facilities and promissory notes provide us with fixed-rate financing. Therefore, fluctuations in interest rates currently have minimal impact, if any, on our interest expense under these facilities. However, increases in interest rates may impact the rates at which we are able to obtain financing in the future.
We currently earn revenue from interest charged on loans and loan origination fees. In addition, we earn income on the unrealized changes in fair value of life insurance policies we acquire in the life settlement and secondary markets. However, if the fair value of the life insurance policies we own decreases, we record this reduction as a loss. We receive interest income that accrues over the life of the life finance loan and is due at maturity. Substantially all of the interest rates we charged on our premium finance loans were floating rates that are calculated at the one-month LIBOR rate plus an applicable margin. In addition, our life finance loans have a floor interest rate and are capped at 16.0% per annum. For loans with floating rates, each month the interest rate is recalculated to equal one-month LIBOR plus the applicable margin, and then, if necessary, adjusted so as to remain at or above the stated floor rate and at or below the capped rate of 16.0% per annum. While the floor and cap interest rates mitigate our exposure to changes in interest rates, our interest income may nonetheless be impacted by changes in interest rates. Origination fees are fixed and are therefore not subject to changes based on movements in interest rates, although we do charge interest on origination fees.
71
Table of Contents
As of December 31, 2012, we owned investments in life settlements (life insurance policies) in the amount of $113.4 million. A rise in interest rates could potentially have an adverse impact on the sale price if we were to sell some or all of these assets. There are several factors that affect the market value of life settlements (life insurance policies), including the age and health of the insured, investors’ demand, available liquidity in the marketplace, duration and longevity of the policy, and interest rates. We currently do not view the risk of a decline in the sale price of life settlements (life insurance policies) due to normal changes in interest rates as a material risk.
In our structured settlements segment, our profitability is affected by levels of and fluctuations in interest rates. Such profitability is largely determined by the difference , or “spread,” between the discount rate at which we purchase the structured settlements and the discount rate at which we can resell these assets or the interest rate at which we can finance those assets. Structured settlements are purchased at effective yields that are fixed, while rates at which structured settlements are sold, with the exception of forward purchase arrangements, are generally a function of the prevailing market rates for short-term borrowings. As a result, increases in prevailing market interest rates after structured settlements are acquired could have an adverse effect on our yield on structured settlement transactions. Currently, we do not view this risk to be material because nearly all of our structured settlements acquired are sold into forward purchase arrangements.
Risks Associated with Investments Securities Available for Sale
Imperial purchases fixed income securities and U.S. treasuries to provide consistent investment income, may or may not preserve capital unless held to maturity and provide liquidity to fund expected premium payments. Changes in market interest rates associated with Imperial’s investment securities could have a material adverse effect on Imperial’s carrying value of its securities. Temporary changes in the carrying value of securities classified as available for sale are reflected, net of taxes, as a component of stockholders’ equity, while other-than-temporary impairment charges, if any, are recorded in earnings.
Item 8. Financial Statements and Supplementary Data
The financial statements required by this Item are included in Item 15 of this Annual Report on Form 10-K and are presented beginning on page F-1.
Item 9. Changes in and Disagreements with Accountants on Accounting and Financial Disclosure
Not Applicable.
Item 9A. Controls and Procedures
Evaluation of Disclosure Controls and Procedures
Our management, with the participation of our chief executive officer and chief financial officer, conducted an evaluation of our disclosure controls and procedures, as such term is defined under Rule 13a-15(e) promulgated under the Securities Exchange Act of 1934, as amended (the “Exchange Act”). Based on this evaluation, our chief executive officer and chief financial officer concluded that our disclosure controls and procedures were effective as of the end of the period covered by this Annual Report on Form 10-K.
Management’s Report on Internal Control Over Financial Reporting
Management of Imperial Holdings, Inc. is responsible for establishing and maintaining adequate internal control over financial reporting, as defined in Rule 13a-15(f) of the Exchange Act. The Company’s management, with the participation of our chief executive officer and chief financial officer, conducted an evaluation of the effectiveness of our internal control over financial reporting based on the framework in Internal Control—
72
Table of Contents
Integrated Framework issued by the Committee of Sponsoring Organizations of the Treadway Commission published in 1987. Based on that evaluation, management concluded that our internal control over financial reporting was effective as of December 31, 2012.
Changes in Internal Control Over Financial Reporting
There were no changes in our internal control over financial reporting during the fourth quarter ended December 31, 2012 that materially affected, or are reasonably likely to materially affect, our internal control over financial reporting.
None
73
Table of Contents
PART III
Item 10. Directors, Executive Officers and Corporate Governance
The information relating to the directors and officers of the Company, information regarding compliance with Section 16(a) of the Exchange Act and information regarding the audit committee and audit committee financial expert is incorporated herein by reference to the Company’s Proxy Statement for the 2013 Annual Meeting of Stockholders (the “Proxy Statement”) to be filed 120 days after December 31, 2012.
All of the Company’s directors, officers and employees must act in accordance with the Code of Ethics, which has been adopted by the Company’s Board of Directors. A copy of the Code of Ethics is available on the Company’s website at www.imperial.com in the “Investor Relations” section, under the Corporate Governance tab. The Company intends to satisfy the disclosure requirement under Item 5.05 of Form 8-K regarding disclosure of an amendment to, or waiver from, a provision of this Code of Ethics with respect to its principal executive officer, principal financial officer, principal accounting officer or persons performing similar functions, by posting such information on the Company’s website discussed above, unless a Form 8-K is otherwise required by law or applicable listing rules.
Item 11. Executive Compensation
The information regarding executive compensation is incorporated herein by reference to the Proxy Statement to be filed within 120 days after December 31, 2012.
Item 12. Security Ownership of Certain Beneficial Owners and Management and Related Stockholder Matters
Information setting forth the security ownership of certain beneficial owners and management is hereby incorporated by reference to the Proxy Statement to be filed within 120 days after December 31, 2012.
Shown below is certain information as of December 31, 2012 regarding equity compensation plans:
| Plan category |
Number of securities to be issued upon exercise of outstanding options and warrants (a) |
Weighted- average exercise price of outstanding options and warrants (b) |
Number of securities remaining available for future issuance under equity compensation plans (excluding securities reflected in column (a)) (c) |
|||||||||
| Equity compensation plans approved by security holders |
N/A | N/A | N/A | |||||||||
| Equity compensation plans not approved by security holders |
4,727,935 | 14.12 | 569,074 | |||||||||
|
|
|
|
|
|
|
|||||||
| Total |
4,727,935 | 14.12 | 569,074 | |||||||||
|
|
|
|
|
|
|
|||||||
Item 13. Certain Relationships and Related Transactions, and Director Independence
The information relating to certain relationships and related transactions and director independence is incorporated herein by reference to the Proxy Statement to be filed within120 days after December 31, 2012.
Item 14. Principal Accountant Fees and Services
The information relating to the principal accountant fees and expenses is incorporated herein by reference to the Proxy Statement to be filed with 120 days after December 31, 2012.
74
Table of Contents
PART IV
Item 15. Exhibits and Financial Statement Schedules
(a)(1) Financial Statements:
Our consolidated financial statements identified in the accompanying Index to Financial Statements at page F-1 herein are filed as part of this Annual Report on Form 10-K.
(a)(2) Financial Statement Schedules: The schedules are omitted because they are not applicable or the required information is shown in the consolidated financial statements or notes thereto.
(a)(3) Exhibits:
The accompanying Exhibit Index on page E-1 sets forth the exhibits that are filed as part of this Annual Report on Form 10-K.
75
Table of Contents
Pursuant to the requirements of Section 13 or 15(d) of the Securities Exchange Act of 1934, the registrant has duly caused this report to be signed on its behalf by the undersigned, thereunto duly authorized.
| IMPERIAL HOLDINGS, INC. | ||||||
| By: | /S/ ANTONY MITCHELL | |||||
| Name: | Antony Mitchell | |||||
| Title: | Chief Executive Officer | |||||
Date: November 14, 2013
76
Table of Contents
Audited Consolidated Financial Statements as of December 31, 2012 and 2011 and for each of the three years in the period ended December 31, 2012 of Imperial Holdings, Inc. and its Subsidiaries
Imperial Holdings, Inc. succeeded to the business of Imperial Holdings, LLC and its assets and liabilities pursuant to the corporate conversion of Imperial Holdings, LLC effective February 3, 2011.
F-1
Table of Contents
REPORT OF INDEPENDENT REGISTERED PUBLIC
ACCOUNTING FIRM
Board of Directors and Shareholders
Imperial Holdings, Inc.
We have audited the accompanying consolidated balance sheets of Imperial Holdings, Inc. (a Delaware corporation) and subsidiaries (the “Company”) as of December 31, 2012 and 2011, and the related consolidated statements of operations, comprehensive loss, changes in stockholders’/members’ equity, and cash flows for each of the three years in the period ended December 31, 2012. These financial statements are the responsibility of the Company’s management. Our responsibility is to express an opinion on these financial statements based on our audits.
We conducted our audits in accordance with the standards of the Public Company Accounting Oversight Board (United States). Those standards require that we plan and perform the audit to obtain reasonable assurance about whether the financial statements are free of material misstatement. The Company is not required to have, nor were we engaged to perform an audit of its internal control over financial reporting. Our audits included consideration of internal control over financial reporting as a basis for designing audit procedures that are appropriate in the circumstances, but not for the purpose of expressing an opinion on the effectiveness of the Company’s internal control over financial reporting. Accordingly, we express no such opinion. An audit also includes examining, on a test basis, evidence supporting the amounts and disclosures in the financial statements, assessing the accounting principles used and significant estimates made by management, as well as evaluating the overall financial statement presentation. We believe that our audits provide a reasonable basis for our opinion.
In our opinion, the consolidated financial statements referred to above present fairly, in all material respects, the financial position of Imperial Holdings, Inc. and subsidiaries as of December 31, 2012 and 2011, and the results of their operations and their cash flows for each of the three years in the period ended December 31, 2012 in conformity with accounting principles generally accepted in the United States of America.
/s/ GRANT THORNTON LLP
Fort Lauderdale, Florida
March 27, 2013
F-2
Table of Contents
Imperial Holdings, Inc. and Subsidiaries
December 31,
| 2012 | 2011 | |||||||
| (In thousands except share data) | ||||||||
| ASSETS | ||||||||
| Assets |
||||||||
| Cash and cash equivalents |
$ | 7,001 | $ | 16,255 | ||||
| Restricted cash |
1,162 | 691 | ||||||
| Certificate of deposit - restricted |
— | 891 | ||||||
| Investment securities available for sale, at estimated fair value |
12,147 | 57,242 | ||||||
| Deferred costs, net |
7 | 1,874 | ||||||
| Prepaid expenses and other assets |
14,165 | 3,277 | ||||||
| Deposits - other |
2,855 | 761 | ||||||
| Interest receivable, net |
822 | 5,758 | ||||||
| Loans receivable, net |
3,044 | 29,376 | ||||||
| Structured settlement receivables at estimated fair value |
1,680 | 12,376 | ||||||
| Structured settlement receivables at cost, net |
1,574 | 1,553 | ||||||
| Investment in life settlements, at estimated fair value |
113,441 | 90,917 | ||||||
| Fixed assets, net |
232 | 585 | ||||||
| Investment in affiliates |
2,212 | 1,043 | ||||||
|
|
|
|
|
|||||
| Total assets |
$ | 160,342 | $ | 222,599 | ||||
|
|
|
|
|
|||||
| LIABILITIES AND STOCKHOLDERS’ EQUITY | ||||||||
| Liabilities |
||||||||
| Accounts payable and accrued expenses |
$ | 6,606 | $ | 16,336 | ||||
| Other liabilities |
20,796 | 4,279 | ||||||
| Interest payable |
— | 5,505 | ||||||
| Notes payable |
— | 19,277 | ||||||
| Income taxes payable |
6,295 | 6,295 | ||||||
|
|
|
|
|
|||||
| Total liabilities |
33,697 | 51,692 | ||||||
| Commitments and Contingencies (Note 17) |
— | — | ||||||
| Stockholders’ Equity |
||||||||
| Common stock (80,000,000 authorized; 21,206,121 and 21,202,614 issued and outstanding as of December 31, 2012 and 2011, respectively) |
212 | 212 | ||||||
| Additional paid-in-capital |
238,064 | 237,755 | ||||||
| Accumulated other comprehensive loss |
(3 | ) | (66 | ) | ||||
| Accumulated deficit |
(111,628 | ) | (66,994 | ) | ||||
|
|
|
|
|
|||||
| Total stockholders’ equity |
126,645 | 170,907 | ||||||
|
|
|
|
|
|||||
| Total liabilities and stockholders’ equity |
$ | 160,342 | $ | 222,599 | ||||
|
|
|
|
|
|||||
The accompanying notes are an integral part of this financial statement.
F-3
Table of Contents
Imperial Holdings, Inc. and Subsidiaries
CONSOLIDATED STATEMENTS OF OPERATIONS
For the Years Ended December 31,
| 2012 | 2011 | 2010 | ||||||||||
| (in thousands, except share and per share data) | ||||||||||||
| Income |
||||||||||||
| Agency fee income |
$ | — | $ | 6,470 | $ | 10,149 | ||||||
| Interest income |
2,014 | 8,303 | 18,660 | |||||||||
| Interest and dividends on investment securities available for sale |
391 | 640 | — | |||||||||
| Origination fee income |
500 | 6,480 | 19,938 | |||||||||
| Realized gain on sale of structured settlements |
11,509 | 5,817 | 6,595 | |||||||||
| Realized gain on life settlements, net |
151 | 5 | 1,951 | |||||||||
| Gain on forgiveness of debt |
— | 5,023 | 7,599 | |||||||||
| Unrealized change in fair value of life settlements |
(5,660 | ) | 570 | 10,156 | ||||||||
| Unrealized change in fair value of structured settlements |
1,823 | 5,302 | 2,477 | |||||||||
| Change in equity investments |
— | — | (1,284 | ) | ||||||||
| Servicing fee income |
1,183 | 1,814 | 413 | |||||||||
| Gain on maturities of life settlements with subrogation rights, net |
6,090 | 3,188 | — | |||||||||
| Other income |
1,082 | 602 | 242 | |||||||||
|
|
|
|
|
|
|
|||||||
| Total income |
19,083 | 44,214 | 76,896 | |||||||||
|
|
|
|
|
|
|
|||||||
| Expenses |
||||||||||||
| Interest expense |
1,255 | 8,524 | 28,155 | |||||||||
| Provision for losses on loans receivable |
515 | 7,589 | 4,476 | |||||||||
| Loss on loan payoffs and settlements, net |
125 | 3,837 | 4,981 | |||||||||
| Amortization of deferred costs |
1,867 | 6,076 | 24,465 | |||||||||
| Personnel costs |
16,087 | 18,933 | 12,370 | |||||||||
| Marketing costs |
5,023 | 6,104 | 5,077 | |||||||||
| Department of Justice Settlement |
— | 8,000 | — | |||||||||
| Legal fees |
26,053 | 12,097 | 3,444 | |||||||||
| Professional fees |
6,934 | 5,684 | 3,966 | |||||||||
| Insurance |
2,330 | 756 | 358 | |||||||||
| Other selling, general and administrative expenses |
3,567 | 5,812 | 5,301 | |||||||||
|
|
|
|
|
|
|
|||||||
| Total expenses |
63,756 | 83,412 | 92,593 | |||||||||
|
|
|
|
|
|
|
|||||||
| Loss before income taxes |
(44,673 | ) | (39,198 | ) | (15,697 | ) | ||||||
| Benefit for income taxes |
(39 | ) | — | — | ||||||||
|
|
|
|
|
|
|
|||||||
| Net loss |
$ | (44,634 | ) | $ | (39,198 | ) | $ | (15,697 | ) | |||
|
|
|
|
|
|
|
|||||||
| Loss per share: |
||||||||||||
| Basic |
$ | (2.10 | ) | $ | (2.03 | ) | $ | (4.36 | ) | |||
|
|
|
|
|
|
|
|||||||
| Diluted |
$ | (2.10 | ) | $ | (2.03 | ) | $ | (4.36 | ) | |||
|
|
|
|
|
|
|
|||||||
| Weighted average shares outstanding: |
||||||||||||
| Basic |
21,205,747 | 19,352,063 | 3,600,000 | |||||||||
|
|
|
|
|
|
|
|||||||
| Diluted |
21,205,747 | 19,352,063 | 3,600,000 | |||||||||
|
|
|
|
|
|
|
|||||||
The accompanying notes are an integral part of this financial statement.
F-4
Table of Contents
Imperial Holdings, Inc. and Subsidiaries
CONSOLIDATED STATEMENTS OF COMPREHENSIVE LOSS
| For the Years Ended December 31, | ||||||||||||
| 2012 | 2011 | 2010 | ||||||||||
| (In thousands) | ||||||||||||
| Net loss |
$ | (44,634 | ) | $ | (39,198 | ) | $ | (15,697 | ) | |||
| Other comprehensive loss, net of tax: |
||||||||||||
| Unrealized gains (loss) on investment securities available for sale |
63 | (66 | ) | — | ||||||||
|
|
|
|
|
|
|
|||||||
| Comprehensive loss |
$ | (44,571 | ) | $ | (39,264 | ) | $ | (15,697 | ) | |||
|
|
|
|
|
|
|
|||||||
The accompanying notes are an integral part of this financial statement.
F-5
Table of Contents
Imperial Holdings, Inc.
CONSOLIDATED STATEMENTS OF STOCKHOLDERS’/MEMBERS’ EQUITY
For the Years Ended December 31, 2012, 2011 and 2010
| Member Units - Common |
Member Units - Preferred A |
Member Units - Preferred B |
Member Units - Preferred C |
Member Units - Preferred D |
Member Units - Preferred E |
Common Stock |
Additional Paid-in |
Retained Earnings (Accumulated |
Accumulated Other Comprehensive |
|||||||||||||||||||||||||||||||||||||||||||||||||||||||||||||||
| Units | Amount | Units | Amount | Units | Amount | Units | Amount | Units | Amount | Units | Amount | Shares | Amount | Capital | Deficit) | Income (Loss) | Total | |||||||||||||||||||||||||||||||||||||||||||||||||||||||
| (in thousands, except per share data) | ||||||||||||||||||||||||||||||||||||||||||||||||||||||||||||||||||||||||
| Balance, December 31, 2009 |
450,000 | $ | 19,923 | 90,796 | $ | 4,035 | 50,000 | $ | 5,000 | — | — | — | — | — | — | — | — | — | $ | (12,099 | ) | — | $ | 16,859 | ||||||||||||||||||||||||||||||||||||||||||||||||
| Comprehensive loss |
— | — | — | — | — | — | — | — | — | — | — | — | — | — | — | (15,697 | ) | — | (15,697 | ) | ||||||||||||||||||||||||||||||||||||||||||||||||||||
| Proceeds from sale of preferred units |
— | — | — | — | — | — | 70,000 | 7,000 | 7,000 | 700 | 73,000 | 7,300 | — | — | — | — | — | 15,000 | ||||||||||||||||||||||||||||||||||||||||||||||||||||||
| Repurchase of common and preferred units |
(112,500 | ) | (8,461 | ) | — | — | (25,000 | ) | (2,500 | ) | — | — | — | — | — | — | — | — | — | — | (10,961 | ) | ||||||||||||||||||||||||||||||||||||||||||||||||||
|
|
|
|
|
|
|
|
|
|
|
|
|
|
|
|
|
|
|
|
|
|
|
|
|
|
|
|
|
|
|
|
|
|
|
|
|
|||||||||||||||||||||||||||||||||||||
| Balance, December 31, 2010 |
337,500 | $ | 11,462 | 90,796 | $ | 4,035 | 25,000 | $ | 2,500 | 70,000 | $ | 7,000 | 7,000 | $ | 700 | 73,000 | $ | 7,300 | — | — | — | $ | (27,796 | ) | — | $ | 5,201 | |||||||||||||||||||||||||||||||||||||||||||||
| Comprehensive loss |
— | — | — | — | — | — | — | — | — | — | — | — | — | — | — | (39,198 | ) | (66 | ) | (39,264 | ) | |||||||||||||||||||||||||||||||||||||||||||||||||||
| Conversion of debt and membership units into common shares |
(337,500 | ) | (11,462 | ) | (90,796 | ) | (4,035 | ) | (25,000 | ) | (2,500 | ) | (70,000 | ) | (7,000 | ) | (7,000 | ) | (700 | ) | (73,000 | ) | (7,300 | ) | 2,300,273 | 23 | 38,132 | — | — | 5,158 | ||||||||||||||||||||||||||||||||||||||||||
| Conversion of Skarbonka debt into common shares, net of tax |
— | — | — | — | — | — | — | — | — | — | — | — | 1,272,727 | 13 | 23,693 | — | — | 23,706 | ||||||||||||||||||||||||||||||||||||||||||||||||||||||
| Phantom shares converted into common shares |
— | — | — | — | — | — | — | — | — | — | — | — | 27,000 | — | 290 | — | — | 290 | ||||||||||||||||||||||||||||||||||||||||||||||||||||||
| Issuance of common stock pursunat to IPO, net of offering costs |
— | — | — | — | — | — | — | — | — | — | — | — | 17,602,614 | 176 | 174,057 | — | — | 174,233 | ||||||||||||||||||||||||||||||||||||||||||||||||||||||
| Stock-based compensation |
— | — | — | — | — | — | — | — | — | — | — | — | — | — | 1,583 | — | — | 1,583 | ||||||||||||||||||||||||||||||||||||||||||||||||||||||
|
|
|
|
|
|
|
|
|
|
|
|
|
|
|
|
|
|
|
|
|
|
|
|
|
|
|
|
|
|
|
|
|
|
|
|
|
|||||||||||||||||||||||||||||||||||||
| Balance, December 31, 2011 |
— | — | — | — | — | — | — | — | — | — | — | — | 21,202,614 | $ | 212 | 237,755 | $ | (66,994 | ) | $ | (66 | ) | $ | 170,907 | ||||||||||||||||||||||||||||||||||||||||||||||||
| Comprehensive loss |
— | — | — | — | — | — | — | — | — | — | — | — | — | — | — | (44,634 | ) | 63 | (44,571 | ) | ||||||||||||||||||||||||||||||||||||||||||||||||||||
| Stock-based compensation |
— | — | — | — | — | — | — | — | — | — | — | — | — | — | 309 | — | — | 309 | ||||||||||||||||||||||||||||||||||||||||||||||||||||||
| Restricted stock issued |
— | — | — | — | — | — | — | — | — | — | — | — | 3,507 | — | — | — | — | — | ||||||||||||||||||||||||||||||||||||||||||||||||||||||
|
|
|
|
|
|
|
|
|
|
|
|
|
|
|
|
|
|
|
|
|
|
|
|
|
|
|
|
|
|
|
|
|
|
|
|
|
|||||||||||||||||||||||||||||||||||||
| Balance, December 31, 2012 |
— | — | — | — | — | — | — | — | — | — | — | — | 21,206,121 | 212 | 238,064 | (111,628 | ) | (3 | ) | $ | 126,645 | |||||||||||||||||||||||||||||||||||||||||||||||||||
|
|
|
|
|
|
|
|
|
|
|
|
|
|
|
|
|
|
|
|
|
|
|
|
|
|
|
|
|
|
|
|
|
|
|
|
|
|||||||||||||||||||||||||||||||||||||
The accompanying notes are an integral part of these financial statements.
F-6
Table of Contents
Imperial Holdings, Inc. and Subsidiaries
CONSOLIDATED STATEMENTS OF CASH FLOWS
For the Years Ended December 31,
| 2012 | 2011 | 2010 | ||||||||||
| (In thousands) | ||||||||||||
| Cash flows from operating activities |
— | — | ||||||||||
| Net loss |
$ | (44,634 | ) | $ | (39,198 | ) | $ | (15,697 | ) | |||
| Adjustments to reconcile net loss to net cash used in operating activites: |
||||||||||||
| Depreciation and amortization |
385 | 612 | 722 | |||||||||
| Amortization of premiums and accretion of discounts on available for sale securities sale securities |
962 | 1,198 | — | |||||||||
| Provision for doubtful accounts |
— | 661 | 85 | |||||||||
| Provision for losses on loans receivable |
515 | 7,589 | 4,476 | |||||||||
| Stock-based compensation |
309 | 1,873 | — | |||||||||
| Loss on loan payoffs and settlements, net |
125 | 3,837 | 4,981 | |||||||||
| Origination fee income |
(500 | ) | (6,480 | ) | (19,938 | ) | ||||||
| Unrealized change in fair value of life settlements |
5,660 | (570 | ) | (10,156 | ) | |||||||
| Unrealized change in fair value of structured settlements |
(1,823 | ) | (5,302 | ) | (2,477 | ) | ||||||
| Gain on forgiveness of debt |
— | (5,023 | ) | (7,599 | ) | |||||||
| Interest income on loans |
(2,014 | ) | (8,303 | ) | (18,660 | ) | ||||||
| Amortization of deferred costs |
1,867 | 6,076 | 24,465 | |||||||||
| Accretion of discount on debenture payable |
— | 233 | — | |||||||||
| Change in equity investments |
— | — | 1,284 | |||||||||
| Gain on sale and prepayment of investment securities available for sale |
(53 | ) | (21 | ) | — | |||||||
| Realized gain on life settlements, net |
(151 | ) | (5 | ) | — | |||||||
| Change in assets and liabilities: |
||||||||||||
| Purchase of certificate of deposit-restricted |
895 | — | (200 | ) | ||||||||
| Deposits - other |
(2,094 | ) | (68 | ) | 54 | |||||||
| Agency fees receivable |
— | 479 | 1,519 | |||||||||
| Investment in affiliates |
(1,171 | ) | (964 | ) | (71 | ) | ||||||
| Structured settlement receivables |
12,827 | (5,539 | ) | 523 | ||||||||
| Prepaid expenses and other assets |
(10,833 | ) | (1,996 | ) | (3,467 | ) | ||||||
| Deferred Costs |
— | 2,755 | — | |||||||||
| Accounts payable and accrued expenses |
(9,730 | ) | 12,625 | 1,017 | ||||||||
| Other liabilities |
16,517 | (3,634 | ) | 7,914 | ||||||||
| Interest receivable |
343 | (439 | ) | — . | ||||||||
| Interest payable |
(5,505 | ) | (6,758 | ) | 3,429 | |||||||
| Deferred income tax |
(39 | ) | — | — | ||||||||
|
|
|
|
|
|
|
|||||||
| Net cash used in operating activities |
(38,142 | ) | (46,362 | ) | (27,796 | ) | ||||||
|
|
|
|
|
|
|
|||||||
F-7
Table of Contents
| 2012 | 2011 | 2010 | ||||||||||
| (In thousands) | ||||||||||||
| Cash flows from investing activities |
||||||||||||
| Purchase of fixed assets, net of disposals |
(21 | ) | (311 | ) | (261 | ) | ||||||
| Purchase of intangible assets |
— | — | (160 | ) | ||||||||
| Investment in life settlement fund |
— | — | (727 | ) | ||||||||
| Purchase of investment securities available for sale |
(35,492 | ) | (127,974 | ) | — | |||||||
| Proceeds from sale and prepayments of investment securities available for sale |
79,781 | 69,490 | — | |||||||||
| Premiums paid on investments in life settlements |
(27,804 | ) | (16,321 | ) | (745 | ) | ||||||
| Purchases of investments in life settlements |
(130 | ) | (50,480 | ) | (1,324 | ) | ||||||
| Proceeds from sale of investments in life settlements |
5,626 | — | — | |||||||||
| Proceeds from sale of investments, net |
— | — | 2,070 | |||||||||
| Proceeds from loan payoffs and lender protection insurance claims received in advance |
26,676 | 51,778 | 128,847 | |||||||||
| Originations of loans receivable |
— | (18,724 | ) | (24,744 | ) | |||||||
|
|
|
|
|
|
|
|||||||
| Net cash provided by (used in) investing activities |
48,636 | (92,542 | ) | 102,956 | ||||||||
|
|
|
|
|
|
|
|||||||
| Cash flows from financing activities |
||||||||||||
| Proceeds from sale of preferred units |
— | — | 15,000 | |||||||||
| Payments of cash pledged as restricted deposits |
— | — | (455 | ) | ||||||||
| Proceeds from initial public offering, net of offering expenses |
— | 174,233 | — | |||||||||
| Payment of financing fees |
— | — | (6,010 | ) | ||||||||
| Repayment of borrowings under credit facilities |
(19,277 | ) | (36,176 | ) | (40,827 | ) | ||||||
| Restricted Cash |
(471 | ) | — | — | ||||||||
| Repayment of borrowings from affiliates |
— | — | (93,216 | ) | ||||||||
| Borrowings under credit facilities |
— | 234 | 24,247 | |||||||||
| Borrowings from affiliates |
— | 2,644 | 24,434 | |||||||||
|
|
|
|
|
|
|
|||||||
| Net cash (used in) provided by financing activities |
(19,748 | ) | 140,935 | (76,827 | ) | |||||||
|
|
|
|
|
|
|
|||||||
| Net (decrease) increase in cash and cash equivalents |
(9,254 | ) | 2,031 | (1,667 | ) | |||||||
| Cash and cash equivalents, at beginning of the year |
16,255 | 14,224 | 15,891 | |||||||||
|
|
|
|
|
|
|
|||||||
| Cash and cash equivalents, at end of the year |
$ | 7,001 | $ | 16,255 | $ | 14,224 | ||||||
|
|
|
|
|
|
|
|||||||
| Supplemental disclosures of cash flow information: |
||||||||||||
| Cash paid for interest during the period |
$ | 6,746 | $ | 14,992 | $ | 26,743 | ||||||
|
|
|
|
|
|
|
|||||||
| Supplemental disclosures of non-cash financing activities: |
||||||||||||
| Subscription to purchase Member units - Series E preferred |
$ | — | $ | — | $ | 5,000 | ||||||
|
|
|
|
|
|
|
|||||||
| Repurchase of common and preferred units |
$ | — | $ | — | $ | 10,961 | ||||||
|
|
|
|
|
|
|
|||||||
| Repayment of borrowings paid directly by our lender protection insurance carrier |
$ | — | $ | — | $ | 63,968 | ||||||
|
|
|
|
|
|
|
|||||||
| Conversion of debt to common stock |
$ | — | $ | 35,158 | $ | — | ||||||
| Supplemental disclosures of non-cash investing activities: |
||||||||||||
| Investment in life settlements acquired in foreclosure |
$ | 5,724 | $ | 6,409 | $ | 11,901 | ||||||
|
|
|
|
|
|
|
|||||||
The accompanying notes are an integral part of these financial statements.
F-8
Table of Contents
Imperial Holdings, Inc. and Subsidiaries
NOTES TO CONSOLIDATED FINANCIAL STATEMENTS
December 31, 2012
NOTE 1—ORGANIZATION AND DESCRIPTION OF BUSINESS ACTIVITIES
Imperial Holdings, Inc. (“Imperial,” the “Company,” “we” or “us”) was formed initially as a Florida limited liability Company pursuant to an operating agreement dated December 15, 2006 between IFS Holdings, Inc., IMEX Settlement Corporation, Premium Funding, Inc. and Red Oak Finance, LLC. In connection with the Company’s initial public offering on February 3, 2011, the Company succeeded to the business, assets and liabilities of the limited liability Company.
The Company, operating through its subsidiaries, is a specialty finance company with its corporate office in Boca Raton, Florida. The Company operates in two reportable business segments: life finance (formerly referred to as premium finance) and structured settlements. In the life finance business, the Company earns revenue/income from interest accruing on outstanding loans and loan origination fees over the life of the outstanding loans, servicing income, changes in the fair value of life settlements the Company acquires and receipt of death benefits with respect to matured life insurance policies it owns. In the structured settlement business, the Company purchases structured settlements at a discounted rate and sells such assets to third parties.
In February 2011, the Company completed the sale of 17,602,614 shares of common stock in its initial public offering at a price of $10.75 per share. The Company received net proceeds of approximately $174.2 million after deducting the underwriting discounts and commissions and its offering expenses.
On September 27, 2011, the Company was informed that it was being investigated by the U.S. Attorney’s Office for the District of New Hampshire (the “USAO Investigation”). At that time, the Company was informed that, among other individuals, its former president and chief operating officer, former general counsel, three former life finance sales executives, two vice presidents and a funding manager were considered “targets” of the USAO Investigation. The USAO Investigation focused on the Company’s premium finance loan business.
On February 17, 2012, the Company received a subpoena issued by the staff of the U.S. Securities and Exchange Commission (the “SEC”) seeking documents from 2007 through the present, generally related to the Company’s premium finance business and corresponding financial reporting. The SEC is investigating whether any violations of federal securities laws have occurred and the Company has been cooperating with the SEC regarding this matter. The Company is unable to predict what action, if any, might be taken in the future by the SEC or its staff as a result of the matters that are the subject of the subpoena or what impact, if any, the cost of responding to the subpoena might have on the Company’s financial position, results of operations, or cash flows. The Company has not established any provision for losses in respect of this matter.
On April 30, 2012, the Company entered into a Non-Prosecution Agreement (the “Non-Prosecution Agreement”) with the USAO, which agreed not to prosecute the Company for its involvement in the making of misrepresentations on life insurance applications in connection with its premium finance business or any potential securities fraud claims related to its premium finance business. In the Non-Prosecution Agreement, the USAO and the Company agreed among other things, that the following facts are true and correct: (i) at all relevant times (x) certain insurance companies required that the prospective insured applying for a life insurance policy, and sometimes the agent, disclose information relating to premium financing on applications for life insurance policies, and (y) the questions typically required the prospective insured to disclose if he or she intended to seek premium financing in connection with the policy and sometimes required the agent to disclose if he or she was aware of any such intent on the part of the applicant; (ii) in connection with a portion of the Company’s retail operation known as “retail non-seminar” that began in December 2006 and was discontinued in January 2009, Imperial had a practice of disclosing on applications that the prospective insured was seeking premium financing when the life insurance company allowed premium financing from Imperial; however, in
F-9
Table of Contents
certain circumstances, Imperial internal life agents facilitated and/or made misrepresentations on applications that the prospective insured was not seeking premium financing when the insurance carrier was likely to deny the policy on the basis of premium financing; and (iii) to the extent that external agents, brokers and insureds caused other misrepresentations to be made in life insurance applications in connection with the retail non-seminar business, Imperial failed to appropriately tailor controls to prevent potential fraudulent practices in that business. As of December 31, 2012, the Company had 12 policies in its portfolio that once served as collateral for premium finance loans derived through the retail non-seminar business.
In connection with the Non-Prosecution Agreement, Imperial voluntarily agreed to terminate its premium finance business, which historically accounted for the majority of the Company’s revenues and terminated certain senior sales staff associated with the premium finance business. Additionally, the Company paid the United States Government $8.0 million, and agreed to cooperate fully with the USAO’s ongoing investigation and to refrain from and self-report any criminal conduct. The Non-Prosecution Agreement has a term of three years until April 30, 2015, but after April 30, 2014 the Company may petition the USAO to forego the final year of the Non-Prosecution Agreement, if we otherwise comply with all of our obligations under the Non-Prosecution Agreement. Should the USAO conclude that Imperial has not abided by its obligations under the Non-Prosecution Agreement, the USAO could choose to terminate the Non-Prosecution Agreement, resume its investigation of the Company, or bring charges against Imperial.
On August 2, 2012, the Board of Directors of the Company appointed Andrew Dakos, Phillip Goldstein and Gerald Hellerman to serve as directors of the Company in connection with a settlement (the “Settlement”) with Opportunity Partners L.P. (“Opportunity”). The Settlement resulted in Opportunity withdrawing its demand for a special meeting of shareholders, which it had submitted to the Company on May 23, 2012 and agreeing to dismiss its lawsuit to compel an annual meeting of shareholders. In connection with the Settlement, Walter Higgins and A. Penn Wyrough resigned from the Board of Directors. On August 14, 2012, Antony Mitchell, the Company’s chief executive officer, resigned as Chairman of the Board (though he continues to serve as a director and as the Company’s chief executive officer) and Mr. Goldstein was elected Chairman. On January 14, 2013, David Buzen resigned from the Board of Directors and on March 12, 2013, Robert Rosenberg informed the Board of Directors that he would not stand for re-election at the Company’s annual meeting of shareholders.
As of December 31, 2012, the Company had approximately $20.3 million of cash, cash equivalents, and marketable securities including $1.2 million in restricted cash. This limited cash position was driven primarily by the defense and investigation of the Company and certain employees in connection with the USAO Investigation, SEC investigation and related shareholder litigation, which required significant, unbudgeted cash outlays. As previously reported in earlier periodic reports filed with the SEC, the Company anticipated a liquidity shortfall in the second quarter of 2013. Accordingly, to avoid lapsing policies, the Company sought additional capital and, on March 27, 2013, Greenwood Asset Portfolio, LLC (“Greenwood”), a subsidiary of the Company, borrowed $45 million in aggregate principal amount under the terms of an eighteen-month bridge facility, secured by substantially all of the Company’s portfolio of life insurance policies. Principal was borrowed under the facility at 92% resulting in net proceeds after transaction expenses of $41.4 million. After transaction expenses, up to 25% of the proceeds of the facility may be used by the Company for general corporate purposes, with the balance used by Greenwood to pay premiums on the life insurance policies it owns. Interest under the facility accrues at 12% per annum for nine months and thereafter increases to 18% for the remainder of the term of the facility. The Company intends to replace this facility, which is pre-payable at par without penalty, and refinance the bridge facility with more permanent capital once it is sourced. There can be no assurance, however, that we will be able to obtain capital on more favorable terms or at all. The facility should provide the Company with adequate liquidity to pay premiums on its portfolio of life insurance through 2013. See Note 22 Subsequent Events.
NOTE 2 — SUMMARY OF SIGNIFICANT ACCOUNTING POLICIES
Principles of Consolidation
The consolidated financial statements include the accounts of the Company, all of its wholly-owned subsidiaries and its special purpose entities, with the exception of Imperial Settlements Financing 2010, LLC
F-10
Table of Contents
(“ISF 2010”), an unconsolidated special purpose entity (see Note 12). The special purpose entity has been created to fulfill specific objectives. All significant intercompany balances and transactions have been eliminated in consolidation.
Life Finance Loans Receivable
We report loans receivable acquired or originated by us at cost, adjusted for any deferred fees or costs in accordance with Financial Accounting Standards Board (“FASB”) Accounting Standards Codification (“ASC”) 310-20, Receivables—Nonrefundable Fees and Other Costs, discounts, and loan impairment valuation. All loans are collateralized by life insurance policies. Interest income is accrued on the unpaid principal balance on a monthly basis based on the applicable rate of interest on the loans.
In accordance with ASC 310, Receivables, we specifically evaluate all loans for impairment based on the fair value of the underlying policies as collectability is primarily collateral dependent. The loans are considered to be collateral dependent as the repayment of the loans is expected to be provided by the underlying insurance policies. In the event of default, the borrower typically relinquishes beneficial ownership of the policy to us in exchange for our release of the debt (or we enforce our security interests in the beneficial interests in the trust that owns the policy). For loans that have lender protection insurance, we make a claim against the lender protection insurance policy and, subject to terms and conditions of the lender protection insurance policy, our lender protection insurer has the right to direct control or take beneficial ownership of the policy upon payment of our claim. For loans without lender protection insurance, we have the option of selling the policy or maintaining it on our balance sheet for investment.
We evaluate the loan impairment valuation on a monthly basis based on our periodic review of the estimated value of the underlying collateral. This evaluation is inherently subjective as it requires estimates that are susceptible to significant revision as more information becomes available. The loan impairment valuation is established as losses on loans are estimated and the provision is charged to earnings. Once established, the loan impairment valuation cannot be reversed to earnings.
In order to originate premium finance transactions our lenders required that we procure lender protection insurance. This lender protection insurance mitigates our exposure to losses which may be caused by declines in the fair value of the underlying policies. At the end of each reporting period, for loans that have lender protection insurance, a loan impairment valuation is established if the carrying value of the loan receivable exceeds the amount of coverage. The lender protection insurance program was terminated as of December 31, 2010, and all loans originated after December 31, 2010, do not carry lender protection insurance coverage. Thus, for all loans originated in 2011 and beyond, a loan impairment valuation is established if the carrying value of a loan receivable exceeds the fair value of the underlying collateral. See Notes 9, 13 and 14 to the accompanying consolidated financial statements.
Ownership of Life Insurance Policies
In the ordinary course of business, a large portion of our borrowers default by not paying off the loan and relinquish ownership of the life insurance policy to us in exchange for our release of the obligation to pay amounts due. We also buy life insurance policies in the secondary and tertiary markets. We account for life insurance policies that we own as investments in life settlements (life insurance policies) in accordance with ASC 325-30, Investments in Insurance Contracts, which requires us to use either the investment method or the fair value method. The election is made on an instrument-by-instrument basis and is irrevocable. We have elected to account for these life insurance policies as investments using the fair value method.
We initially record investments in life settlements at the transaction price. For policies acquired upon relinquishment by our borrowers, we determine the transaction price based on fair value of the acquired policies at the date of relinquishment. The difference between the net carrying value of the loan and the transaction price
F-11
Table of Contents
is recorded as a gain (loss) on loan payoffs and settlements. For policies acquired for cash, the transaction price is the amount paid.
Valuation of Insurance Policies
Our valuation of insurance policies is a critical component of our estimate for the loan impairment valuation and the fair value of our investments in life settlements (life insurance policies). We currently use a probabilistic method of valuing life insurance policies, which we believe to be the preferred valuation method in the industry. The most significant assumptions which we estimate are the life expectancy of the insured and the discount rate.
In determining the life expectancy estimate, we analyze medical reviews from independent secondary market life expectancy providers (each a “LE provider”). An LE provider reviews the medical records and identifies all medical conditions it feels are relevant to the life expectancy of the insured. Debits and credits are then assigned by each LE provider to the individual’s health based on these medical conditions. The debit or credit that an LE provider assigns to a medical condition is derived from the experience of mortality attributed to this condition in the portfolio of lives that it monitors. The health of the insured is summarized by the LE provider into a life assessment of the individual’s life expectancy expressed both in terms of months and in mortality factor.
The resulting mortality factor represents an indication as to the degree to which the given life can be considered more or less impaired than a standard life having similar characteristics (e.g. gender, age, smoking, etc.). For example, a standard insured (the average life for the given mortality table) would carry a mortality rating of 100%. A similar but impaired life bearing a mortality rating of 200% would be considered to have twice the chance of dying earlier than the standard life. Historically, the Company has procured the majority of its life expectancy reports from two life expectancy report providers and only used AVS life expectancy reports for valuation purposes. Beginning in the quarter ended September 30, 2012, the Company began utilizing life expectancy reports from 21st Services for valuation purposes and began averaging or “blending,” the results of the two life expectancy reports to establish a composite mortality factor. However, when “blending” the AVS and 21st Services life expectancy reports, if the difference in the probability of mortality between the reports is greater than 150%, the Company will reduce the higher mortality factor until the difference is 150%.
The probability of mortality for an insured is then calculated by applying the blended life expectancy estimate to a mortality table. The mortality table is created based on the rates of death among groups categorized by gender, age, and smoking status. By measuring how many deaths occur during each year, the table allows for a calculation of the probability of death in a given year for each category of insured people. The probability of mortality for an insured is found by applying the mortality rating from the life expectancy assessment to the probability found in the actuarial table for the insured’s age, sex and smoking status. As discussed in Use of Updated Life Expectancies and Change in Mortality Table in Management’s Discussion and Analysis of Financial Condition and Results of Operations, the Company has historically applied an actuarial table developed by a third party. However, beginning in the quarter ended September 30, 2012, the Company transitioned to a table developed by the U.S. Society of Actuaries known as the 2008 Valuation Basic Table, or the 2008 VBT. However, because the 2008 VBT table does not account for anticipated improvements in mortality in the insured population, the table was modified in conjunction with outside consultants to reflect these expected mortality improvements. The Company believes that the change in mortality table does not materially impact the valuation of its life insurance policies and that its adoption of a modified 2008 VBT table is consistent with modified tables used by market participants.
The mortality rating is used to create a series of best estimate probablistic cash flows. This probability represents a mathematical curve known as a mortality curve. This curve is then used to generate a series of expected cash flows over the remaining expected lifespan of the insured and the corresponding policy. A discounted present value calculation is then used to determine the value of the policy. If the insured dies earlier than expected, the return will be higher than if the insured dies when expected or later than expected.
F-12
Table of Contents
The calculation allows for the possibility that if the insured dies earlier than expected, the premiums needed to keep the policy in force will not have to be paid. Conversely, the calculation also considers the possibility that if the insured lives longer than expected, more premium payments will be necessary. Based on these considerations, each possible outcome is assigned a probability and the range of possible outcomes is then used to create a price for the policy.
As is the case with most market participants at December 31, 2012, the Company used a blend of life expectancies that are provided by two third-party LE providers. These are estimates of an insured’s remaining years. If all of the insured lives in the Company’s life settlement portfolio live six months shorter or longer than the life expectancies provided by these third parties, the change in fair market value would be as follows (dollars in thousands):
| Life Expectancy Months Adjustment |
Value | Change in Value |
||||||
| +6 |
95,658 | (17,783 | ) | |||||
| — |
113,441 | — | ||||||
| -6 |
132,540 | 19,099 | ||||||
As noted above, the Company takes an average, or blend, of the two life expectancy reports to derive a composite mortality factor, unless the difference in the probability of mortality between the reports is greater than 150%. In such instances and as reflected in the fair market value at December 31, 2012, the Company will cap the higher mortality factor at amount that is 150% above the lower mortality factor , which ultimately reduces the mortality factor inputted into the Company’s fair value model. At December 31, 2012, had the Company not implemented such a cap on affected policies, the fair value of the Company’s portfolio would have increased from the reported amount by $9.5 million. Additionally, the Company lengthened the life expectancy inputs to its fair value model on 45 policies with life expectancy reports that were more than two years old at December 31, 2012 based on the average lengthening reported on the 149 policies where update life expectancy reports were received. Had the Company not implemented such an adjustment on affected policies, the fair value of the Company’s portfolio would have increased from the reported amount by $5.8 million.
The Company believes that investors in esoteric assets such as life insurance policies typically target yields averaging between 12%—17% for investments of more than a 5 year duration, and had historically used a 15%—17% range of discount rates to value its life insurance policies. In the third quarter of 2011 and in the immediate aftermath of becoming aware of the USAO investigation, the Company substantially increased the discount rates inputted into its fair value model as it believed the USAO Investigation along with certain unfavorable court decisions unrelated to the Company contributed to a contraction in the marketplace that has continued to reverberate. Since that time, the Company has been re-evaluating its discount rates at the end of every reporting period in order to reflect the estimated discount rates that could reasonably be used in a market transaction involving the Company’s portfolio of life insurance policies. In doing so, the Company relies on management insight, engages third party consultants to corroborate its assessment, engages in discussions with other market participants and potential financing sources and extrapolates the discount rate underlying actual sales of policies.
Although the Company believes that its entry into the Non-Prosecution Agreement had a positive effect on the market generally and for premium financed life insurance policies specifically, the Company believes that, when given the choice to invest in a policy that was associated with the Company’s premium finance business and a similar policy without such an association, all else being equal, an investor would have generally opted to invest in the policy that was not associated with the Company’s premium finance business. However, since entering into the Non-Prosecution Agreement, investors have required less of a risk premium to transact in these policies and the Company expects that, in time, investors will continue to require less of a risk premium to transact in policies associated with its premium finance business. Accordingly, the Company expects that its discount rates for policies associated with its premium finance business will continue to decrease in future periods.
F-13
Table of Contents
As of December 31, 2012, the Company owned 214 policies with an aggregate investment in life settlements of $113.4 million. Of these 214 policies, 171 were previously premium financed and are valued using discount rates that range from 16.80% to 33.80%. The remaining 43 policies are valued using discount rates that range from 14.80% to 21.30%. The discount rate incorporates current information about market interest rates, the credit exposure to the insurance company that issued the life insurance policy and our estimate of the risk premium an investor in the policy would require. The extent to which the fair value could vary in the near term has been quantified by evaluating the effect of changes in the weighted average discount rate on the death benefit used to estimate the fair value. If the weighted average discount rate were increased or decreased by 1/2 of 1% and the other assumptions used to estimate fair value remained the same, the change in fair market value would be as follows (dollars in thousands):
| Weighted Average Rate |
Rate Adjustment | Value | Change in Value | |||||||||
| 23.51% |
-.50 | % | 116,300 | 2,859 | ||||||||
| 24.01% |
— | 113,441 | — | |||||||||
| 24.51% |
+.50 | % | 110,694 | (2,747 | ) | |||||||
Future changes in the discount rates we use to value life insurance policies could have a material effect on our yield on life settlement transactions, which could have a material adverse effect on our business, financial condition and results of our operations.
At the end of each reporting period we re-value the life insurance policies using our valuation model in order to update our loan impairment valuation for loans receivable and our estimate of fair value for investments in policies held on our balance sheet. This includes reviewing our assumptions for discount rates and life expectancies as well as incorporating current information for premium payments and the passage of time.
Use of Estimates
The preparation of these consolidated financial statements, in conformity with accounting principles generally accepted in the United States of America, requires management to make estimates and assumptions that affect the reported amounts of assets and liabilities at the date of the financial statements and the reported amounts of revenue and expenses during the reporting period. Actual results could differ from these estimates and such differences could be material. Significant estimates made by management include the loan impairment valuation, allowance for doubtful accounts, the valuation of structured settlements and the valuation of investments in life settlements.
Change in Accounting Estimate
The Company has elected to account for the life settlement policies it acquired using the fair value method. The fair value is determined on a discounted cash flow basis, incorporating current life expectancy, expected premiums and discount rate assumptions (see Note 14). During the first quarter of 2011, the Company made revisions to the application of its valuation technique and assumptions used to measure fair value of the life settlement policies it acquired. The Company accounted for this change in accounting estimate prospectively in accordance with ASC 250-10-45-17, Change in Accounting Estimate, resulting in recognition of a pretax gain of $3.0 million recorded in unrealized change in fair value of life settlements in the accompanying consolidated statement of operations for the year ended December 31, 2011.
The Company’s decision to revise its fair value calculations used to value all life insurance policies on hand at March 31, 2011 was driven by two factors. Firstly, with consideration to the wind-down of the lender protection insurance coverage (LPIC) program which ended on December 31, 2010, the value of the collateral serving the Company’s new lending activity is no longer determined primarily by the limit of liability provided by the LPIC coverage. Instead, the value of the collateral is based solely on the Company’s valuation model. Secondly, as a result of the Company’s initial public offering in February, 2011 and the new capital structure provided by it, the Company planned to build and retain a large and diversified pool of life policies.
F-14
Table of Contents
As discussed above, the Company uses a discounted cash flow model to calculate the fair value of its life insurance policy portfolio. That model is based on three principal factors: life expectancy, expected premiums and the discount rate. As discussed in Note 14, the Company began receiving updated life expectancy reports on the insureds represented in the Company’s portfolio of life insurance policies during 2012. As a result, the calculation of the life expectancy and discount rate inputs have changed. While the Company is endeavoring to obtain updated life expectancy reports for all of its policies, at December 31, 2012, the Company had only received updated life expectancies for 149 of the 214 policies in its portfolio. All updated reports that were obtained have been blended and inputted in the Company’s fair value model at December 31, 2012, which drove a decline of $31.3 million in the fair market value of the portfolio of life insurance policies during the year ended December 31, 2012. This decline was partially offset by premium payments, accretion due to the passage of time, and other changes to the Company’s fair value model, which resulted in a net unrealized change in fair value of approximately $5.7 million during the year ended December 31, 2012.
Cash and Cash Equivalents
Cash and cash equivalents include cash on hand, investments and all highly liquid instruments purchased with an original maturity of three months or less. The Company maintains the majority of its cash in several operating accounts with one commercial bank. Included in cash and cash equivalents is $110,000 and $3.0 million to be used by the Company to service policies as part of servicing a portfolio of life insurance policies for a third party as of December 31, 2012 and 2011, respectively. We also have a related servicing liability of $110,000 and $3.0 million which is included in other liabilities in the accompanying consolidated balance sheet as of December 31, 2012, and 2011, respectively.
Investment Securities Available for Sale
Investment securities available for sale are carried at fair value, inclusive of unrealized gains and losses, and net of discount accretion and premium amortization computed using the level yield method. Net unrealized gains and losses are included in other comprehensive income (loss) net of applicable income taxes. Gains or losses on sales of investment securities available for sale are recognized on the specific identification basis.
Management evaluates securities for other than-temporary-impairment on a quarterly basis. Impairment is evaluated considering numerous factors, and their relative significance varies depending on the situation. Factors considered include the Company’s intent to hold the security until maturity or for a period of time sufficient for a recovery in value, whether it is more likely than not that the Company will be required to sell the security prior to recovery of its amortized cost basis, the length of time and extent to which fair value has been less than amortized cost, the historical and implied volatility of the fair value of the security, failure of the issuer of the security to make scheduled interest or principal payments, any changes to the rating of the security by a rating agency and recoveries or additional declines in fair value subsequent to the balance sheet date.
Gain on Maturities of Life Settlements with Subrogation Rights, net
Every credit facility entered into by subsidiaries of the Company between December 2007 and December 2010 to finance the premium finance lending business required lender protection insurance for each loan originated under such credit facility. Generally, when the Company exercises its right to foreclose on collateral the Company’s lender protection insurer has the right to direct control or take beneficial ownership of the life insurance policy, subject to the terms and conditions of the lender protection insurance policy, including notice and timing requirements. Otherwise, the lender protection insurer maintains its salvage collection and subrogation rights. The lender protection insurer’s salvage collection and subrogation rights generally provide a remedy by which the insurer can seek to recover the amount of the lender protection claim paid plus premiums paid by it, expenses and interest thereon.
F-15
Table of Contents
In those instances where the Company has foreclosed on the collateral, the lender protection insurer has maintained its salvage collection and subrogation rights, and has been covering the cost of the ongoing premiums needed to maintain certain of these life insurance policies. However, the lender protection insurer may elect at any time to discontinue the payment of premiums which would result in lapse of the policies if the Company does not otherwise pay the premiums. The Company views these policies as having uncertain value because the lender protection insurer controls what happens to the policy from a payment of premium standpoint, and the amount of the lender protection insurer’s salvage collection and subrogation claim rights on any individual life insurance policy could equal the cash flow received by the Company with respect to any such policy. For these reasons, , the Company does not rely on these policies for revenue generation, and these policies are considered contingent assets and not included in the amount of life insurance policies on the accompanying consolidated balance sheet.
The Company accounts for the maturities of life insurance policies with subrogation rights, net of subrogation expenses as contingent gains in accordance with ASC 450, Contingencies and recognizes the revenue from the maturities of these policies when all contingencies are resolved.
Loan Impairment Valuation
In accordance with ASC 310, Receivables, the Company specifically evaluates all loans for impairment based on the fair value of the underlying policies as collectability is primarily collateral dependent. The loans are considered to be collateral dependent as the repayment of the loans is expected to be provided by the underlying insurance policies. In the event of default of a loan, the Company has the option to take control of the underlying life insurance policy enabling it to sell the policy or, for those loans that are insured (see below), collect the face value of the insurance certificate.
The loan impairment valuation is evaluated on a monthly basis by management and is based on management’s periodic review of the fair value of the underlying collateral. This evaluation is inherently subjective as it requires estimates that are susceptible to significant revision as more information becomes available. The loan impairment valuation is established when, based on current information and events, it is probable that the Company will be unable to collect the scheduled payments of principal, interest, and origination fee due according to the contractual terms of the loan agreement. Once established, the impairment cannot be reversed to earnings.
The Company purchased lender protection insurance coverage on loans that were sold to or participated by Imperial Life Financing, LLC, Imperial PFC Financing, LLC, Imperial Life Financing II, LLC, and Imperial PFC Financing II, LLC. This insurance mitigates the Company’s exposure to significant losses which may be caused by declines in the value of the underlying life insurance policies. For loans that have lender protection insurance coverage, a loan impairment valuation adjustment is established if the carrying value of the loan exceeds the amount of coverage at the end of the period.
For the year ended December 31, 2012 the Company recognized an impairment charge of approximately $437,000 and $78,000 on the loans and related interest, respectively, and is reflected as a component of the provision for losses on loans receivable in the accompanying consolidated statement of operations. For the year ended December 31, 2011, the Company recognized an impairment charge of approximately $6.8 million and $796,000 related to impaired loans and interest, respectively. For the year ended December 31, 2010, the Company recognized an impairment charge of approximately $2.3 million and $2.2 million related to impaired loans and interest, respectively. See Notes 9, 13 and 14 to the accompanying consolidated financial statements.
Agency Fees Receivable
Agency fees are charged for services related to premium finance transactions. Agency fees are due per the signed fee agreement. Agency fees receivable are reported net of an allowance for doubtful accounts.
F-16
Table of Contents
Management’s determination of the allowance for doubtful accounts is based on an evaluation of the commission receivable, prior collection history, current economic conditions, and other inherent risks. The Company reviews agency fees receivable aging on a regular basis to determine if any of the receivables are past due. The Company writes off all uncollectible agency fee receivable balances against its allowance. The allowance for doubtful accounts was approximately $260,000 as of December 31, 2012 and 2011.
Deferred Costs
Deferred costs include costs incurred in connection with acquiring and maintaining credit facilities and costs incurred in connection with securing lender protection insurance. These costs are amortized over the life of the related loan using the effective interest method and are classified as amortization of deferred costs in the accompanying consolidated statement of operations.
Interest Income and Origination Income
Interest income consists of interest earned on loans receivable, income from accretion of discounts on purchased loans, and accretion of discounts on purchased structured settlement receivables. Interest income is recognized when it is realizable and earned, in accordance with ASC 605, Revenue Recognition. Discounts are accreted over the remaining life of the loan using the effective interest method.
Loans often include origination fees which are fees payable to the Company on the date the loan matures. The fees are negotiated at the inception of the loan on a transaction by transaction basis. The fees are accreted into income over the term of the loan using the effective interest method.
Payments on loans are not due until maturity of the loan. As such, we typically do not have non-performing loans or non-accrual loans until post maturity of the loan. At maturity, the loans stop earning interest and origination income.
Interest and origination income on impaired loans is recognized when it is realizable and earned accordance with ASC 605, Revenue Recognition. Persuasive evidence of an arrangement exists through a loan agreement which is signed by a borrower prior to funding and sets forth the agreed upon terms of the interest and origination fees. Interest income and origination income are earned over the term of the loan and are accreted using the effective interest method. The interest and origination fees are fixed and determinable based on the loan agreement. For impaired loans, we continually reassess whether the collectability of the interest income and origination income is reasonably assured because the fair value of the collateral typically increases over the term of the loan. Our assessment of whether collectability of interest income and origination income is probable is based on our estimate of proceeds to be received upon maturity of the loan. To the extent that additional interest income is not recognized as collectability is not considered probable, origination income is not recognized. This is consistent with the objective of the interest method, as described in ASC 310-20, of maintaining a constant effective yield on the net investment in the receivable. Since our loans are due upon maturity, we cannot determine whether a loan is performing or non-performing until maturity. For impaired loans, our estimate of proceeds to be received upon maturity of the loan is generally correlated to our current estimate of fair value of the insurance policy, which is the measure to which the loans have been impaired, but also incorporates expected increases in fair value of the insurance policy over the term of the loan, trends in the market, and our experience with loan payoffs.
F-17
Table of Contents
Revenue/Income Recognition
Our primary sources of revenue/income are in the form of unrealized change in fair value of life settlements and structured settlements, agency fees, interest income, origination fee income, servicing income, gains on maturities of life settlements with subrogation rights, net and realized gains on sales of structured settlements. Our revenue/income recognition policies for these sources of revenue/income are as follows:
| • | Unrealized Change in Fair Value of Life Settlements—When the Company acquires life insurance policies we initially record these investments at the transaction price, which is the fair value of the policy for those acquired upon relinquishment or the amount paid for policies acquired for cash. The fair value of the investment in insurance policies is evaluated at the end of each reporting period. Changes in the fair value of the investment based on evaluations are recorded as changes in fair value of life settlements in our consolidated statement of operations. The fair value is determined on a discounted cash flow basis that incorporates current life expectancy assumptions. The discount rate incorporates current information about market interest rates, the credit exposure to the insurance company that issued the life insurance policy and our estimate of the risk premium an investor in the policy would require. |
| • | Agency Fees—Agency fees were paid by the referring life insurance agents based on negotiations between the parties and were recognized at the time a life finance loan is funded. Because agency fees are not paid by the borrower, such fees do not accrue over the term of the loan. A separate origination fee was charged to the borrower which is amortized into income over the life of the loan. |
| • | Interest Income—Interest income on life finance loans is recognized when it is realizable and earned, in accordance with ASC 605, Revenue Recognition. Discounts on structured settlement receivables are accreted over the life of the settlement using the effective interest method. |
| • | Origination Fee Income—Loans often include origination fees that are fees payable to us on the date the loan matures. The fees are negotiated at the inception of the loan on a transaction by transaction basis. The fees are accreted into income over the term of the loan using the effective interest method. |
| • | Servicing Income—Servicing income is recorded when services are provided. Servicing income is primarily from servicing a portfolio of life insurance policies controlled by a third party. These services include verifying premiums are paid and correctly applied and updating files for medical history and ongoing premiums. |
| • | Realized Gains on Sales of Structured Settlements—Realized gains on sales of structured settlements are recorded when the structured settlements have been transferred to a third party and we no longer have continuing involvement, in accordance with ASC 860, Transfers and Servicing. |
Fixed Assets
Fixed assets are stated at cost less accumulated depreciation and amortization. The Company provides for depreciation of fixed assets on a straight-line basis over the estimated useful lives of the assets which range from three to five years. Leasehold improvements are amortized using the straight-line method over the shorter of the expected life of the improvement or the remaining lease term.
Intangible Assets
Intangible assets represents amounts the Company paid to a third party in a settlement agreement to acquire the rights, title and interest to the domain name “Imperial.com” for a price of $160,000, and is included in prepaid expenses and other assets in the accompanying consolidated balance sheet. The domain name is being amortized using the straight-line method over its estimated useful life.
F-18
Table of Contents
Loss on Loan Payoffs and Settlements, Net
When a premium finance loan matures, we record the difference between the net carrying value of the loan and the cash received, or the fair value of the life insurance policy that is obtained in the event of payment default, as a gain or loss on loan payoffs and settlements, net. This account was significantly impacted by the Acorn settlement whereby the Company recorded a loss on loan payoffs and settlements of zero and $4.1 million during the years ended December 31, 2012 and 2011, respectively.
Advertising Expense
Advertising costs are expensed as incurred and were approximately $5.0 million and $6.1 million for the years ended December 31, 2012 and 2011, respectively. These costs are included within selling, general and administrative expenses in the consolidated statement of operations.
Fair Value Measurements
The Company follows ASC 820, Fair Value Measurements and Disclosures when required to measure fair value for recognition or disclosure purposes. ASC 820 defines fair value as the price that would be received to sell an asset or paid to transfer a liability in an orderly transaction between market participants at the measurement date. ASC 820 also establishes a three-level hierarchy for fair value measurements which prioritizes and ranks the level of market price observability used in measuring investments at fair value. Investments measured and reported at fair value are classified and disclosed in one of the following categories:
Level 1—Valuation is based on unadjusted quoted prices in active markets for identical assets and liabilities that are accessible at the reporting date. Since valuations are based on quoted prices that are readily and regularly available in an active market, valuation of these products does not entail a significant degree of judgment.
Level 2—Valuation is determined from pricing inputs that are other than quoted prices in active markets that are either directly or indirectly observable as of the reporting date. Observable inputs include quoted prices for similar assets or liabilities in active markets, quoted prices for identical or similar assets or liabilities in markets that are not active, and interest rates and yield curves that are observable at commonly quoted intervals.
Level 3—Valuation is based on inputs that are both significant to the fair value measurement and unobservable. Level 3 inputs include situations where there is little, if any, market activity for the financial instrument. The inputs into the determination of fair value generally require significant management judgment or estimation.
The availability of valuation techniques and observable inputs can vary from investment to investment and is affected by a wide variety of factors including, the type of investment, whether the investment is new and not yet established in the marketplace, and other characteristics particular to the transaction.
To the extent that valuation is based on models or inputs that are less observable or unobservable in the market, the determination of fair value requires more judgment. Those estimated values do not necessarily represent the amounts that may be ultimately realized due to the occurrence of future circumstances that cannot be reasonably determined. Because of the inherent uncertainty of valuation, those estimated values may be materially higher or lower than the values that would have been used had a ready market for the investments existed. Accordingly, the degree of judgment exercised by the Company in determining fair value of assets and liabilities is greatest for items categorized in Level 3. In certain cases, the inputs used to measure fair value may fall into different levels of the fair value hierarchy. In such cases, for disclosure purposes, the level in the fair value hierarchy within which the fair value measurement in its entirety falls is determined based on the lowest level input that is significant to the fair value measurement.
Fair value is a market-based measure considered from the perspective of a market participant rather than an entity-specific measure. Therefore, even when market assumptions are not readily available, the Company’s own
F-19
Table of Contents
assumptions are set to reflect those that market participants would use in pricing the asset or liability at the measurement date. The Company uses prices and inputs that are current as of the reporting date, including periods of market dislocation. In periods of market dislocation, the observability of prices and inputs may be reduced for many investments. This condition could cause an investment to be reclassified to a lower level within the fair value hierarchy (see Note 14).
Fair Value Option
As of July 1, 2010, we elected to adopt the fair value option, in accordance with ASC 825, Financial Instruments, to record certain newly-acquired structured settlements at fair value. We have the option to measure eligible financial assets, financial liabilities, and commitments at fair value on an instrument-by-instrument basis. This option is available when we first recognize a financial asset or financial liability or enter into a firm commitment. Subsequent changes in fair value of assets, liabilities, and commitments where we have elected fair value option are recorded in our consolidated statement of operations. We have made this election because it is our intention to sell these assets within the next twelve months, and we believe it significantly reduces the disparity that exists between the GAAP carrying value of these structured settlements and our estimate of their economic value. All structured settlements that were acquired subsequent to July 1, 2010 were marked to fair value. Structured settlements that were acquired prior to July 1, 2010 are recorded at cost. For the six months ended December 31, 2010, changes in the fair value of structured settlements where we elected the fair value option resulted in income of approximately $2.5 million. For the year ended December 31, 2012 and 2011, changes in fair value of fair value of structured settlements where we elected the fair value option resulted in income of approximately $1.8 million and $5.3 million, respectively.
Income Taxes
Prior to our initial public offering in 2011, we converted from a Florida limited liability company to a Florida corporation (the “Conversion”). Prior to the Conversion we were treated as a partnership for federal and state income tax purposes. As a partnership our taxable income and losses were attributed to our members, and accordingly, no provision or liability for income taxes was reflected in the accompanying consolidated financial statements for periods prior to the Conversion.
After the Conversion, we began to account for income taxes in accordance with ASC 740, Income Taxes. Under ASC 740, deferred income taxes are determined based on the estimated future tax effects of differences between the financial statement and tax basis of assets and liabilities given the provisions of enacted tax laws. Deferred income tax provisions and benefits are based on changes to the assets or liabilities from year to year. In providing for deferred taxes, we consider tax regulations of the jurisdictions in which we operate, estimates of future taxable income and available tax planning strategies. If tax regulations, operating results or the ability to implement tax-planning strategies varies, adjustments to the carrying value of the deferred tax assets and liabilities may be required. Valuation allowances are based on the “more likely than not” criteria of ASC 740.
At December 31, 2012 and 2011, due to the large losses and the uncertainties that resulted from the USAO Investigation, SEC investigation, Non-Prosecution Agreement and class action lawsuits, we recorded a full valuation allowance against our net deferred tax asset of $27.8 million and $11.1 million, respectively, as it is more likely than not that the net deferred tax asset is not realizable. As a result of these increases in the valuation allowance, we recorded no income tax benefit for 2012 and 2011.
The accounting for uncertain tax positions guidance under ASC 740 requires that we recognize the financial statement benefit of a tax position only after determining that the relevant tax authority would more likely than not sustain the position following an audit. For tax positions meeting the more-likely-than-not threshold, the amount recognized in the financial statements is the largest benefit that has a greater than 50 percent likelihood of being realized upon ultimate settlement with the relevant tax authority. We recognize interest and penalties (if any) on uncertain tax positions as a component of income tax expense.
F-20
Table of Contents
The Company’s corporate income tax returns for all years are subject to examination. Various state jurisdiction tax years remain open to examination.
In February of 2013 the Company was notified by the Internal Revenue Service of its intention to examine the Company’s partnership return for the year ended December 31, 2010. Audit field work for this examination has not been scheduled.
Stock-Based Compensation
We have adopted ASC 718, Compensation—Stock Compensation. ASC 718 addresses accounting for share-based awards, including stock options, with compensation expense measured using fair value and recorded over the requisite service or performance period of the award. The fair value of equity instruments issued upon or after the closing of our offering will be determined based on a valuation using an option pricing model which takes into account various assumptions that are subjective. Key assumptions used in the valuation will include the expected term of the equity award taking into account both the contractual term of the award, the effects of expected exercise and post-vesting termination behavior, expected volatility, expected dividends and the risk-free interest rate for the expected term of the award.
Earnings Per Share
The Company computes net income per share/unit in accordance with ASC 260, Earnings Per Share. Under the provisions of ASC 260, basic net income per share is computed by dividing the net income available to common shareholders by the weighted average common shares outstanding during the period. Diluted net income per share adjusts basic net income per share for the effects of stock options and restricted stock awards only in periods in which such effect is dilutive. ASC 260 also requires the Company to present basic and diluted earnings per share information separately for each class of equity instruments that participate in any income distribution with primary equity instruments.
Restricted Cash
The Cedar Lane credit facility requires the Company to retain 2% of the principal amount of each loan made to the borrower, for the purposes of indemnifying the facility for any breaches of representations, warranties or covenants of the borrower, as well as to fund collection efforts, if required. As of December 31, 2012 and December 31, 2011 the Company’s consolidated financial statements reflected balances of approximately $1.2 million and $691,000 included in restricted cash, respectively (see Note 22).
Gain on Sale of Life Settlements
Gain on sale of life settlements includes gain from company-owned life settlements.
Risks and Uncertainties
In the normal course of business, the Company encounters economic, legal and longevity risk. There are three main components of economic risk: credit risk, market risk and concentration of credit risk. Credit risk is the risk of default on the Company’s loan portfolio that results from a borrower’s inability or unwillingness to make contractually required payments. Market risk for the Company includes interest rate risk. Market risk also reflects the risk of declines in valuation of the Company’s investments, including declines caused by the selection of increased discount rates associated with the Company’s fair value model for investments in life settlements. It is reasonably possible that future changes to estimates involved in valuing life settlements could change and result in material effects to the future financial statements. Concentration of credit risk includes both the risk that lenders under the Company’s structured settlement financing facilities do not fund the purchase of structured settlement receivables when contractually obligated to do so and also includes the risk that an
F-21
Table of Contents
insurance carrier who has issued life insurance policies held by the Company in its portfolio does not remit the amount due under those policies upon policy maturities due to the deteriorating financial condition of the carrier or otherwise. Legal risk includes the risk that statutes define or courts interpret insurable interest in a manner adverse to the Company’s ownership rights in its portfolio of life insurance policies and the risk that courts allow insurance carriers to retain premiums paid by the Company in respect of insurance policies that have been successfully rescinded or contested. Longevity risk refers to the risk that the Company does not experience the mortalities of insureds in its portfolio of life insurance policies that are anticipated to occur on an actuarial basis in a timely manner, which would result in the Company expending additional amounts for the payment of premiums. See Note 17, Commitments and Contingencies.
Investment in Other Companies
The Company uses the equity method of accounting to account for its investment in other companies which the Company does not control but over which it exerts significant influence; generally this represents ownership interest of at least 20% and not more than 50%. The Company considers whether the fair values of any of its investments have declined below their carrying values whenever adverse events or changes in circumstances indicate that recorded values may not be recoverable. If the Company considers any such decline to be other than temporary, a write-down would be recorded to estimated fair value. During 2010, the Company wrote-off its entire investment in MXT as the Company determined that the estimated fair value of its investment in MXT was zero and the decline was other than temporary.
Recent Accounting Pronouncements
In May 2011, the FASB issued Accounting Standards Update (ASU) No. 2011-04, Fair Value Measurement (Topic 820): Amendments to Achieve Fair Value Measurement and Disclosure Requirements in U.S. GAAP and IFRSs. This update clarifies existing guidance about how fair value should be applied where it already is required or permitted and provides wording changes that align this standard with International Financial Reporting Standards (IFRS). We are required to apply this guidance prospectively beginning with our first quarterly filing in 2012. The adoption of this new guidance has not had an impact on our financial position or results of operations.
June 2011, the FASB issued ASU No. 2011-05, Comprehensive Income (Topic 220): Presentation of Comprehensive Income. This update increases the prominence of other comprehensive income in financial statements, eliminating the option of presenting other comprehensive income in the statement of changes in equity, and instead, requiring the components of net income and comprehensive income to be presented in either one or two consecutive financial statements. We are required to comply with this guidance prospectively beginning with our first quarterly filing in 2012. The adoption of this new guidance has not had an impact on our financial position or results of operations.
In September 2011, the FASB issued ASU No. 2011-08, Intangibles–Goodwill and Other (Topic 350): Testing Goodwill for Impairment. This update allows entities testing goodwill for impairment the option of performing a qualitative assessment before calculating the fair value of the reporting unit (i.e., step one of the two-step goodwill impairment test). If entities determine, on the basis of qualitative factors, that the fair value of the reporting unit is more likely than not less than the carrying amount, the two-step impairment test would be required. The amendments are effective for annual and interim goodwill impairment tests performed for fiscal years beginning after December 15, 2011. The adoption of this new guidance has not had an impact on our financial position or results of operations.
In December 2011, the FASB issued ASU No. 2011-12, Comprehensive Income (Topic 220): Deferral of the Effective Date for Amendments to the Presentation of Reclassifications of Items Out of Accumulated Other Comprehensive Income in Accounting Standards Update No. 2011-05. This update delays the effective date of the requirement to present reclassification adjustments for each component of accumulated other comprehensive income in both net income and other comprehensive income on the face of the financial statements.
F-22
Table of Contents
In February 2013, the FASB issued ASU No. 2013-02, Reporting of Amounts Reclassified Out of Accumulated Other Comprehensive Income. This update adds new disclosure requirements for items reclassified out of accumulated other comprehensive income. We are required to apply this guidance prospectively beginning with our first quarterly filing in 2013. The adoption of this new guidance will not impact our financial position or statement of operations, other than changes in presentation.
NOTE 3—EARNINGS PER SHARE
As of February 3, 2011, the Company had 3,600,000 shares of common stock outstanding. The impact of the Company’s corporate conversion has been applied on a retrospective basis to January 1, 2010 to determine earnings per share for the years ended December 31, 2011 and 2010.
As of December 31, 2012 and 2011, there were 21,206,121 and 21,202,614 issued and outstanding shares, respectively.
Basic net income per share is computed by dividing the net earnings attributable to common shareholders by the weighted average number of common shares outstanding during the period.
Diluted earnings per share is computed by dividing net income attributable to common shareholders by the weighted average number of common shares outstanding, increased to include the number of additional common shares that would have been outstanding if the dilutive potential common shares had been issued. Conversion or exercise of the potential common shares is not reflected in diluted earnings per share unless the effect is dilutive. The dilutive effect, if any, of outstanding common share equivalents is reflected in diluted earnings per share by application of the treasury stock method, as applicable. In determining whether outstanding stock options, restricted stock, and common stock warrants should be considered for their dilutive effect, the average market price of the common stock for the period has to exceed the exercise price of the outstanding common share equivalent.
The following tables reconcile actual basic and diluted earnings per share for the years ended December 31, 2012, 2011 and 2010 (in thousands except per share data).
| 2012 | 2011 | 2010 | ||||||||||
| Basic loss per share: |
||||||||||||
| Numerator: |
||||||||||||
| Net loss available to common stockholders |
$ | (44,634 | ) | $ | (39,198 | ) | $ | (15,697 | ) | |||
|
|
|
|
|
|
|
|||||||
| Denominator: |
||||||||||||
| Weighted average common shares outstanding |
21,205,747 | 19,352,063 | 3,600,000 | |||||||||
|
|
|
|
|
|
|
|||||||
| Basic loss per share |
$ | (2.10 | ) | $ | (2.03 | ) | $ | (4.36 | ) | |||
|
|
|
|
|
|
|
|||||||
| Diluted loss per share: |
||||||||||||
| Numerator: |
||||||||||||
| Net loss available to common stockholders |
$ | (44,634 | ) | $ | (39,198 | ) | $ | (15,697 | ) | |||
|
|
|
|
|
|
|
|||||||
| Denominator: |
||||||||||||
| Diluted weighted average shares outstanding |
21,205,747 | 19,352,063 | 3,600,000 | |||||||||
|
|
|
|
|
|
|
|||||||
| Diluted loss per share(1)(2) |
$ | (2.10 | ) | $ | (2.03 | ) | $ | (4.36 | ) | |||
|
|
|
|
|
|
|
|||||||
| (1) | The computation of diluted EPS did not include 487,314 options and 4,240,521 warrants for the year ended December 31, 2012, as the effect of their inclusion would have been anti-dilutive. |
| (2) | The computation of diluted EPS did not include 627,419 options, 4,240,521 warrants and 3,507 shares of restricted stock for the year ended December 31, 2011, as the effect of their inclusion would have been anti-dilutive. |
F-23
Table of Contents
Pro Forma Earnings Per Share
The pro forma earnings per share for the years ended December 31, 2011 and 2010, gives effect to (i) the consummation of the corporate conversion, pursuant to which all outstanding common and preferred limited liability company units (including all accrued but unpaid dividends thereon) and all principal and accrued interest outstanding under our promissory note in favor of IMPEX Enterprises, Ltd. were converted into 2,300,273 shares of our common stock; (ii) the issuance of 27,000 shares of common stock to two of our employees pursuant to the terms of each of their respective phantom stock agreements; and (iii) the issuance and conversion of a $30.0 million debenture into 1,272,727 shares of our common stock as if these events had been completed by January 2010.
Unaudited pro forma net income attributable to common stockholders per share is computed using the weighted-average number of common shares outstanding, including the pro forma effect of (i) to (iii) above, as if such conversion occurred at January 1, 2010. The pro forma net income/(loss) reflects a reduction of interest expense of $178,000, net of tax and $3.1 million for the years ended December 31, 2011 and 2010, respectively, due to the conversion of a promissory note in favor of IMPEX Enterprises, Ltd. into shares of our common stock, which occurred prior to the closing of our initial public offering, and the conversion of our promissory note in favor of Branch Office of Skarbonka Sp. z o.o into a $30.0 million debenture, and the conversion of that $30.0 million debenture into shares of our common stock, which occurred immediately prior to the closing of our offering.
The following tables reconcile pro forma basic and diluted earnings per share for the years ended December 31, 2011 and 2010 (in thousands except per share data).
| 2011 | 2010 | |||||||
| Basic loss per share: |
||||||||
| Numerator: |
||||||||
| Net loss available to common stockholders(1)(3) |
$ | (39,020 | ) | $ | (12,636 | ) | ||
|
|
|
|
|
|||||
| Denominator: |
||||||||
| Weighted average common shares outstanding |
19,352,063 | 3,600,000 | ||||||
|
|
|
|
|
|||||
| Basic loss per share |
$ | (2.02 | ) | $ | (3.51 | ) | ||
|
|
|
|
|
|||||
| Diluted earnings per share: |
||||||||
| Numerator: |
||||||||
| Net loss available to common stockholders |
$ | (39,020 | ) | $ | (12,636 | ) | ||
|
|
|
|
|
|||||
| Denominator: |
||||||||
| Diluted weighted average shares outstanding |
19,352,063 | 3,600,000 | ||||||
|
|
|
|
|
|||||
| Diluted loss per share(2) |
$ | (2.02 | ) | $ | (3.51 | ) | ||
|
|
|
|
|
|||||
| (1) | Reflects a reduction of interest expense $178,000, net of tax and $3.1 million for the years ended December 31, 2011 and 2010, respectively, due to the conversion of our promissory note in favor of IMPEX Enterprises, Ltd. into shares of our common stock, which occurred prior to the closing of our initial public offering, and the conversion of our promissory note in favor of Branch Office of Skarbonka Sp. z o.o into a $30.0 million debenture, and the conversion of that $30.0 million debenture into shares of our common stock, which occurred immediately prior to the closing of our initial public offering. |
| (2) | The computation of diluted EPS did not include 627,419 options, 4,240,521 warrants and 3,507 shares of restricted stock for the year ended December 31, 2011, as the effect of their inclusion would have been anti-dilutive. |
| (3) | For the pro forma period for the years ended December 31, 2011 and 2010, the results of the Company being treated for the pro forma presentation as a “C” corporation resulted in no impact to the consolidated balance sheet or statement of operations. The primary reasons for this are that the losses produce no current |
F-24
Table of Contents
| benefit and any net operating losses generated and other deferred assets (net of liabilities) at that time would have been fully reserved due to historical operating losses. The Company, therefore, has not recorded any pro forma tax provision. |
NOTE 4—DEFERRED COSTS
During 2010 and 2009, the Company paid lender protection insurance premiums which were capitalized and are being amortized over the life of the loans using the effective interest method. The balance of costs related to lender protection insurance premium included in deferred costs in the accompanying balance sheet at December 31, 2012 and 2011 was zero and approximately $1.1 million, respectively. The state surplus taxes on the lender protection insurance premiums are 3.6% to 4.0% of the premiums paid. These costs were also capitalized and amortized over the life of the loans using the effective interest method. The balance of costs related to state surplus taxes included in deferred costs in the accompanying balance sheets at December 31, 2012 and 2011 was zero and approximately $498,000, respectively.
During 2010 and 2009, the Company paid loan closing fees related to the closing of certain financing agreements. These costs were being capitalized and amortized over the life of the credit facilities using the effective interest method. The balance of costs related to securing credit facilities included in deferred costs in the accompanying balance sheet at December 31, 2012 and 2011 was approximately $7,000 and $301,000, respectively.
NOTE 5—DEPOSITS—OTHER
The Company has provided three $100,000 deposits and a $125,000 deposit to various states as a requirement for applying for and obtaining life settlement licenses in those states. The deposits are held by the state or custodians of the state and bear interest at market rates. Interest is generally distributed to the Company on a quarterly basis. Interest income of approximately $3,500, $3,000 and $3,000 has been recognized on these deposits for the years ended December 31, 2012, 2011 and 2010, respectively. Amount deposited with various states was $425,000 for the years ended December 31, 2012 and 2011.
The Company has purchased surety bonds in various amounts as a requirement for applying for and obtaining life settlement licenses in certain states. As of December 31, 2012, the Company has surety bonds in seven states which total $850,000 and expire in May 2013. The surety bonds were originally backed by a letter of credit from a national bank in the amount of $850,000, which was collateralized by certificates of deposit with the bank in the amount of $895,000, including accrued interest. As the letter of credit matured on May 8, 2012, the surety bond underwriter drew on the facility totaling $850,000. The certificates of deposit were not renewed and the amounts are currently being held with the underwriter as a deposit as collateral for the surety bonds. The Company expects to continue to maintain the deposit with the surety bond underwriter as collateral for the foreseeable future.
As of December 31, 2012 and 2011 the Company had an additional deposit of $250,000 in connection with its Cedar Lane credit facility. The Company also had approximately $1.3 million in deposits held with various credit facilities for potential financing opportunities at December 31, 2012 and approximately $78,000 and $86,000 in miscellaneous deposits recorded in deposits-other in the accompanying balance sheet at December 31, 2012 and 2011, respectively.
F-25
Table of Contents
NOTE 6—FIXED ASSETS
Fixed assets at December 31, 2012 and 2011 are summarized as follows (in thousands):
| For the Year Ended December 31, | ||||||||
| 2012 | 2011 | |||||||
| Computer software and equipment |
$ | 2,320 | $ | 2,286 | ||||
| Furniture, fixtures and equipment |
670 | 1,046 | ||||||
| Leasehold improvements |
773 | 666 | ||||||
|
|
|
|
|
|||||
| 3,763 | 3,998 | |||||||
| Less: Accumulated depreciation |
3,531 | 3,413 | ||||||
|
|
|
|
|
|||||
| Fixed assets, net |
$ | 232 | $ | 585 | ||||
|
|
|
|
|
|||||
Depreciation expense for the years ended December 31, 2012, 2011 and 2010 was approximately $365,000, $602,000 and $722,000, respectively, the Company also recorded $9,000 related to fixed asset write offs during 2012 and these are included in selling, general, and administrative expenses in the accompanying consolidated statement of income. During 2012 and 2011, the Company recorded $11,000 and $10,000, respectively, in amortization expense related to its domain name which was acquired in 2011 (See Note 2) which is included in selling, general and administrative expenses in the accompanying consolidated statement of income.
NOTE 7—GAIN ON MATURITIES OF LIFE SETTLEMENTS WITH SUBROGATION RIGHTS
During 2011, two individuals covered under policies which were subject to subrogation claims unexpectedly passed away. The Company collected the death benefit on one of these policies in the amount of $3.5 million during the third quarter of 2011. The other was the result of an accidental death and the $10.0 million face value of the policy was larger than average.
The Company accounted for the maturities of each of these polices as contingent gains in accordance with ASC 450, Contingencies and recognized $3.2 million in death benefits net of subrogation expenses of $312,000 in its consolidated statement of operations during the year ended December 31, 2011. During 2012, the Company negotiated a settlement in respect of the larger policy and collected approximately $6.1 million, net of subrogation expenses of $910,000, and has reported a gain in accordance with ASC 450, Contingencies in its consolidated statement of operations for the year ended December 31, 2012 as all contingencies were resolved.
The Company believes these contingent gains to be unpredictable because the lender protection insurer can discontinue paying the premiums necessary to keep a policy subject to subrogation and salvage claims in force at any time and the amount of the lender protection insurer’s subrogation and salvage claim on any individual life insurance policy could equal the cash flow received by the Company with respect to any such policy. No expectations for similar gains in the future should be inferred from the events occurring in the third quarter of 2011 and second quarter of 2012.
NOTE 8—INVESTMENT SECURITIES AVAILABLE FOR SALE
The amortized cost and estimated fair values of securities available for sale at December 31, 2012 are as follows (in thousands):
| December 31, 2012 | ||||||||||||||||
| Description of Securities |
Amortized Cost |
Gross Unrealized Gains |
Gross Unrealized Losses |
Estimated Fair Value |
||||||||||||
| Corporate bonds |
$ | 8,275 | 25 | $ | (67 | ) | $ | 8,233 | ||||||||
| Government bonds |
3,524 | 76 | — | 3,600 | ||||||||||||
| Other bonds |
310 | 4 | — | 314 | ||||||||||||
|
|
|
|
|
|
|
|
|
|||||||||
| Total available for sale securities |
$ | 12,109 | $ | 105 | $ | (67 | ) | $ | 12,147 | |||||||
|
|
|
|
|
|
|
|
|
|||||||||
F-26
Table of Contents
The amortized cost and estimated fair values of securities available for sale at December 31, 2011 are as follows (in thousands):
| December 31, 2011 | ||||||||||||||||
| Description of Securities |
Amortized Cost |
Gross Unrealized Gains |
Gross Unrealized Losses |
Estimated Fair Value |
||||||||||||
| Corporate bonds |
$ | 41,697 | 32 | $ | (127 | ) | $ | 41,602 | ||||||||
| Government bonds |
14,789 | 39 | (9 | ) | 14,819 | |||||||||||
| Other bonds |
821 | — | — | 821 | ||||||||||||
|
|
|
|
|
|
|
|
|
|||||||||
| Total available for sale securities |
$ | 57,307 | $ | 71 | $ | (136 | ) | $ | 57,242 | |||||||
|
|
|
|
|
|
|
|
|
|||||||||
The scheduled maturities of securities at December 31, 2012, by contractual maturity, are shown below. Expected maturities may differ from contractual maturities because borrowers may have the right to call or prepay obligations with or without call or prepayment penalties (in thousands).
| December 31, 2012 | ||||||||
| Amortized Cost | Estimated Fair Value | |||||||
| Due in one year or less |
$ | 6,172 | $ | 6,197 | ||||
| Due after one year but less than five years |
2,413 | 2,350 | ||||||
| Due after five years but less than ten years |
3,524 | 3,600 | ||||||
|
|
|
|
|
|||||
| Total available for sale securities |
$ | 12,109 | $ | 12,147 | ||||
|
|
|
|
|
|||||
The scheduled maturities of securities at December 31, 2011, by contractual maturity, are shown below. Expected maturities may differ from contractual maturities because borrowers may have the right to call or prepay obligations with or without call or prepayment penalties (in thousands).
| December 31, 2011 | ||||||||
| Amortized Cost | Estimated Fair Value | |||||||
| Due in one year or less |
$ | 25,904 | $ | 25,892 | ||||
| Due after one year but less than five years |
20,243 | 20,160 | ||||||
| Due after five years but less than ten years |
11,160 | 11,190 | ||||||
|
|
|
|
|
|||||
| Total available for sale securities |
$ | 57,307 | $ | 57,242 | ||||
|
|
|
|
|
|||||
Information pertaining to securities with gross unrealized losses at December 31, 2012, aggregated by investment category and length of time that the individual securities have been in a continuous unrealized loss position is as follows (in thousands):
| December 31, 2012 | ||||||||||||||||||||||||
| Less than 12 Months | 12 Months or More | Total | ||||||||||||||||||||||
| Description of Securities |
Estimated Fair Value |
Unrealized Loss |
Estimated Fair Value |
Unrealized Loss |
Estimated Fair Value |
Unrealized Loss |
||||||||||||||||||
| Corporate bonds |
1,932 | (67 | ) | — | — | 1,932 | (67 | ) | ||||||||||||||||
| Government bonds |
— | — | — | — | — | — | ||||||||||||||||||
| Other bonds |
— | — | — | — | — | — | ||||||||||||||||||
|
|
|
|
|
|
|
|
|
|
|
|
|
|||||||||||||
| Total available for sale securities |
$ | 1,932 | $ | (67 | ) | $ | — | $ | — | $ | 1,932 | $ | (67 | ) | ||||||||||
|
|
|
|
|
|
|
|
|
|
|
|
|
|||||||||||||
F-27
Table of Contents
Information pertaining to securities with gross unrealized losses at December 31, 2011, aggregated by investment category and length of time that the individual securities have been in a continuous unrealized loss position is as follows (in thousands):
| December 31, 2011 | ||||||||||||||||||||||||
| Less than 12 Months | 12 Months or More | Total | ||||||||||||||||||||||
| Description of Securities |
Estimated Fair Value |
Unrealized Loss |
Estimated Fair Value |
Unrealized Loss |
Estimated Fair Value |
Unrealized Loss |
||||||||||||||||||
| Corporate bonds |
26,051 | (127 | ) | 26,051 | (127 | ) | ||||||||||||||||||
| Government bonds |
5,927 | (9 | ) | 5,927 | (9 | ) | ||||||||||||||||||
| Other bonds |
— | — | — | — | ||||||||||||||||||||
|
|
|
|
|
|
|
|
|
|
|
|
|
|||||||||||||
| Total available for sale securities |
$ | 31,978 | $ | (136 | ) | $ | — | $ | — | $ | 31,978 | $ | (136 | ) | ||||||||||
|
|
|
|
|
|
|
|
|
|
|
|
|
|||||||||||||
Proceeds from sale and prepayment of investment securities available for sale during the year ended December 31, 2012 amounted to approximately $79.8 million, resulting in gross realized gains of approximately $53,000.
The Company monitors its investment securities available for sale for other-than-temporary impairment, or OTTI, on an individual security basis considering numerous factors, including the Company’s intent to sell securities in an unrealized loss position, the likelihood that the Company will be required to sell these securities before an anticipated recovery in value, the length of time and extent to which fair value has been less than amortized cost, the historical and implied volatility of the fair value of the security, failure of the issuer of the security to make scheduled interest or principal payments, any changes to the rating of the security by a rating agency and recoveries or additional declines in fair value subsequent to the balance sheet date. The relative significance of each of these factors varies depending on the circumstances related to each security.
At December 31, 2012 and 2011, 2 and 31 securities were in unrealized loss positions, respectively. The amount of unrealized losses related to all of these securities was considered insignificant, totaling approximately $67,000 and $136,000 for December 31, 2012 and 2011, respectively.
NOTE 9—LOANS RECEIVABLE
A summary of loans receivables at December 31, 2012 and 2011 is as follows (in thousands):
| 2012 | 2011 | |||||||
| Loan principal balance |
$ | 5,255 | $ | 31,264 | ||||
| Loan origination fees, net |
1,157 | 8,307 | ||||||
| Loan impairment valuation |
(3,368 | ) | (10,195 | ) | ||||
|
|
|
|
|
|||||
| Loans receivable, net |
$ | 3,044 | $ | 29,376 | ||||
|
|
|
|
|
|||||
The Company also had interest receivable, net which consisted of approximately $727,000 and $5.3 million in accrued and unpaid interest at December 31, 2012 and 2011, respectively and a related impairment valuation of approximately $947,000 and $1.9 million, respectively.
F-28
Table of Contents
An analysis of the changes in loans receivable principal balance during the years ended December 31, 2012 and 2011 is as follows (in thousands):
| 2012 | 2011 | |||||||
| Loan principal balance, beginning |
$ | 31,264 | $ | 76,939 | ||||
| Loan originations |
— | 18,385 | ||||||
| Subsequent year premiums paid, net of reimbursement |
— | 339 | ||||||
| Loan write-offs |
— | (3,058 | ) | |||||
| Loan payoffs |
(17,116 | ) | (55,277 | ) | ||||
| Loans transferred to investments in life settlements |
(8,893 | ) | (6,064 | ) | ||||
|
|
|
|
|
|||||
| Loan principal balance, ending |
$ | 5,255 | $ | 31,264 | ||||
|
|
|
|
|
|||||
Loan origination fees include origination fees that are payable to the Company on the date the loan matures. The loan origination fees are reduced by any direct costs that are directly related to the creation of the loan receivable in accordance with ASC 310-20, Receivables—Nonrefundable Fees and Other Costs, and the net balance is accreted over the life of the loan using the effective interest method. Discounts include purchase discounts, net of accretion, which are attributable to loans that were acquired from affiliated companies under common ownership and control.
In accordance with ASC 310, Receivables, the Company specifically evaluates all loans for impairment based on the fair value of the underlying policies as foreclosure is considered probable. The loans are considered to be collateral dependent as the repayment of the loans is expected to be provided by the underlying policies. See Note 14.
An analysis of the loan impairment valuation for the year ended December 31, 2012 is as follows (in thousands):
| Loans Receivable |
Interest Receivable |
Total | ||||||||||
| Balance at beginning of period |
$ | 10,195 | $ | 1,920 | $ | 12,115 | ||||||
| Provision for loan losses |
437 | 78 | 515 | |||||||||
| Charge-offs |
(7,264 | ) | (1,051 | ) | (8,315 | ) | ||||||
|
|
|
|
|
|
|
|||||||
| Balance at end of period |
$ | 3,368 | $ | 947 | $ | 4,315 | ||||||
|
|
|
|
|
|
|
|||||||
An analysis of the loan impairment valuation for the year ended December 31, 2011 is as follows (in thousands):
| Loans Receivable |
Interest Receivable |
Total | ||||||||||
| Balance at beginning of period |
$ | 7,176 | $ | 1,340 | $ | 8,516 | ||||||
| Provision for loan losses |
6,793 | 796 | 7,589 | |||||||||
| Charge-offs |
(3,774 | ) | (216 | ) | (3,990 | ) | ||||||
|
|
|
|
|
|
|
|||||||
| Balance at end of period |
$ | 10,195 | $ | 1,920 | $ | 12,115 | ||||||
|
|
|
|
|
|
|
|||||||
An analysis of the loan impairment valuation for the year ended December 31, 2010 is as follows (in thousands):
| Loans Receivable |
Interest Receivable |
Total | ||||||||||
| Balance at beginning of period |
$ | 11,599 | $ | 1,788 | $ | 13,387 | ||||||
| Provision for loan losses |
2,276 | 2,200 | 4,476 | |||||||||
| Charge-offs |
(8,205 | ) | (2,647 | ) | (10,852 | ) | ||||||
| Recoveries |
1,506 | — | 1,506 | |||||||||
|
|
|
|
|
|
|
|||||||
| Balance at end of period |
$ | 7,176 | $ | 1,341 | $ | 8,517 | ||||||
|
|
|
|
|
|
|
|||||||
F-29
Table of Contents
An analysis of the allowance for loan losses and recorded investment in loans by loan type for the year ended December 31, 2012 is as follows (in thousands):
| Uninsured Loans |
Insured Loans |
Total | ||||||||||
| Loan impairment valuation |
||||||||||||
| Balance at beginning of period |
$ | 6,914 | $ | 3,281 | $ | 10,195 | ||||||
| Provision for loan losses |
— | 437 | 437 | |||||||||
| Charge-offs |
(4,222 | ) | (3,042 | ) | (7,264 | ) | ||||||
|
|
|
|
|
|
|
|||||||
| Ending balance |
$ | 2,692 | $ | 676 | $ | 3,368 | ||||||
|
|
|
|
|
|
|
|||||||
| Ending balance: individually evaluated for impairment |
$ | 2,692 | $ | 676 | $ | 3,368 | ||||||
|
|
|
|
|
|
|
|||||||
An analysis of the allowance for loan losses and recorded investment in loans by loan type for the year ended December 31, 2011 is as follows (in thousands):
| Uninsured Loans |
Insured Loans |
Total | ||||||||||
| Loan impairment valuation |
||||||||||||
| Balance at beginning of period |
$ | 888 | $ | 6,288 | $ | 7,176 | ||||||
| Provision for loan losses |
6,774 | 19 | 6,793 | |||||||||
| Charge-offs |
(748 | ) | (3,026 | ) | (3,774 | ) | ||||||
|
|
|
|
|
|
|
|||||||
| Ending balance |
$ | 6,914 | $ | 3,281 | $ | 10,195 | ||||||
|
|
|
|
|
|
|
|||||||
| Ending balance: individually evaluated for impairment |
$ | 6,914 | $ | 3,281 | $ | 10,195 | ||||||
|
|
|
|
|
|
|
|||||||
All loans were individually evaluated for impairment as of December 31, 2012 and 2011. There were no loans collectively evaluated for impairment and there were no loans acquired with deteriorated credit quality. See Note 14.
An analysis of the allowance for loan losses and recorded investment in loans by loan type for the year ended December 31, 2010 is as follows (in thousands):
| Uninsured Loans |
Insured Loans |
Total | ||||||||||
| Loan impairment valuation |
||||||||||||
| Balance at beginning of period |
$ | 1,983 | $ | 9,616 | $ | 11,599 | ||||||
| Provision for loan losses |
— | 2,276 | 2,276 | |||||||||
| Charge-offs |
(2,601 | ) | (5,604 | ) | (8,205 | ) | ||||||
| Recoveries |
1,506 | — | 1,506 | |||||||||
|
|
|
|
|
|
|
|||||||
| Ending balance |
$ | 888 | $ | 6,288 | $ | 7,176 | ||||||
|
|
|
|
|
|
|
|||||||
| Ending balance: individually evaluated for impairment |
$ | 888 | $ | 6,288 | $ | 7,176 | ||||||
|
|
|
|
|
|
|
|||||||
F-30
Table of Contents
An analysis of the credit quality indicators by loan type at December 31, 2012 is presented in the following table (dollars in thousands):
| Uninsured | Insured(1) | |||||||||||||||
| S&P Designation |
Unpaid Principal Balance |
Percent | Unpaid Principal Balance |
Percent | ||||||||||||
| AAA |
$ | — | 0.00 | % | $ | — | 0.00 | % | ||||||||
| AA+ |
— | 0.00 | % | — | 0.00 | % | ||||||||||
| AA |
— | 0.00 | % | — | 0.00 | % | ||||||||||
| AA- |
2,072 | 43.58 | % | 408 | 81.44 | % | ||||||||||
| A+ |
2,548 | 53.97 | % | 93 | 18.56 | % | ||||||||||
| A1 |
— | 0.00 | % | — | 0.00 | % | ||||||||||
| A |
— | 0.00 | % | — | 0.00 | % | ||||||||||
| BB- |
134 | 2.45 | % | — | 0.00 | % | ||||||||||
|
|
|
|
|
|
|
|
|
|||||||||
| Total |
$ | 4,754 | 100 | % | $ | 501 | 100 | % | ||||||||
|
|
|
|
|
|
|
|
|
|||||||||
An analysis of the credit quality indicators by loan type at December 31, 2011 is presented in the following table (dollars in thousands):
| Uninsured | Insured(1) | |||||||||||||||
| S&P Designation | Unpaid Principal Balance |
Percent | Unpaid Principal Balance |
Percent | ||||||||||||
| AAA |
$ | — | 0.00 | % | $ | — | 0.00 | % | ||||||||
| AA+ |
694 | 5.08 | % | 222 | 1.26 | % | ||||||||||
| AA |
— | 0.00 | % | — | 0.00 | % | ||||||||||
| AA- |
6,558 | 48.05 | % | 9,085 | 51.57 | % | ||||||||||
| A+ |
3,060 | 22.42 | % | 1,287 | 7.31 | % | ||||||||||
| A1 |
— | 0.00 | % | — | 0.00 | % | ||||||||||
| A |
3,336 | 24.44 | % | 7,022 | 39.86 | % | ||||||||||
| BB- |
— | 0.00 | % | — | 0.00 | % | ||||||||||
|
|
|
|
|
|
|
|
|
|||||||||
| Total |
$ | 13,648 | 100 | % | $ | 17,616 | 100 | % | ||||||||
|
|
|
|
|
|
|
|
|
|||||||||
| (1) | All of the Company’s insured loans have lender protection coverage with Lexington Insurance Company. As of December 31, 2012, Lexington had a financial strength rating of “A” with a stable outlook by Standard & Poors (S&P). |
A summary of our investment in impaired loans at December 31, 2012 and 2011 is as follows (in thousands):
| 2012 | 2011 | |||||||
| Loan receivable, net |
$ | 3,011 | $ | 17,424 | ||||
| Interest receivable, net |
724 | 6,799 | ||||||
|
|
|
|
|
|||||
| Investment in impaired loans |
$ | 3,735 | $ | 24,223 | ||||
|
|
|
|
|
|||||
F-31
Table of Contents
An analysis of impaired loans with and without a related allowance at December 31, 2012 is presented in the following table by loan type (in thousands):
| Recorded Investment |
Unpaid Principal Balance |
Related Allowance |
Average Recorded Investment |
Interest Income Recognized |
||||||||||||||||
| With no related allowance recorded: |
||||||||||||||||||||
| Uninsured Loans |
$ | — | $ | — | $ | — | $ | — | $ | — | ||||||||||
| Insured Loans |
— | — | — | — | — | |||||||||||||||
| With an allowance recorded: |
||||||||||||||||||||
| Uninsured Loans |
3,623 | 4,735 | 3,413 | 6,887 | 1,444 | |||||||||||||||
| Insured Loans |
112 | 501 | 902 | 7,091 | 227 | |||||||||||||||
|
|
|
|
|
|
|
|
|
|
|
|||||||||||
| Total Impaired Loans |
$ | 3,735 | $ | 5,236 | $ | 4,315 | $ | 13,978 | $ | 1,671 | ||||||||||
|
|
|
|
|
|
|
|
|
|
|
|||||||||||
An analysis of impaired loans with and without a related allowance at December 31, 2011 is presented in the following table by loan type (in thousands):
| Recorded Investment |
Unpaid Principal Balance |
Related Allowance |
Average Recorded Investment |
Interest Income Recognized |
||||||||||||||||
| With no related allowance recorded: |
||||||||||||||||||||
| Uninsured Loans |
$ | — | $ | — | $ | — | $ | — | $ | — | ||||||||||
| Insured Loans |
— | — | — | — | — | |||||||||||||||
| With an allowance recorded: |
||||||||||||||||||||
| Uninsured Loans |
10,153 | 13,628 | 6,894 | 6,764 | 1,684 | |||||||||||||||
| Insured Loans |
14,070 | 10,391 | 3,301 | 24,847 | 3,195 | |||||||||||||||
|
|
|
|
|
|
|
|
|
|
|
|||||||||||
| Total Impaired Loans |
$ | 24,223 | $ | 24,019 | $ | 10,195 | $ | 31,611 | $ | 4,879 | ||||||||||
|
|
|
|
|
|
|
|
|
|
|
|||||||||||
The amount of the investment in impaired loans that had an allowance as of December 31, 2012 and 2011 was $3.7 million and $24.2 million, respectively. The amount of the investment in impaired loans that did not have an allowance was zero as of December 31, 2012 and 2011. The average investment in impaired loans during the years ended December 31, 2012 and 2011 was approximately $14.0 million and $31.6 million, respectively. The interest recognized on the impaired loans was approximately $1.7 million and $4.9 million for the years ended December 31, 2012 and 2011, respectively.
An analysis of past due at December 31, 2012 is presented in the following table by loan type (in thousands):
| 30-59 Days Past Due |
60-89 Days Past Due |
Greater Than 90 Days Past Due |
Total Past Due |
|||||||||||||
| Uninsured Loans |
$ | — | $ | — | $ | 599 | $ | 599 | ||||||||
| Insured Loans |
— | — | 315 | 315 | ||||||||||||
|
|
|
|
|
|
|
|
|
|||||||||
| Total |
$ | — | $ | — | $ | 914 | $ | 914 | ||||||||
|
|
|
|
|
|
|
|
|
|||||||||
F-32
Table of Contents
An analysis of past due at December 31, 2011 is presented in the following table by loan type (in thousands):
| 30-59 Days Past Due |
60-89 Days Past Due |
Greater Than 90 Days Past Due |
Total Past Due |
|||||||||||||
| Uninsured Loans |
$ | — | $ | — | $ | 599 | $ | 599 | ||||||||
| Insured Loans |
1,570 | — | — | 1,570 | ||||||||||||
|
|
|
|
|
|
|
|
|
|||||||||
| Total |
$ | 1,570 | $ | — | $ | 599 | $ | 2,169 | ||||||||
|
|
|
|
|
|
|
|
|
|||||||||
During the years ended December 31, 2012 and 2011, the Company originated zero and 58 loans receivable with a principal balance of zero and approximately $18.3 million, respectively. Loan interest receivable at December 31, 2012 and 2011 was approximately $727,000 and $5.3 million net of impairment of approximately $947,000, and $1.9 million, respectively. As of December 31, 2012, there were 22 loans with the average loan balance of approximately $181,000.
The allowance for interest receivable represents interest that is not expected to be collected. At the time the interest income was recognized and at the end of the reporting period in which the interest income was recognized, the interest income was believed to be collectible. The Company continually reassesses whether interest income is collectible in conjunction with its loan impairment analysis. The allowance for interest receivable represents interest that was determined to be uncollectible during a reporting period subsequent to the initial recognition of the interest income. As of December 31, 2012, the loan portfolio consisted of loans with original maturities of 2 to 4 years and variable interest rates at an average interest rate of 12.98%. During the year ended December 31, 2012 and 2011, 85 and 79 of our loans were paid off with proceeds of lender protection insurance totaling approximately $25.6 million and $24.0 million, respectively, of which approximately $16.7 million, and $15.6 million was for the principal of the loans and approximately $6.5 million and $6.0 million was for accrued interest, respectively, and accreted origination fees of approximately $7.1 million and $6.6 million, respectively. The Company had an impairment associated with these loans of approximately $4.9 million and $4.6 million, respectively. We recognized a loss of approximately $29,000 and $14,000 on these transactions, respectively.
Our premium finance borrowers were generally referred to us through independent insurance agents and brokers although, prior to January 2009, we originated some premium finance loans that were sold by life insurance agents that we employed. In certain of these instances, the life insurance agents employed by the Company worked with external brokers and agents to obtain insurance for policyholders with the Company extending a premium finance loan to a borrower. We refer to these instances as the “retail non-seminar business,” which began in December 2006 and was discontinued in January 2009. In total, the Company originated 114 premium finance loans as part of the retail non-seminar business. As of December 31, 2012, the Company had 12 policies in its portfolio that once served as collateral for premium finance loans derived through the retail non-seminar business.
During the year ended December 31, 2012 two loans were paid off with proceeds from trusts totaling $1.0 million of which $686,000 was for principal of the loans and $280,000 was for accrued interest, and accreted origination fees of $262,000. The Company had an impairment associated with these loans of $101,000 and recognized a loss of $96,000.
F-33
Table of Contents
NOTE 10—ORIGINATION FEES
A summary of the balances of origination fees that are included in loans receivable in the consolidated balance sheet as of December 31 is as follows (in thousands):
| 2012 | 2011 | |||||||
| Loan origination fees gross |
$ | 1,334 | $ | 10,844 | ||||
| Un-accreted origination fees |
(190 | ) | (2,666 | ) | ||||
| Amortized loan originations costs |
13 | 129 | ||||||
|
|
|
|
|
|||||
| $ | 1,157 | $ | 8,307 | |||||
|
|
|
|
|
|||||
Loan origination fees are fees payable to the Company on the date of loan maturity or repayment. Loan origination costs are deferred costs that are directly related to the creation of the loan receivable.
NOTE 11—STOCK-BASED COMPENSATION
In connection with the Company’s initial public offering, the Company established the Imperial Holdings 2011 Omnibus Incentive Plan (the “Omnibus Plan”). The purpose of the Omnibus Plan is to attract, retain and motivate participating employees and to attract and retain well-qualified individuals to serve as members of the board of directors, consultants and advisors through the use of incentives based upon the value of our common stock. Awards under the Omnibus Plan may consist of incentive awards, stock options, stock appreciation rights, performance shares, performance units, and shares of common stock, restricted stock, restricted stock units or other stock-based awards as determined by the compensation committee. The Omnibus Plan provides that an aggregate of 1,200,000 shares of common stock are reserved for issuance under the Omnibus Plan, subject to adjustment as provided in the Omnibus Plan. The Company recognized approximately $305,000 and $1.5 million in stock-based compensation expense relating to stock options it granted under the Omnibus Plan during the years ended December 31, 2012 and 2011, respectively. The Company incurred additional stock-based compensation expense of approximately $290,000 related to the conversion of two phantom stock agreements it had with two employees into 27,000 shares of common stock in connection with its corporate conversion in the first quarter of 2011 and approximately $4,000 and $34,000 in stock-based compensation relating to restricted stock granted to its board of directors during the years ended December 31, 2012 and 2011, respectively. Prior to our initial public offering, the Company had no equity compensation plan.
Options
As of December 31, 2012, options to purchase 487,414 shares of common stock were outstanding and unexercised under the Omnibus Plan at a weighted average exercise price of $10.75 per share. All of the outstanding options expire seven years after the date of grant and were granted with a strike price at $10.75 which was the offering price of our initial public offering or fair market value (closing price) of the stock on the date of grant and vest over three years from the date of issue.
The Company has used the Black-Scholes model to calculate fair values of options awarded. This model requires assumptions as to expected volatility, dividends, terms, and risk free rates. Assumptions used for the periods covered herein, are outlined in the table below:
| Year Ended December 31, 2011 |
||||
| Expected Volatility |
54.18% – 54.23 | % | ||
| Expected Dividend |
0 | % | ||
| Expected Term in Years |
4.5 | |||
| Risk Free Rate |
2.16% – 2.29 | % | ||
F-34
Table of Contents
The Company commenced its initial public offering of common stock in February 2011. Accordingly, there was no public market for the Company’s common stock prior to this date. Therefore, the Company identified comparable public entities and used the average volatility of those entities to reasonably estimate its expected volatility. The Company does not expect to pay dividends on its common stock for the foreseeable future. Expected term is the period of time over which the options granted are expected to remain outstanding and is based on the simplified method as outlined in the SEC Staff Accounting Bulletin 110. The Company will continue to estimate expected lives based on the simplified method until reliable historical data becomes available. The risk free rate is based on the U.S Treasury yield curve in effect at the time of grant for the appropriate life of each option.
The following table presents the activity of the Company’s outstanding stock options of common stock for the year ended December 31, 2012:
| Common Stock Options |
Number of Shares |
Weighted Average Price per Share |
Weighted Average Remaining Contractual Term |
Aggregate Intrinsic Value |
||||||||||||
| Options outstanding, December 31, 2011 |
627,419 | — | — | $ | — | |||||||||||
| Options granted |
— | $ | 10.75 | 6.11 | $ | — | ||||||||||
| Options exercised |
— | — | — | — | ||||||||||||
| Options forfeited |
(140,105 | ) | 10.75 | — | — | |||||||||||
| Options expired |
— | — | — | — | ||||||||||||
|
|
|
|||||||||||||||
| Options outstanding, December 31, 2012 |
487,314 | $ | 10.75 | 5.11 | $ | — | ||||||||||
|
|
|
|||||||||||||||
| Exercisable at December 31, 2012 |
287,988 | 10.74 | 5.11 | $ | — | |||||||||||
|
|
|
|||||||||||||||
| Unvested at December 31, 2012 |
199,326 | $ | 10.75 | 5.11 | $ | — | ||||||||||
|
|
|
|||||||||||||||
As of December 31, 2012, all outstanding stock options had an exercise price above the fair market value of the common stock on that date.
The remaining unamortized amounts of approximately $336,000 and $21,000 will be expensed during 2013 and 2014, respectively.
Restricted Stock
3,507 shares of restricted stock granted to our directors under the Omnibus Plan subject to a one year vesting schedule commencing on the date of grant vested during the year ended December 31, 2012. The fair value of the unvested restricted stock was valued at $38,000 based on the closing price of the Company’s shares on the grant date.
The following table presents the activity of the Company’s unvested restricted common shares for the year ended December 31, 2012:
| Common Unvested Shares |
Number of Shares |
|||
| Outstanding December 31, 2011 |
3,507 | |||
| Granted |
— | |||
| Vested |
(3,507 | ) | ||
| Forfeited |
— | |||
|
|
|
|||
| Outstanding December 31, 2012 |
— | |||
|
|
|
|||
There were no restricted stock awards granted during the year ended December 31, 2012.
F-35
Table of Contents
NOTE 12—STRUCTURED SETTLEMENTS
The balances of the Company’s structured settlements are as follows (in thousands):
| December 31, | December 31, | |||||||
| 2012 | 2011 | |||||||
| Structured settlements - at cost |
$ | 1,574 | $ | 1,553 | ||||
| Structured settlements - at fair value |
1,680 | 12,376 | ||||||
|
|
|
|
|
|||||
| Structured settlements receivable, net |
$ | 3,254 | $ | 13,929 | ||||
|
|
|
|
|
|||||
All structured settlements that were acquired subsequent to July 1, 2010 were marked to fair value. Structured settlements that were acquired prior to July 1, 2010 were recorded at cost. During 2011, the Company reacquired certain structured settlements that were originally acquired prior to July 1, 2010 and the Company continued to carry those structured settlements at cost upon reacquisition.
Certain financing arrangements for the Company’s structured settlements are described below:
Life-Contingent Structured Settlement Facility
On the same day the Omnibus Termination Agreement was executed, December 30, 2011, Washington Square Financial, LLC (“WSF”) entered into a forward purchase and sale agreement (“PSA”) to sell up to $40.0 million of life contingent structured settlement receivables to Compass Settlements LLC (“Compass”), an entity managed by Beacon Annuity Fund, LP (“Beacon”). Subject to predetermined eligibility criteria and on-going funding conditions, Compass committed, in increments of $5.0 million, up to $40.0 million to purchase life-contingent structured settlement receivables from WSF. The PSA obligates WSF to sell the life-contingent structured settlement receivables it originates to Compass on an exclusive basis for twenty-four months, subject to Compass maintaining certain purchase commitment levels. Additionally, the Company has agreed to guaranty WSF’s obligation to repurchase any ineligible receivables sold under the PSA and certain other related obligations.
For the year ended December 31, 2012, the Company recognized income from the sale of 380 structured settlement transactions under this facility generating income of approximately $2.6 million recorded as gain on sale of structured settlements in the attached financial statements. Of the 380 structured transactions, 107 were previously recorded at the market rate generating income of approximately $1.1 million and the change in value was recorded as an unrealized change in fair value on the financial statements presented for the year ended December 31, 2011 and 73 were previously recorded at the market rate generating income of approximately $712,000 with the change in value recorded as an unrealized change in fair value on the financial statements presented for the year ended December 31, 2012.
The Company also realized income of approximately $72,000 that was recorded as an unrealized change in fair value during the year ended December 31, 2012 on structured settlements that are intended for sale to Compass.
8.39% Fixed Rate Asset Backed Variable Funding Notes
Imperial Settlements Financing 2010, LLC (“ISF 2010”) was formed as an affiliate of the Company to serve as a special purpose financing entity to allow the Company to sell structured settlements and assignable annuities, which are referred to as receivables, to ISF 2010 and ISF 2010 to borrow against certain of its receivables to provide ISF 2010 liquidity. ISF 2010 is a non-consolidated special purpose financing entity. On September 24, 2010, ISF 2010 entered into an arrangement to obtain up to $50 million in financing. Under this arrangement, a subsidiary of Partner Re, Ltd. (the “noteholder”) became the initial holder of ISF 2010’s 8.39% Fixed Rate Asset Backed Variable Funding Note issued under a master trust indenture and related indenture
F-36
Table of Contents
supplement (collectively, the “Indenture”) pursuant to which the noteholder has committed to advance ISF 2010 up to $50 million upon the terms and conditions set forth in the Indenture. The note is secured by the receivables that ISF 2010 acquires from the Company from time to time. The note is due and payable on or before January 1, 2057, but principal and interest must be repaid pursuant to a schedule of fixed payments from the receivables that secure the notes. The arrangement generally has a concentration limit of 15% for the providers of the receivables that secure the notes. Wilmington Trust is the collateral trustee. As of December 31, 2012 and December 31, 2011, the balance of the notes outstanding on the special purpose financing entity’s books was $43.2 million and $20.6 million, respectively.
Upon the occurrence of certain events of default under the Indenture, all amounts due under the note are automatically accelerated. The Company’s maximum exposure related to ISF 2010 is limited to 5% of the dollar value of the ISF 2010 transactions, which is held back by ISF 2010 at the time of sale, and is designed to absorb potential losses in collecting the receivables. The obligations of ISF 2010 are non-recourse to the Company. The total funds held back by ISF 2010 as of December 30, 2012 and December 31, 2011 were approximately $2.2 million and $1.0 million and are included in investment in affiliate in the accompanying consolidated balance sheet.
During the years ended December 31, 2012 and 2011, the Company sold 565 and 485 term certain structured settlements, respectively, 181 and 12 of which were originated in 2011 and 2010, respectively, generating income of approximately of $3.2 million and $129,000, respectively, which was recorded as an unrealized change in fair value of structured settlements in 2011 and 2010, respectively. The Company originated and sold 384 and 307 guaranteed structured settlement transactions under this facility generating income of approximately $4.9 million and $3.8 million, respectively, which was recorded as a realized gain on sale of structured settlements during the years ended December 31, 2012 and 2011, respectively. During the year ended December 31, 2011, the Company also had three SPV’s that pledged 38 guaranteed structured settlement transactions under this facility generating income of approximately $32,000, which was recorded as an unrealized change in the fail value of structured settlements. The Company also realized income of approximately $559,000 and $3.4 million that was recorded as an unrealized change in fair value during the years ended December 31, 2012 and 2011, respectively, on structured settlements that are intended for sale to ISF 2010. The Company receives 95% of the purchase price in cash from ISF 2010. Of the remaining 5%, which represents the Company’s interest in ISF 2010, 1% is required to be contributed to a cash reserve account held by Wilmington Trust. In addition, the Company also purchased and sold 131 guaranteed structure transactions generating income of $64,000 that was recorded as a realized gain on sale of structured settlements in 2011.
When the transfer of the receivables occurs, the Company records the transaction as a sale and derecognizes the asset from its balance sheet. In determining whether the Company is the primary beneficiary of the trust, the Company concluded that it does not control the servicing, which is the activity which most significantly impacts the trust performance. An independent third party is the master servicer and they can only be replaced by the control partner, which is the entity that holds the majority of the outstanding notes. The Company is a back-up servicer which is insignificant to ISF 2010 performance.
Washington Square Financial 3rd Party Sales
For the year ended December 31, 2012, in addition to its intended sales to Compass and ISF 2010, the Company also sold 282 deals to unrelated parties for $6.7 million generating income of $4.0 million recorded as a gain on sale of structured settlements and $322,000 that was previously recorded as an unrealized change in fair value.
For the years ended December 31, 2012 and 2011, respectively, the Company recorded income of approximately $158,000 and $135,000, respectively, that was recorded as unrealized change in fair value on structured settlements that are intended for sale to other parties
Total income recognized through accretion of interest income on structured settlement transactions for the years ended December 31, 2012 and 2011, respectively, was approximately $329,000 and $552,000, respectively.
F-37
Table of Contents
Such income was recognized in interest income in the accompanying consolidated statement of operations. The receivables at December 31, 2012 and December 31, 2011 were approximately $3.3 million and $13.9 million, respectively, net of a discount of approximately $4.6 million and $27.8 million, respectively.
The Company recognized a gain on the sale of approximately $215,000 through the collection of holdback funds during the year ended December 31, 2011. The holdback is equal to the aggregate amount of payments due and payable by the annuity holder within 90 days after the date of sale. These amounts are held back in accordance with the purchase agreement and were released upon proof of collections by the Company acting as servicer.
NOTE 13—INVESTMENT IN LIFE SETTLEMENTS (LIFE INSURANCE POLICIES)
During the years ended December 31, 2012 and 2011, the Company acquired life insurance policies as a result of certain of the Company’s borrowers defaulting on premium finance loans and relinquishing the underlying policy to the Company in exchange for being released from further obligations under the loan. In 2011, the Company also began acquiring life insurance policies in the secondary and tertiary markets. The Company elected to account for these policies using the fair value method in accordance with ASC 325-30-50 Investments – Other – Investment in Insurance Contracts. Under the fair value method, the Company recognizes the initial investment at the purchase price. For policies that were relinquished in satisfaction of premium finance loans at maturity, this is the loan carrying value and for policies purchased in the secondary or tertiary markets, this is the amount of cash outlay at the time of purchase. At each reporting period, the Company re-measures the investment at fair value in its entirety and recognizes changes in fair value in earnings in the period in which the changes occur. See Note 14.
As of December 31, 2012 and 2011, the Company owned 214 and 190 policies, respectively, with an aggregate estimated fair value of investments in life settlements of $113.4 million and $90.9 million, respectively.
The weighted average life expectancy calculated based on death benefit of insureds in the policies owned by the Company at December 31, 2012 was 10.6 years. The following table describes the Company’s investment in life settlements as of December 31, 2012 (dollars in thousands):
| Remaining Life Expectancy (In Years) |
Number of Life Settlement Contracts |
Fair Value |
Face Value |
|||||||||
| 0 - 1 |
— | $ | — | $ | — | |||||||
| 1 - 2 |
— | — | — | |||||||||
| 2 - 3 |
1 | 1,222 | 2,500 | |||||||||
| 3 - 4 |
4 | 3,319 | 11,450 | |||||||||
| 4 - 5 |
7 | 11,375 | 30,950 | |||||||||
| Thereafter |
202 | 97,525 | 1,028,256 | |||||||||
|
|
|
|
|
|
|
|||||||
| Total |
214 | 113,441 | 1,073,156 | |||||||||
|
|
|
|
|
|
|
|||||||
F-38
Table of Contents
The weighted average life expectancy calculated based on death benefit of insureds in the policies owned by the Company at December 31, 2011 was 10.6 years. The following table describes the Company’s investment in life settlements as of December 31, 2011 (in thousands):
| Remaining Life Expectancy (In Years) |
Number of Life Settlement Contracts |
Fair Value |
Face Value |
|||||||||
| 0 – 1 |
— | $ | — | $ | — | |||||||
| 1 – 2 |
1 | 3,033 | 5,000 | |||||||||
| 2 – 3 |
2 | 2,484 | 4,500 | |||||||||
| 3 – 4 |
4 | 7,084 | 20,200 | |||||||||
| 4 – 5 |
3 | 2,357 | 7,950 | |||||||||
| Thereafter |
180 | 75,959 | 897,816 | |||||||||
|
|
|
|
|
|
|
|||||||
| Total |
190 | 90,917 | 935,466 | |||||||||
|
|
|
|
|
|
|
|||||||
Premiums to be paid for each of the five succeeding fiscal years to keep the life insurance policies in force as of December 31, 2012, are as follows (in thousands):
| 2013 |
27,703 | |||
| 2014 |
26,281 | |||
| 2015 |
26,533 | |||
| 2016 |
26,978 | |||
| 2017 |
28,002 | |||
| Thereafter |
324,884 | |||
|
|
|
|||
| $ | 460,381 | |||
|
|
|
The amount of $460.4 million noted above represents the estimated total future premium payments required to keep the life insurance policies in force during the life expectancies of all the underlying insured lives and does not give effect to projected receipt of death benefits. The Company has not yet experienced the mortalities of insureds or received the resulting death benefits from our life insurance policies (other than from policies with subrogation rights that are not reported on our balance sheet and that are considered contingent assets). The estimated total future premium payments could increase or decrease significantly to the extent that actual mortalities of insureds differs from the estimated life expectancies.
NOTE 14—FAIR VALUE MEASUREMENTS
We carry investments in life and structured settlements at fair value in the consolidated balance sheets. Fair value is defined as an exit price, representing the amount that would be received to sell an asset or paid to transfer a liability in an orderly transaction between market participants at the measurement date. As such, fair value is a market based measurement that should be determined based on assumptions that market participants would use in pricing an asset or liability. Fair value measurements are classified based on the following fair value hierarchy:
Level 1—Valuation is based on unadjusted quoted prices in active markets for identical assets and liabilities that are accessible at the reporting date. Since valuations are based on quoted prices that are readily and regularly available in an active market, valuation of these products does not entail a significant degree of judgment.
Level 2—Valuation is determined from pricing inputs that are other than quoted prices in active markets that are either directly or indirectly observable as of the reporting date. Observable inputs include quoted prices for similar assets or liabilities in active markets, quoted prices for identical or similar assets or liabilities in markets that are not active, and interest rates and yield curves that are observable at commonly quoted intervals.
F-39
Table of Contents
Level 3—Valuation is based on inputs that are both significant to the fair value measurement and unobservable. Level 3 inputs include situations where there is little, if any, market activity for the financial instrument. The inputs into the determination of fair value generally require significant management judgment or estimation.
Assets and liabilities measured at fair value on a recurring basis
The balances of the Company’s assets measured at fair value on a recurring basis as of December 31, 2012, are as follows (in thousands):
| Level 1 | Level 2 | Level 3 | Total Fair Value |
|||||||||||||
| Assets: |
||||||||||||||||
| Investment in life settlements |
$ | — | $ | — | $ | 113,441 | $ | 113,441 | ||||||||
| Structured settlement receivables |
— | — | 1,680 | 1,680 | ||||||||||||
| Investment securities available for sale |
— | 12,147 | — | 12,147 | ||||||||||||
|
|
|
|
|
|
|
|
|
|||||||||
| $ | — | $ | 12,147 | $ | 115,121 | $ | 127,268 | |||||||||
|
|
|
|
|
|
|
|
|
|||||||||
The balances of the Company’s assets measured at fair value on a recurring basis as of December 31, 2011, are as follows (in thousands):
| Level 1 | Level 2 | Level 3 | Total Fair Value |
|||||||||||||
| Assets: |
||||||||||||||||
| Investment in life settlements |
$ | — | $ | — | $ | 90,917 | $ | 90,917 | ||||||||
| Structured settlement receivables |
— | — | 12,376 | 12,376 | ||||||||||||
| Investment securities available for sale |
— | 57,242 | — | 57,242 | ||||||||||||
|
|
|
|
|
|
|
|
|
|||||||||
| $ | — | $ | 57,242 | $ | 103,293 | $ | 160,535 | |||||||||
|
|
|
|
|
|
|
|
|
|||||||||
The Company values its investment in life settlement portfolio in two classes, non-premium financed and premium financed. In considering the categories, it is generally believed that market participants would require a lower risk premium for policies that were non-premium financed, while a higher risk premium would be required for policies that were premium financed.
| ($ in thousands) | Quantitative Information about Level 3 Fair Value Measurements | |||||||||||||
| Fair Value at 12/31/12 |
Aggregate death benefit 12/31/12 |
Valuation Technique (s) |
Unobservable Input |
Range ( Weighted Average) | ||||||||||
| Non-premium financed |
$ | 36,039 | $ | 206,450 | Discounted cash flow | Discount rate | 14.80% - 21.30% | |||||||
| Life expectancy evaluation | 9.1 years | |||||||||||||
| Premium financed |
77,402 | 866,706 | Discounted cash flow | Discount rate | 16.80% - 33.80% | |||||||||
|
|
|
|
|
|||||||||||
| Life expectancy evaluation | 10.9 years | |||||||||||||
| Investment in life settlements |
$ | 113,441 | $ | 1,073,156 | Discounted cash flow | Discount rate | (24.01%) | |||||||
| Life expectancy evaluation | (10.6 years) | |||||||||||||
|
|
|
|
|
|
|
| ||||||||
| Structured settlements receivables |
$ | 1,680 | Discounted cash flow | Facility sales discount rates | 6.25% - 15.35% | |||||||||
|
|
|
|
|
|
|
| ||||||||
Following is a description of the methodologies used to estimate the fair values of assets and liabilities measured at fair value on a recurring basis and within the fair value hierarchy.
Investment in life settlements— The Company has elected to account for the life settlement policies it acquires using the fair value method. Due to the inactive market for life settlements, the Company uses a present
F-40
Table of Contents
value technique to estimate the fair value of our investments in life settlements, which is a Level 3 fair value measurement as the significant inputs are unobservable and require significant management judgment or estimation. The Company currently uses a probabilistic method of valuing life insurance policies, which we believe to be the preferred valuation method in the industry. The most significant assumptions which we estimate are the life expectancy of the insured and the discount rate.
In determining the life expectancy estimate, we analyze medical reviews from independent secondary market life expectancy providers (each a “LE provider”). An LE provider reviews the medical records and identifies all medical conditions it feels are relevant to the life expectancy of the insured. Debits and credits are then assigned by each LE provider to the individual’s health based on these medical conditions. The debit or credit that an LE provider assigns to a medical condition is derived from the experience of mortality attributed to this condition in the portfolio of lives that it monitors. The health of the insured is summarized by the LE provider into a life assessment of the individual’s life expectancy expressed both in terms of months and in mortality factor.
The resulting mortality factor represents an indication as to the degree to which the given life can be considered more or less impaired than a standard life having similar characteristics (e.g. gender, age, smoking, etc.). For example, a standard insured (the average life for the given mortality table) would carry a mortality rating of 100%. A similar but impaired life bearing a mortality rating of 200% would be considered to have twice the chance of dying earlier than the standard life. Historically, the Company has procured the majority of its life expectancy reports from two life expectancy report providers and only used AVS life expectancy reports for valuation purposes. Beginning in the quarter ended September 30, 2012, the Company began utilizing life expectancy reports from 21st Services for valuation purposes and began averaging or “blending,” the results of the two life expectancy reports to establish a composite mortality factor. However, when “blending” the AVS and 21st Services life expectancy reports, if the difference in the probability of mortality between the reports is greater than 150%, the Company will reduce the higher mortality factor until the difference is 150%.
The probability of mortality for an insured is then calculated by applying the blended life expectancy estimate to a mortality table. The mortality table is created based on the rates of death among groups categorized by gender, age, and smoking status. By measuring how many deaths occur during each year, the table allows for a calculation of the probability of death in a given year for each category of insured people. The probability of mortality for an insured is found by applying the mortality rating from the life expectancy assessment to the probability found in the actuarial table for the insured’s age, sex and smoking status. As discussed above in Use of Updated Life Expectancies and Change in Mortality Table in Management’s Discussion and Analysis of Financial Condition and Results of Operations, the Company has historically applied an actuarial table developed by a third party. However, beginning in the quarter ended September 30, 2012, the Company transitioned to a table developed by the U.S. Society of Actuaries known as the 2008 Valuation Basic Table, or the 2008 VBT. However, because the 2008 VBT table does not account for anticipated improvements in mortality in the insured population, the table was modified by outside consultants to reflect these expected mortality improvements. The Company believes that the change in mortality table does not materially impact the valuation of its life insurance policies and that its adoption of a modified 2008 VBT table is consistent with modified tables used by market participants and third party medical underwriters. The Company believes that the change in mortality table does not materially impact the valuation of its life insurance policies and that its adoption of a modified 2008 VBT table is consistent with modified tables used by market participants and third party medical underwriters.
The mortality rating is used to create a series of best estimate probablistic cash flows. This probability represents a mathematical curve known as a mortality curve. This curve is then used to generate a series of expected cash flows over the remaining expected lifespan of the insured and the corresponding policy. A discounted present value calculation is then used to determine the value of the policy. If the insured dies earlier than expected, the return will be higher than if the insured dies when expected or later than expected.
F-41
Table of Contents
The calculation allows for the possibility that if the insured dies earlier than expected, the premiums needed to keep the policy in force will not have to be paid. Conversely, the calculation also considers the possibility that if the insured lives longer than expected, more premium payments will be necessary. Based on these considerations, each possible outcome is assigned a probability and the range of possible outcomes is then used to create a price for the policy.
Life expectancy sensitivity analysis
As is the case with most market participants at December 31, 2012, the Company used a blend of life expectancies that are provided by two third-party LE providers. These are estimates of an insured’s remaining years. If all of the insured lives in the Company’s life settlement portfolio live six months shorter or longer than the life expectancies provided by these third parties, the change in fair market value would be as follows (dollars in thousands):
| Life Expectancy Months Adjustment |
Value | Change in Value | ||||||
| +6 |
95,658 | (17,783 | ) | |||||
| - |
113,441 | — | ||||||
| -6 |
132,540 | 19,099 | ||||||
As noted above, the Company takes an average, or blend, of the two life expectancy reports to derive a composite mortality factor, unless the probability of mortality between the reports is greater than 150%. In such instances and as reflected in the fair market value at December 31, 2012, the Company will cap the higher mortality factor at amount that is 150% above the lower mortality factor, which ultimately reduces the mortality factor inputted into the Company’s fair value model. At December 31, 2012, had the Company not implemented such a cap on affected policies, the fair value of the Company’s portfolio would have increased from the reported amount by $9.5 million. Additionally, the Company lengthened the life expectancy inputs to its fair value model on 45 policies with life expectancy reports that were more than two years old at December 31, 2012 based on the average lengthening reported on the 149 policies where update life expectancy reports were received. Had the Company not implemented such an adjustment on affected policies, the fair value of the Company’s portfolio would have increased from the reported amount by $5.8 million.
Discount rate
The discount rate incorporates current information about market interest rates, the credit exposure to the insurance company that issued the life insurance policy and our estimate of the risk premium an investor in the policy would require.
The Company believes that investors in esoteric assets such as life insurance policies typically target yields averaging between 12%—17% for investments of more than a 5 year duration, and had historically used a 15%—17% range of discount rates to value its life insurance policies. In the third quarter of 2011 and in the immediate aftermath of becoming aware of the USAO investigation, the Company substantially increased the discount rates inputted into its fair value model as it believed that the USAO Investigation along with certain unfavorable court decisions unrelated to the Company contributed to a contraction in the marketplace that has continued to reverberate. Since that time, the Company has been re-evaluating its discount rates at the end of every reporting period in order to reflect the estimated discount rates that could reasonably be used in a market transaction involving the Company’s portfolio of life insurance policies. In doing so, the Company relies on management insight, engages third party consultants to corroborate its assessment, engages in discussions with other market participants and potential financing sources and extrapolates the discount rate underlying actual sales of policies.
Although the Company believes that its entry into the Non-Prosecution Agreement had a positive effect on the market generally and for premium financed life insurance policies specifically, the Company believes that, when given the choice to invest in a policy that was associated with the Company’s premium finance business and a similar policy without such an association, all else being equal, an investor would have generally opted to
F-42
Table of Contents
invest in the policy that was not associated with the Company’s premium finance business. However, since entering into the Non-Prosecution Agreement, investors have required less of a risk premium to transact in these policies and the Company expects that, in time, investors will continue to require less of a risk premium to transact in policies associated with its premium finance business.
Credit exposure of insurance company
The company considers the financial standing of the issuer of each policy typically, we seek to hold policies issued by insurance companies with investment-grade ratings of at least single-A. At December 31, 2012, the Company had six life insurance policies issued by one carrier that was rated non-investment grade by S&P at December 31, 2012. In order to compensate a market participant for the perceived credit and challenge risks associated with these policies, the Company applied an additional 300 basis point risk premium.
Estimated risk premium
As of December 31, 2012, the Company owned 214 policies with an aggregate investment in life settlements of $113.4 million. Of these 214 policies, 171 were previously premium financed and are valued using discount rates that range from 16.80% to 33.80%. The remaining 43 policies are valued using discount rates that range from 14.80% to 21.30%. As of December 31, 2012, the weighted average discount rate calculated based on death benefit used in valuing the policies in our life settlement portfolio was 24.01%.
The discount rate incorporates current information about market interest rates, the credit exposure to the insurance company that issued the life insurance policy and our estimate of the risk premium an investor in the policy would require. The extent to which the fair value could vary in the near term has been quantified by evaluating the effect of changes in the weighted average discount rate on the death benefit used to estimate the fair value. If the weighted average discount rate were increased or decreased by 1/2 of 1% and the other assumptions used to estimate fair value remained the same, the change in fair market value would be as follows (dollars in thousands):
Market interest rate sensitivity analysis
| Weighted Average Rate Calculated Based on Death |
Rate Adjustment | Value | Change in Value | |||||||||
| 23.51% |
-.50 | % | 116,300 | 2,859 | ||||||||
| 24.01% |
— | 113,441 | — | |||||||||
| 24.51% |
+.50 | % | 110,694 | (2,747 | ) | |||||||
Future changes in the discount rates we use to value life insurance policies could have a material effect on our yield on life settlement transactions, which could have a material adverse effect on our business, financial condition and results of our operations.
At the end of each reporting period we re-value the life insurance policies using our valuation model in order to update our loan impairment valuation for loans receivable and our estimate of fair value for investments in policies held on our balance sheet. This includes reviewing our assumptions for discount rates and life expectancies as well as incorporating current information for premium payments and the passage of time.
Structured settlement receivables— All structured settlements that were acquired subsequent to July 1, 2010 were marked to fair value. Structured settlements that were acquired prior to July 1, 2010 were recorded at cost. We make this election because it is our intention to sell these assets within the next twelve months. Structured settlements are purchased at effective yields which are fixed. Purchase discounts are accreted into interest income using the effective-interest method for those structured settlements marked to fair value. As of December 31, 2012, the Company had 36 newly-acquired structured settlements with an estimated fair value of $1.7 million. The average sales discount rate for these newly-acquired structured settlements was 9.25%.
F-43
Table of Contents
Changes in Fair Value
The following tables provide a roll-forward in the changes in fair value for the year ended December 31, 2012, for all assets for which the Company determines fair value using a material level of unobservable (Level 3) inputs (in thousands):
| Life Settlements: |
||||
| Balance, December 31, 2011 |
$ | 90,917 | ||
| Purchase of policies |
130 | |||
| Acquired in foreclosure |
5,724 | |||
| Unrealized change in fair value |
(5,660 | ) | ||
| Transfers into level 3 |
— | |||
| Trannsfers out of level 3 |
— | |||
| Sale of policies |
(5,334 | ) | ||
| Premiums paid |
27,804 | |||
| Policies lapsed/written off |
(140 | ) | ||
| Balance, December 31, 2012 |
$ | 113,441 | ||
|
|
|
|||
| Changes in fair value included in earnings for the period relating to assets held at December 31, 2012 |
$ | (5,898 | ) | |
|
|
|
The Company recorded unrealized change in fair value of approximately $5.7 million and a gain of approximately $570,000 for the year ended December 31, 2012 and 2011, respectively.
| Structured Settlements: |
||||
| Balance, December 31, 2011 |
$ | 12,376 | ||
| Purchase of contracts |
24,313 | |||
| Unrealized change in fair value |
1,823 | |||
| Sale of contracts |
(36,615 | ) | ||
| Collections |
(217 | ) | ||
| Transfers into level 3 |
— | |||
| Transfers out of level 3 |
— | |||
| Balance, December 31, 2012 |
$ | 1,680 | ||
|
|
|
|||
| Changes in fair value included in earnings for the period relating to assets held at December 31, 2012 |
$ | 255 | ||
|
|
|
F-44
Table of Contents
The following tables provide a roll-forward in the changes in fair value for the year ended December 31, 2011, for all assets for which the Company determines fair value using a material level of unobservable (Level 3) inputs (in thousands).
| Life Settlements: |
||||
| Balance, December 31, 2010 |
$ | 17,138 | ||
| Purchase of policies |
50,480 | |||
| Acquired in foreclosure |
6,409 | |||
| Unrealized change in fair value |
570 | |||
| Premiums paid |
16,320 | |||
| Transfers into Level 3 |
— | |||
| Transfers out of Level 3 |
— | |||
|
|
|
|||
| Balance, September 30, 2011 |
$ | 90,917 | ||
|
|
|
|||
| Changes in fair value included in earnings for the period relating to assets held at December 31, 2011 |
$ | 570 | ||
|
|
|
|||
| Structured Settlements: |
||||
| Balance, December 31, 2010 |
$ | 1,446 | ||
| Purchase of contracts |
27,545 | |||
| Unrealized change in fair value |
5,302 | |||
| Sale of contracts |
(21,723 | ) | ||
| Collections |
(194 | ) | ||
| Transfers into Level 3 |
— | |||
| Transfers out of Level 3 |
— | |||
|
|
|
|||
| Balance, September 30, 2011 |
12,376 | |||
|
|
|
|||
| Changes in fair value included in earnings for the period relating to assets held at December 31, 2011 |
$ | 4,218 | ||
|
|
|
There were no transfers of financial assets between levels of the fair value hierarchy during the years ended December 31, 2012 and 2011.
Assets and liabilities measured at fair value on a non-recurring basis
Following is a description of the methodologies used to estimate the fair values of assets and liabilities measured at fair value on a non-recurring basis, and the level within the fair value hierarchy in which those measurements are typically classified.
The Company’s impaired loans are measured at fair value on a non-recurring basis, as the carrying value is based on the fair value of the underlying collateral. The method used to estimate the fair value of impaired collateral-dependent loans depends on the nature of the collateral. For collateral that has lender protection insurance coverage, the fair value measurement is considered to be Level 2 as the insured value is an observable input and there are no material unobservable inputs. For collateral that does not have lender protection insurance coverage, the fair value measurement is considered to be Level 3 as the estimated fair value is based on a model whose significant inputs are the life expectancy of the insured and the discount rate, which are not observable inputs. As of December 31, 2012 and 2011, the Company had insured impaired loans with a net carrying value, which includes principal, accrued interest, and accreted origination fees, net of impairment, of approximately $112,000 and $14.1 million, respectively. As of December 31, 2012 and 2011, the Company had uninsured impaired loans (Level 3) with a net carrying value of approximately $3.6 million and $10.2 million, respectively. The provision for losses on loans receivable related to impaired loans was approximately 515,000 and $7.6 million for the years ended December 31, 2012 and 2011, respectively. See Notes 9 and 13.
F-45
Table of Contents
NOTE 15—NOTES AND DEBENTURE PAYABLE
A summary of the principal balances of notes payable included in the consolidated balance sheet as of December 31, 2012 and 2011 is as follows (in thousands):
| Total Notes Payble | ||||||||
| December 31, | December 31, | |||||||
| 2012 | 2011 | |||||||
| Cedar Lane |
$ | — | $ | 19,104 | ||||
| White Oak, Inc. |
— | 173 | ||||||
|
|
|
|
|
|||||
| Total |
— | 19,277 | ||||||
Cedar Lane
On December 2, 2009, Imperial PFC Financing II, LLC was formed to enter into a financing agreement with Cedar Lane Capital, LLC, so that Imperial PFC Financing II, LLC could purchase Imperial Premium Finance notes for cash or a participation interest in the notes. The financing agreement was for a minimum of $5 million to a maximum of $250 million. The agreement was for a term of 28 months from the time of borrowing and the borrowings bore an annual interest rate of 14%, 15% or 16%, depending on the class of lender and were compounded monthly. All of the assets of Imperial PFC Financing II, LLC served as collateral under this credit facility. The Company was subject to several restrictive covenants under the facility. The restrictive covenants included items such as restrictions on the ability to pay dividends or incur additional indebtedness by Imperial PFC Financing II, LLC. The Company believes it was in compliance at December 31, 2012. The outstanding principal at December 31, 2012 and 2011 was approximately zero and $19.1 million, respectively, and accrued interest was approximately zero and $5.4 million, respectively. The Company was required to retain 2% of the principal amount of each loan made to the borrower, for purposes of indemnifying the facility for any breaches of representations, warranties or covenants of the borrower, as well as to fund collection efforts, if required. All remaining amounts under this facility were repaid during the year and December 31, 2012. Our lender protection insurer ceased providing us with lender protection insurance under this credit facility on December 31, 2010.
White Oak, Inc.
On February 5, 2009, Imperial Life Financing II, LLC, was formed to enter into a loan agreement with White Oak Global Advisors, LLC, so that Imperial Life Financing II, LLC could purchase Imperial Premium Finance notes in exchange for cash or a participation interest in the notes.
In September 2009, the Imperial Life Financing II, LLC loan agreement was amended to increase the commitment by $12 million to a total commitment of $27 million. All of the assets of Imperial Life Financing II, LLC served as collateral under this facility. The notes were payable 6-26 months from issuance and the facility matured on March 11, 2012. The outstanding principal at December 31, 2012 and 2011, was zero and $172,000, respectively, and accrued interest was zero and $104,000, respectively. After December 31, 2010, we ceased originating premium finance loans with lender protection insurance. All remaining amounts under this facility were repaid during the year ended December 31, 2012.
NOTE 16—SEGMENT INFORMATION
The Company operates in two segments: life finance and structured settlements. The life finance segment provides financing in the form of loans to trusts and individuals for the payment of premiums of life insurance policies until the end of the third quarter of 2011. Beginning in 2011, in this segment, the Company also acquired life insurance policies through policy purchases in the secondary and tertiary markets. The structured settlements segment purchases structured settlements from individuals.
F-46
Table of Contents
Recipients of structured settlements are permitted to sell their deferred payment streams to a structured settlement purchaser pursuant to state statutes that require certain disclosures, notice to the obligors and state court approval. Through such sales, the Company purchases a certain number of fixed, scheduled future settlement payments on a discounted basis in exchange for a single lump sum payment.
The performance of the segments is evaluated on the segment level by members of the Company’s senior management team. Cash and income taxes generally are managed centrally. Performance of the segments is based on revenue and cost control.
Segment results and reconciliation to consolidated net income were as follows (in thousands):
| Year Ended December 31, | ||||||||||||
| 2012 | 2011 | 2010 | ||||||||||
| Life finance |
||||||||||||
| Income |
||||||||||||
| Agency fee income |
$ | — | $ | 6,470 | $ | 10,146 | ||||||
| Interest income |
1,685 | 7,751 | 18,326 | |||||||||
| Origination income |
500 | 6,480 | 19,938 | |||||||||
| Gain on forgiveness of debt |
— | 5,023 | 7,599 | |||||||||
| Unrealized change in fair value of life settlements |
(5,660 | ) | 570 | 10,156 | ||||||||
| Realized gain on life settlements, net |
151 | 5 | 1,951 | |||||||||
| Change in equity investments |
— | — | (1,284 | ) | ||||||||
| Servicing fee income |
1,183 | 1,814 | 403 | |||||||||
| Gain on maturities of life settlements with subrogation rights, net |
6,090 | 3,188 | — | |||||||||
| Other |
75 | 198 | 131 | |||||||||
|
|
|
|
|
|
|
|||||||
| 4,024 | 31,499 | 67,366 | ||||||||||
|
|
|
|
|
|
|
|||||||
| Direct segment expenses |
||||||||||||
| Interest expense |
1,250 | 8,229 | 24,388 | |||||||||
| Provision for losses on loan receivables |
515 | 7,589 | 4,476 | |||||||||
| Loss on loans payoffs and settlements, net |
125 | 3,837 | 4,981 | |||||||||
| Amortization of deferred costs |
1,868 | 6,076 | 24,465 | |||||||||
| Personnel costs |
5,746 | 6,840 | 3,185 | |||||||||
| Marketing costs |
— | 16 | 3 | |||||||||
| Legal fees |
3,676 | 2,658 | 1,537 | |||||||||
| Professional fees |
1,777 | 1,831 | 1,551 | |||||||||
| Insurance |
1,115 | 237 | 110 | |||||||||
| Other selling, general and administrative expenses |
1,763 | 1,636 | 3,938 | |||||||||
|
|
|
|
|
|
|
|||||||
| 17,835 | 38,949 | 68,634 | ||||||||||
|
|
|
|
|
|
|
|||||||
| Segment operating loss |
$ | (13,811 | ) | $ | (7,450 | ) | $ | (1,268 | ) | |||
|
|
|
|
|
|
|
|||||||
| Structured settlements |
||||||||||||
| Income |
||||||||||||
| Realized gain on sale of structured settlements |
$ | 11,509 | $ | 5,817 | $ | 6,595 | ||||||
| Interest income |
329 | 553 | 334 | |||||||||
| Unrealized change in fair value of structured settlements |
1,822 | 5,302 | 2,477 | |||||||||
| Servicing fee income |
— | — | 11 | |||||||||
| Other income |
334 | 261 | 113 | |||||||||
|
|
|
|
|
|
|
|||||||
| 13,994 | 11,933 | 9,530 | ||||||||||
|
|
|
|
|
|
|
|||||||
F-47
Table of Contents
| Year Ended December 31, | ||||||||||||
| 2012 | 2011 | 2010 | ||||||||||
| Direct segment expenses |
||||||||||||
| Personnel costs |
9,634 | 9,170 | 4,821 | |||||||||
| Marketing costs |
5,023 | 6,088 | 5,034 | |||||||||
| Legal fees |
2,331 | 2,243 | 1,438 | |||||||||
| Professional fees |
1,955 | 1,418 | 834 | |||||||||
| Insurance |
1,108 | 320 | 153 | |||||||||
| Other selling, general and administrative expenses |
1,496 | 2,712 | 786 | |||||||||
|
|
|
|
|
|
|
|||||||
| 21,547 | 21,951 | 13,066 | ||||||||||
|
|
|
|
|
|
|
|||||||
| Segment operating loss |
$ | (7,553 | ) | $ | (10,018 | ) | $ | (3,536 | ) | |||
|
|
|
|
|
|
|
|||||||
| Consolidated |
||||||||||||
| Segment operating loss |
(21,364 | ) | (17,468 | ) | (4,804 | ) | ||||||
| Unallocated income |
||||||||||||
| Interest and dividends on investment securities available for sale |
391 | 640 | — | |||||||||
| Other income |
674 | 142 | — | |||||||||
| Unallocated expenses |
||||||||||||
| Interest expense |
4 | 297 | 3,767 | |||||||||
| Personnel costs |
707 | 2,928 | 4,364 | |||||||||
| Department of Justice |
— | 8,000 | — | |||||||||
| Legal fees |
20,047 | 7,196 | 469 | |||||||||
| Professional fees |
3,202 | 2,730 | 1,581 | |||||||||
| Insurance |
107 | 199 | 95 | |||||||||
| Other selling, general and administrative expenses |
307 | 1,162 | 617 | |||||||||
|
|
|
|
|
|
|
|||||||
| 24,374 | 22,512 | 10,893 | ||||||||||
|
|
|
|
|
|
|
|||||||
| Loss before income taxes |
(44,673 | ) | (39,198 | ) | (15,697 | ) | ||||||
| Benefit for income taxes |
(39 | ) | — | — | ||||||||
|
|
|
|
|
|
|
|||||||
| Net loss |
$ | (44,634 | ) | $ | (39,198 | ) | $ | (15,697 | ) | |||
|
|
|
|
|
|
|
|||||||
Segment assets and reconciliation to consolidated total assets were as follows (in thousands):
| December 31, | December 31, | |||||||
| 2012 | 2011 | |||||||
| Direct segment assets |
||||||||
| Life finance |
$ | 123,581 | $ | 138,520 | ||||
| Structured settlements |
6,862 | 17,155 | ||||||
|
|
|
|
|
|||||
| 130,443 | 155,675 | |||||||
| Other unallocated assets |
29,899 | 66,924 | ||||||
|
|
|
|
|
|||||
| $ | 160,342 | $ | 222,599 | |||||
|
|
|
|
|
|||||
Amounts are attributed to the segment that holds the assets. There are no intercompany sales and all intercompany account balances are eliminated in segment reporting.
NOTE 17—COMMITMENTS AND CONTINGENCIES
In accordance with applicable accounting guidance, the Company establishes an accrued liability for litigation and regulatory matters when those matters present loss contingencies that are both probable and estimable. In such cases, there may be an exposure to loss in excess of any amounts accrued. When a loss contingency is not both probable and estimable, the Company does not establish an accrued liability. As a
F-48
Table of Contents
litigation or regulatory matter develops, the Company, in conjunction with any outside counsel handling the matter, evaluates on an ongoing basis whether such matter presents a loss contingency that is probable and estimable. If, at the time of evaluation, the loss contingency related to a litigation or regulatory matter is not both probable and estimable, the matter will continue to be monitored for further developments that would make such loss contingency both probable and estimable. Once the loss contingency related to a litigation or regulatory matter is deemed to be both probable and estimable, the Company will establish an accrued liability with respect to such loss contingency and record a corresponding amount of litigation-related expense. The Company continues to monitor the matter for further developments that could affect the amount of the accrued liability that has been previously established. Excluding expenses of external legal service providers, litigation-related fees of $14.3 million and $14.0 million was recognized for the years ended December 31, 2012 and December 31, 2011, respectively.
Lease Agreements
The Company leases office space under operating lease agreements. On May 1, 2012, the Company renewed its lease to expire on October 31, 2014. The lease contains a provision for a 5% increase of the base rent annually on the anniversary of the rent commencement date.
Future minimum payments under operating leases for years subsequent to December 31, 2012 are as follows:
| Year Ended December 31, |
||||
| 2013 |
$ | 547,051 | ||
| 2014 |
477,183 | |||
|
|
|
|||
| $ | 1,024,234 | |||
|
|
|
|||
Rent expense under these leases was approximately $528,000, 546,000 and $545,000 for the years ended December 31, 2012, 2011 and 2010, respectively. Rent expense is recorded on a straight-line basis over the term of the lease. The difference between actual rent payments and straight-line rent expense is recorded as deferred rent. Deferred rent in the amount of $102,000 and $110,000 at December 31, 2012 and 2011, respectively, is included in other liabilities in the accompanying consolidated balance sheets.
Employment Agreements
In connection with our initial public offering, we entered into employment agreements with certain of our executive officers. The agreement for our chief executive officer provides for substantial payments in the event that the executive terminates his employment with us due to a material change in the geographic location where such officer performs his duties or upon a material diminution of his base salary or responsibilities, with or without cause. For our chief executive officer, payments are equal to three times the sum of base salary and the average of the three years’ annual cash bonus, unless the triggering event occurs during the first three years of his employment agreement, in which case the payments are equal to six times base salary. For our chief executive officer, the agreement provides for bonus incentives based on pre-tax income thresholds.
On April 26, 2012, the Company entered into a Separation Agreement and General Release of Claims (the “Separation Agreement”) with its chief operating officer, Jonathan Neuman. As part of the Separation Agreement, Mr. Neuman resigned as a member of the Company’s board of directors and as an employee of Company. Pursuant to the Separation Agreement, the Company paid Mr. Neuman a separation payment of $1.4 million. The Separation Agreement does not include a covenant by Mr. Neuman to refrain from competing with Imperial, but does contain customary non-disparagement and non-solicitation provisions. The Separation Agreement provides releases by each party and also obligates the Company to continue to indemnify Mr. Neuman for his legal expenses substantially in the same manner contemplated by his employment agreement with the Company.
F-49
Table of Contents
On February 15, 2012, the Company entered into a retention arrangement with its Chief Financial Officer and Chief Credit Officer, Richard O’Connell, Jr. The arrangement provides that, in the event Mr. O’Connell’s employment is terminated without cause or Mr. O’Connell terminates his employment with the Company for good reason, in each case, prior to December 31, 2013, Mr. O’Connell will be entitled to 24 months’ base salary in addition to any accrued benefits. Additionally, unless Mr. O’Connell’s employment is terminated for cause, Mr. O’Connell will be entitled to a minimum bonus of $250,000 for each of 2012 and 2013, subject to the Company’s Board of Directors’ right to terminate the bonus payment in respect of 2013 prior to January 1, 2013. Except for the provisions relating to severance and other termination benefits, the terms of Mr. O’Connell’s Employment and Severance Agreement entered into with the Company as of November 4, 2010 remain in effect during the term of the retention arrangement and the provisions of the employment agreement relating to severance and other termination benefits will again be in effect following any termination of the retention arrangement if Mr. O’Connell is then employed by the Company.
During the first quarter of 2012, the Company also entered into severance and retention award agreements with certain of its executive officers (other than the CEO and CFO). The agreements generally provide for a minimum guaranteed bonus in each of 2012 and 2013 as well as severance payments equal to two years base salary in the event of termination by the Company without Cause (as defined in the respective agreement) provided the executive executes a general release of claims against the Company.
We do not have any general policies regarding the use of employment agreements, but may, from time to time, enter into such a written agreement to reflect the terms and conditions of employment of a particular named executive officer, whether at the time of hire or thereafter.
Subrogation Rights, net
Every credit facility entered into by subsidiaries of the Company between December 2007 and December 2010 to finance the premium finance lending business required lender protection insurance for each loan originated under such credit facility. Generally, when the Company exercises its right to foreclose on collateral, the Company’s lender protection insurer has the right to direct control or take beneficial ownership of the life insurance policy, subject to the terms and conditions of the lender protection insurance policy, including notice and timing requirements. Otherwise, the lender protection insurer maintains its salvage collection and subrogation rights. The lender protection insurer’s salvage collection and subrogation rights generally provide a remedy by which the insurer can seek to recover the amount of the lender protection claim paid plus premiums paid by it, expenses and interest thereon.
In those instances where the Company has foreclosed on the collateral, the lender protection insurer has maintained its salvage collection and subrogation rights and has been covering the cost of the ongoing premiums needed to maintain certain of these life insurance policies. However, the lender protection insurer may elect at any time to discontinue the payment of premiums which would result in lapse of the policies if the Company does not otherwise pay the premiums. The Company views these policies as having uncertain value because the lender protection insurer controls what happens to the policy from a payment of premium standpoint, and the amount of the lender protection insurer’s salvage collection and subrogation claim rights on any individual life insurance policy could equal the cash flow received by the Company with respect to any such policy. For these reasons, , the Company does not rely on these policies for revenue generation, and these policies are considered contingent assets and are not included in the amount of life settlements on the accompanying consolidated balance sheet.
The Company accounts for the maturities of life settlements with subrogation rights net of subrogation expenses as contingent gains in accordance with ASC 450, Contingencies and recognizes the revenue from the maturities of these policies when all contingencies are resolved.
F-50
Table of Contents
Class Action Litigation, Derivative Demands and the Insurance Coverage Declaratory Relief Complaint
The Class Action Litigation
Initially on September 29, 2011, the Company, and certain of its officers and directors were named as defendants in a putative securities class action filed in the Circuit Court of the 15th Judicial Circuit in and for Palm Beach County, Florida, entitled Martin J. Fuller v. Imperial Holdings, Inc. et al. Also named as defendants were the underwriters of the Company’s initial public offering. That complaint asserted claims under Sections 11, 12 and 15 of the Securities Act of 1933, as amended, alleging that the Company should have but failed to disclose in the registration statement for its initial public offering purported wrongful conduct relating to its life finance business which gave rise to the USAO Investigation. On October 21, 2011, an amended complaint was filed that asserts claims under Sections 11, 12 and 15 of the Securities Act of 1933, based on similar allegations. On October 25, 2011, defendants removed the case to the United States District Court for the Southern District of Florida.
On October 31, 2011, another putative class action case was filed in the Circuit Court of the 15th Judicial Circuit in and for Palm Beach County, Florida, entitled City of Roseville Employees Retirement System v. Imperial Holdings, et al, naming the same defendants and also bringing claims under Sections 11, 12 and 15 of the Securities Act based on similar allegations. On November 28, 2011, defendants removed the case to the United States District Court for the Southern District of Florida. The plaintiffs in the Fuller and City of Roseville cases moved to remand their cases back to state court. Those motions were fully briefed and argued.
On November 18, 2011, a putative class action case was filed in the United States District Court for the Southern District of Florida, entitled Sauer v. Imperial Holdings, Inc., et al, naming the same defendants and bringing claims under Sections 11 and 15 of the Securities Act of 1933 based on similar allegations.
On December 14, 2011, another putative class action case filed in United States District Court for the Southern District of Florida, entitled Pondick v. Imperial Holdings, Inc., et al., naming the same defendants and bringing claims under Sections 11, 12, and 15 of the Securities Act of 1933 based on similar allegations.
On February 24, 2012, the four putative class actions were consolidated and designated: Fuller v. Imperial Holdings et al. in the United States District Court for the Southern District of Florida, and lead plaintiffs were appointed.
In addition, the underwriters of the Company’s initial public offering have asserted that the Company is required by its Underwriting Agreement to indemnify the underwriters’ expenses and potential liabilities in connection with the litigation.
The Insurance Coverage Declaratory Relief Complaint
On June 13, 2012, Catlin Insurance Company (UK) Ltd. (“Catlin”) filed a declaratory relief action against the Company in the United States District Court for the Southern District of Florida. The complaint seeks a determination that there is no coverage under Catlin’s primary Directors, Officers and Company Liability Policy (the “Policy”) issued to the Company for the period February 3, 2012 to February 3, 2012, based on a prior and pending litigation exclusion (the “Exclusion”). Catlin also seeks a determination that it is entitled to reimbursement of the approximately $0.8 million in defense costs and fees advanced to the Company in the first quarter of 2012 under the Policy if it is determined that the Exclusion precludes coverage. As of the filing of this Annual Report on Form 10-K, the Company has not yet been served with the complaint.
Derivative Damands
On November 16, 2011, the Company’s Board of Directors received a shareholder derivative demand from Harry Rothenberg (the “Rothenberg Demand”), which was referred to the special committee for a thorough
F-51
Table of Contents
investigation of the issues, occurrences and facts relating to, connected to, and arising from the USAO Investigation referenced in the Rothenberg Demand. On May 8, 2012, the Company’s Board of Directors received a derivative demand made by another shareholder, Robert Andrzejczyk (the “Andrzejczyk Demand”). The Andrzejczyk Demand, like the Rothenberg Demand was referred to the special committee, which determined that it did not contain any allegations that differed materially from those alleged in the Rothenberg Demand. On July 20, 2012, the Company (as nominal defendant) and certain of the Company’s officers, directors, and a former director were named as defendants in a shareholder derivative action filed in the Circuit Court of the 15th Judicial Circuit in and for Palm Beach County, Florida, entitled Robert Andrzejczyk v. Imperial Holdings, Inc. et al. The complaint alleges, among other things, that the Special Committee’s refusal of the Andrzejczyk Demand was improper.
The Proposed Settlement
On December 18, 2012, attorneys for the Company signed a Term Sheet for Global Settlement Regarding Imperial Holdings, Inc. Matters (the “Term Sheet”) setting forth the terms upon which each of the parties to the matters described in “Class Action Litigation, Derivative Demands and the Insurance Coverage Declaratory Relief Complaint” would be willing to settle the class action litigation and derivative actions as well as the declaratory relief action filed by Catlin, respectively. In addition to the Company’s attorneys, the Term Sheet was signed by attorneys representing the plaintiffs in the class action lawsuits and derivative actions instituted against the Company, as well attorneys for the Company’s director and officer liability insurance carriers (“D&O Carriers”), certain individual defendants named in the class actions and the underwriters in the Company’s initial public offering.
While non-binding and subject to certain contingencies, the Term Sheet provides that each of the parties will endeavor to enter into definitive settlement agreements in respect of the class action litigation, derivative action and insurance coverage declaratory relief complaint. Although definitive settlement agreements have not been executed as of the filing of this Annual Report on Form 10-K, the Company does expect to continue to work in good faith with the other parties to the Term Sheet to execute settlement agreements as soon as is practicable.
The terms of the class action settlement include a cash payment of $12.0 million, of which $11.0 million is to be contributed by the Company’s primary and excess D&O Carriers and the issuance of two million warrants for shares of the Company’s stock with an estimated value of $3.1 million at the date of the signing of the Term Sheet. The value of the warrants will be re-asses at issuance. The warrants will have a five-year term with an exercise price of $10.75 and will be issued when the settlement proceeds are distributed to the claimants. In addition, the underwriters in Company’s initial public offering are to waive their rights to indemnity and contribution by the Company. The Company established a reserve related to the proposed settlement of $15.1 million, which is included in other liabilities and a receivable for insurance recoverable from the Company’s D&O Carrier of $11.0 million, which is included in prepaid and other assets. The $4.1 million net effect of the proposed settlement is included in legal fees in the statement of operations for the year ended December 31, 2012.
The derivative actions would be settled for implementation of certain compliance reforms. The Term Sheet also contemplates payment by the Company’s primary D&O carrier of $1.5 million for legal fees in respect of the derivative actions and the contribution of $500,000 in the Company’s stock.
In addition, the Term Sheet contemplates that the Company will contribute $500,000 to a trust to cover certain claims under its director and officer liability insurance policies.
The Company established a reserve to the proposed derivative settlement and insurance trust of $2.5 million, which is included in other liabilities and a receivable for insurance recoverable from the Company’s D&O Carrier of $1.5 million, which is included in prepaid and other assets. The net effect of the settlement of $1.0 million is included in legal fees in the settlement of operations for the year ended December 31, 2012.
F-52
Table of Contents
The proposed settlement also requires the Company to advance legal fees to and indemnify certain individuals covered under the policies. The obligation to advance and indemnify on behalf of these individuals, while currently unquantifiable, may be substantial and could have a material adverse effect on the Company’s financial position and results of operations.
SEC Investigation
On February 17, 2012, the Company received a subpoena issued by the staff of the SEC seeking documents from 2007 through the present, generally related to the Company’s premium finance business and corresponding financial reporting. The SEC is investigating whether any violations of federal securities laws have occurred and the Company has been cooperating with the SEC regarding this matter. The Company is unable to predict what action, if any, might be taken in the future by the SEC or its staff as a result of the matters that are the subject of the subpoena or what impact, if any, the cost of responding to the subpoena might have on the Company’s financial position, results of operations, or cash flows. The Company has not established any provision for losses in respect of this matter.
Litigation
We are party to various other legal proceedings that arise in the ordinary course of business. We believe that the resolution of these other proceedings will not, based on information currently available to us, have a material adverse effect on our financial position or results of operations. See Note 22 – Subsequent Events.
NOTE 18—STOCKHOLDERS’ EQUITY
In January 2011, Imex Settlement Corporation executed an agreement to purchase from the Company 110,000 Series F Preferred Units for an $11.0 million promissory note. The Series F Preferred Units were non-voting and would be redeemed at any time by the Company for an amount equal to the applicable unreturned preferred capital amount allocable to the Series F Preferred Units sought to be redeemed, plus any accrued and unpaid preferred return. The cumulative rate of preferred return was equal to 16.0% of the outstanding units, per annum. The Series F Preferred units and the $11.0 million promissory note were extinguished as a result of the corporate conversion.
On February 3, 2011, the Company converted from a Florida limited liability company to a Florida corporation at which time the members of Imperial Holdings, LLC became shareholders of Imperial Holdings, Inc. As a limited liability company, the Company was treated as a partnership for United States federal and state income tax purposes and, as such, the Company was not subject to taxation. For all periods subsequent to such conversion, the Company will be subject to corporate-level United States federal and state income taxes.
As part of the corporate conversion, the Company entered into a plan of conversion with its shareholders on January 12, 2011, as amended on February 3, 2011. Pursuant to the plan of conversion, all of the Company’s outstanding common units and Series A, B, C, D and E preferred units and all principal and accrued and unpaid interest outstanding under our promissory note in favor of IMPEX Enterprises, Ltd. were converted into 2,300,273 shares of our common stock. The plan of conversion, which describes the corporate conversion as well as other transactions and agreements by the parties with an interest in the Company’s equity, reflects an agreement among its then shareholders as to the allocation of the shares of common stock to be issued to its shareholders in the corporate conversion. Thus, there is no formula that may be used to describe the conversion of a common unit or a Series A, B, C, D and E preferred unit into common stock.
Immediately after the corporate conversion and prior to the conversion of the Skarbonka debenture and the closing of the Company’s initial public offering on February 11, 2011, the Company’s shareholders consisted of two Florida corporations and one Florida limited liability company. These three shareholders reorganized so that their beneficial owners received the same number of shares of common stock of Imperial Holdings, Inc. issuable to the members of Imperial Holdings, LLC in the corporate conversion.
F-53
Table of Contents
After the corporate conversion and prior to the closing of the Company’s initial public offering on February 11, 2011, the Company converted two phantom stock agreements it had with two employees into 27,000 shares of common stock and incurred stock compensation of approximately $290,000.
In addition, following the corporate conversion and upon the closing of the Company’s initial public offering on February 11, 2011, three shareholders received ownership of warrants that may be exercised for up to a total of 4,053,333 shares of the Company’s common stock at a weighted average exercise price of $14.51 per share. In connection with the over-allotment option, the same three shareholders received ownership of 187,188 additional warrants. One-third of the warrants will have an exercise price equal to 120% of the price of the common stock sold in this offering, one-third of the warrants will have an exercise price equal to 135% of the price of the common stock sold in this offering, and one-third of the warrants will have an exercise price equal to 150% of the price of the common stock sold in this offering. The warrants will expire 7 years after the date of issuance and the exercisability of the warrant will vest ratably over four years.
On February 11, 2011, the Company closed its initial public offering of 16,666,667 shares of common stock at $10.75 per share. On February 15, 2011 Imperial Holdings, Inc. sold an additional 935,947 shares of common stock. The sale was in connection with the over-allotment option Imperial Holdings, Inc. granted to its underwriters in connection with Imperial’s initial public offering. As a result, the total initial public offering size was 17,602,614 shares. All shares were sold to the public at a price of $10.75. The Company received net proceeds of approximately $174.2 million after deducting the underwriting discounts and commissions and our offering expenses.
After giving effect to (i) the corporate conversion, pursuant to which all outstanding common and preferred limited liability company units of Imperial Holdings, LLC (including all accrued and unpaid dividends thereon) and all principal and accrued and unpaid interest outstanding under the Company’s promissory note in favor of IMPEX Enterprises, Ltd. were converted into 2,300,273 shares of the Company’s common stock; (ii) the issuance of 27,000 shares of common stock to two employees pursuant to the terms of each of their respective phantom stock agreements; (iii) the conversion of a $30.0 million debenture into 1,272,727 shares of common stock (iv) the sale of 16,666,667 shares in the Company’s offering, and (v) the sale of 935,947 shares in connection with the over-allotment option granted to the Company’s underwriters, there are 21,202,614 shares of common stock outstanding. Up to an additional 4,240,521 shares of common stock will be issuable upon the exercise of warrants issued to existing members of the Company. Moreover, the Company reserved an aggregate of 1,200,000 shares of common stock under its Omnibus Plan, of which 665,956 options to purchase shares of common stock were granted to existing employees, directors and named executive officers at a weighted average exercise price of $10.75 per share, and an additional 3,507 shares of restricted stock had been granted under the plan subject to vesting. The remaining 530,537 shares of common stock are available for future awards.
NOTE 19—EMPLOYEE BENEFIT PLAN
The Company has adopted a 401(k) plan that covers employees that have reached 18 years of age and completed three months of service. The plan provides for voluntary employee contributions through salary reductions, as well as discretionary employer contributions. For the years ended December 31, 2012 and 2011, there were no employer contributions made.
F-54
Table of Contents
NOTE 20—SUMMARY OF QUARTERLY FINANCIAL DATA (UNAUDITED)
The following tables set forth our unaudited consolidated financial data regarding operations for each quarter of fiscal 2012 and 2011 (in thousands). This information, in the opinion of management, includes all adjustments necessary, consisting only of normal and recurring adjustments, to state fairly the information set forth therein. Certain amounts previously reported have been reclassified to conform to the current presentation. These reclassifications had no net impact on the results of operations (in thousands).
| Fiscal 2012 | ||||||||||||||||
| 1st Quarter | 2nd Quarter | 3rd Quarter | 4th Quarter | |||||||||||||
| Revenues |
9,966 | 16,183 | (14,171 | ) | 7,106 | |||||||||||
| Income/(Loss) from Operations |
(8,912 | ) | (625 | ) | (31,480 | ) | (3,656 | ) | ||||||||
| Net Income/(Loss) |
(8,871 | ) | (625 | ) | (31,475 | ) | (3,663 | ) | ||||||||
| Fiscal 2011 | ||||||||||||||||
| 1st Quarter | 2nd Quarter | 3rd Quarter | 4th Quarter | |||||||||||||
| Revenues |
24,862 | 29,211 | (1,763 | ) | (8,096 | ) | ||||||||||
| Income/(Loss) from Operations |
7,425 | 13,788 | (20,377 | ) | (40,034 | ) | ||||||||||
| Net Income/(Loss) |
(571 | ) | 12,605 | (12,550 | ) | (38,682 | ) | |||||||||
NOTE 21—INCOME TAXES
The provision (benefit) for income taxes consisted of (in thousands):
| 12/31/2012 | 12/31/2011 | |||||||
| Current |
||||||||
| Federal |
$ | — | $ | — | ||||
| State |
— | — | ||||||
|
|
|
|
|
|||||
| — | — | |||||||
| Deferred |
||||||||
| Federal |
$ | (14,377 | ) | $ | (9,474 | ) | ||
| State |
(2,391 | ) | (1,575 | ) | ||||
|
|
|
|
|
|||||
| (16,768 | ) | (11,049 | ) | |||||
| Valuation allowance increase |
$ | 16,729 | 11,049 | |||||
|
|
|
|
|
|||||
| Benefit for income taxes |
$ | (39 | ) | $ | — | |||
|
|
|
|
|
|||||
The Company’s actual provision (benefit) for income taxes from continuing operations differ from the Federal expected income tax provision as follows (in thousands):
| 2012 | 2011 | |||||||||||||||
| Amount | Rate | Amount | Rate | |||||||||||||
| Tax Benefit at statutory rate |
$ | (15,636 | ) | 35.00 | % | $ | (13,719 | ) | 35.00 | % | ||||||
| Increase (decrease) in taxes resulting from: |
||||||||||||||||
| State tax (net of federal benefit) |
(1,555 | ) | 3.48 | (1,045 | ) | 2.67 | ||||||||||
| Pre-conversion loss |
— | — | 678 | (1.73 | ) | |||||||||||
| Pre-conversion deferred tax asset |
— | — | 223 | (0.57 | ) | |||||||||||
| Other |
423 | (0.94 | ) | 14 | (0.04 | ) | ||||||||||
| Department of Justice settlement |
— | — | 2,800 | (7.14 | ) | |||||||||||
| Valuation allowance increase |
16,729 | (37.45 | ) | 11,049 | (28.19 | ) | ||||||||||
|
|
|
|
|
|
|
|
|
|||||||||
| Benefit for income taxes |
$ | (39 | ) | 0.09 | % | $ | — | 0.00 | % | |||||||
|
|
|
|
|
|
|
|
|
|||||||||
F-55
Table of Contents
On February 3, 2011, the Company converted from a Florida limited liability company to a Florida corporation (the “conversion”). Prior to the conversion the company was treated as a partnership for federal and state income tax purposes. As a partnership our taxable income and losses were attributed to our members, and accordingly, no provision or liability for income taxes was reflected in the accompanying consolidated financial statements for periods prior to the conversion.
As a result of the conversion of the Company from a partnership to a corporation, the company recorded a one-time deferred tax liability of approximately $4.5 million for the federal and state tax effects of cumulative differences between financial and tax reporting which existed at the time of the conversion. Pursuant to ASC 740 these deferred taxes were recorded in income tax expense for the year ending December 31, 2011.
Following the conversion and prior to the initial public offering, one of the founding members entered into a reorganization that allowed the Company to assume the corporate shareholder’s tax attributes. These tax attributes include approximately $11.2 million of net operating loss carryovers (“NOLs”). Accordingly, the Company recorded a one-time deferred tax asset of approximately $4.3 million related to these tax attributes and this amount was recorded as an income tax benefit. The utilization of the acquired NOLs is subject to an annual limitation based on the value of the Company at the time they were acquired. These NOLs expire starting in 2028.
The tax effects of temporary differences that give rise to significant portions of the deferred tax assets and tax liabilities were (in thousands):
| December 31, | December 31, | |||||||
| 2012 | 2011 | |||||||
| Deferred tax assets: |
||||||||
| Federal and State net operating loss carryforward |
$ | 25,454 | $ | 13,488 | ||||
| Allowance for doubtful accounts |
1,969 | 3,362 | ||||||
| Unrealized loss on available for sale investment securities |
— | 25 | ||||||
| Unrealized loss on life and structured settlements, net |
1,813 | — | ||||||
| Litigation reserves |
2,324 | 68 | ||||||
| Other |
693 | 704 | ||||||
|
|
|
|
|
|||||
| Total gross deferred tax assets |
32,253 | 17,647 | ||||||
| Less valuation allowance |
(27,803 | ) | (11,074 | ) | ||||
|
|
|
|
|
|||||
| Total deferred tax assets |
4,450 | 6,573 | ||||||
| Deferred tax liabilities: |
||||||||
| Unrealized gains on life and structured settlements |
— | 5,075 | ||||||
| Gain on structured settlements deferred for tax purposes |
4,436 | 1,498 | ||||||
| Unrealized gain on available for sale investment securities |
14 | |||||||
| Other |
— | — | ||||||
|
|
|
|
|
|||||
| Total gross deferred tax liabilities |
4,450 | 6,573 | ||||||
|
|
|
|
|
|||||
| Total net deferred tax asset (liability) |
$ | — | $ | — | ||||
|
|
|
|
|
|||||
The Company evaluates its deferred tax assets to determine if valuation allowances are required. In its evaluation, management considers taxable loss carryback availability, expectations of sufficient future taxable
F-56
Table of Contents
income, trends in earnings, existence of taxable income in recent years, the future reversal of temporary differences, and available tax planning strategies that could be implemented, if required. Valuation allowances are established based on the consideration of all available evidence using a more likely than not standard. Based on the Company’s evaluation, a full deferred tax valuation allowance was established against its net deferred tax assets as of December 31, 2012 and 2011. This valuation allowance was recognized as a charge to income tax expense. If the valuation allowance is reduced or eliminated, future tax benefits will be recognized as a reduction to income tax expense that will have a positive non-cash impact on net income and stockholders’ equity. The Company’s deferred tax asset valuation allowance would be reversed if and when it becomes more likely than not that the Company will generate sufficient taxable income in the future to utilize the tax benefits of the related deferred tax assets.
Generally, the amount of tax expense or benefit allocated to continuing operations is determined without regard to the tax effects of other categories of income or loss, such as other comprehensive income. However, an exception to the general rule is provided when, in the presence of a valuation allowance against deferred tax assets, there is a pretax loss from continuing operations and pretax income from other categories. In such instances, income from other categories must offset the current loss from operations, the tax benefit of such offset being reflected in continuing operations. For the period ended December 31, 2012 we reduced our deferred tax valuation allowance from continuing operations by $39,000 to reflect the future taxable income associated with unrealized gains in accumulated other comprehensive income.
The Federal and state NOL generated by the Company since its conversion to a corporation was approximately $54.8 million which expire beginning in 2031.
The Company’s income tax returns for all years are subject to examination. Various state jurisdiction tax years remain open to examination.
In February of 2013, the Company was notified by the Internal Revenue Service of its intention to examine the Company’s partnership return for the year ended December 31, 2010. Audit field work for this examination has not been scheduled.
The Company recognizes interest and penalties accrued related to unrecognized tax benefits in tax expense.
A reconciliation of the total amounts of unrecognized benefits at the beginning and end of the period was as follows (in thousands):
| December 31, | December 31, | |||||||
| 2012 | 2011 | |||||||
| Balance as of beginning of period |
$ | 6,295 | $ | — | ||||
| Additions based on tax positions taken in the current year |
— | 6,295 | ||||||
| Reductions of tax positions for prior years |
— | — | ||||||
|
|
|
|
|
|||||
| Balance as of end of period |
$ | 6,295 | $ | 6,295 | ||||
|
|
|
|
|
|||||
The recognition of the unrecognized tax benefits would result in a 0% decrease in the Company’s effective tax rate.
NOTE 22—SUBSEQUENT EVENTS
Bridge Facility
On December 21, 2012, Greenwood opened a securities intermediary account, which provides for a securities intermediary to hold Greenwood’s life insurance policies on its behalf. On March 27, 2013,
F-57
Table of Contents
Greenwood, as issuer, and the Company and OLIPP IV, LLC, as guarantors, entered into an indenture with Wilmington Trust Company, as indenture trustee, under which an aggregate principal amount of $45 million in senior secured bridge notes were issued (the “Bridge Facility”).
Interest under the Bridge Facility accrues at 12% per annum for the first nine months from the issue date, and increases by 600 basis points thereafter to 18% per annum. Up to 25% of the net proceeds from the Bridge Facility after transaction expenses may be used by the Company for general corporate purposes, including for premium payments on life insurance policies not owned by Greenwood, with the balance used to pay fees and expenses associated with the Bridge Facility and for premiums on life insurance policies owned by Greenwood. The Bridge Facility is guaranteed by the Company and secured by the cash on account at Greenwood and its portfolio of life insurance policies. The Bridge Facility is also secured by pledges of the equity interests of Greenwood’s direct parent and each subsidiary of the Company, other than its licensed life settlement provider, that holds life insurance policies that are not subject to the subrogation rights of the Company’s lender protection insurance carrier.
Notes under the Bridge Facility were issued at 92% of their face amount and are pre-payable at par at any time. The Bridge Facility is subject to mandatory prepayment provisions upon the issuance of additional debt, equity raises and asset sales. Mandatory prepayments are generally at par although certain asset sales or a change of control each trigger a mandatory prepayment obligation at 109%. The Bridge Facility requires the maintenance of a 2 times asset coverage ratio and six months of cash on hand to pay interest on the Bridge Facility and premiums on life insurance policies owned by Greenwood. Upon a failure to maintain requisite cash on hand, the Company may be obligated to sell policies to repay the lenders under the Bridge Facility. There can be no assurance, however, that we will be able to obtain capital on more favorable terms or at all.
As of December 31, 2012, OLIPP IV (“OLIPP”) contributed 191 life settlements with an estimated fair value of approximately $104.6 million to Greenwood. In accordance with ASC 810, Consolidation, the Company determined that OLIPP was the primary beneficiary of Greenwood having a controlling financial interest in the variable interest enity and therefore, the Company will consolidate Greenwood in its financial statements beginning in the first quarter of 2013.
21st Services, LLC (“21st Services”) and AVS Underwriting LLC (“AVS”)
On January 22, 2013, 21st Services announced significant revisions to its underwriting methodology. On February 4, 2013, 21st Services then announced that it was correcting errors discovered in its revised methodology. According to the provider, these revisions have generally been understood to lengthen the average reported life expectancy furnished by 21st Services by 19% and, accordingly, will likely negatively impact the valuation of the Company’s portfolio of life insurance policies. However, the Company has not received life expectancy reports from 21st Services that utilize its revised methodology and the fair value of the Company’s portfolio of life insurance policies at December 31, 2012 does not take into account changes to life expectancy estimates that may result from 21st Services updated methodology. While the Company is still evaluating the general impact that these revisions might have on the value of its portfolio, the Company may determine to cease utilizing, or adjust the weighting of, 21st Services reports as an input into its fair value model in future periods as market practice responds to the adjusted methodology. Additionally, the Company’s other life expectancy provider, AVS Underwriting LLC (“AVS”), filed for federal bankruptcy protection under Chapter 11 on February 12, 2013. The Company cannot, at this time, predict what impact the bankruptcy filing will have on the Company’s ability to procure life expectancy reports from AVS in the future, AVS’s ability to continue its operations or whether other market participants will continue to use AVS life expectancy reports for valuation purposes going forward. As a result of these developments, the Company may need to adjust the application of life expectancy reports in its fair value methodology or source reports from different life expectancy providers in future periods, which could have a material impact on the Company’s fair value calculations.
F-58
Table of Contents
In reviewing the agreements included as exhibits to this report, please remember they are included to provide you with information regarding their terms and are not intended to provide any other factual or disclosure information about the Company, its subsidiaries or other parties to the agreements. The Agreements contain representations and warranties by each of the parties to the applicable agreement. These representations and warranties have been made solely for the benefit of the other parties to the applicable agreement and:
| • | should not in all instances be treated as categorical statements of fact, but rather as a way of allocating the risk to one of the parties if those statements prove to be inaccurate; |
| • | have been qualified by disclosures that were made to the other party in connection with the negotiation of the applicable agreement, which disclosures are not necessarily reflected in the agreement; |
| • | may apply standards of materiality in a way that is different from what may be viewed as material to you or other investors; and |
| • | were made only as of the date of the applicable agreement or such other date or dates as may be specified in the agreement and are subject to more recent developments. |
Accordingly, these representations and warranties may not describe the actual state of affairs as of the date they were made or at any other time. We acknowledge that, notwithstanding the inclusion of the foregoing cautionary statements, we are responsible for considering whether additional specific disclosures of material information regarding material contractual provisions are required to make the statements in this report not misleading. Additional information about the Company may be found elsewhere in this report and the Company’s other public files, which are available without charge through the SEC’s website at http://www.sec.gov.
| Exhibit |
Exhibit Description |
Form |
Exhibit |
Filing |
Filed | |||||
| 3.1 | Articles of Incorporation of Registrant. | S-1/A | 3.1 | 10/1/10 | ||||||
| 3.2 | Bylaws of Registrant. | 8-K/A | 3.2 | 8/16/12 | ||||||
| 4.1 | Form of Common Stock Certificate. | S-1/A | 4.1 | 11/10/10 | ||||||
| 4.2 | Indenture, dated as of March 27, 2013, by and among Greenwood Asset Portfolio, LLC, the guarantors named therein and Wilmington Trust Company as indenture trustee. | 10-K | 4.2 | 3/28/13 | ||||||
| 10.1† | Employment Agreement between the Registrant and Antony Mitchell dated November 8, 2010. | S-1/A | 10.1 | 11/10/10 | ||||||
| 10.2† | Employment Agreement between the Registrant and Richard O’Connell dated November 4, 2010. | S-1/A | 10.3 | 11/10/10 | ||||||
| 10.3† | Severance Agreement, dated February 15, 2012, between Imperial Holdings, Inc. and Richard O’Connell, Jr. | 8-K | 10.1 | 2/15/12 | ||||||
| 10.4† | Letter Agreement, dated February 15, 2012, between Imperial Holdings, Inc. and Richard O’Connell, Jr. | 8-K | 10.2 | 2/15/12 | ||||||
| 10.5† | Severance Agreement, dated January 31, 2012, between Imperial Holdings, Inc. and Michael Altschuler. | 10-K | 10.7 | 10/5/12 | ||||||
| 10.6† | First Amendment to Severance Agreement, effective February 13, 2012, between Imperial Holdings, Inc. and Michael Altschuler. | 10-K | 10.8 | 10/5/12 | ||||||
E-1
Table of Contents
| Exhibit |
Exhibit Description |
Form |
Exhibit |
Filing |
Filed | |||||
| 10.7† | Letter Agreement, dated January 31, 2012, between Imperial Holdings, Inc. and Michael Altschuler. | 10-K | 10.9 | 10/5/12 | ||||||
| 10.8† | Severance Agreement, dated February 9, 2012, between Imperial Holdings, Inc. and Miriam Martinez. | 10-K | 10.10 | 10/5/12 | ||||||
| 10.9† | First Amendment to Severance Agreement, effective February 13, 2012, between Imperial Holdings, Inc. and Miriam Martinez. | 10-K | 10.11 | 10/5/12 | ||||||
| 10.10† | Letter Agreement, dated February 9, 2012, between Imperial Holdings, Inc. and Miriam Martinez. | 10-K | 10.12 | 10/5/12 | ||||||
| 10.11 | Separation Agreement and General Release of Claims between Imperial Holdings, Inc. and Jonathan Neuman, dated April 26, 2012. | 8-K | 10.2 | 4/30/12 | ||||||
| 10.12† | Imperial Holdings 2010 Omnibus Incentive Plan. | S-1/A | 10.6 | 10/1/10 | ||||||
| 10.13† | 2010 Omnibus Incentive Plan Form of Stock Option Award Agreement. | S-1/A | 10.7 | 10/1/10 | ||||||
| 10.14 | Omnibus Claims Settlement Agreement dated as of September 8, 2010 by and between Imperial PFC Financing, LLC and Lexington Insurance Company. | S-1/A | 10.8 | 11/19/10 | ||||||
| 10.15 | Pledge and Security Agreement dated September 8, 2010 by Imperial Premium Finance, LLC. | S-1/A | 10.9 | 11/19/10 | ||||||
| 10.16 | Master Trust Indenture dated as of September 24, 2010 by and among Imperial Settlements Financing 2010, LLC as the Issuer, Portfolio Financial Servicing Company as the Initial Master Servicer, and Wilmington Trust Company as the Trustee and Collateral Trustee. | S-1/A | 10.15 | 11/10/10 | ||||||
| 10.17 | Series 2010-1 Supplement dated as of September 24, 2010 to the Master Trust Indenture dated as of September 24, 2010 by and among Imperial Settlements Financing 2010, LLC as the Issuer, Portfolio Financial Servicing Company as the Initial Servicer, and Wilmington Trust Company as the Trustee and Collateral Trustee. | S-1/A | 10.16 | 11/10/10 | ||||||
| ††10.18 | Purchase and Sale Agreement, dated as of December 30, 2011, by and among Compass Settlements LLC and Washington Square Financial, LLC. | 10-K | 10.36 | 10/5/12 | ||||||
| 10.19 | Non-Prosecution Agreement between Imperial Holdings, Inc. and the United States Attorney’s Office for the District of New Hampshire, dated April 30, 2012. | 8-K | 10.1 | 4/30/12 | ||||||
| 10.20 | Form of Note Purchase Agreement, to be dated as of March 27, 2013, by and among Greenwood Asset Portfolio, LLC, the guarantors named therein and the purchasers thereto. | 10-K | 10.20 | 3/28/13 | ||||||
| 21.1 | Subsidiaries of the Registrant. | 10-K |
21.1 |
3/28/13 |
||||||
E-2
Table of Contents
| Exhibit |
Exhibit Description |
Form |
Exhibit |
Filing |
Filed | |||||
| 23.1 | Consent of Grant Thornton LLP. | * | ||||||||
| 31.1 | Chief Executive Officer Certification pursuant to Section 302 of the Sarbanes-Oxley Act of 2002. | * | ||||||||
| 31.2 | Chief Financial Officer Certification pursuant to Section 302 of the Sarbanes-Oxley Act of 2002. | * | ||||||||
| 32.1 | Chief Executive Officer Certification pursuant to 18 U.S.C. Section 1350, as adopted pursuant to Section 906 of the Sarbanes-Oxley Act of 2002. | * | ||||||||
| 32.2 | Chief Financial Officer Certification pursuant to 18 U.S.C. Section 1350, as adopted pursuant to Section 906 of the Sarbanes-Oxley Act of 2002. | * | ||||||||
| 101 | Interactive Data Files | 10-K | 101 | 3/28/13 | ||||||
| 101.INS | XBRL Instance Document | 10-K | 101.INS | 3/28/13 | ||||||
| 101.SCH | XBRL Taxonomy Extension Schema Document | 10-K | 101.SCH | 3/28/13 | ||||||
| 101.CAL | XBRL Taxonomy Extension Calculation Linkbase Document | 10-K | 101.CAL | 3/28/13 | ||||||
| 101.DEF | XBRL Taxonomy Definition Linkbase Document | 10-K | 101.DEF | 3/28/13 | ||||||
| 101.LAB | XBRL Taxonomy Extension Label Linkbase Document 10.1 & 10.2 | 10-K | 101.LAB | 3/28/13 | ||||||
| 101.PRE | XBRL Taxonomy Extension Presentation Linkbase Document | 10-K | 101.PRE | 3/28/13 | ||||||
| †† | Certain portions of the exhibit have been omitted pursuant to a confidential treatment order. An unredacted copy of the exhibit has been filed separately with the United States Securities and Exchange Commission pursuant to a request for confidential treatment. |
| * | Filed herewith. |
| ** | Pursuant to Rule 406T of Regulation S-T, these interactive data files are deemed not filed or part of a registration statement or prospectus for purposes of Sections 11 or 12 of the Securities Act of 1933 not filed for such purposes of Section 18 of the Securities Exchange Act of 1934 and otherwise are not subject to liability under such sections. |
| † | Management compensatory arrangement |
E-3