Attached files
| file | filename |
|---|---|
| 8-K - FORM 8-K - FINANCIAL INSTITUTIONS INC | d628501d8k.htm |
Exhibit 99.1
| Delivering On Our Promise NASDAQ: FISI Sandler O'Neill East Coast Financial Services Conference November 2013 |
| Forward Looking Statements 2 Statements contained in this presentation which are not historical facts and which pertain to future operating results of Financial Institutions, Inc. and its subsidiaries constitute "forward looking statements" within the meaning of the Private Securities Litigation Reform Act of 1995. These forward looking statements involve significant risks and uncertainties. We refer you to the documents the Company files from time to time with the Securities and Exchange Commission, specifically the Company's last filed Form 10-K and Form 10-Q. These documents contain and identify important factors that could cause actual results to differ materially from those contained in our projections or forward looking statements. The Company assumes no obligation to update any information presented herein. |

| Key Investment Considerations 3 Experienced leadership Positioned to Achieve Long^Term Growth... Attractive footprint in Upstate NY, uniquely positioned to seize market opportunities ...and Delivering on our Promise to All Stakeholders Low cost and streamlined operating emphasis Sustainable, scalable business model Effective enterprise risk management Solid capital structure Investments in people and infrastructure Consistent, strong operating results and favorable trends |
| Martin K. Birmingham President & CEO Kevin B. Klotzbach EVP, CFO & Treasurer |
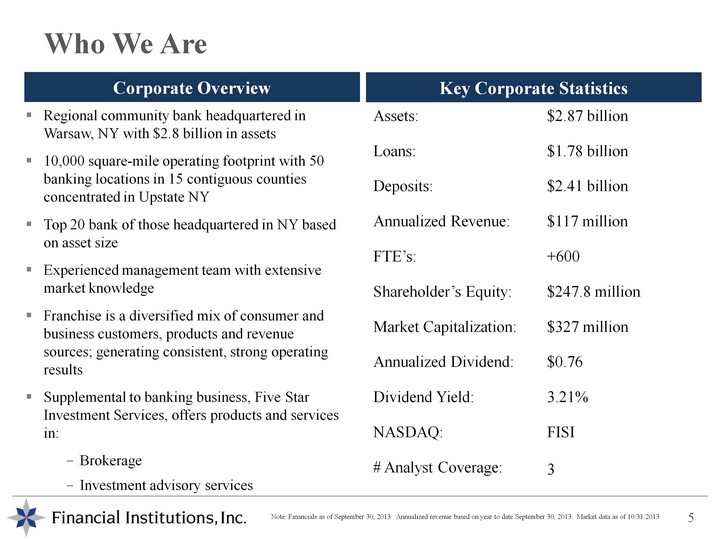
| Who We Are 5 Regional community bank headquartered in Warsaw, NY with $2.8 billion in assets 10,000 square-mile operating footprint with 50 banking locations in 15 contiguous counties concentrated in Upstate NY Top 20 bank of those headquartered in NY based on asset size Experienced management team with extensive market knowledge Franchise is a diversified mix of consumer and business customers, products and revenue sources; generating consistent, strong operating results Supplemental to banking business, Five Star Investment Services, offers products and services in: Brokerage Investment advisory services Assets: Loans: Deposits: Annualized Revenue: FTE's: Shareholder's Equity: Market Capitalization: Annualized Dividend: Dividend Yield: NASDAQ: # Analyst Coverage: $2.87 billion $1.78 billion $2.41 billion $117 million +600 $247.8 million $327 million $0.76 3.21% FISI 3 Corporate Overview Key Corporate Statistics Note: Financials as of September 30, 2013. Annualized revenue based on year to date September 30, 2013. Market data as of 10/31/2013 |
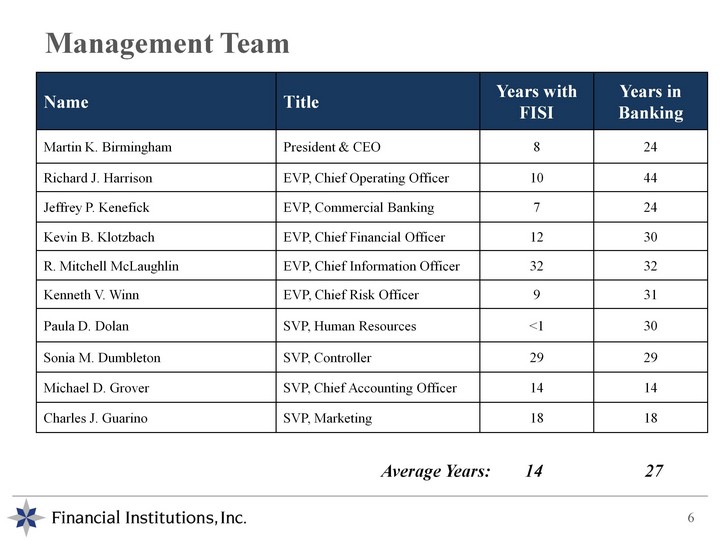
| Management Team 6 Average Years: 14 27 Name Title Years with FISI Years in Banking Martin K. Birmingham President & CEO 8 24 Richard J. Harrison EVP, Chief Operating Officer 10 44 Jeffrey P. Kenefick EVP, Commercial Banking 7 24 Kevin B. Klotzbach EVP, Chief Financial Officer 12 30 R. Mitchell McLaughlin EVP, Chief Information Officer 32 32 Kenneth V. Winn EVP, Chief Risk Officer 9 31 Paula D. Dolan SVP, Human Resources <1 30 Sonia M. Dumbleton SVP, Controller 29 29 Michael D. Grover SVP, Chief Accounting Officer 14 14 Charles J. Guarino SVP, Marketing 18 18 |

| Sound Risk Management Our Strategy and Approach 7 Balance between volume and risk; maintain our credit discipline Diversified loan portfolio through retail and commercial exposures Effective risk management committee structures Uphold rigorous expense management practices Productivity measures per FTE Attract, retain and cultivate top talent Promote from within, create career opportunities Focus on the Five Star Bank Experience; dictates how we: Hire Evaluate Reward Comprehensive incentive compensation structure supports cross^functional focus Satisfied employees = satisfied customers Continue to capitalize on banking dislocation in our region; uniquely positioned to seize market opportunities and achieve scale in growth markets Invest in people, product development and infrastructure, especially potential growth segments Key lending hires in Buffalo and Rochester, new e-banking services (mobile banking, web apps) and product offerings Continue non-interest income growth Five Star Investment Services Principled, growth oriented approach guided by our commitment to enhance: Shareholder value Customer experience Employee experience Smart Growth Maintain our Culture Focus on Value |

| Our Strategic Initiatives have Driven Growth and Performance 8 Initiatives Outcomes Optimization and consolidation of branches offices Investment in asset classes which offer excellent risk adjusted returns and duration Continuous reinvestment in people, processes and infrastructure Positioning ourselves for market expansion through key group hires and branch purchases Keen focus on expense control, efficiency improvements and risk management Consistent, strong operating results Meaningful organic loan growth Increased positive operating leverage Pristine asset quality Attractive market position Strong 5^year total shareholder return |
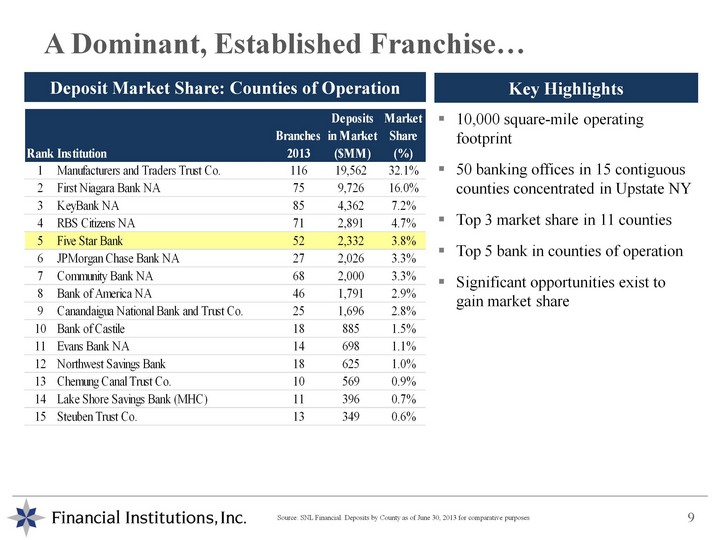
| A Dominant, Established Franchise... 9 Deposit Market Share: Counties of Operation 10,000 square-mile operating footprint 50 banking offices in 15 contiguous counties concentrated in Upstate NY Top 3 market share in 11 counties Top 5 bank in counties of operation Significant opportunities exist to gain market share Key Highlights Source: SNL Financial. Deposits by County as of June 30, 2013 for comparative purposes |
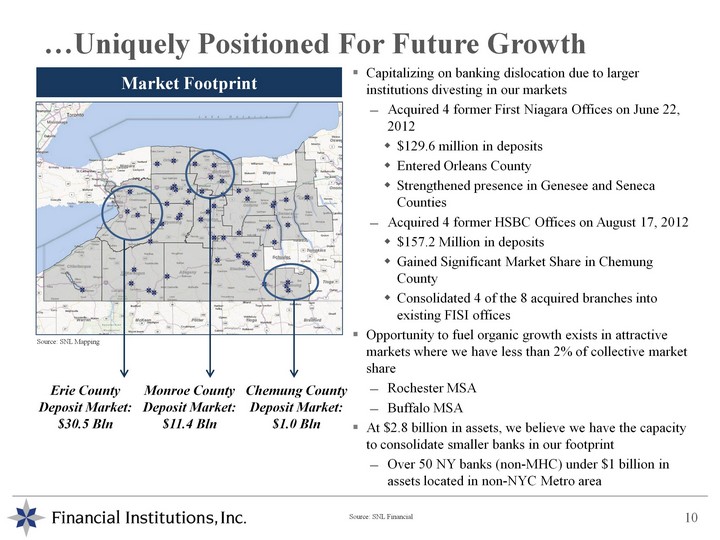
| ...Uniquely Positioned For Future Growth 10 Capitalizing on banking dislocation due to larger institutions divesting in our markets Acquired 4 former First Niagara Offices on June 22, 2012 $129.6 million in deposits Entered Orleans County Strengthened presence in Genesee and Seneca Counties Acquired 4 former HSBC Offices on August 17, 2012 $157.2 Million in deposits Gained Significant Market Share in Chemung County Consolidated 4 of the 8 acquired branches into existing FISI offices Opportunity to fuel organic growth exists in attractive markets where we have less than 2% of collective market share Rochester MSA Buffalo MSA At $2.8 billion in assets, we believe we have the capacity to consolidate smaller banks in our footprint Over 50 NY banks (non-MHC) under $1 billion in assets located in non-NYC Metro area Market Footprint Source: SNL Mapping Erie County Deposit Market: $30.5 Bln Monroe County Deposit Market: $11.4 Bln Chemung County Deposit Market: $1.0 Bln Source: SNL Financial |
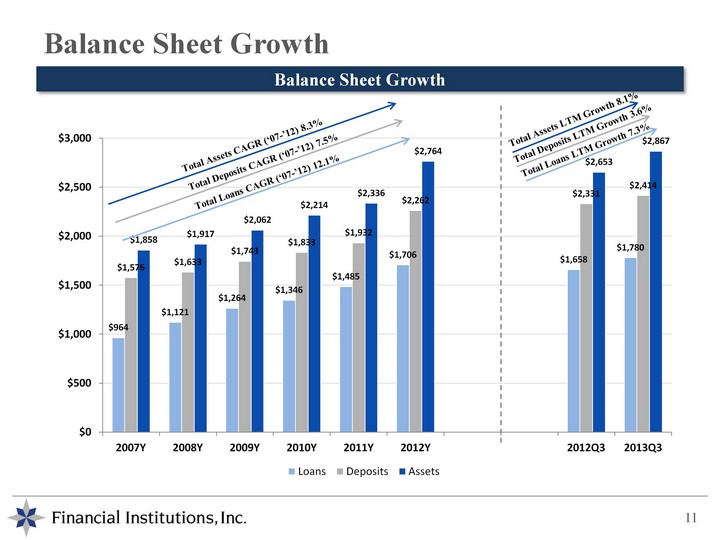
| (CHART) Total Assets LTM Growth 8.1% Total Loans LTM Growth 7.3% Total Deposits LTM Growth 3.6% Balance Sheet Growth Balance Sheet Growth 11 Total Assets CAGR ('07-'12) 8.3% Total Deposits CAGR ('07-'12) 7.5% Total Loans CAGR ('07-'12) 12.1% |
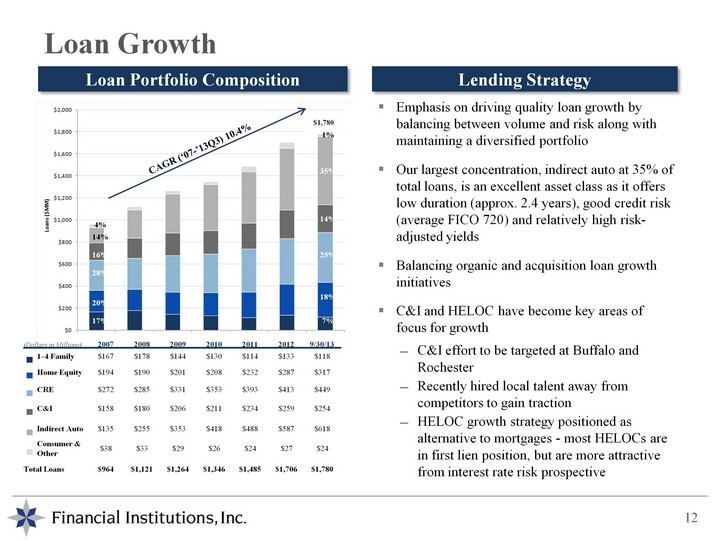
| Loan Growth 12 Loan Portfolio Composition Lending Strategy Emphasis on driving quality loan growth by balancing between volume and risk along with maintaining a diversified portfolio Our largest concentration, indirect auto at 35% of total loans, is an excellent asset class as it offers low duration (approx. 2.4 years), good credit risk (average FICO 720) and relatively high risk- adjusted yields Balancing organic and acquisition loan growth initiatives C&I and HELOC have become key areas of focus for growth C&I effort to be targeted at Buffalo and Rochester Recently hired local talent away from competitors to gain traction HELOC growth strategy positioned as alternative to mortgages - most HELOCs are in first lien position, but are more attractive from interest rate risk prospective CAGR ('07-'13Q3) 10.4% 14% 16% 28% 20% 17% 1% 35% 14% 25% 18% 7% 4% (Dollars in Millions) 2007 2008 2009 2010 2011 2012 9/30/13 1 - 4 Family $167 $178 $144 $130 $114 $133 $118 Home Equity $194 $190 $201 $208 $232 $287 $317 CRE $272 $285 $331 $353 $393 $413 $449 C&I $158 $180 $206 $211 $234 $259 $254 Indirect Auto $135 $255 $353 $418 $488 $587 $618 Consumer & Other $38 $33 $29 $26 $24 $27 $24 Total Loans $964 $1,121 $1,264 $1,346 $1,485 $1,706 $1,780 $1,780 |
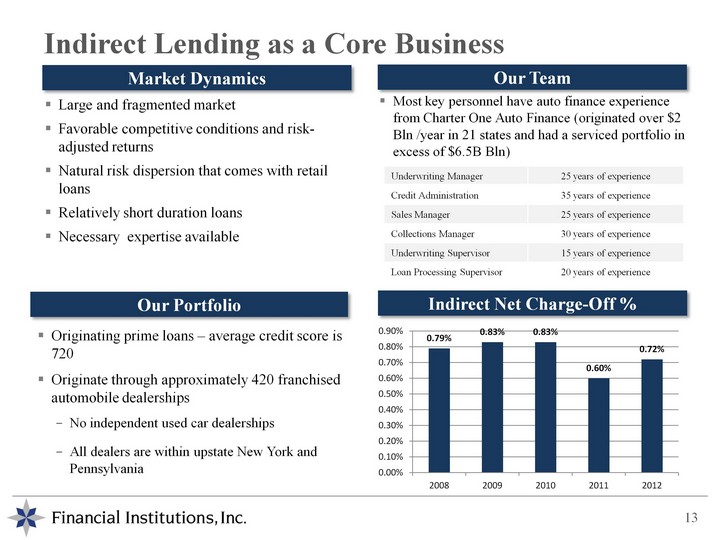
| Large and fragmented market Favorable competitive conditions and risk- adjusted returns Natural risk dispersion that comes with retail loans Relatively short duration loans Necessary expertise available Underwriting Manager 25 years of experience Credit Administration 35 years of experience Sales Manager 25 years of experience Collections Manager 30 years of experience Underwriting Supervisor 15 years of experience Loan Processing Supervisor 20 years of experience Market Dynamics Our Team Most key personnel have auto finance experience from Charter One Auto Finance (originated over $2 Bln /year in 21 states and had a serviced portfolio in excess of $6.5B Bln) Indirect Lending as a Core Business 13 Our Portfolio Indirect Net Charge-Off % Originating prime loans - average credit score is 720 Originate through approximately 420 franchised automobile dealerships No independent used car dealerships All dealers are within upstate New York and Pennsylvania (CHART) |
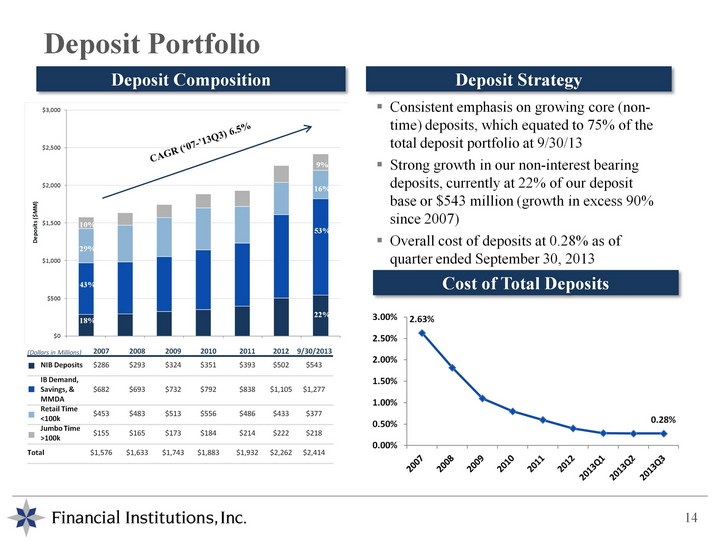
| Deposit Portfolio Deposit Strategy Cost of Total Deposits Deposit Composition 22% 18% 53% 43% 16% 29% 9% 10% 14 Consistent emphasis on growing core (non- time) deposits, which equated to 75% of the total deposit portfolio at 9/30/13 Strong growth in our non-interest bearing deposits, currently at 22% of our deposit base or $543 million (growth in excess 90% since 2007) Overall cost of deposits at 0.28% as of quarter ended September 30, 2013 CAGR ('07-'13Q3) 6.5% (CHART) (Dollars in Millions) 2007 2008 2009 2010 2011 2012 NIB Deposits $286 $293 $324 $351 $393 $502 $543 IB Demand, Savings, & MMDA $682 $693 $732 $792 $838 $1,105 $1,277 Retail Time <100k $453 $483 $513 $556 $486 $433 $377 Jumbo Time >100k $155 $165 $173 $184 $214 $222 $218 Total $1,576 $1,633 $1,743 $1,883 $1,932 $2,262 $2,414 9/30/2013 |

| (CHART) Revenue Growth 15 Net Interest Income and Noninterest Income CAGR ('09-'12) 6.2% 5.2% Increase Note: All periods exclude OTTI & Securities Gains |
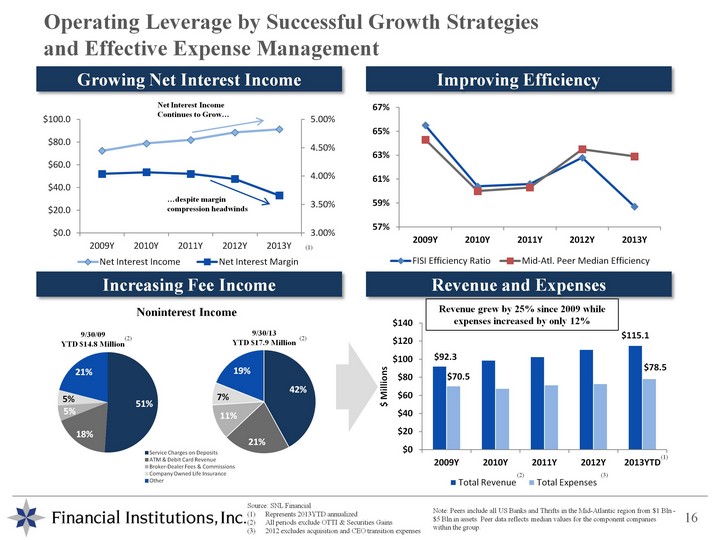
| (CHART) (CHART) Operating Leverage by Successful Growth Strategies and Effective Expense Management 16 Growing Net Interest Income Increasing Fee Income Improving Efficiency 9/30/13 YTD $17.9 Million 9/30/09 YTD $14.8 Million Noninterest Income Revenue and Expenses Revenue grew by 25% since 2009 while expenses increased by only 12% Source: SNL Financial Represents 2013YTD annualized All periods exclude OTTI & Securities Gains 2012 excludes acquisition and CEO transition expenses Net Interest Income Continues to Grow... ...despite margin compression headwinds (1) (1) (2) (3) (2) (2) Note: Peers include all US Banks and Thrifts in the Mid-Atlantic region from $1 Bln - $5 Bln in assets. Peer data reflects median values for the component companies within the group. (CHART) (CHART) (CHART) |
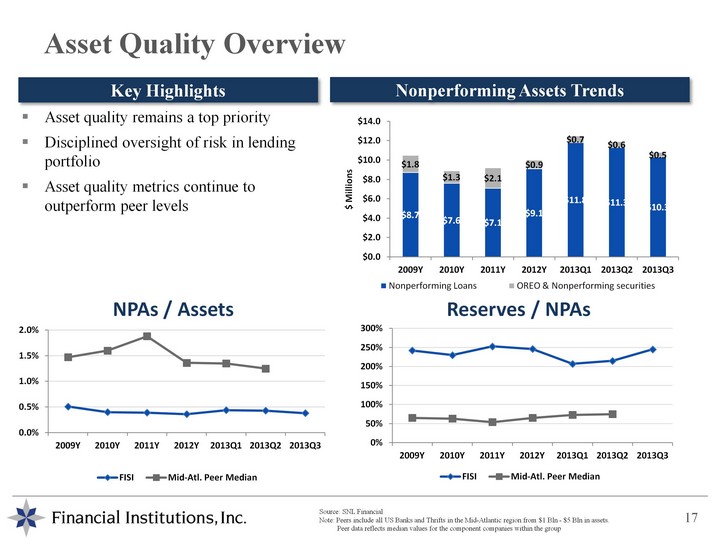
| Asset Quality Overview 17 Nonperforming Assets Trends Asset quality remains a top priority Disciplined oversight of risk in lending portfolio Asset quality metrics continue to outperform peer levels Key Highlights Source: SNL Financial Note: Peers include all US Banks and Thrifts in the Mid-Atlantic region from $1 Bln - $5 Bln in assets. Peer data reflects median values for the component companies within the group (CHART) (CHART) (CHART) |
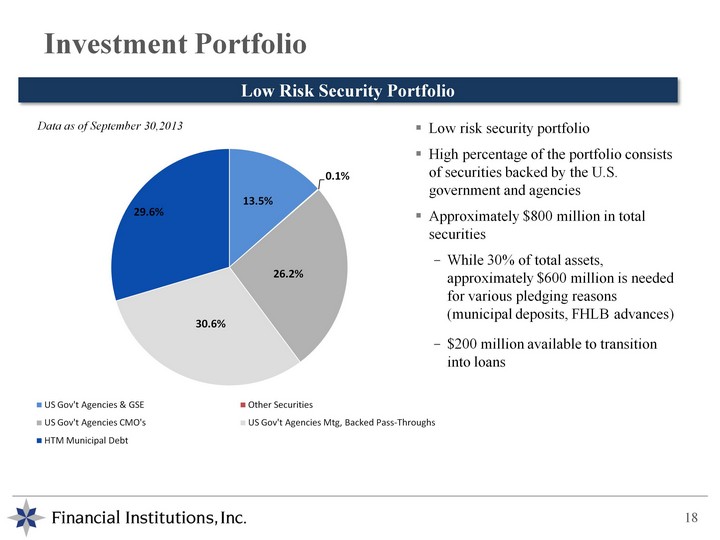
| Investment Portfolio 18 Low risk security portfolio High percentage of the portfolio consists of securities backed by the U.S. government and agencies Approximately $800 million in total securities While 30% of total assets, approximately $600 million is needed for various pledging reasons (municipal deposits, FHLB advances) $200 million available to transition into loans Data as of September 30,2013 Low Risk Security Portfolio (CHART) |
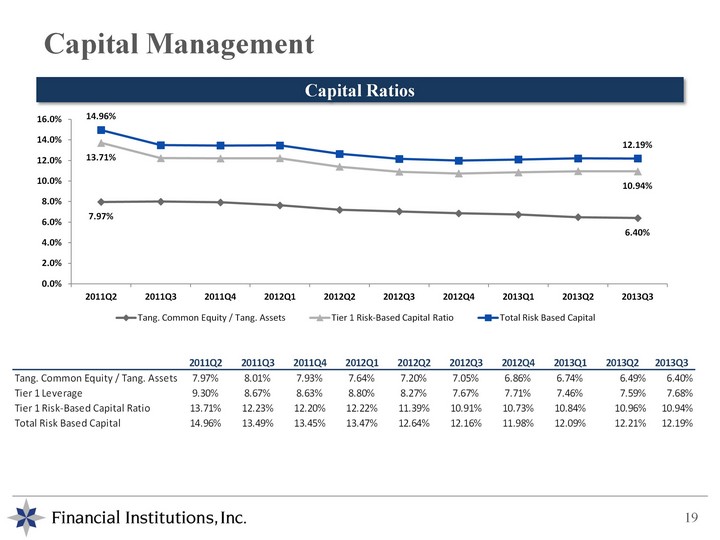
| Capital Management 19 Capital Ratios (CHART) |
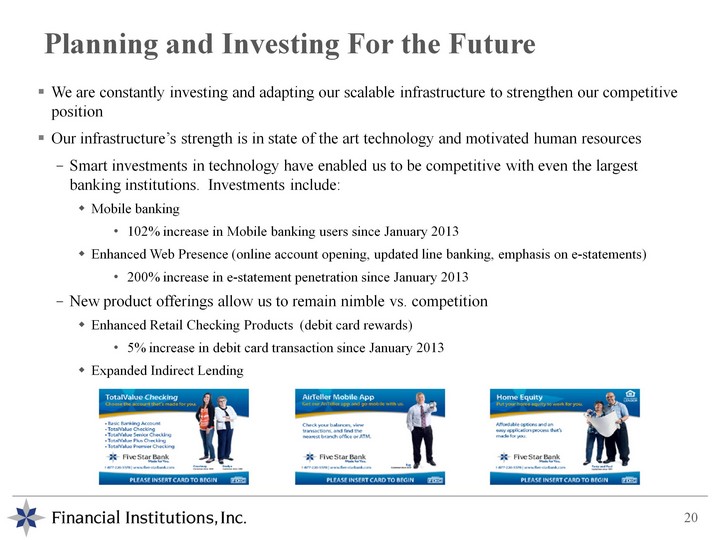
| Planning and Investing For the Future 20 We are constantly investing and adapting our scalable infrastructure to strengthen our competitive position Our infrastructure's strength is in state of the art technology and motivated human resources Smart investments in technology have enabled us to be competitive with even the largest banking institutions. Investments include: Mobile banking 102% increase in Mobile banking users since January 2013 Enhanced Web Presence (online account opening, updated line banking, emphasis on e-statements) 200% increase in e-statement penetration since January 2013 New product offerings allow us to remain nimble vs. competition Enhanced Retail Checking Products (debit card rewards) 5% increase in debit card transaction since January 2013 Expanded Indirect Lending |
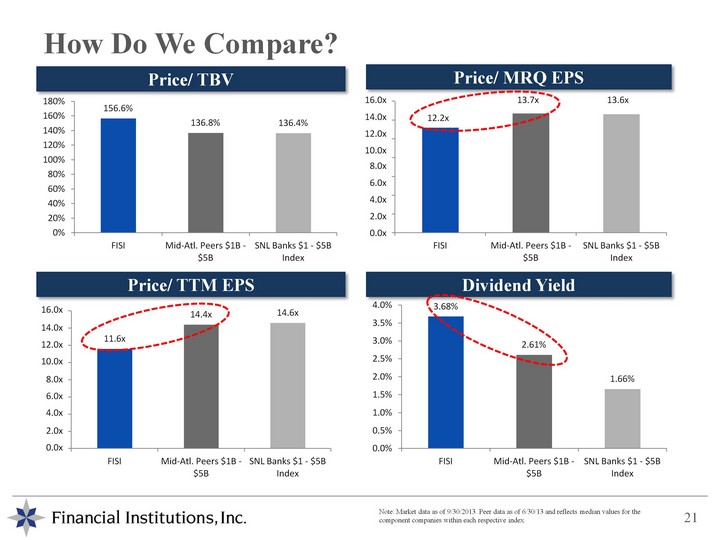
| (CHART) (CHART) (CHART) How Do We Compare? Price/ MRQ EPS Price/ TBV 21 Dividend Yield Price/ TTM EPS Note: Market data as of 9/30/2013. Peer data as of 6/30/13 and reflects median values for the component companies within each respective index. (CHART) 16.0x 14.0x 12.0x 10.0x 8.0x 6.0x 4.0x 2.0x 0.0x 16.0x 14.0x 12.0x 10.0x 8.0x 6.0x 4.0x 2.0x 0.0x 12.2x 13.7x 13.6x |

| 22 FISI and Peer Volatility (Standard Deviation 1Q10 - 1Q13) FISI = 75% Percentile of Peer Group ROAA Volatility (1Q'10 - 2Q'13) Delivering Consistent Operating Results Note: Data reflects median values for each component company within index (CHART) |
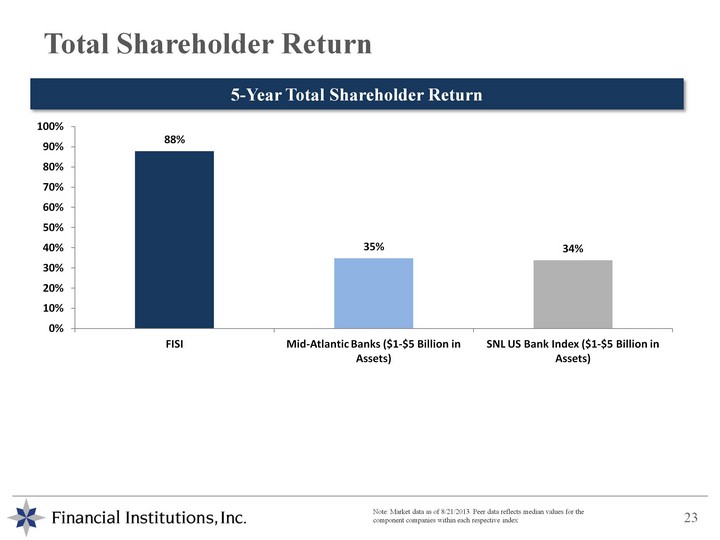
| Total Shareholder Return 23 5-Year Total Shareholder Return Note: Market data as of 8/21/2013. Peer data reflects median values for the component companies within each respective index (CHART) |
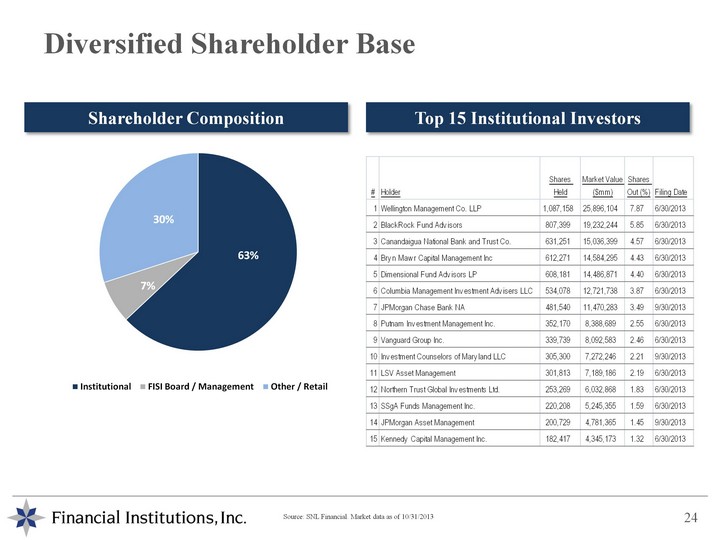
| 24 Shareholder Composition Top 15 Institutional Investors Source: SNL Financial. Market data as of 10/31/2013 Diversified Shareholder Base (CHART) |
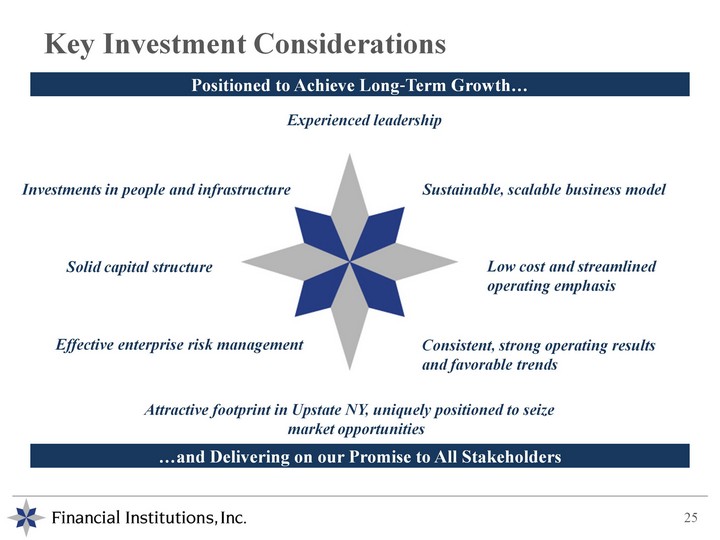
| Key Investment Considerations 25 Experienced leadership Positioned to Achieve Long^Term Growth... Attractive footprint in Upstate NY, uniquely positioned to seize market opportunities ...and Delivering on our Promise to All Stakeholders Low cost and streamlined operating emphasis Sustainable, scalable business model Effective enterprise risk management Solid capital structure Investments in people and infrastructure Consistent, strong operating results and favorable trends |

| Delivering On Our Promise NASDAQ: FISI Sandler O'Neill East Coast Financial Services Conference November 2013 |