Attached files
| file | filename |
|---|---|
| EX-99.1 - PRESS RELEASE DATED NOVEMBER 13, 2013. - CNL LIFESTYLE PROPERTIES INC | d628433dex991.htm |
| 8-K - 8-K - CNL LIFESTYLE PROPERTIES INC | d628433d8k.htm |
 CNL Lifestyle
Properties, Inc. CNL Lifestyle Properties, Inc.
Owning
Owning
America’s
America’s
Lifestyle
Lifestyle
®
®
Third Quarter 2013 Update
Third Quarter 2013 Update
November 13, 2013
November 13, 2013
Exhibit 99.2 |
 2
Forward Looking Statements
Certain statements in this document may constitute forward-looking statements within the meaning
of Section 27A of the Securities Act of 1933, as amended (the “Securities Act”) and
of Section 21E of the Securities Exchange Act of 1934, as amended (the “Exchange Act”). CNL Lifestyle Properties,
Inc. (herein also referred to as the “Company”) intends that all such forward-looking
statements be covered by the safe-harbor provisions for forward- looking statements of
Section 27A of the Securities Act and Section 21E of the Exchange Act, as applicable.
All statements, other than statements that relate solely to historical facts, including, among others,
statements regarding the Company’s future financial position, business strategy, projected
levels of growth, projected costs and projected financing needs, are forward-looking statements. Those statements
include statements regarding the intent, belief or current expectations of the management team, as
well as the assumptions on which such statements are based, and generally are identified by the
use of words such as “may,” “will,” “seeks,” “anticipates,” “believes,” “estimates,” “expects,” “plans,” “intends,”
“should,” “continues,” “pro forma” or similar expressions.
Forward-looking statements are not guarantees of future performance and actual results may
differ materially from those contemplated by such forward-looking statements due to a variety of
risks, uncertainties and other factors, including but not limited to, the factors detailed in
our Annual Report on Form 10-K for the year ended December 31, 2012, and other documents filed from time to time with
the Securities and Exchange Commission. Many of these factors are beyond the Company’s ability to control or predict. Such factors
include, but are not limited to: changes in general economic conditions in the U.S. or globally
(including financial market fluctuations); risks associated with our investment strategy; risks associated with the real
estate markets in which the Company invests; risks of doing business internationally and global
expansion, including unfamiliarity with new markets and currency risks; risks associated with
the use of debt to finance the Company’s business activities, including refinancing and interest rate risk and the
Company’s failure to comply with its debt covenants; the Company’s failure to obtain, renew
or extend necessary financing or to access the debt or equity markets; competition for
properties and/or tenants in the markets in which the Company engages in business; the impact of current and future
environmental, zoning and other governmental regulations affecting the Company’s properties; the
Company’s ability to make necessary improvements to properties on a timely or
cost-efficient basis; risks related to development projects or acquired property value-add conversions, if applicable (including
construction delays, cost overruns, the Company’s inability to obtain necessary permits and/or
public opposition to these activities); defaults on or non- renewal of leases by tenants;
failure to lease properties at all or on favorable terms; unknown liabilities in connection with acquired properties or liabilities
caused by property managers or operators; the Company’s failure to successfully manage growth or
integrate acquired properties and operations; material adverse actions or omissions by any joint
venture partners; increases in operating costs and other expense items and costs, uninsured losses or losses in
excess of the Company’s insurance coverage; the impact of outstanding or potential litigation;
risks associated with the Company’s tax structuring; the Company’s failure to qualify
and maintain its status as a real estate investment trust and the Company’s ability to protect its intellectual property and the
value of its brand. Management believes these forward-looking statements are reasonable; however,
such statements are necessarily dependent on assumptions, data or methods that may be incorrect
or imprecise and the Company may not be able to realize them. Investors are cautioned not to place
undue reliance on any forward-looking statements which are based on current expectations.
All written and oral forward-looking statements attributable to the Company or persons
acting on its behalf are qualified in their entirety by these cautionary statements. Further, forward-looking statements speak only
as of the date they are made and the Company undertakes no obligation to update or revise
forward-looking statements to reflect changed assumptions, the occurrence of unanticipated
events or changes to future operating results over time unless otherwise required by law.
|
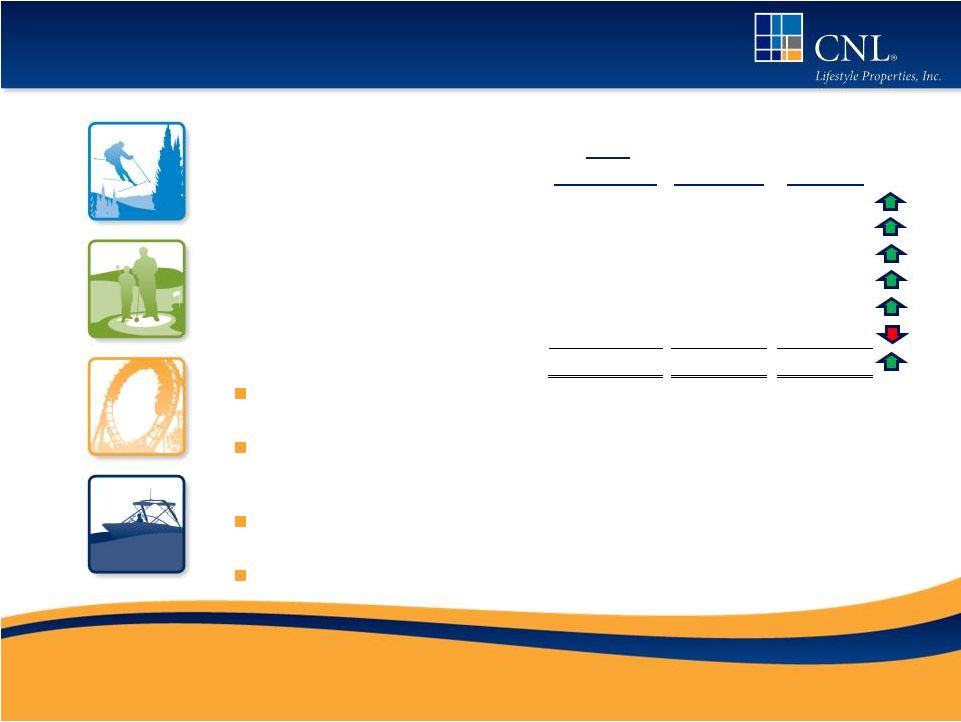
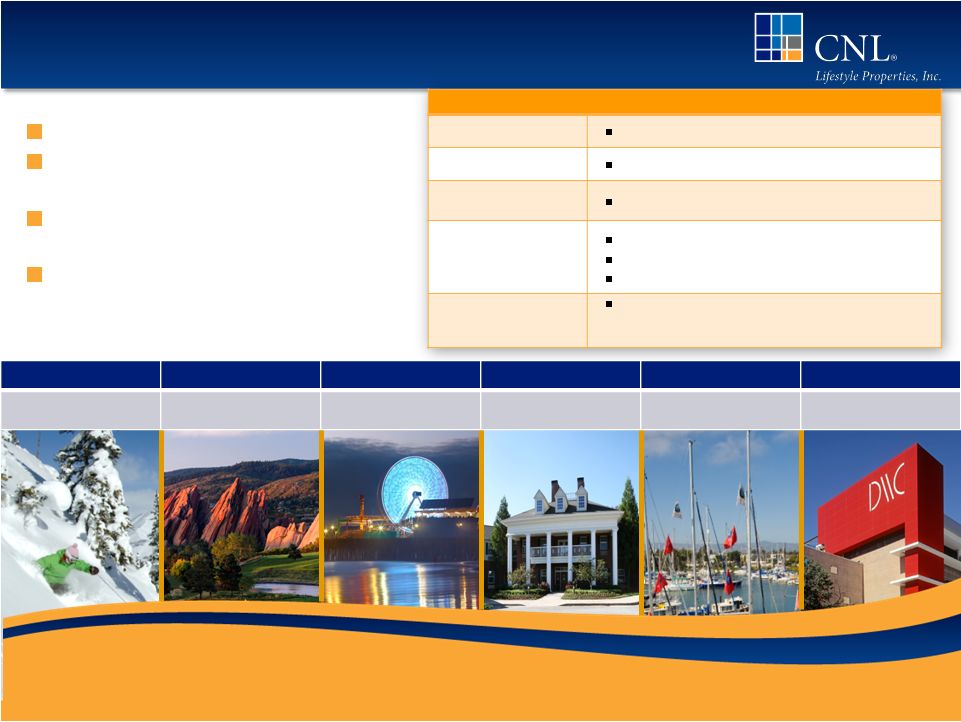 CNL
Lifestyle Properties, Inc. $2.8 billion non-listed REIT
Portfolio of 138 lifestyle-oriented
properties and 6 loans as of 11/5/13
Diversified by asset type, geography
and operator
Iconic assets and industry-leading
operators
Ski & Mountain
Golf
Attractions
Senior Housing
Marinas
Additional
•
24 properties
•
48 properties
•
23 properties
•
23 properties
•
17 properties
•
3 properties
3
Summary REIT Information
GAAP Total Assets
$2.8 billion
Property
Focus
Demographically
Driven
/
Lifestyle-Oriented
Geographic
Diversification
35 states and 2 Canadian provinces
Established Assets
Conservative Capital Structure
Leasing and Preferred Return Structures
Diversified Portfolio
Liquidity
Event
The Board will consider a listing, merger, sale
or other liquidity opportunities on or before
December 31, 2015 |
 Recent Highlights
Sold
interests
in
3
joint
ventures
for
$195
million
resulting
in
a
gain
of
$55
million on a GAAP basis (represented a 13%-16% IRR, depending on
venture)
Acquired 3 senior housing properties and 1 water park for a total of $84
million
Actively working to close approximately $300 million of new acquisitions
through Q1 2014 using the Sunrise disposition proceeds, with a focus on
senior housing and attractions
Impaired the book value of Granby development land in Colorado by
$42.5 million. Currently exploring the sale of the asset due to a business
decision not to pursue development plans
Over $33 million of owner capital invested into various portfolio assets
through October 2013
Transitioned 10 of 11 marina properties to new operators with the remainder
expected to be transitioned in Q4 2013 or by the end of Q1 2014
4 |
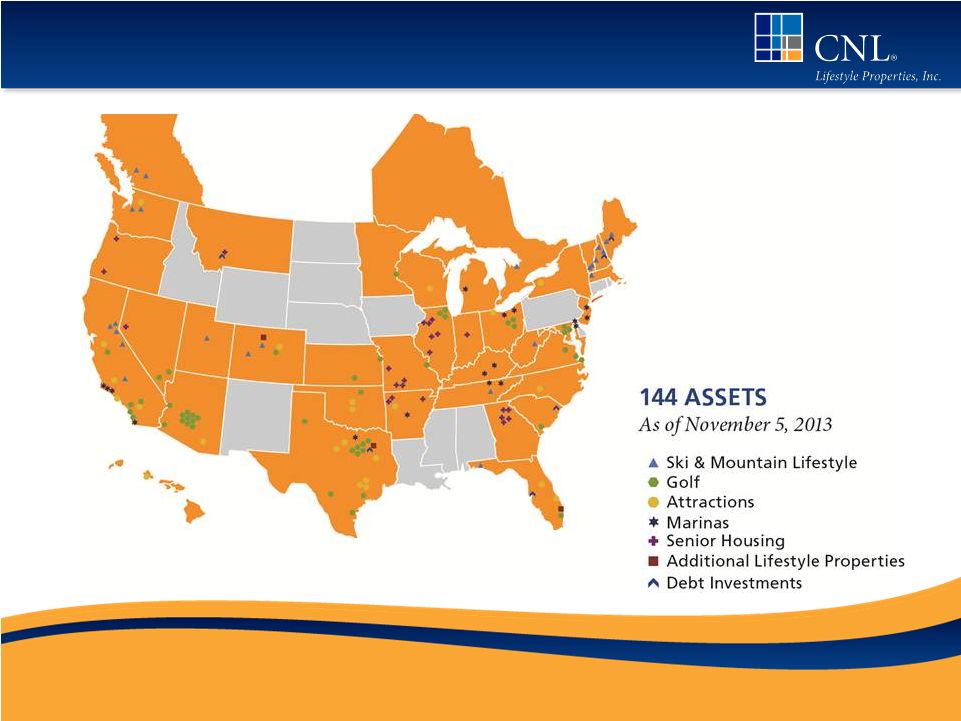 Geographic Diversification
5 |
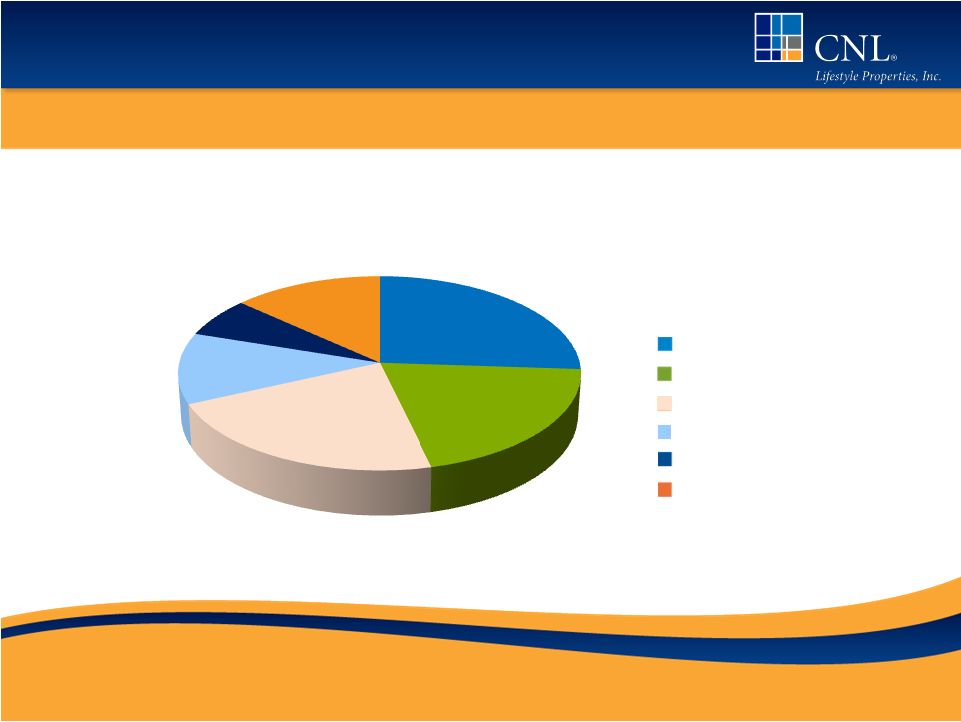 The portfolio is broadly diversified across asset classes to
mitigate against seasonality and volatility
Sector Diversification
As of November 5, 2013
Ski & Mountain Lifestyle (24)
Golf (48)
Attractions (23)
Senior Housing (23)
Marinas (17)
Additional Lifestyle Properties (3)
By Initial Purchase Price
6
26.1%
20.2%
22.0%
11.8%
6.6%
13.3% |
 Sector Performance
7
Ski & Mountain
24 properties
-
Higher ski visits and an
increase in summer-based
activities due to favorable
weather and revenue-
enhancing capital
improvements.
Golf
48 properties
-
Golf rounds are down -
consistent with the 6%
industry decrease in
overall rounds played as
reported by Golf
Datatech. EBITDA is up
due to renewed operator
focus.
Attractions
23 properties
-
The attractions portfolio has
performed largely in line with
the prior year. Largest park
experienced significant
weather challenges and fell
short of expectations.
Additional Lifestyle
3 properties
-
Steady performance at
Dallas Market Center.
Multi-family property
under renovation during
2013 and 2014.
Senior Housing
23 properties
-
Occupancy and Revenue
per Occupied Unit have both
posted solid growth over the
last year. Average
occupancy for the entire
portfolio was 92.4% as of
9/30/13.
Marinas
17 properties
-
Revenue and EBITDA
were up slightly
compared to 2012.
Management has
transitioned 10 leased
marinas to new operators
with the remaining
marinas transitioning 4Q
2013 or Q1 2014.
138 properties as of November 5, 2013
Source: CNL Lifestyle Properties, Inc. 9/30/13 Form 10-Q
Past performance is not indicative of future returns.
|
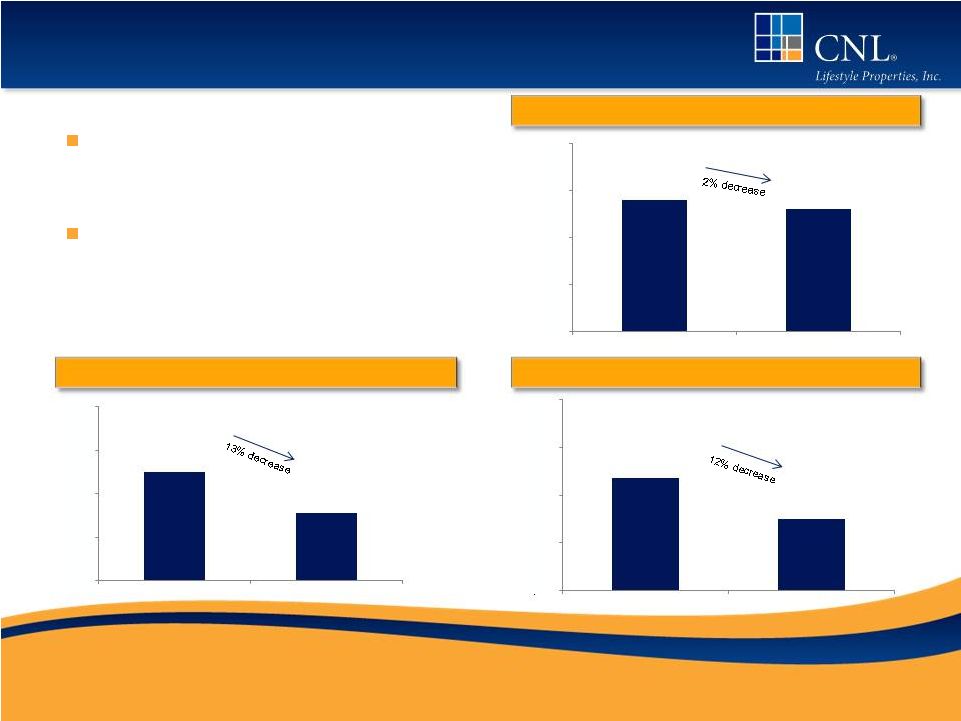
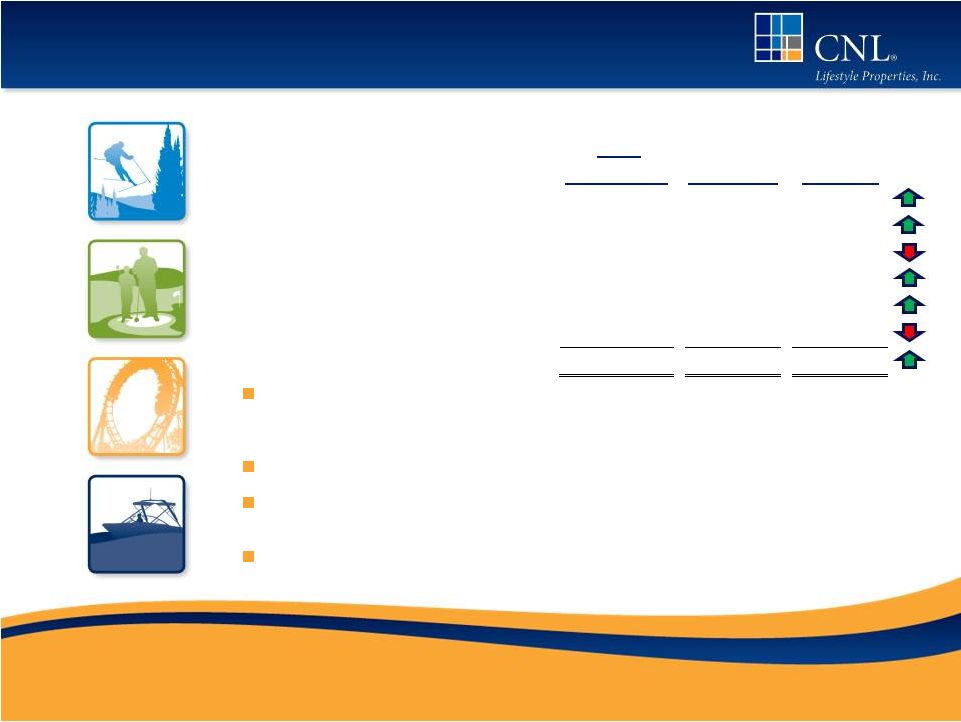 Same-Store Property Performance
8
Quarter Ended September 30, 2013 Compared to Same Period 2012
Note: Includes results for consolidated leased and managed properties owned for
both 2013 and 2012. Higher revenues and EBITDA due to an increase in
summer-based activities at many of the ski properties and moderate
increase in slip rental fees and occupancies at the marinas as a result of
improving boating activity. Lower golf rounds compared to prior year but
greater operating efficiencies. Attractions revenue and EBITDA down
primarily due to persistent rainy and cooler weather at Darien Lake
(upstate NY). Multi-family asset experienced decreases due to ongoing
unit renovations. # of
Properties
Revenue
EBITDA
Ski & Mountain Lifestyle
17
5.2%
14.3%
Golf
48
-1.0%
7.6%
Attractions
21
-2.1%
-2.5%
Senior Housing
10
6.3%
1.6%
Marinas
17
3.3%
5.8%
Additional Lifestyle Properties
1
-11.6%
-27.1%
Total Portfolio
114
0.1%
1.0%
Source: CNL Lifestyle Properties, Inc. 9/30/13 Form 10-Q
Past performance is not indicative of future returns.
|
 Same-Store Property Performance
9
Nine Months Ended September 30, 2013 Compared to Same Period 2012
Note: Includes results for consolidated leased and managed properties owned for
both 2013 and 2012. # of
Properties
Revenue
EBITDA
Ski & Mountain Lifestyle
17
15.3%
43.4%
Golf
48
-1.1%
5.8%
Attractions
21
0.4%
0.9%
Senior Housing
10
5.5%
5.8%
Marinas
17
1.0%
3.3%
Additional Lifestyle Properties
1
-14.4%
-26.4%
Total Portfolio
114
6.7%
18.4%
Source: CNL Lifestyle Properties, Inc. 9/30/13 Form 10-Q
Past performance is not indicative of future returns.
The increases in both revenue and EBITDA are primarily due to the performance of
the ski and mountain lifestyle sector.
Total ski visits for the 2012/2013 ski season were 6.1 million, up over 10% from
the previous season. The result of a “return to normalcy”,
compared to unprecedented low levels of natural snowfall for the same
period in 2012. Senior housing experienced increases driven by a 0.7%
increase in occupancy and a 3.5% increase in RevPOU.
Multi-family asset experienced decreases due to ongoing unit renovations. |
 3
Quarter Financial Summary (in Millions)
Adjusted EBITDA
10
MFFO
FFO
Source: CNL Lifestyle Properties, Inc. 9/30/13 Form 10-Q
The Company believes that its presentation of historical non-GAAP financial
measures provides useful supplementary information to and facilitates additional analysis by investors.
These historical non-GAAP financial measures are in addition to, not a
substitute for, or superior to, measures of financial performance prepared in accordance with U.S. Generally
Accepted Accounting Principles. See reconciliation to GAAP net income (loss)
contained in the Appendix. Past performance is not indicative of future
returns. FFO, MFFO and Adjusted EBITDA declined
during the third quarter of 2013 primarily due
to the sale of 42 senior housing assets owned
through the three Sunrise JV’s on July 1, 2013
As we reinvest all of these proceeds, we
expect to replace the Sunrise income and
cash flows
$75.0
$65.5
$50
$60
$70
$80
$90
Q3 2012
Q3 2013
$77.8
$76.0
$50
$60
$70
$80
$90
Q3 2012
Q3 2013
$73.5
$64.9
$50
$60
$70
$80
$90
Q3 2012
Q3 2013
rd |
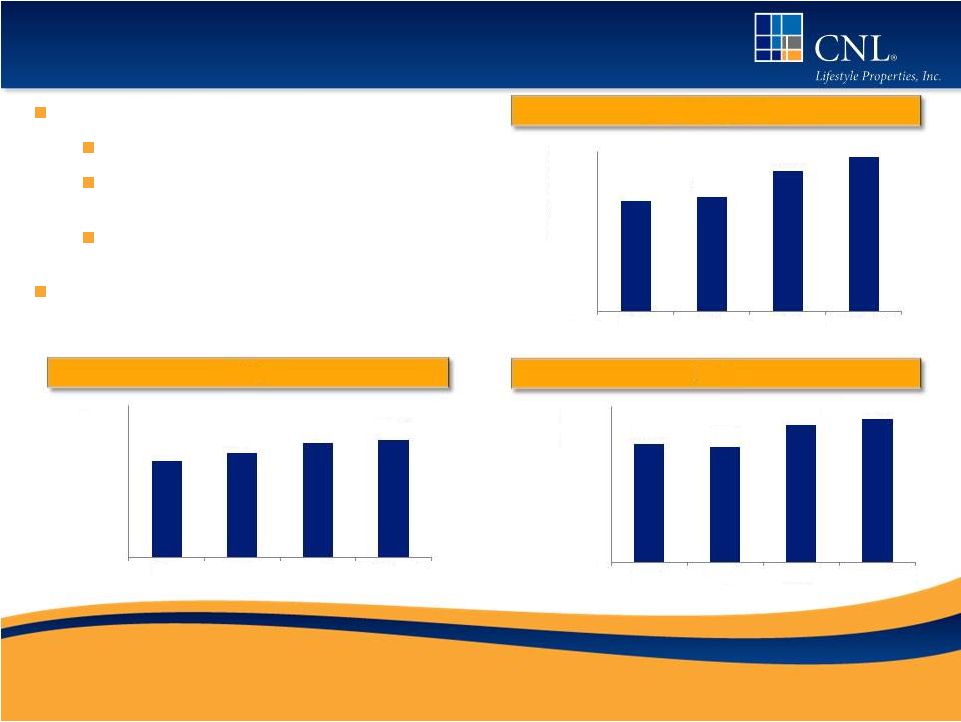 Full Year Financial Summary (in Millions)
11
Source: CNL Lifestyle Properties 2010, 2011 & 2012 Form 10-K and 9/30/13
Form 10-Q The Company believes that its presentation of historical
non-GAAP financial measures provides useful supplementary information to and facilitates additional analysis by investors.
These historical non-GAAP financial measures are in addition to, not a
substitute for, or superior to, measures of financial performance prepared in accordance with U.S. Generally
Accepted Accounting Principles. See reconciliation to GAAP net income (loss)
contained in the Appendix. Past performance is not indicative of future
returns. Continued growth due primarily to:
Properties acquired subsequent to 9/30/12
Same-store rent growth in ski and growth of NOI in
senior housing
Reductions in G&A and acquisition-related costs
and fees
TTM lease coverage of 1.58x at Q3 2013 vs. 1.32x at Q3
2012 primarily due to improvements at our ski assets
$137.1
$142.7
$175.5
$193.2
$-
$20.0
$40.0
$60.0
$80.0
$100.0
$120.0
$140.0
$160.0
$180.0
$200.0
2010
2011
2012
TTM Sep 2013
$98.6
$96.6
$114.3
$119.3
$-
$20.0
$40.0
$60.0
$80.0
$100.0
$120.0
2010
2011
2012
TTM Sep 2013
$82.1
$89.6
$97.7
$100.4
$-
$20.0
$40.0
$60.0
$80.0
$100.0
$120.0
2010
2011
2012
TTM Sep 2013
FFO
MFFO
Adjusted EBITDA |
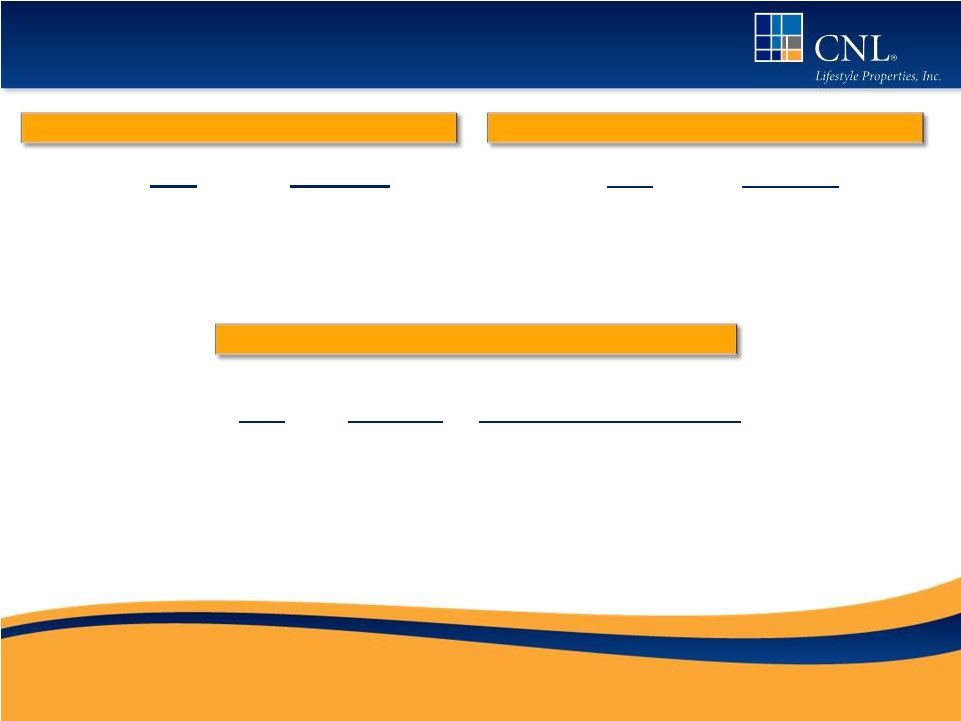 Credit Metrics
Interest Coverage (1)
(1) Calculated as Adjusted EBITDA divided by interest
expense (2) Net debt is total debt less cash
(3) Debt includes line of credit
Net Debt / Adjusted EBITDA (2)
12
Debt / Total Assets (3)
Year
Coverage
2011
2.4x
2012
2.6x
TTM Sep 2013
2.7x
Year
Coverage
2011
5.3x
2012
6.1x
Sep 2013
4.8x
Source: CNL Lifestyle Properties, Inc. 2012 Form 10-K and 9/30/13 Form
10-Q The Company believes that its presentation of historical
non-GAAP financial measures provides useful supplementary information to and facilitates additional analysis by
investors. These historical non-GAAP financial measures are in addition to, not
a substitute for, or superior to, measures of financial performance prepared in accordance with
U.S. Generally Accepted Accounting Principles. See reconciliation to GAAP net
income (loss) contained in the Appendix. Past performance is not indicative
of future returns. Consolidated
Leverage Including Share
Year
Leverage
of Unconsolidated Entities
2011
32.0%
43.3%
2012
38.7%
45.3%
Sep 2013
37.3%
40.8% |
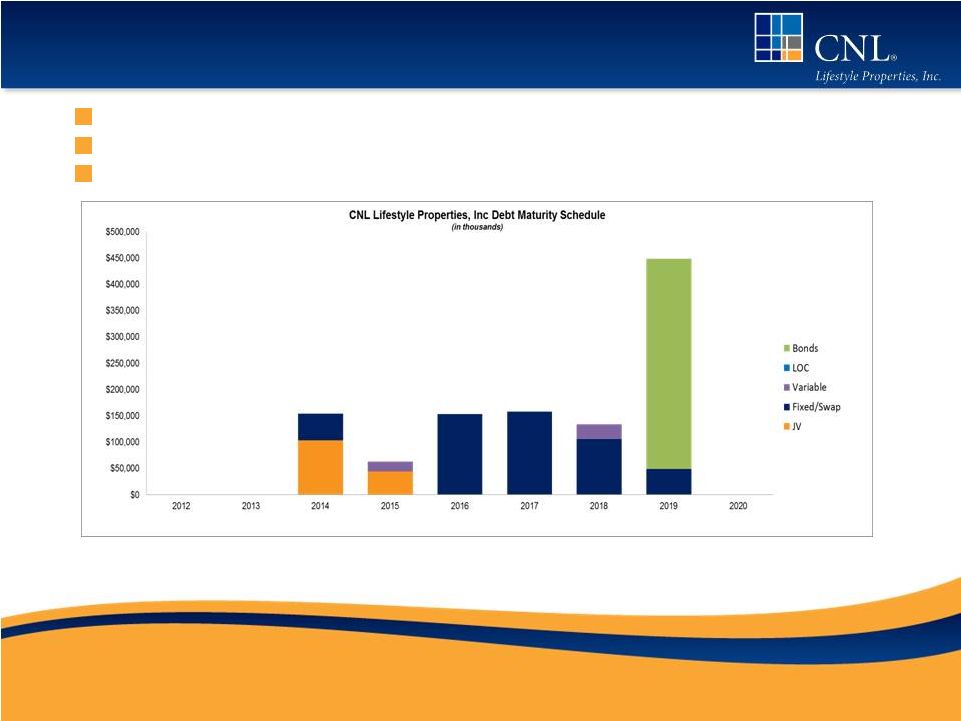 Key
Credit Information 13
Weighted average interest rate is 6.01% (6.05% without JV debt)
83% fixed rate debt, 10% hedged and 7% variable rate debt
No significant near-term maturities
Note:
Chart
as
of
September
30,
2013.
2014
maturities
have
declined
since
the
last
report
due
to
the
disposition
of
the
Sunrise
portfolio
that
was sold in July 2013. Remainder of joint venture debt in 2014 relates to the
Dallas Market Center which we expect will be refinanced prior to maturity in
September 2014. |
 Management Initiatives
Capital Deployment / Redeployment
Regain “full investment”
status –
now focused on recycled capital
Invest in improvements and enhancements to existing assets to further
drive revenue and expense reduction
Proactive Portfolio Management and Optimization
Focused asset management to drive performance and value
Asset disposition strategy(ies) formulated and in initial execution phase
Streamline and rebalance portfolio
Beginning Pivot to Liquidity Options Study
2014 focus in context of December 2015 liquidity consideration date
14 |
 Early February
CLP Board determines
estimated per-share
value
2013
November
December
2014
January
February
Third-party consultant comprehensive valuation
analysis process underway
Late January/Early February
Completion of valuation
analysis (NAV as of 12/31/13)
Valuation Timeline
Early to Mid February
Announce Board
approved estimated
per-share value
15
November 7, 2013
Obtain CLP Audit Committee and Board
approval
of
3
rd
-
party
valuation
consultant
Engage
3
rd
-party
valuation
consultant
and commence valuation work |
 Conclusion & Summary
16
Continued
the
positive
momentum
building
upon
successes
in
2012,
despite
recovering economy and significant weather challenges at our largest
attractions
Began the process of selling certain non-core assets and recycling capital,
which we expect will accelerate in 2014
Largely completed the restructuring activities within our key asset classes,
with the transition of properties from our largest marina tenant
to four new
operators
The weather impact on our attractions, the sale of the strong performing
Sunrise JVs and the marina transitions create certain headwinds as we
embark
on
updating
our
NAV
per
share
at
the
end
of
2013
-
We
believe
that
recent and pending acquisitions, and transitions that we are making will
ultimately drive the value of our assets over the longer-term
|
 Contact Information
17
For more information about
CNL Lifestyle Properties, please contact
CNL Client Services at 866-650-0650. |
 Appendix
18
Appendix |
 Reconciliation of FFO and MFFO to Net
Income (Loss)
19
Source: CNL Lifestyle Properties 2010, 2011 & 2012 Form 10-K and 9/30/13
Form 10-Q The Company believes that its presentation of historical
non-GAAP financial measures provides useful supplementary information to and facilitates additional analysis by investors.
These historical non-GAAP financial measures are in addition to, not a
substitute for, or superior to, measures of financial performance prepared in accordance with U.S. Generally
Accepted Accounting Principles.
Past performance is not indicative of future returns.
(1)
Includes
amounts
related
to
the
properties
that
are
classified
as
assets
held
for
sale
and
for
which the related results are classified as income (loss) from discontinued
operations in the accompanying condensed consolidated statements of
operations. (2)
This amount represents our share of the FFO or MFFO adjustments allowable under the
NAREIT or IPA definitions, respectively, multiplied by the percentage of
income or loss recognized under the HLBV method. The fluctuations in FFO and
MFFO contributions as allocated under the HLBV method resulted in lower FFO
and MFFO from our unconsolidated entities
during
the
quarter
and
nine
months
ended
Sept.
30,
2013
even
though
cash
distribution
from these entities were consistent for the same periods in 2012.
(3)
In evaluating investments in real estate, management differentiates the costs to
acquire the investment from the operations derived from the investment. By
adding back acquisition fees and expenses relating to business combinations,
management believes MFFO provides useful supplemental information of its
operating performance and will also allow comparability between real
estate
entities
regardless
of
their
level
of
acquisition
activities.
Acquisition
fees
and
expenses
include payments to our advisor or third parties. Acquisition fees and expenses
relating to business combinations under GAAP are considered operating
expenses and as expenses included in the determination of net income (loss)
and income (loss) from continuing operations, both of which are performance
measures under GAAP. All paid and accrued acquisition fees and
expenses
will
have
negative
effects
on
returns
to
investors,
the
potential
for
future
distributions,
and cash flows generated by us, unless earnings from operations or net sales
proceeds from the disposition of properties are generated to cover the
purchase price of the property. (4)
Under GAAP, rental receipts are allocated to periods using various methodologies.
This may result in income recognition that is significantly different than
underlying contract terms. By adjusting for these items (to reflect such
payments from a GAAP accrual basis to a cash basis of disclosing the rent
and lease payments), MFFO provides useful supplemental information on the
realized economic impact of lease terms and debt investments, providing insight on
the contractual
cash
flows
of
such
lease
terms
and
debt
investments,
and
aligns
results
with
management’s analysis of operating performance.
(5)
Loss
of
extinguishment
of
debt
includes
legal
fees
incurred
with
the
transaction,
prepayment
penalty fees and write-off of unamortized loan costs, as applicable.
(6)
Management believes that adjusting for write-offs of lease related assets is
appropriate because they are non-recurring non-cash adjustments that
may not be reflective of our ongoing operating performance.
(7)
In July 2013, we completed the sale of our interests in 42 senior housing
properties held through three unconsolidated joint ventures as discussed
above. 2013
2012
2013
2012
Net income (loss)
78,293
$
23,613
$
(211)
$
(21,072)
$
Adjustments:
Depreciation
and
amortization
(1)
38,349
35,246
111,165
100,319
Impairment
of
real
estate
assets
(1)
2,740
-
45,191
267
Gain
on
sale
of
unconsolidated
entities
(7)
(55,394)
(55,394)
Gain
on
sale
of
real
estate
investment
(1)
(2)
(5)
(2,086)
(287)
Net
effect
of
FFO
adjustment
from
unconsolidated
entities
(2)
1,484
16,151
11,821
28,580
Total funds from operations
65,470
75,005
110,486
107,807
Acquisition
fees
and
expenses
(3)
1,009
570
1,922
3,380
Straight-line
adjustments
on
leases
and
notes
receivable
(1)(4)
(1,924)
(2,531)
(3,502)
(12,718)
Amortization of above/below market intangible assets
and liabilities
(1)
349
196
1,030
207
Loss
from
early
extinguishment
of
debt
(5)
-
-
-
4
Write-off/impairment
of
lease
related
investments
(6)
-
-
-
3,566
Loan loss provision
-
-
-
1,699
Accretion of discounts/amortization of premiums for
debt investments
3
242
9
641
MFFO
adjustments
from
unconsolidated
entities:
(2)
Straight-line adjustments on leases and notes receivable
(29)
68
(175)
242
Amortization of above/below market intangible
assets and liabilities
47
(4)
39
(14)
Modified funds from operations
64,925
$
73,546
$
109,809
$
104,814
$
Weighted average number of shares of common stock
outstanding (basic and diluted)
319,507
313,250
317,960
311,455
FFO per share (basic and diluted)
0.20
$
0.24
$
0.35
$
0.35
$
MFFO per share (basic and diluted)
0.20
$
0.23
$
0.35
$
0.34
$
Quarter Ended
Sept. 30,
Nine Months Ended
Sept. 30, |
 Reconciliation of Adjusted EBITDA to Net
Income (Loss)
20
Source: CNL Lifestyle Properties 2010, 2011 & 2012 Form 10-K and 9/30/13
Form 10-Q The Company believes that its presentation of historical
non-GAAP financial measures provides useful supplementary information to and facilitates additional analysis by
investors. These historical non-GAAP financial measures are in addition to, not
a substitute for, or superior to, measures of financial performance prepared in accordance
with U.S. Generally Accepted Accounting Principles.
Past performance is not indicative of future returns.
1. Investments in our unconsolidated joint ventures are accounted for under the HLBV method of
accounting. Under this method, we recognize income or loss based on the change in liquidating
proceeds we would receive from a hypothetical liquidation of our investments based on depreciated book value. We adjust
EBITDA for equity in earnings (loss) of our unconsolidated entities because we believe this is not
reflective of the joint ventures’ operating performance or cash flows available for
distributions to us. We believe cash distributions from our unconsolidated entities, exclusive of any financing transactions, are reflective of their
operating performance and its impact to us and have been added back to adjusted EBITDA above.
For the nine months ended Sept. 30, 2012, cash distributions from unconsolidated entities
excludes approximately $3.4 million in return of capital. 2. We believe that
adjusting for straight-line adjustments for leased properties and mortgages and other notes receivable is appropriate because they are non-cash
adjustments.
3. In July 2013, we completed the sale of our interests in 42 senior housing properties held through
three unconsolidated joint ventures as discussed above. 4. In connection with an
acquisition of a attraction property, we recorded a bargain purchase gain as a result of the fair value of the net assets acquired exceeding
the consideration transferred as discussed above.
2013
2012
2013
2012
TTM
Net income (loss)
78,293
$
23,613
$
(211)
$
(21,072)
$
(55,212)
$
Loss from discontinued operations
2,636
185
373
275
1,498
Interest and other income
(165)
(243)
(682)
(338)
(1,544)
Bargain
purchase
gain
on
acquisition
of
real
estate
(4)
(2,653)
-
(2,653)
-
(2,653)
Interest expense and loan cost amortization
17,835
18,393
54,619
51,407
71,807
Equity
in
earnings
of
unconsolidated
entities
(1)
(4,147)
(2,266)
(9,183)
(5,774)
(8,930)
Cash
distributions
from
unconsolidated
entities
(1)
3,177
5,702
23,290
25,796
37,682
Loss from early extinguishment of debt
-
-
-
4
-
Depreciation and amortization
38,295
35,059
110,926
99,774
146,424
Loss (recovery) on lease termination
-
(67)
-
3,226
21,951
Impairment provision
-
-
42,451
-
42,451
Loan loss provision
-
-
-
1,699
Gain
on
sale
of
unconsolidated
entities
(3)
(55,394)
-
(55,394)
-
(55,394)
Straight-line
adjustments
for
leases
and
notes
receivables
(2)
(1,924)
(2,531)
(3,502)
(12,718)
(4,875)
Adjusted EBITDA
75,953
$
77,845
$
160,034
$
142,279
$
193,205
$
Quarter Ended
September 30,
Nine Months Ended
September 30, |