Attached files
| file | filename |
|---|---|
| 8-K - FORM 8-K - BNC BANCORP | v360483_8k.htm |

SANDLER O’NEILL EAST COAST FINANCIAL SERVICES CONFERENCE NOVEMBER 2013

• Headquarters: • Branches: • Total Assets: • Total Loans: • Total Deposits: High Point, NC 40 $3.2 billion $2.3 billion $2.8 billion Building Premier Franchise in the Carolinas • Exchange: • Recent Stock Price: • Price to TBV: • Market Cap: • Annual Dividend: • Dividend Yield: NASDAQ: BNCN $13.14 154% $358 million $0.20 1.52% BNC BANCORP , Parent C ompany of Bank of North Carolina 2 Total Market Capitalization exceeds all NC Headquartered Banks with the exception of BofA, BBT, and First Citizens Primary Objective: Maximize Long - term Shareholder Value Source: SNL Financial and Company filings, pro forma for acquisition of Randolph Bank & Trust as of October 1, 2013 Market data as of November 12, 2013

• Attractive franchise concentrated in growth markets in the Carolinas – 5 th largest bank headquartered in North Carolina • June 2013 addition to Russell Index ― Daily average trading volume since addition: 69,000 shares • Proven acquirer – Ten acquisitions, both whole bank and FDIC - assisted • Sophisticated and disciplined leadership – Executive team in place since inception • Strong momentum with substantial earnings upside – Balance sheet and core earnings power; 3 - , 5 - , and 10 - year CAGR of 20%+ – Significant drivers of future earnings should be phased in by 2014 – Profitable every year since 1994 • Regulatory endorsement 3 Investment Thesis

Well Managed Banking Franchise in High - Growth Markets Throughout the Carolinas Between 2008 to Current, Management Executed on a Strategy to: 1. Fortify the balance sheet – Raise capital – Clean up problem loans without diluting capital – Improve and increase core deposit mix 2. Recruit additional and retain existing t alent 3. Develop and grow fee - based lines of businesses 4. Capitalize on the crisis by doing FDIC and non - FDIC bank deals 5. Grow earnings through operational efficiencies 6. Reward shareholders as multiples return to pre - crisis levels Five Year Plan – Strategic and Opportunistic Execution 4

The Results

Source: SNL Financial and Company filings *Q3 2013 includes estimated pro - forma metrics for acquisition of Randolph Bank & Trust 6 Balance Sheet Tripled in Size $102 $134 $154 $181 $210 $307 $372 $498 $595 $952 $1,130 $1,573 $1,634 $2,150 $2,455 $3,105 $3,258 0 500 1,000 1,500 2,000 2,500 3,000 1997 1998 1999 2000 2001 2002 2003 2004 2005 2006 2007 2008 2009 2010 2011 2012 Q3 13* Loans Deposits Assets 1997+ 5 Year 3 Year CAGR CAGR CAGR Loans 27.8% 18.9% 27.1% Deposits 28.4% 25.8% 26.0% Assets 28.0% 23.6% 25.9%
• BNC reported a GAAP p rofit in every year throughout the credit cycle from 2007 — 2012 • BNC chose not to execute highly capital dilutive “Bulk Sales” of problem assets – Did not meet our hurdle for “maximizing long - term shareholder value” • Tangible Book Value has increased through the credit cycle 7 Profitable in Every Year Since 1994

Capital Ratios (%) x Completed Two Common Stock Offerings - x Improved Capital Ratios Significantly x 2010: $35 million x 2013: $73 million 8 Two Successful Capital Raises 7.6 % 9 .2% 9.5% 11.7 % 14.1 % 0.00% 2.00% 4.00% 6.00% 8.00% 10.00% 12.00% 14.00% 16.00% TCE / TA Leverage Ratio Tier 1 Common Ratio Tier 1 Ratio Total Capital Ratio Current Capital Ratios Capital Ratios prior to 2010 Capital Raise
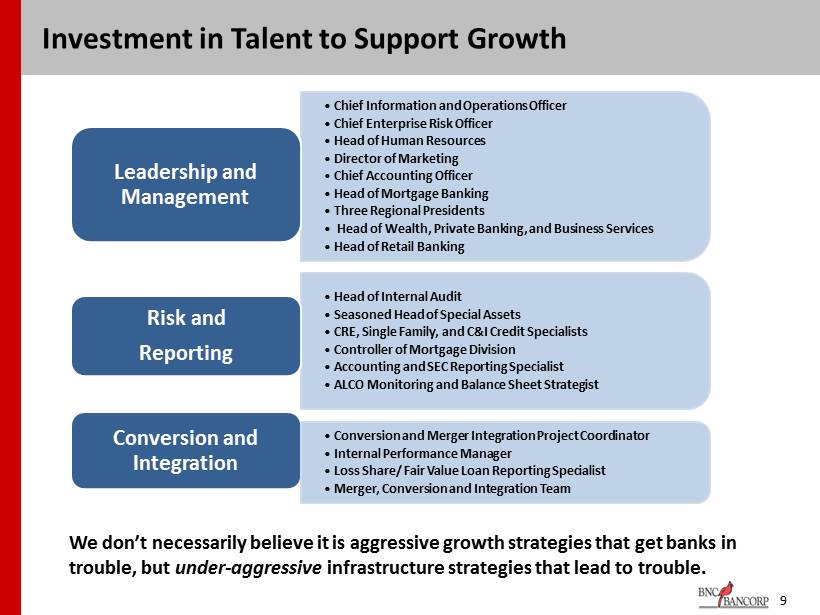
9 Investment in Talent to Support Growth • Chief Information and Operations Officer • Chief Enterprise Risk Officer • Head of Human Resources • Director of Marketing • Chief Accounting Officer • Head of Mortgage Banking • Three Regional Presidents • Head of Wealth, Private Banking, and Business Services • Head of Retail Banking Conversion and Integration • Head of Internal Audit • Seasoned Head of Special Assets • CRE, Single Family, and C&I Credit Specialists • Controller of Mortgage Division • Accounting and SEC Reporting Specialist • ALCO Monitoring and Balance Sheet Strategist Risk and Reporting • Conversion and Merger Integration Project Coordinator • Internal Performance Manager • Loss Share/ Fair Value Loan Reporting Specialist • Merger, Conversion and Integration Team Leadership and Management We don’t necessarily believe it is aggressive growth strategies that get banks in trouble, but under - aggressive i nfrastructure strategies that lead to trouble.
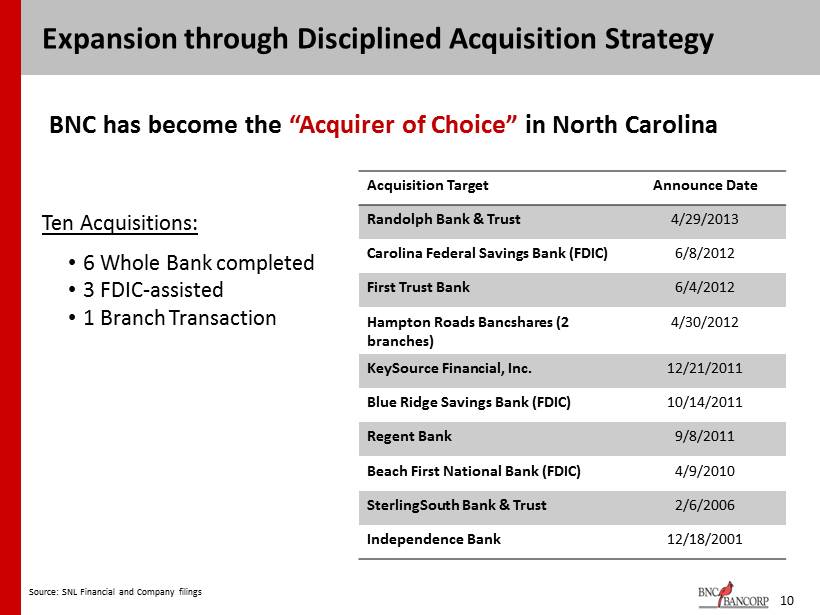
Expansion through Disciplined Acquisition Strategy Source: SNL Financial and Company filings Ten Acquisitions: • 6 Whole Bank completed • 3 FDIC - assisted • 1 Branch Transaction Acquisition Target Announce Date Randolph Bank & Trust 4/29/2013 Carolina Federal Savings Bank (FDIC) 6/8/2012 First Trust Bank 6/4/2012 Hampton Roads Bancshares (2 branches) 4/30/2012 KeySource Financial, Inc. 12/21/2011 Blue Ridge Savings Bank (FDIC) 10/14/2011 Regent Bank 9/8/2011 Beach First National Bank (FDIC) 4/9/2010 SterlingSouth Bank & Trust 2/6/2006 Independence Bank 12/18/2001 BNC has become the “Acquirer of Choice” in North Carolina 10

Franchise Expanded to All Key Markets in the Carolinas 11 Source: SNL Financial and MapInfo Loan data as of 3/31/20123 per Company management (loan and deposit data in thousands) NC SC Charleston Charlotte Greensboro Raleigh Myrtle Beach Charleston Greenville Asheville Western Carolinas - Asheville Branches Loans Deposits 4 125,000 140,000 Coastal South Carolina Branches Loans Deposits 8 235,000 285,000 Piedmont Triad - Greensboro Branches Loans Deposits 18 1,000,000 1,625,000 Charlotte Branches Loans Deposits 6 625,000 537,000 11 Raleigh - Durham- Chapel Hill Branches Loans Deposits 4 325,000 250,000

Source: SNL Financial and Company filings Noninterest Income ($mm) Mortgage Division Built on Purchase Volume *Excludes FDIC related income, securities and acquisition gains $1.9 $3.0 $3.9 $5.4 $5.6 9.5% 10.4% 13.4% 16.5% 17.9% 0.0% 4.0% 8.0% 12.0% 16.0% 20.0% $0.0 $1.0 $2.0 $3.0 $4.0 $5.0 $6.0 2009Q4 2010Q4 2011Q4 2012Q4 2013Q2 Noninterest Income Noninterest Inc / Operating Rev The mortgage division has become a large driver of noninterest income CURRENTLY at 92% PURCHASE Volume Revenue ramp: ▪ 2011 (actual): $2.2 million ▪ 2012 (actual): $6.2 million ▪ 2013 (forecast): $10.5 million ▪ 2014 (forecast): $12.0 million 12 Growing Fee Income

Earnings Per Share Ramping as Planned Current Price $13.14 EPS Price/EPS • 2012 Actual $0.48 • 2013 Consensus $0.64 20.5x • 2014 Consensus $1.06 12.4x • 2015 Consensus $1.21 10.9x Consensus EPS estimates for 2014/2015 indicate upside to current valuations Source: SNL Financial and Company filings Data as of June 30, 2013; market data as of November 12, 2013 $0.48 $ 0.64 $1.06 $ 1.21 -$0.10 $0.10 $0.30 $0.50 $0.70 $0.90 $1.10 $1.30 2012 Actual 2013 Consensus 2014 Consensus 2015 Consensus Consensus EPS Forecasts 13 EPS ramp at a 40% Compounded Annual Growth Rate between 2012 actual and 2015 estimates

Shareholders Being Rewarded as Earnings Ramp and Multiples Return to Pre - Crisis Levels $7.50 $14.00 14

Reported net income Q3 2013 $ 5,030 Plus: merger - related expenses 540 Less: gain (loss) on sales of investment securities, net - Less: acquisition gains - Less: Income tax expense (benefits) on adjustments 197 Adjustments to net income after tax 343 Core net income (loss) using Analyst definition of Core $ 5,373 Add: Cap Costs incurred in Q3 2013 2,625 Less: Tax effect 958 Net savings on expiration of cap costs 1,667 Adjusted Net Income without cap costs, Q3 2013 7,040 Adjusted EPS, Q3 2013 without cap costs $ 0.26 Core BNC Standalone, Annual $ 1.04 RBT Consensus Accretion $ 0.08 Annualized Core EPS run rate (1) $ 1.12 (1) After deducting expiring cap costs and adding consensus annual EPS accretion on the Randolph Bank & Trust transaction. 15 Easy Visibility to 2014 Consensus Core Earnings after Deducting Expiring Cap Costs Source : Company filings

16 Visibility into Normalized Core EPS Analysis of Credit Cycle Expenses – Current vs Normalized Source: Company filings 2013 Normalized Provision, YTD 2013 9,753 Annualized 13,004 8,765 OREO Valuation Losses, YTD 2013 3,462 Annualized 4,616 1,616 Loan and Workout Expenses, YTD 2013 3,394 Annualized 4,525 2,036 NPA Average YTD 114,837 45,935 Lost income at 4.25% 4,881 1,952 Total Credit Cycle Expense 27,026 14,369 Credit Expense as a % of loans 1.29% 0.68% Savings in 2015 representing more normalized credit costs 12,657 After - tax savings 7,911 Addition to EPS $ 0.29 2014 Consensus EPS $ 1.03 Core EPS with Normalized Credit Cycle Expenses $ 1.32 42 basis points on Non - covered portfolio 50 bpts on Non - Fair Value loans 15 bpts on acquired loans carried at fair value Losses at 35% of current levels Workout costs at 45% of current levels NPAs decline by 60% Necessitated by end of loss sharing agreements

Net Interest Margin Efficiency Ratio Non Interest Income / Total Assets (%) 3.60% 3.87% 3.85% 4.14% 3.20% 3.30% 3.40% 3.50% 3.60% 3.70% 3.80% 3.90% 4.00% 4.10% 4.20% 2010Y 2011Y 2012Y 2013Q3 BNCN Regional Peers 57.7% 66.8% 67.6% 63.0% 50.00% 55.00% 60.00% 65.00% 70.00% 75.00% 2010Y 2011Y 2012Y 2013Q3 BNCN Regional Peers 0.40% 0.40% 0.51% 0.68% 0.00% 0.20% 0.40% 0.60% 0.80% 1.00% 1.20% 1.40% 1.60% 2010Y 2011Y 2012Y 2013Q3 BNCN Regional Peers 17 Source: SNL Financial and Company filings, as of September 30, 2013 Regional peers include banks in NC, SC, and VA with total assets between $1.0bn and $4.0bn *Shown on an annualized basis Performance Metrics * Note: Excludes bargain purchase gains

Improving Asset Quality 18 Source: SNL Financial and Company filings, as of September 30, 2013 Regional peers include banks in NC, SC, and VA with total assets between $1.0bn and $4.0bn *Adjusted Texas Ratio: NPAs + Loans 90 days PD + OREO / Tangible Equity + LLR Note: All metrics exclude loans covered under loss share agreements and accruing TDRs Adjusted Texas Ratio (%)* NPAs / Total Assets (%) Reserves / NPLs (%) 0.00% 10.00% 20.00% 30.00% 40.00% 50.00% 60.00% 2010Y 2011Y 2012Y 2013Q3 BNCN Regional Peers 0.00% 1.00% 2.00% 3.00% 4.00% 5.00% 6.00% 7.00% 8.00% 2010Y 2011Y 2012Y 2013Q3 BNCN Regional Peers 0.00% 20.00% 40.00% 60.00% 80.00% 100.00% 120.00% 140.00% 2010Y 2011Y 2012Y 2013Q3 BNCN Regional Peers

Branch Network

20 Attractive Markets Largest Cities in NC BNC Market Largest Cities in SC BNC Market 1 Charlotte Yes 1 Columbia No 2 Raleigh Yes 2 Charleston Yes 3 Greensboro Yes 3 North Charleston No 4 Durham Yes 4 Mt. Pleasant Yes 5 Winston-Salem Yes 5 Greenville Yes 6 Fayetteville No 6 Rock Hill No 7 Cary Yes 7 Summerville No 8 Wilmington No 8 Spartanburg No 9 High Point Yes 9 Hilton Head Island Yes 10Jacksonville No 10Myrtle Beach Yes 11Asheville Yes 12Greenville No 13Gastonia No 14Concord Yes 15Chapel Hill Yes Located in 11 of the top 15 cities in North Carolina Located in 5 of the top 10 cities in South Carolina 12 Greenville Yes

Efficient Branch Network 21 Source: SNL Financial and Company filings, as of September 30, 2013 Top 10 banks determined by asset size as of September 30, 2013; deposit data as of September 30, 2013 *Excludes Bank of America , Wells Fargo, and BB&T Top 10 North Carolina Banks - Deposits per Branch ($mm)* $21 $25 $29 $34 $36 $38 $45 $45 $55 $62 0 10 20 30 40 50 60 70 Fidelity Southern BancShares First Bancorp CommunityOne Park Sterling NewBridge First Citizens Yadkin Valley HomeTrust BNC Bancorp

Recent Acquisitions

23 Recent Transactions Regent Blue Ridge KeySource Chapel Hill & Cary Branches First Trust Bank Carolina Federal Savings Bank Randolph Bank & Trust Headquarters: Greenville, SC Asheville, NC Durham, NC Cary, NC Chapel Hill, NC Charlotte, NC Charleston, SC Asheboro, NC Deal Type: Whole Bank FDIC Whole Bank Branch Whole Bank FDIC Whole Bank Announce Date: 9/8/2011 10/14/2011 12/21/2011 4/30/2012 06/4/2012 6/12/2012 4/29/13 Status: Completed Completed Completed Completed Completed Completed Completed System Conversion : Completed Completed Completed Completed Completed Completed 12/13/2013 Commentary: Closed 7 offices, relocated 1 Workout on schedule, Loans growing New City Exec in Cary Closed 3 offices, Opened 1 New City Exec Hired, New office planned Enhances operating leverage Deal Value ($mm): $9.8 FDIC $13.7 Branch $36.0 FDIC $19.2 Price / TBV (%): 124% FDIC 60% Branch 72% FDIC 62% Consideration: 100% Cash FDIC 100% Stock 100% Cash 70% Stock FDIC 80% Stock Bargain Purchase Gain ($mm): – $7.8 – – $5.7 $7.7 – Strategic Rationale: • Access to attractive Greenville, SC market • Solid core deposit base. Good deposit growth • Dramatically increased Triangle presence • Further expansion in Raleigh - Durham, NC • Dramatically increased Charlotte presence • Very attractive financial transaction • Expands Piedmont Triad and Triangle franchise Source: SNL Financial Note: Target financial data at announcement for whole bank transactions excludes purchase accounting. Total assets and deposi ts acquired for FDIC deals
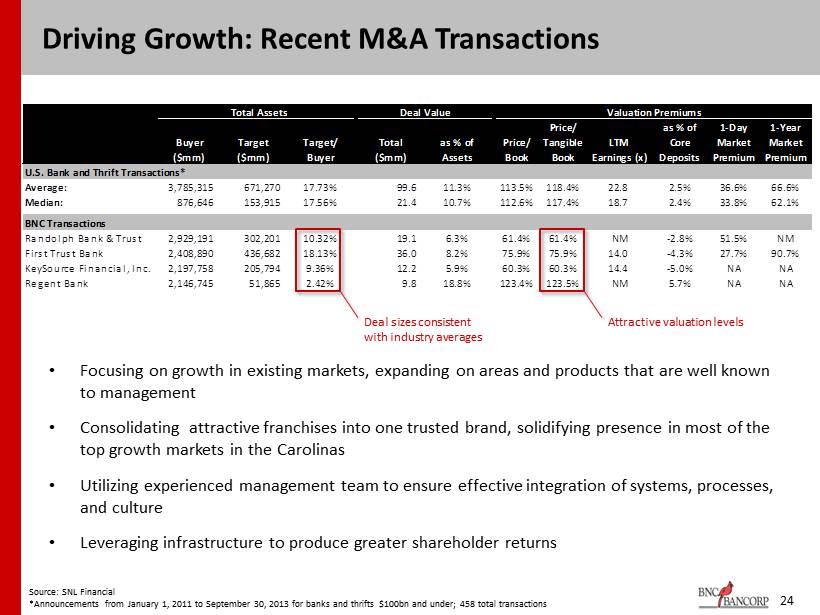
Total Assets Deal Value Valuation Premiums Price/ as % of 1-Day 1-Year Buyer Target Target/ Total as % of Price/ Tangible LTM Core Market Market ($mm) ($mm) Buyer ($mm) Assets Book Book Earnings (x) Deposits Premium Premium U.S. Bank and Thrift Transactions* Average: 3,785,315 671,270 17.73% 99.6 11.3% 113.5% 118.4% 22.8 2.5% 36.6% 66.6% Median: 876,646 153,915 17.56% 21.4 10.7% 112.6% 117.4% 18.7 2.4% 33.8% 62.1% BNC Transactions Randolph Bank & Trust 2,929,191 302,201 10.32% 19.1 6.3% 61.4% 61.4% NM -2.8% 51.5% NM First Trust Bank 2,408,890 436,682 18.13% 36.0 8.2% 75.9% 75.9% 14.0 -4.3% 27.7% 90.7% KeySource Financial, Inc. 2,197,758 205,794 9.36% 12.2 5.9% 60.3% 60.3% 14.4 -5.0% NA NA Regent Bank 2,146,745 51,865 2.42% 9.8 18.8% 123.4% 123.5% NM 5.7% NA NA 24 Source: SNL Financial *Announcements from January 1, 2011 to September 30, 2013 for banks and thrifts $100bn and under; 458 total transactions Driving Growth: Recent M&A Transactions Deal sizes consistent with industry averages Attractive valuation levels • Focusing on growth in existing markets, expanding on areas and products that are well known to management • Consolidating attractive franchises into one trusted brand, solidifying presence in most of the top growth markets in the Carolinas • Utilizing experienced management team to ensure effective integration of systems, processes, and culture • Leveraging infrastructure to produce greater shareholder returns

Recent Acquisition of Randolph Bank & Trust 25 • Aligns with current strategy of growth focused within existing markets • 6 branch locations in 3 new markets with total loans of $ 168 million and total deposits of $ 270 million • Pro Forma Company ― Total Assets : $ 3 . 2 billion ― Total Loans : $ 2 . 3 billion ― Total Deposits : $ 2 . 8 billion ― TCE/TA : 7 . 33 % ― Leverage Ratio : 9 . 05 % (Bank) ― Risk - Based Ratio : 13 . 59 % (Bank) • Immediately accretive to EPS and minimal dilution to tangible book value with estimated earn - back period of less than 1 year • Strong core deposits and diversified loan portfolio Map source: SNL Financial BNC Bancorp Randolph Bank & Trust

Financial Appendix

Securities Portfolio: Available for Sale Market Value Sector Current Face Eff Dur Flat +300bps $ Change % Change Agency CMOs 11,448 1.0 11,136 10,454 (682) -6.52% Agency Debt 6,003 7.3 5,658 4,291 (1,367) -31.85% Corporates 8,000 0.1 7,907 7,781 (126) -1.62% MBS 30,218 4.5 31,531 26,743 (4,788) -17.90% MBS ARMs 19,900 2.0 21,321 19,412 (1,909) -9.84% Sub-total 75,568 3.4 77,553 68,681 (8,872) -12.92% Municipals 174,510 3.5 184,189 158,514 (25,675) -16.20% TOTAL 250,078 3.7 261,742 227,195 (34,548) -15.21% Pay Fixed Swap: 1.686% maturing March 2019 Market Value Type Notional Eff Dur Flat +300bps % Change Pay-fixed Swap 125,000 4.4 1,301 15,234 12.19% TOTAL 125,000 4.4 1,301 15,234 12.19% 27 Dollars in thousands Source: Company internal reporting; as of October 31, 2013 Approximately $19.3mm of unhedged pre - tax economic value remains in AFS securities portfolio Current Market Value Exposure

28 Detailed Loan Composition Source: Company filings Note: Excludes loans held for sale – data agrees to Q3 2013 earnings release. Some slight reclassifications may take place in Se ptember 30 2013 10Q. 22% of outstanding loans have been acquired and are carried at fair value 10% of the portfolio is covered under an 80% loss - sharing agreement with the FDIC Acquired Covered Acquired Non-Covered Legacy Total Commercial - Secured by R/E 101,728$ 180,620$ 976,468$ 1,258,816$ Commercial Construction 20,251 18,344 174,862 213,457 Commercial and Industrial 6,755 10,107 138,284 155,146 Lease - - 16,061 16,061 Residential Construction 16 773 28,174 28,963 Residential mortgage 71,096 58,569 287,541 417,206 Loans to Individuals 1,953 595 7,845 10,393 201,799$ 269,008$ 1,629,235$ 2,100,042$ Total Loan Type

29 Diversified Non - Owner Occupied CRE Portfolio $110.9 $101.5 $78.5 $58.4 $58.1 $53.6 $48.3 $44.1 $30.3 $25.9 $21.6 $14.9 $14.1 $11.4 $9.5 $8.8 $6.9 $5.0 $4.0 $3.7 $2.5 $0.3 0.0 20.0 40.0 60.0 80.0 100.0 120.0 Office Professional Shopping Center - Anchored Shopping Center - Shadow Anchored Indv Retail Office - Medical Ofc/Warehouse <25% Mini-Storage Hotel - National Ofc/Warehouse > 25% Restaurants - National Inc. Producing Land Manufacturing Recreation - Entertain Restaurants - Ind. Hotel - Ind. Daycare Auto Repair & Care Auto Dealerships other RE - other Church-School-Govt 1 - 4 Family - Investment Average Size % of ($000) Total $270 0.0% $411 0.3% $244 0.5% $1,331 0.6% $830 0.7% $544 1.6% $765 1.0% $804 1.2% $340 1.3% $1,354 2.1% $454 2.0% $393 3.0% $1,036 3.6% $799 4.3% $2,768 8.2% $980 6.2% $611 6.8% $1,623 8.2% $565 7.5% $1,154 11.0% $3,625 14.2% $715 15.6% Non - Owner Occupied CRE Portfolio* Source: Company internal reporting as of October 31,2013 *Excludes covered and non - covered acquired loans

30 Loan Portfolio 21.7% 17.6% 15.0% 12.4% 42.8% 45.7% 50.9% 57.1% 1.2% 9.0% 7.6% 7.4% 23.9% 18.7% 18.2% 15.2% 10.5% 9.1% 8.2% 7.9% 0% 10% 20% 30% 40% 50% 60% 70% 80% 90% 100% 2009Y 2010Y 2011Y 2012Y Construction Commercial RE Consumer & Other Residential RE Commercial & Industrial Loan Composition as of June 30, 2013 Historical Loan Composition Source: SNL Financial and Company filings 11.3% 59.6% 6.3% 14.3% 8.5% Construction Commercial RE Consumer & Other Residential RE Commercial & Industrial
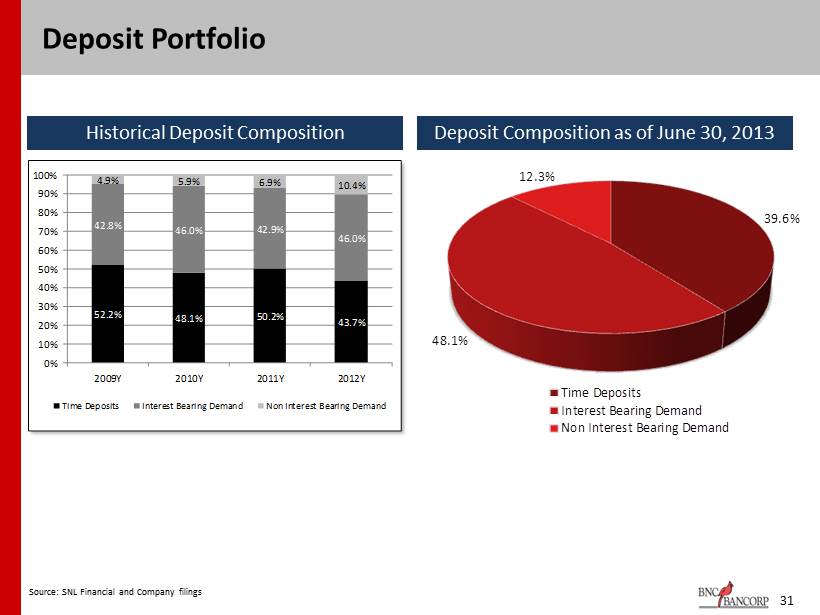
31 Deposit Portfolio 52.2% 48.1% 50.2% 43.7% 42.8% 46.0% 42.9% 46.0% 4.9% 5.9% 6.9% 10.4% 0% 10% 20% 30% 40% 50% 60% 70% 80% 90% 100% 2009Y 2010Y 2011Y 2012Y Time Deposits Interest Bearing Demand Non Interest Bearing Demand Deposit Composition as of June 30, 2013 Historical Deposit Composition Source: SNL Financial and Company filings 39.6% 48.1% 12.3% Time Deposits Interest Bearing Demand Non Interest Bearing Demand

32 Securities Portfolio Securities Composition as of June 30, 2013 Historical Securities Composition Source: SNL Financial and Company filings 6.2% 3.6% 52.4% 62.9% 66.7% 73.0% 8.0% 6.9% 4.4% 3.2% 37.8% 28.4% 21.0% 19.0% 1.7% 1.7% 1.7% 1.4% 0% 10% 20% 30% 40% 50% 60% 70% 80% 90% 100% 2009Y 2010Y 2011Y 2012Y Agency Debt Municipals CMOs Corporates MBS 3.3% 79.0% 1.8% 3.0% 10.7% 2.1% Agency Debt Municipals CMOs Corporates MBS CLOs

33 This presentation contains forward - looking statements relating to the financial condition, results of operations and business of BNC Bancorp and its subsidiary Bank of North Carolina . These forward - looking statements involve risks and uncertainties and are based on the beliefs and assumptions of the management of BNC Bancorp, and the information available to management at the time that this presentation was prepared . Factors that could cause actual results to differ materially from those contemplated by such forward - looking statements include, among others, the following : ( i ) general economic or business conditions, either nationally or regionally, may be less favorable than expected, resulting in, among other things, a deterioration in credit quality and/or a reduced demand for credit or other services ; (ii) changes in the interest rate environment may reduce net interest margins and/or the volumes and values of loans made or held as well as the value of other financial assets held ; (iii) competitive pressures among depository and other financial institutions may increase significantly ; (iv) legislative or regulatory changes, including changes in accounting standards, may adversely affect the businesses in which BNC Bancorp is engaged ; (v) local, state or federal taxing authorities may take tax positions that are adverse to BNC Bancorp ; (vi) adverse changes may occur in the securities markets ; (vii) competitors of BNC Bancorp may have greater financial resources and develop products that enable them to compete more successfully than BNC Bancorp ; (viii) costs or difficulties related to the integration of Beach First National Bank, Regent Bank of SC, Blue Ridge Savings Bank, KeySource Financial, Carolina Federal Savings Bank, First Trust Bank, or Randolph Bank & Trust may be greater than expected ; (ix) expected cost savings associated with our acquisition of these seven banks may not be fully realized or realized within the expected time frame ; and (x) deposit attrition, customer loss or revenue loss following our acquisitions of Beach First, Regent, Blue Ridge, Carolina Federal, KeySource , First Trust, or Randolph Bank & Trust may be greater than expected . Additional factors affecting BNC Bancorp and Bank of North Carolina are discussed in BNC Bancorp’s filings with the Securities and Exchange Commission (the “SEC”), Annual Report on Form 10 - K, its Quarterly Reports on Form 10 - Q and its Current Reports on Form 8 - K . Please refer to the Securities and Exchange Commission’s website at www . sec . gov where you can review those documents . BNC Bancorp does not undertake a duty to update any forward - looking statements made during this presentation . Forward Looking Statements
