Attached files
| file | filename |
|---|---|
| 8-K - 8-K - AMERICAN APPAREL, INC | aai8-ker_2013q3xmaster.htm |
Exhibit 99.1
AMERICAN APPAREL, INC. REPORTS THIRD QUARTER 2013 FINANCIAL RESULTS
LOS ANGELES, November 14, 2013 - American Apparel, Inc. (NYSE MKT: APP), a vertically integrated manufacturer, distributor, and retailer of branded fashion-basic apparel, announced financial results for its third quarter ended September 30, 2013.
Financial Performance Summary for the Three and Nine Months Ended September 2013
• | For the three months ended September 30, 2013, net sales increased 1% to $164.5 million on a 2% increase in comparable store sales and a 2% increase in wholesale net sales. |
• | For the three months ended September 30, 2013, adjusted EBITDA was $3.8 million vs. $13.3 million in the 2012 third quarter. |
• | For the nine months ended September 30, 2013, net sales increased 5% to $464.8 million on a 5% increase in comparable store sales and 6% increase in wholesale net sales. |
• | For the nine months ended September 30, 2013, adjusted EBITDA was $11.0 million vs. $18.8 million in the nine months ended September 30, 2012. |
• | A substantial majority of the decrease in adjusted EBITDA for each period was a result of transition and start-up costs associated with the conversion to the company’s new distribution center (see Company Outlook and EBITDA Guidance Reconciliation below). |
According to John Luttrell, Chief Financial Officer of American Apparel, Inc.,“Our lower EBITDA performance was substantially impacted by events surrounding the transition to and opening of our new distribution center. However, we believe that these issues are now substantially behind us, and although there will be some remaining transition costs in the fourth quarter of 2013, we do not anticipate that these transition and start-up costs will negatively affect our financial performance in 2014.
Sales momentum for the quarter was positive despite weak U.S. apparel sector demand. Our sales were also impacted by the distraction from the distribution center transition and by late product deliveries. This contributed to a substantial increase in out of stock positions for some of our most popular styles. We also believe we missed sales opportunities by not carrying enough inventory of top selling items to meet both retail and wholesale demand."
According to Dov Charney, Chairman and CEO of American Apparel, Inc.,"No question we had a rough 3rd quarter, although I think it is important to emphasize that most of the challenges we have faced were primarily technically oriented and we believe these challenges are substantially behind us. That being said, I am confident in three things: our brand is strong, our customer is energized, and our product line is being well received. I believe American Apparel is a company that can grow significantly.
There are great opportunities for online growth, and there is a resurgence of interest in Made in USA clothing especially within the wholesale ad-specialty industry. Private label orders are also up significantly and we anticipate a lot of growth in that area. An example of the Made in USA demand includes an order we recently received for over 500,000 units that will be sold as printed items at a major retailer. We are currently hiring over 300 sewing employees to meet demand I anticipate in 2014. It is also noteworthy that our unit inventories are at their lowest levels in three years.
There are requests for us to open stores all over the world in major cities like Hong Kong, Taipei, Copenhagen and Madrid. I am looking forward to working with our team to produce strong results for shareholders in 2014. The company is uniquely positioned and has a competitive advantage as a result of its Made in USA manufacturing, distribution, and retail infrastructure which has been developed over the last 10 years. I believe that these factors present a unique opportunity for growth.”
Supply Chain Update
Jim Sweeney joined the company in October as Distribution Director. Mr. Sweeney brings decades of distribution experience and in the past was Distribution Director at such apparel companies as the TJX Companies, Inc., Fifth & Pacific Companies, Inc. (formerly Liz Claiborne, Inc.), and Caldor, Inc. Most recently, Mr. Sweeney was with SDI, a material handling integrator that provides sortation and automation solutions for distribution activities.
According to Mr. Sweeney, “I am excited about the new distribution center and its potential to meet the future growth requirements of American Apparel’s businesses. We have made significant recent progress in completing the installation. Specifically:
• | Transition activities have been substantially completed. |
• | As illustrated in Graph 1 below, distribution delays caused out of stock positions at both stores and wholesale inventories that negatively impacted sales in the months of September and October. We have corrected these issues and recently our out of stock position has returned to historical levels. |
• | We were able to “pressure test” the system through the Halloween selling season and the systems performed well. |
• | As of November 1, we have begun to significantly reduce the distribution labor costs we incurred to help address center transition issues.” |
Graph1: Units Out of Stock Index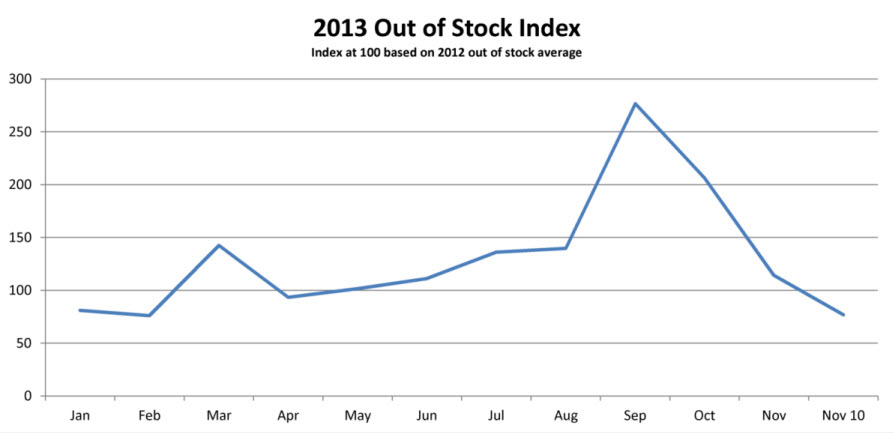
For the three months and nine months ended September 30, 2013, the company incurred incremental distribution costs (primarily labor costs) associated with transition activities and recorded additional cost of sales and selling expenses in its statement of operations for the periods indicated below ($ in millions):
2013 | ||||
Third Quarter | Year-to-Date | |||
Cost of sales | $1.2 | $2.2 | ||
Selling expenses | 4.7 | 8.7 | ||
Total | $5.9 | $10.9 | ||
Beginning on November 1, 2013, we began to implement labor cost reductions for our distribution activities. We have targeted additional reductions in the remainder of the fourth quarter. However, if there are any further transition issues associated with the new distribution center, sales could continue to be negatively impacted, we could incur additional conversion costs and there could be delays in achieving planned cost reductions, all of which could negatively impact our operating performance, financial condition and liquidity.
Explanation of Significant Non Operating Items
Lion Capital holds 21.6 million warrants at $0.75 per share and as our share price increases the warrants become more valuable and we book an expense to recognize the increase in value of warrants. Conversely, when our share price decreases, we book a gain to recognize a decrease in the value of warrants. Therefore, as our share price decreased during the third quarter of 2013, we booked a non-cash gain of $12.9 million as a result of a mark-to-market adjustment to our warrants. Conversely, the relative increase in our share price during the third quarter of 2012, resulted in a non-cash loss of $13.3 million as a result of the same mark-to-market adjustment to our warrants. Although the income statement impacts associated with the warrants are appropriate and required under GAAP, they do not impact the operating performance of the company. Also, they do not represent obligations that will be settled with cash. Instead, these warrants will be reclassified to equity when exercised.
Operating Results - Third Quarter 2013
Comparing the third quarter 2013 to the corresponding period last year, net sales increased 1% to $164.5 million on a 2% increase in comparable store sales in the retail and online business and a 2% increase in net sales in the wholesale business. The following delineates the components of the increases for the quarterly periods ended September 30, 2013 and 2012 as compared to the corresponding quarter of the prior year:
2013 Third Quarter | 2012 Third Quarter (1) | |
Comparable Store Sales | —% | 20% |
Comparable Online Sales | 17% | 21% |
Comparable Retail & Online | 2% | 20% |
Wholesale Net Sales | 2% | 6% |
Total Net Sales | 1% | 15% |
(1) Comparable store sales have been adjusted to exclude impact of extra leap-year day in 2012.
Gross profit of $84.6 million for the third quarter 2013 represented a decrease of 1% from $85.2 million reported for the third quarter 2012. Gross margin decreased from 52.5% for the quarter ended September 30, 2012 to 51.4% for the quarter ended September 2013. The decrease in the gross margin was primarily due to higher distribution costs associated with transition to our new center.
Operating expenses of $89.1 million for the third quarter 2013 represented an increase of 11% from $80.6 million for the third quarter 2012. As a percent of revenue, operating expenses increased from 49.7% for the quarter ended September 2012 to 54.2% for the quarter ended September 2013. The increase in operating expenses was due to higher salaries, wages and benefits primarily as a result of
the transition to our new distribution center in La Mirada, California. We also experienced in the third quarter of 2013, and expect to continue to incur, higher computer and leased equipment expenses.
Adjusted EBITDA in the third quarter of 2013 decreased to $3.8 million from $13.3 million in the third quarter of 2012. For a reconciliation of consolidated Adjusted EBITDA, a non-GAAP financial measure, to consolidated net income or loss, as applicable, please refer to Table A.
Other income for the third quarter 2013 was $3.2 million as compared with other expense of $23.1 million in the prior year quarter. The $26.3 million change in non-operating expenses was primarily the result of a an unrealized gain on the change in fair value of our warrants of $12.9 million for the quarter ended September 2013 as compared with an unrealized loss of $13.3 million in the prior year quarter. For further explanation, please see Explanation of Significant Non Operating Items above.
Income tax provision in the third quarter 2013 was $0.2 million versus $0.5 million in the 2012 third quarter. In accordance with U.S. GAAP, we have discontinued recognizing potential tax benefits associated with current operating losses.
Net loss for the third quarter of 2013 was $1.5 million, or $0.01 per common share, compared to net loss for the third quarter of 2012 of $19.0 million, or $0.18 per common share. The 2013 third quarter includes a non-cash/non-operating gain of $12.9 million ($0.12 per common share) associated with a decrease in the fair value of outstanding warrants. The 2012 third quarter includes a non-cash/non-operating charge of $13.3 million ($0.13 per common share) for the increase in the fair value of warrants. Excluding the non-cash and non-operating items from both periods, the net loss for the third quarter 2013 would have been $14.4 million, or $0.13 per share, compared to $5.7 million, or $0.05 per share, in the third quarter 2012.
Fully-diluted weighted average shares outstanding were 110.4 million in the third quarter of 2013 versus 106.2 million for the third quarter of 2012. As of November 8, 2013 there were approximately 110.4 million shares outstanding.
Due to the decrease in our adjusted EBITDA in the third quarter of 2013, we have received a waiver of our obligation under our credit facility with Capital One to maintain a minimum fixed charge coverage ratio and a maximum leverage ratio for the twelve-month period ending September 30, 2013, and we are in discussions with respect to a waiver or amendment for future periods. Further information with respect to the foregoing will be included in our Quarterly Report on Form 10-Q for the quarter ended September 30, 2013.
Company Outlook and EBITDA Guidance Reconciliation
In connection with the second quarter earnings release, the company issued adjusted EBITDA guidance for 2013 in the range from $46 million to $51 million and this implied adjusted EBITDA guidance for the first nine months of 2013 at the mid-point of approximately $24 million. The following reconciles the variance between the implied adjusted EBITDA guidance for the first nine months of 2013 and the actual results ($ in millions):
Adjusted EBITDA guidance | $ | 24.0 | |||
Gross Profit impact of reduced sales | (5.8 | ) | * | ||
Gross Profit impact of higher distribution expenses | (2.6 | ) | * | ||
Gross Profit impact of mix shift | (0.5 | ) | |||
Higher distribution expenses | (3.3 | ) | * | ||
Other | (0.8 | ) | |||
Consolidated Adjusted EBITDA | $ | 11.0 | |||
* Affected by the distribution center transition
As noted above, we believe the transition to our new distribution center has negatively impacted adjusted EBITDA through a combination of lower sales and gross profit as well as higher distribution and operating
expenses. Most of the transition and start-up issues have been addressed and the new distribution facility is presently shipping deliveries on time. We also are experiencing reductions in the distribution labor costs we incurred to help address distribution center transition issues, and we have targeted additional reductions throughout the remainder of the fourth quarter. Additionally, we have increased production of our top-selling styles in the fourth quarter to meet customer demand. However, we are unable to predict with certainty the timing and magnitude of the remaining cost reductions at our distribution center or of production increases to meet customer demand. We are therefore unable to provide updated guidance for the fourth quarter and full year 2013 at this time and note that prior guidance should no longer be relied upon.
We do not anticipate that the transition and start-up costs associated with the conversion of our new distribution center will negatively affect financial performance in 2014, and will look to provide a full year 2014 outlook in our fourth quarter and full year 2013 financial results press release.
For a reconciliation of adjusted EBITDA to net loss, please refer to Table A.
About American Apparel
American Apparel is a vertically integrated manufacturer, distributor, and retailer of branded fashion basic apparel based in downtown Los Angeles, California. As of November 1, 2013, American Apparel had approximately 10,000 employees and operated 246 retail stores in 20 countries, including the United States, Canada, Mexico, Brazil, United Kingdom, Ireland, Austria, Belgium, France, Germany, Italy, Netherlands, Spain, Sweden, Switzerland, Australia, Japan, South Korea, and China. American Apparel also operates a global e-commerce site that serves over 60 countries worldwide at http://www.americanapparel.net. In addition, American Apparel operates a leading wholesale business that supplies high quality T-shirts and other casual wear to distributors and screen printers.
Safe Harbor Statement
This press release, and other statements that the Company may make, may contain forward-looking statements. Forward-looking statements are statements that are not historical facts and include statements regarding, among other things, the Company's future financial condition and liquidity (including the impact on our compliance with, and availability under, our debt instruments and waivers or amendments of those instruments), results of operations, and future business plans and expectations, including statements related to the effect of, and our expectations with respect to, the transition to our new distribution center and future cost, inventory and sales impacts related thereto. Such forward-looking statements are based upon the current beliefs and expectations of American Apparel's management, but are subject to risks and uncertainties, which could cause actual results and/or the timing of events to differ materially from those set forth in the forward-looking statements, including, among others: our ability to generate or obtain from external sources sufficient liquidity for operations and debt service; our financial condition, operating results and projected cash flows; consequences of our significant indebtedness, including our relationship with our lenders and our ability to comply with our debt agreements and generate cash flow to service our debt; including the risk of acceleration of borrowings thereunder as a result of noncompliance; disruptions in the global financial markets; our ability to maintain compliance with the exchange rules of the NYSE MKT, LLC; adverse changes in our credit ratings and any related impact on financial costs and structure; continued compliance with U.S. and foreign government regulations, legislation, and regulatory environments, including environmental, immigration, labor, and occupational health and safety laws and regulations; loss of U.S. import protections or changes in duties, tariffs and quotas, and other risks associated with international business including disruption of markets and foreign supply sources and changes in import and export laws; risks associated with our foreign operations and foreign supply sources, such as disruption of markets, changes in import and export laws, currency restrictions, and currency exchange rate fluctuations; the highly competitive and evolving nature of our business in the U.S. and internationally; changes in the level of consumer spending or preferences or demand for our products; our ability to pass on the added cost of raw materials to customers; our ability to attract customers to our stores; the availability of store locations at appropriate terms and our ability to identify locations and negotiate new store leases effectively and to open new stores and expand internationally; our ability to renew leases at existing locations on economic terms; loss or reduction in sales to our wholesale or retail customers or financial nonperformance by our wholesale customers; risks that our suppliers or distributors may not timely produce or deliver our products; changes in the cost of materials and labor, including increases in the price of raw materials in the global market; our ability to effectively carry out and manage our strategy, including growth and expansion both in the U.S. and internationally; technological changes in manufacturing, wholesaling, or retailing; our ability to successfully implement our strategic, operating, financial and personnel initiatives; changes in key personnel, our
ability to hire and retain key personnel, and our relationship with our employees; our ability to maintain the value and image of our brand and protect our intellectual property rights; our ability to improve manufacturing efficiency at our production facilities; our ability to complete the transition to our distribution facility located in La Mirada, California without further unanticipated costs, negative sales impact or other transition issues, including the ability to achieve, as and when planned, labor cost reductions; the risk, including costs and timely delivery issues associated therewith, that information technology systems changes may disrupt our supply chain or operations and could impact our cash flow and liquidity, and our ability to upgrade our information technology infrastructure and other risks associated with the systems that operate our online retail operations; our ability to effectively manage inventory levels; litigation and other inquiries and investigations, including the risks that we, or our officers in cases where indemnification applies, will not be successful in defending any proceedings, lawsuits, disputes, claims or audits, and that exposure could exceed expectations or insurance coverages; the adoption of new accounting standards or changes in interpretations of accounting principles; seasonality and fluctuations in comparable store sales and margins; location of our facilities in the same geographic area; general economic conditions, including increases in interest rates, geopolitical events, other regulatory changes and inflation or deflation; disruptions due to severe weather or climate change; disruptions due to earthquakes, flooding, tsunamis or other natural disasters; and other risks detailed in the Company's filings with the Securities and Exchange Commission, including the Company's Annual Report on Form 10-K for the year ended December 31, 2012 and Form 10-Q for the quarter ended June 30, 2013, as well as, when filed, the Company’s Form 10-Q for the quarter ended September 30, 2013. The Company's filings with the SEC are available at www.sec.gov. You are urged to consider these factors carefully in evaluating the forward-looking statements herein and are cautioned not to place undue reliance on such forward-looking statements, which are qualified in their entirety by this cautionary statement. The forward-looking statements speak only as of the date on which they are made and the Company undertakes no obligation to publicly update such forward-looking statements to reflect subsequent events or circumstances.
Contact:
American Apparel, Inc.
John J. Luttrell
Chief Financial Officer
(213) 488-0226
or
ICR, Inc.
John Rouleau
Managing Director
(203) 682-8342
John.Rouleau@icrinc.com
AMERICAN APPAREL, INC. AND SUBSIDIARIES
CONDENSED CONSOLIDATED STATEMENTS OF OPERATIONS
(Amounts and shares in thousands, except per share amounts)
(unaudited)
Three Months Ended September 30, | Nine Months Ended September 30, | |||||||||||||||
2013 | 2012 | 2013 | 2012 | |||||||||||||
Net sales | $ | 164,543 | $ | 162,160 | $ | 464,839 | $ | 444,282 | ||||||||
Cost of sales | 79,903 | 76,960 | 223,461 | 209,990 | ||||||||||||
Gross profit | 84,640 | 85,200 | 241,378 | 234,292 | ||||||||||||
Operating expenses | 89,133 | 80,583 | 258,262 | 240,179 | ||||||||||||
(Loss) income from operations | (4,493 | ) | 4,617 | (16,884 | ) | (5,887 | ) | |||||||||
Interest expense | 10,121 | 10,454 | 29,555 | 30,274 | ||||||||||||
Foreign currency transaction (gain) loss | (449 | ) | (685 | ) | 422 | 141 | ||||||||||
Unrealized (gain) loss on change | ||||||||||||||||
in fair value of warrants | (12,922 | ) | 13,312 | 5,225 | 15,340 | |||||||||||
Loss (gain) on extinguishment of debt | — | — | 32,101 | (11,588 | ) | |||||||||||
Other expense | 58 | 36 | 42 | 188 | ||||||||||||
Loss before income taxes | (1,301 | ) | (18,500 | ) | (84,229 | ) | (40,242 | ) | ||||||||
Income tax provision | 212 | 512 | 1,299 | 1,933 | ||||||||||||
Net Loss | $ | (1,513 | ) | $ | (19,012 | ) | $ | (85,528 | ) | $ | (42,175 | ) | ||||
Loss per share, basic and diluted | $ | (0.01 | ) | $ | (0.18 | ) | $ | (0.78 | ) | $ | (0.40 | ) | ||||
Weighted average shares outstanding, basic and diluted | 110,354 | 106,248 | 110,172 | 105,960 | ||||||||||||
AMERICAN APPAREL, INC. AND SUBSIDIARIES
CONDENSED CONSOLIDATED BALANCE SHEETS
(Amounts in thousands)
(unaudited)
September 30, 2013 | December 31, 2012 | ||||||
ASSETS | |||||||
CURRENT ASSETS | |||||||
Cash | $ | 4,913 | $ | 12,853 | |||
Trade accounts receivable, net of allowances | 23,053 | 22,962 | |||||
Restricted cash | — | 3,733 | |||||
Prepaid expenses and other current assets | 12,712 | 9,589 | |||||
Inventories, net | 170,723 | 174,229 | |||||
Income taxes receivable and prepaid income taxes | 1,018 | 530 | |||||
Deferred income taxes, net of valuation allowance | 419 | 494 | |||||
Total current assets | 212,838 | 224,390 | |||||
PROPERTY AND EQUIPMENT, net | 71,515 | 67,778 | |||||
DEFERRED INCOME TAXES, net of valuation allowance | 1,229 | 1,261 | |||||
OTHER ASSETS, net | 47,351 | 34,783 | |||||
TOTAL ASSETS | $ | 332,933 | $ | 328,212 | |||
LIABILITIES AND STOCKHOLDERS' (DEFICIT) EQUITY | |||||||
CURRENT LIABILITIES | |||||||
Cash overdraft | $ | 2,812 | $ | — | |||
Revolving credit facilities and current portion of long-term debt | 33,014 | 60,556 | |||||
Accounts payable | 31,547 | 38,160 | |||||
Accrued expenses and other current liabilities | 51,925 | 41,516 | |||||
Fair value of warrant liability | 22,466 | 17,241 | |||||
Income taxes payable | 1,753 | 2,137 | |||||
Deferred income tax liability, current | 245 | 296 | |||||
Current portion of capital lease obligations | 1,692 | 1,703 | |||||
Total current liabilities | 145,454 | 161,609 | |||||
LONG-TERM DEBT, net of unamortized discount | 207,237 | 110,012 | |||||
CAPITAL LEASE OBLIGATIONS, net of current portion | 4,991 | 2,844 | |||||
DEFERRED TAX LIABILITY | 261 | 262 | |||||
DEFERRED RENT, net of current portion | 18,936 | 20,706 | |||||
OTHER LONG-TERM LIABILITIES | 12,245 | 10,695 | |||||
TOTAL LIABILITIES | 389,124 | 306,128 | |||||
STOCKHOLDERS' (DEFICIT) EQUITY | |||||||
Common stock | 11 | 11 | |||||
Additional paid-in capital | 185,119 | 177,081 | |||||
Accumulated other comprehensive loss | (3,510 | ) | (2,725 | ) | |||
Accumulated deficit | (235,654 | ) | (150,126 | ) | |||
Less: Treasury stock | (2,157 | ) | (2,157 | ) | |||
TOTAL STOCKHOLDERS' (DEFICIT) EQUITY | (56,191 | ) | 22,084 | ||||
TOTAL LIABILITIES AND STOCKHOLDERS' (DEFICIT) EQUITY | $ | 332,933 | $ | 328,212 | |||
AMERICAN APPAREL, INC. AND SUBSIDIARIES
CONDENSED CONSOLIDATED STATEMENTS OF CASH FLOWS
(Amounts in thousands)
(unaudited)
Nine Months Ended September 30, | |||||||
2013 | 2012 | ||||||
CASH FLOWS FROM OPERATING ACTIVITIES | |||||||
Cash received from customers | $ | 465,468 | $ | 439,634 | |||
Cash paid to suppliers, employees and others | (468,632 | ) | (431,915 | ) | |||
Income taxes (paid) refunded | (2,082 | ) | 646 | ||||
Interest paid | (5,726 | ) | (6,635 | ) | |||
Other | 35 | (160 | ) | ||||
Net cash (used in) provided by operating activities | (10,937 | ) | 1,570 | ||||
CASH FLOWS FROM INVESTING ACTIVITIES | |||||||
Capital expenditures | (18,907 | ) | (14,257 | ) | |||
Proceeds from sale of fixed assets | 30 | 70 | |||||
Restricted cash | 1,594 | (5,926 | ) | ||||
Net cash used in investing activities | (17,283 | ) | (20,113 | ) | |||
CASH FLOWS FROM FINANCING ACTIVITIES | |||||||
Cash overdraft | 2,812 | 704 | |||||
Repayments of expired revolving credit facilities, net | (28,513 | ) | (48,324 | ) | |||
Borrowings under current revolving credit facilities, net | 28,713 | 39,337 | |||||
(Repayments) borrowings of term loans and notes payable | (25,463 | ) | 30,042 | ||||
Repayment of Lion term loan | (144,149 | ) | — | ||||
Issuance of Senior Secured Notes | 199,820 | — | |||||
Payments of debt issuance costs | (11,880 | ) | (4,965 | ) | |||
Repayments of capital lease obligations | (773 | ) | (810 | ) | |||
Net cash provided by financing activities | 20,567 | 15,984 | |||||
EFFECT OF FOREIGN EXCHANGE RATE ON CASH | (287 | ) | (548 | ) | |||
NET DECREASE IN CASH | (7,940 | ) | (3,107 | ) | |||
CASH, beginning of period | 12,853 | 10,293 | |||||
CASH, end of period | $ | 4,913 | $ | 7,186 | |||
AMERICAN APPAREL, INC. AND SUBSIDIARIES
CONDENSED CONSOLIDATED STATEMENTS OF CASH FLOWS (continued)
(Amounts in thousands)
(unaudited)
Nine Months Ended September 30, | |||||||
2013 | 2012 | ||||||
RECONCILIATION OF NET LOSS TO NET CASH (USED IN) PROVIDED BY OPERATING ACTIVITIES | |||||||
Net loss | $ | (85,528 | ) | $ | (42,175 | ) | |
Depreciation and amortization of property and equipment, and other assets | 19,155 | 17,040 | |||||
Retail store impairment | 311 | 129 | |||||
Loss on disposal of property and equipment | 77 | 28 | |||||
Share-based compensation expense | 8,044 | 7,333 | |||||
Unrealized loss on change in fair value of warrants | 5,225 | 15,340 | |||||
Amortization of debt discount and deferred financing costs | 3,717 | 7,655 | |||||
Loss (gain) on extinguishment of debt | 32,101 | (11,588 | ) | ||||
Accrued interest paid-in-kind | 6,875 | 15,984 | |||||
Foreign currency transaction loss | 422 | 141 | |||||
Allowance for inventory shrinkage and obsolescence | 964 | (339 | ) | ||||
Bad debt expense | 380 | 73 | |||||
Deferred income taxes | (26 | ) | 32 | ||||
Deferred rent | (1,667 | ) | (649 | ) | |||
Changes in cash due to changes in operating assets and liabilities: | |||||||
Trade accounts receivables | 249 | (4,721 | ) | ||||
Inventories | 1,741 | 6,238 | |||||
Prepaid expenses and other current assets | (4,026 | ) | (3,343 | ) | |||
Other assets | (4,274 | ) | (5,756 | ) | |||
Accounts payable | (8,133 | ) | 2,471 | ||||
Accrued expenses and other liabilities | 14,261 | (4,750 | ) | ||||
Income taxes receivable/payable | (805 | ) | 2,427 | ||||
Net cash (used in) provided by operating activities | $ | (10,937 | ) | $ | 1,570 | ||
AMERICAN APPAREL, INC. AND SUBSIDIARIES
BUSINESS SEGMENT INFORMATION
(Amounts in thousands)
(unaudited)
The following table presents key financial information for American Apparel's business segments before unallocated corporate expenses:
Three Months Ended September 30, 2013 | |||||||||||||||||||
U.S. Wholesale | U.S. Retail | Canada | International | Consolidated | |||||||||||||||
Net sales to external customers | $ | 50,225 | $ | 54,303 | $ | 15,033 | $ | 44,982 | $ | 164,543 | |||||||||
Gross profit | 13,407 | 34,755 | 8,477 | 28,001 | 84,640 | ||||||||||||||
Income (loss) from segment operations | 1,441 | (317 | ) | 1,091 | 2,953 | 5,168 | |||||||||||||
Depreciation and amortization | 1,934 | 3,172 | 507 | 1,125 | 6,738 | ||||||||||||||
Capital expenditures | 1,360 | 2,387 | 540 | 983 | 5,270 | ||||||||||||||
Retail store impairment | — | — | 145 | 88 | 233 | ||||||||||||||
Deferred rent expense (benefit) | 5 | (338 | ) | (66 | ) | (148 | ) | (547 | ) | ||||||||||
Three Months Ended September 30, 2012 | |||||||||||||||||||
U.S. Wholesale | U.S. Retail | Canada | International | Consolidated | |||||||||||||||
Net sales to external customers | $ | 46,847 | $ | 52,714 | $ | 16,717 | $ | 45,882 | $ | 162,160 | |||||||||
Gross profit | 12,873 | 34,361 | 10,166 | 27,800 | 85,200 | ||||||||||||||
Income from segment operations | 5,811 | 3,116 | 721 | 4,192 | 13,840 | ||||||||||||||
Depreciation and amortization | 1,446 | 2,747 | 394 | 951 | 5,538 | ||||||||||||||
Capital expenditures | 3,300 | 2,136 | 328 | 894 | 6,658 | ||||||||||||||
Deferred rent expense (benefit) | 297 | (349 | ) | (58 | ) | (122 | ) | (232 | ) | ||||||||||
Nine Months Ended September 30, 2013 | |||||||||||||||||||
U.S. Wholesale | U.S. Retail | Canada | International | Consolidated | |||||||||||||||
Net sales to external customers | $ | 146,028 | $ | 149,811 | $ | 42,842 | $ | 126,158 | $ | 464,839 | |||||||||
Gross profit | 39,421 | 97,248 | 25,244 | 79,465 | 241,378 | ||||||||||||||
Income (loss) from segment operations | 12,156 | (2,239 | ) | 1,592 | 7,022 | 18,531 | |||||||||||||
Depreciation and amortization | 5,327 | 9,231 | 1,388 | 3,209 | 19,155 | ||||||||||||||
Capital expenditures | 5,847 | 9,377 | 970 | 2,713 | 18,907 | ||||||||||||||
Retail store impairment | — | 78 | 145 | 88 | 311 | ||||||||||||||
Deferred rent expense (benefit) | 43 | (1,114 | ) | (279 | ) | (317 | ) | (1,667 | ) | ||||||||||
Nine Months Ended September 30, 2012 | |||||||||||||||||||
U.S. Wholesale | U.S. Retail | Canada | International | Consolidated | |||||||||||||||
Net sales to external customers | $ | 131,612 | $ | 143,444 | $ | 45,096 | $ | 124,130 | $ | 444,282 | |||||||||
Gross profit | 36,582 | 93,977 | 26,627 | 77,106 | 234,292 | ||||||||||||||
Income (loss) from segment operations | 18,324 | 449 | (1,888 | ) | 8,339 | 25,224 | |||||||||||||
Depreciation and amortization | 4,795 | 8,074 | 1,107 | 3,064 | 17,040 | ||||||||||||||
Capital expenditures | 6,502 | 3,990 | 1,144 | 2,621 | 14,257 | ||||||||||||||
Retail store impairment | — | — | 129 | — | 129 | ||||||||||||||
Deferred rent expense (benefit) | 393 | (509 | ) | (156 | ) | (377 | ) | (649 | ) | ||||||||||
AMERICAN APPAREL, INC. AND SUBSIDIARIES
BUSINESS SEGMENT INFORMATION (continued)
(Amounts in thousands)
(unaudited)
Three Months Ended September 30, | Nine Months Ended September 30, | ||||||||||||||
Reconciliation to Loss before Income Taxes | 2013 | 2012 | 2013 | 2012 | |||||||||||
Income from segment operations | $ | 5,168 | $ | 13,840 | $ | 18,531 | $ | 25,224 | |||||||
Unallocated corporate expenses | (9,661 | ) | (9,223 | ) | (35,415 | ) | (31,111 | ) | |||||||
Interest expense | (10,121 | ) | (10,454 | ) | (29,555 | ) | (30,274 | ) | |||||||
Foreign currency transaction gain (loss) | 449 | 685 | (422 | ) | (141 | ) | |||||||||
Unrealized gain (loss) on change in fair value of warrants | 12,922 | (13,312 | ) | (5,225 | ) | (15,340 | ) | ||||||||
(Loss) gain on extinguishment of debt | — | — | (32,101 | ) | 11,588 | ||||||||||
Other expense | (58 | ) | (36 | ) | (42 | ) | (188 | ) | |||||||
Consolidated loss before income taxes | $ | (1,301 | ) | $ | (18,500 | ) | $ | (84,229 | ) | $ | (40,242 | ) | |||
Three Months Ended September 30, | Nine Months Ended September 30, | ||||||||||||||
Net sales to external customers | 2013 | 2012 | 2013 | 2012 | |||||||||||
U.S. Wholesale | |||||||||||||||
Wholesale | $ | 41,232 | $ | 39,862 | $ | 119,159 | $ | 110,380 | |||||||
Online consumer | 8,993 | 6,985 | 26,869 | 21,232 | |||||||||||
Total | $ | 50,225 | $ | 46,847 | $ | 146,028 | $ | 131,612 | |||||||
U.S. Retail | $ | 54,303 | $ | 52,714 | $ | 149,811 | $ | 143,444 | |||||||
Canada | |||||||||||||||
Wholesale | $ | 3,044 | $ | 3,215 | $ | 9,236 | $ | 9,449 | |||||||
Retail | 11,321 | 13,086 | 31,664 | 34,181 | |||||||||||
Online consumer | 668 | 416 | 1,942 | 1,466 | |||||||||||
Total | $ | 15,033 | $ | 16,717 | $ | 42,842 | $ | 45,096 | |||||||
International | |||||||||||||||
Wholesale | $ | 1,725 | $ | 2,113 | $ | 6,297 | $ | 7,183 | |||||||
Retail | 39,278 | 39,256 | 105,629 | 102,859 | |||||||||||
Online consumer | 3,979 | 4,513 | 14,232 | 14,088 | |||||||||||
Total | $ | 44,982 | $ | 45,882 | $ | 126,158 | $ | 124,130 | |||||||
Consolidated | |||||||||||||||
Wholesale | $ | 46,001 | $ | 45,190 | $ | 134,692 | $ | 127,012 | |||||||
Retail | 104,902 | 105,056 | 287,104 | 280,484 | |||||||||||
Online consumer | 13,640 | 11,914 | 43,043 | 36,786 | |||||||||||
Total | $ | 164,543 | $ | 162,160 | $ | 464,839 | $ | 444,282 | |||||||
Table A
American Apparel, Inc. and Subsidiaries
Calculation and Reconciliation of Consolidated Adjusted EBITDA
(Amounts in thousands)
(unaudited)
In addition to its GAAP results, American Apparel considers non-GAAP measures of its performance. Adjusted EBITDA, as defined below, is an important supplemental financial measure of American Apparel's performance that is not required by, or presented in accordance with, GAAP. EBITDA represents net income (loss) before income taxes, interest expense and depreciation and amortization. Consolidated Adjusted EBITDA represents EBITDA further adjusted for other expense (income), foreign currency loss (gain), retail store impairment, and share based compensation expense. American Apparel's management uses Adjusted EBITDA as a financial measure to assess the ability of its assets to generate cash sufficient to pay interest on its indebtedness, meet capital expenditure and working capital requirements, pay taxes, and otherwise meet its obligations as they become due. American Apparel's management believes that the presentation of Adjusted EBITDA provides useful information regarding American Apparel's results of operations because they assist in analyzing and benchmarking the performance and value of American Apparel's business. American Apparel believes that Adjusted EBITDA is useful to stockholders as a measure of comparative operating performance, as it is less susceptible to variances in actual performance resulting from depreciation and amortization and more reflective of changes in pricing decisions, cost controls and other factors that affect operating performance.
Adjusted EBITDA also is used by American Apparel's management for multiple purposes, including:
• | to calculate and support various coverage ratios with American Apparel's lenders |
• | to allow lenders to calculate total proceeds they are willing to loan to American Apparel based on its relative strength compared to its competitors |
• | to more accurately compare American Apparel's operating performance from period to period and company to company by eliminating differences caused by variations in capital structures (which affect relative interest expense), tax positions and amortization of intangibles. |
In addition, Adjusted EBITDA is an important valuation tool used by potential investors when assessing the relative performance of American Apparel in comparison to other companies in the same industry. Although American Apparel uses Adjusted EBITDA as a financial measure to assess the performance of its business, there are material limitations to using a measure such as Adjusted EBITDA, including the difficulty associated with using it as the sole measure to compare the results of one company to another and the inability to analyze significant items that directly affect a company's net income (loss) or operating income because it does not include certain material costs, such as interest and taxes, necessary to operate its business. In addition, American Apparel's calculation of Adjusted EBITDA may not be consistent with similarly titled measures of other companies and should be viewed in conjunction with measures that are computed in accordance with GAAP. American Apparel's management compensates for these limitations in considering Adjusted EBITDA in conjunction with its analysis of other GAAP financial measures, such as net income (loss).
Table A (continued)
American Apparel, Inc. and Subsidiaries
Calculation and Reconciliation of Consolidated Adjusted EBITDA
(Amounts in thousands)
(unaudited)
Three Months Ended | Nine Months Ended | |||||||||||||||
September 30, | September 30, | |||||||||||||||
2013 | 2012 | 2013 | 2012 | |||||||||||||
Net Loss | $ | (1,513 | ) | $ | (19,012 | ) | $ | (85,528 | ) | $ | (42,175 | ) | ||||
Income tax provision | 212 | 512 | 1,299 | 1,933 | ||||||||||||
Interest expense | 10,121 | 10,454 | 29,555 | 30,274 | ||||||||||||
Depreciation and amortization | 6,738 | 5,538 | 19,155 | 17,040 | ||||||||||||
Unrealized (gain) loss on change in fair value of warrants | (12,922 | ) | 13,312 | 5,225 | 15,340 | |||||||||||
Loss (gain) on extinguishment of debt | — | — | 32,101 | (11,588 | ) | |||||||||||
Share-based compensation expense | 1,228 | 2,949 | 8,044 | 7,333 | ||||||||||||
Foreign currency transaction (gain) loss | (449 | ) | (685 | ) | 422 | 141 | ||||||||||
Retail store impairment | 233 | — | 311 | 129 | ||||||||||||
Other adjustments | 135 | 246 | 383 | 394 | ||||||||||||
Consolidated Adjusted EBITDA | $ | 3,783 | $ | 13,314 | $ | 10,967 | $ | 18,821 | ||||||||