Attached files
| file | filename |
|---|---|
| 8-K - 8-K - DUKE REALTY CORP | d626949d8k.htm |
 RELIABLE. ANSWERS.
2013 NAREIT REITWorld San Francisco
November 13-14
Exhibit 99.1 |
 2013 Duke Realty Corporation
2
WHY DUKE REALTY?
Superior Asset Quality
Strategically Located Land Bank and Experienced
Development Capabilities
Proven Operational Success and Future Growth
Opportunities
Balance Sheet Strength
Relative Value vs. Peers
Talent and Leadership Depth to Execute
RELIABLE. ANSWERS |
 RELIABLE. ANSWERS.
2013 Duke Realty Corporation
3
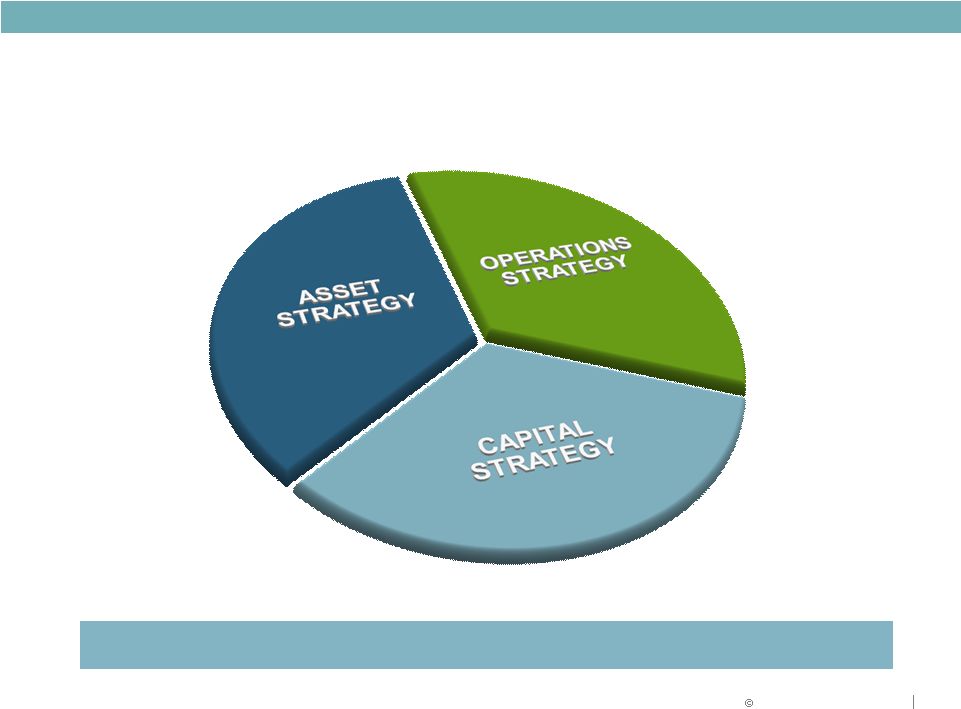
Three-Pronged Strategy for Success
Strategies for delivering shareholder value |
 2013 Duke Realty Corporation
ASSET STRATEGY
4 |
 2013 Duke Realty Corporation
3Q 2013
YE
2013
5
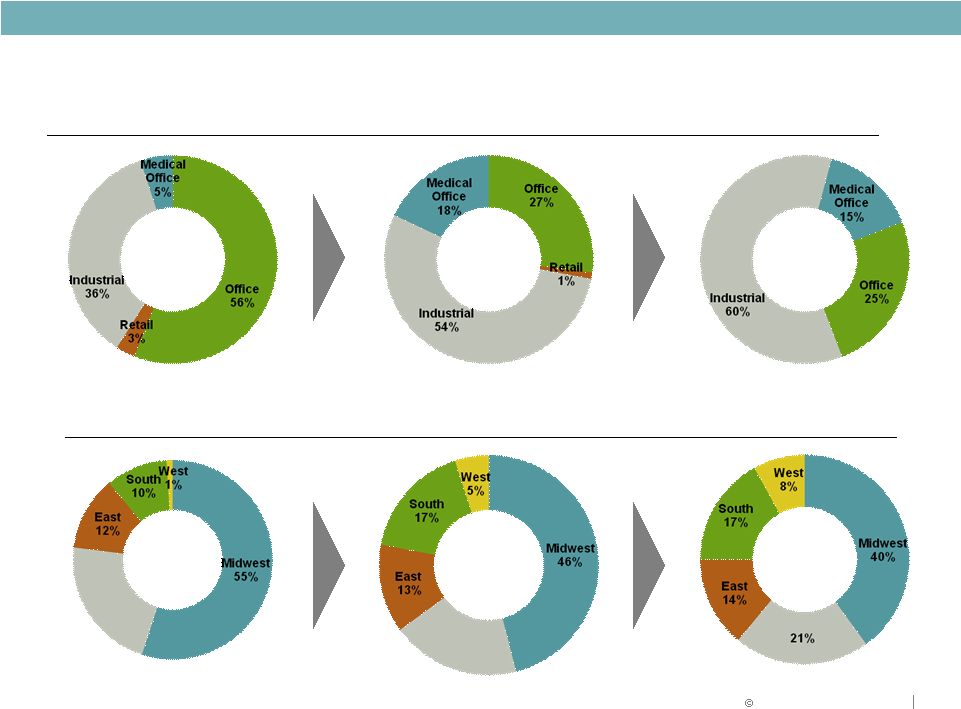
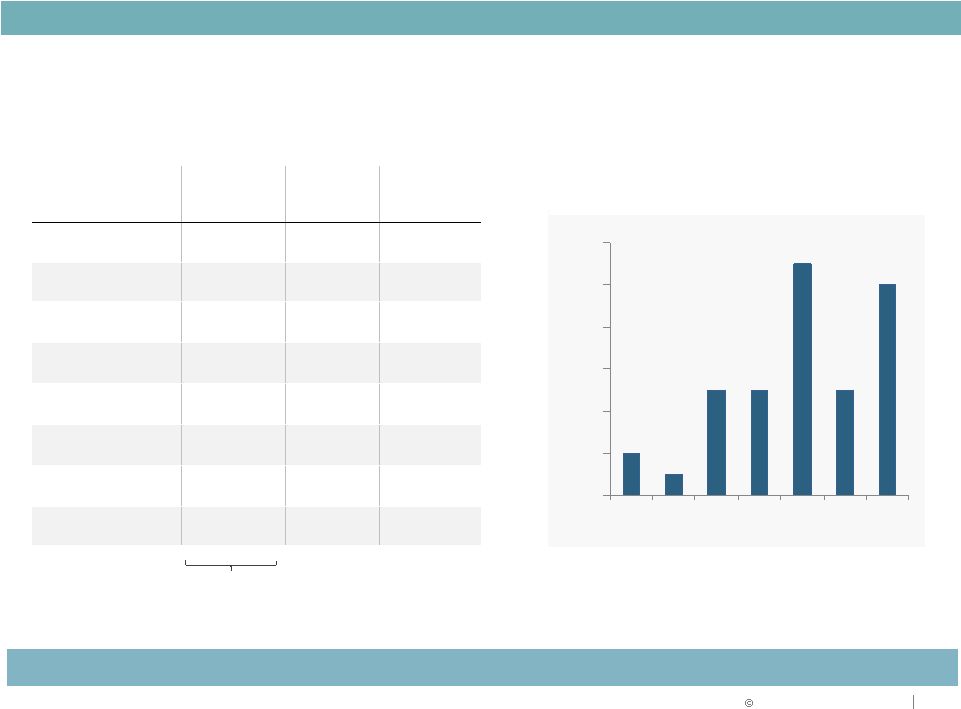
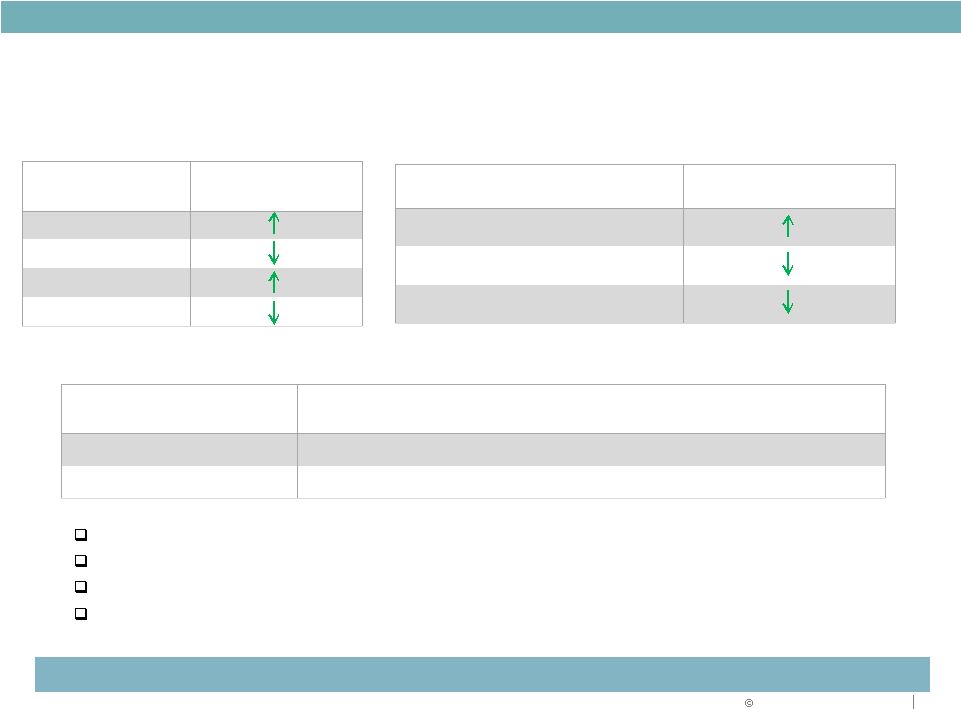
Asset Strategy Progress
BY PRODUCT
2009
BY GEOGRAPHY
ASSET STRATEGY
2009
YE
2013
Southeast
22%
Southeast
3Q 2013
Southeast
19%
Note: Figures represents share of quarterly net operating income
|
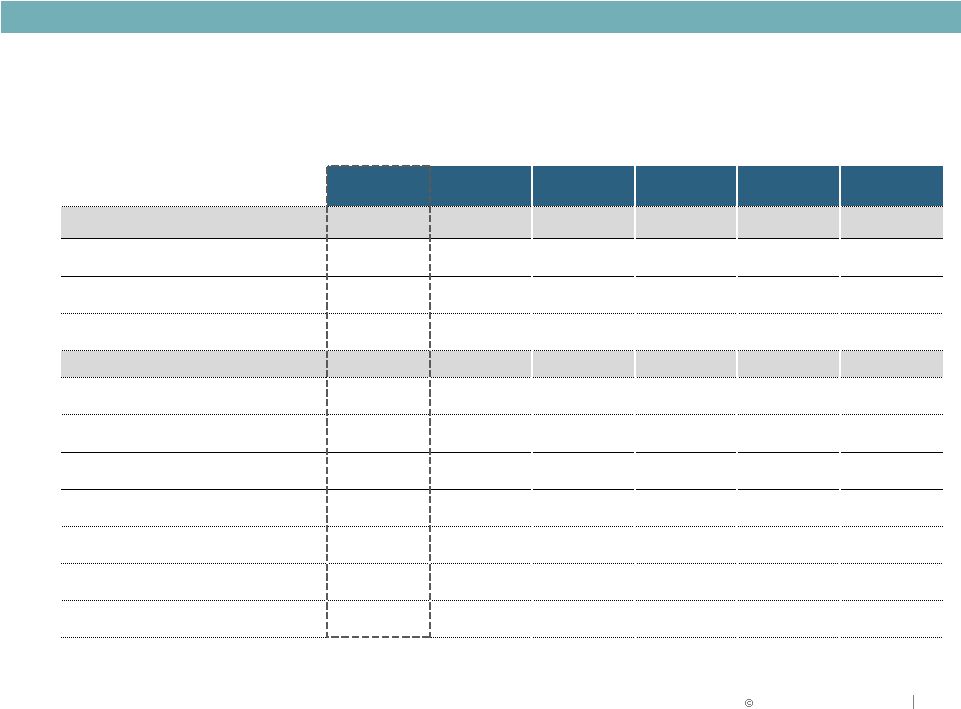
  2013
Duke Realty Corporation Proceeds
or Cost
($MM's)
Avg
Age
In-place
Occupancy
In-place
Cap Rate
TTM
Economic
Cap Rate
2011
$ 1,634
14
82%
8.2%
6.7%
2012
140
18
80%
7.8%
6.3%
2013 YTD
465
9
93%
6.2%
5.6%
Total
$ 2,239
13
84%
7.8%
6.5%
2011
$ 747
10
92%
6.5%
2012
801
11
94%
6.5%
2013 YTD
481
7
100%
6.2%
Total
$ 2,029
9
95%
6.5%
2011
$ 202
97%
7.5%
2012
520
87%
7.3%
2013 YTD
297
83%
8.2%
Total
1,019
88%
7.6%
Transaction Type
Dispositions
Acquisitions
Development
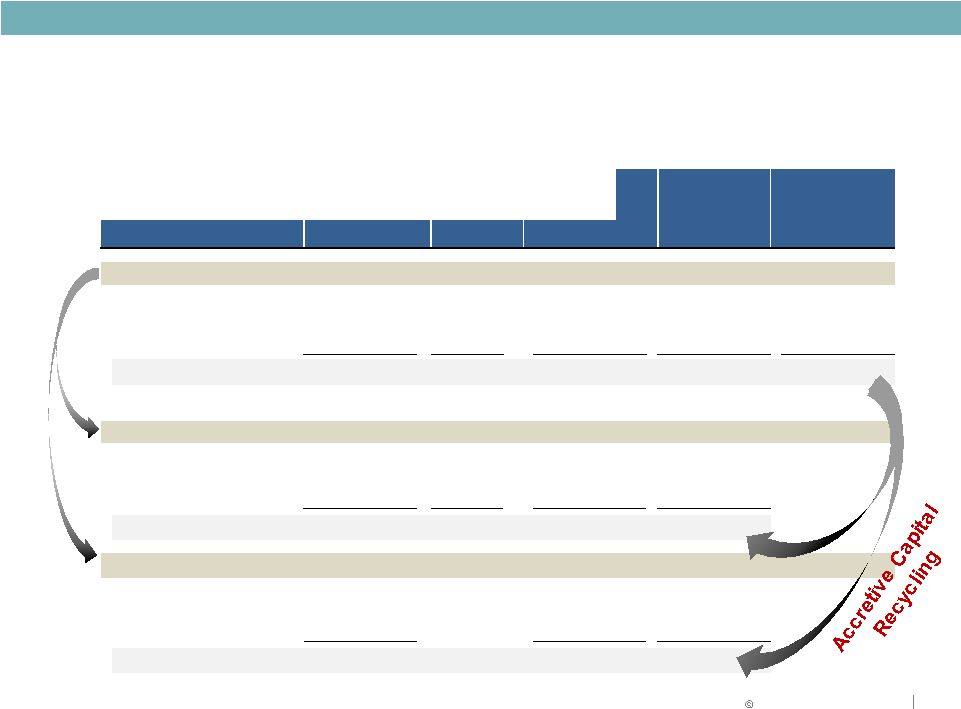
Repositioning & Capital Deployment Activity since 2010
6
ASSET STRATEGY |
 2013 Duke Realty Corporation
7
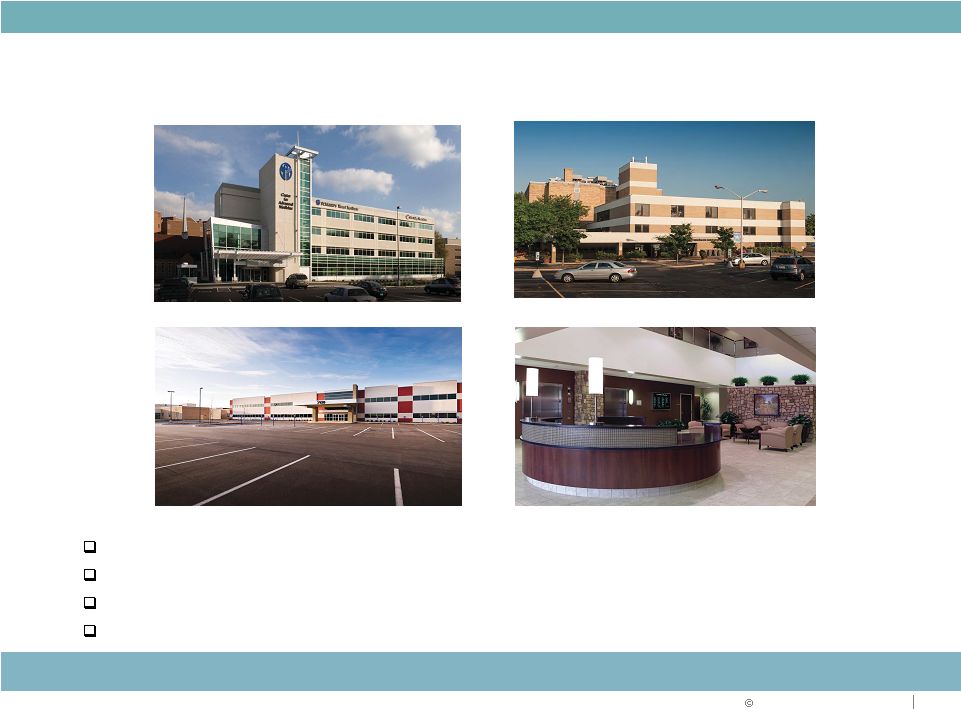
Highest quality portfolio of large, modern bulk industrial
assets in key distribution markets
Best in class MOB development platform and portfolio,
with newest properties and highest hospital system credit
Built-in annual rent and same property growth
Suburban office portfolio now less than 27% with growth
opportunities through lease up
Successful execution of significant asset repositioning
allowing us to focus on growth and a “sharpshooter”
approach for future asset sales
Superior Asset Quality
ASSET STRATEGY |
 2013 Duke Realty Corporation
ASSET STRATEGY –
INDUSTRIAL PORTFOLIO
8 |
 2013 Duke Realty Corporation
9
Leverage 40 years of industrial operating and development experience as
primary driver of company growth
Focus on larger, modern bulk distribution product which results in higher credit
quality tenant base with fewer overall tenants to manage
Geographic strategy focused on major markets in key trucking, rail and
shipping corridors
Growing NOI stream with contractual rent escalations and low capital
expenditures
Apply current business trends in e-commerce and supply chain reconfiguration
along with key long term relationships
Utilize land positions in existing markets to grow rent through higher yield
development
Strategically seek acquisition opportunities in higher rent growth markets
Industrial Strategy
ASSET STRATEGY |
 2013 Duke Realty Corporation
10
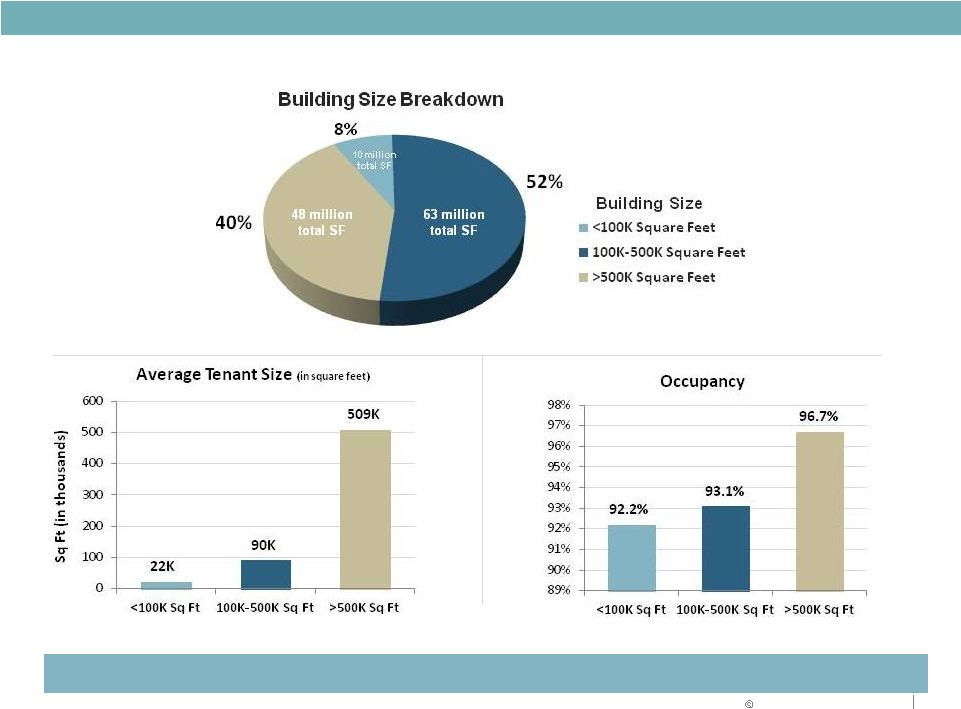
ASSET STRATEGY
Premier Quality Industrial Portfolio
Focus on modern bulk warehouse with strong performance characteristics
Building Size
Building Size |
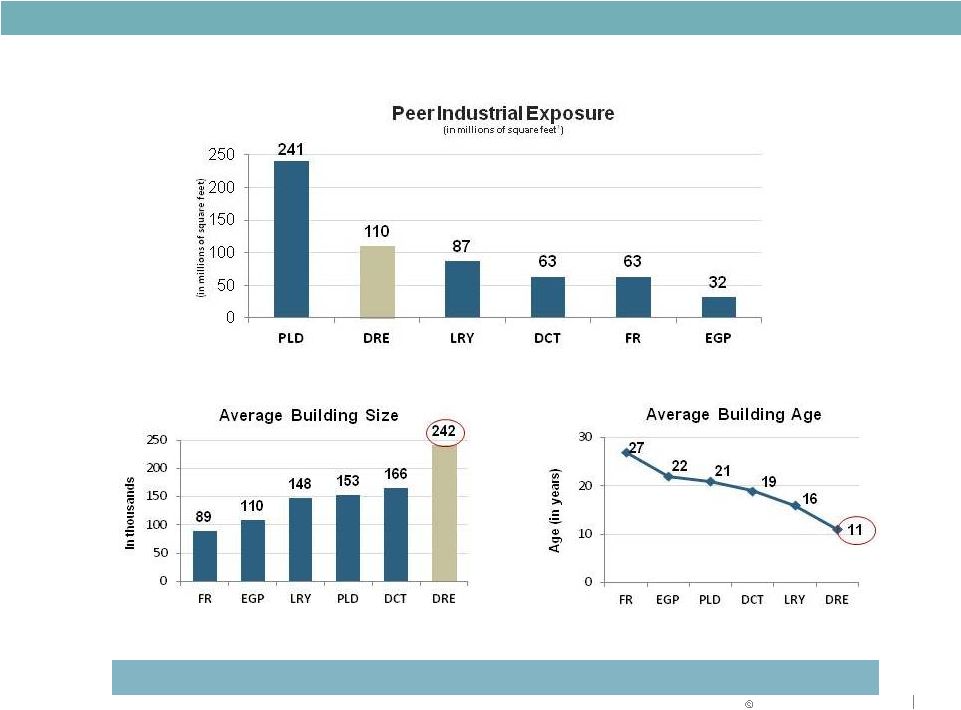 2013 Duke Realty Corporation
11
ASSET STRATEGY
Best in Class Domestic Industrial Portfolio
Newest and largest facilities to support current supply chain trends
(1) Estimates based on pro rata ownership % of domestic, industrial-only
facilities. Source: Q3 2013 company supplementals. LRY isan estimate proforma Cabot
Source:Per
CoStar
database
based
onwtd
avg
RBA,
bulk
and
flex
categories,November
20
13.
LRYincludesproposed
Cabottransaction,DREinternallycalculated.
Source: Estimates based on domestic, industrial-only facilities per Q3 2013
company supplementals. LRY is an estimate proforma Cabot.
|
 2013 Duke Realty Corporation
12
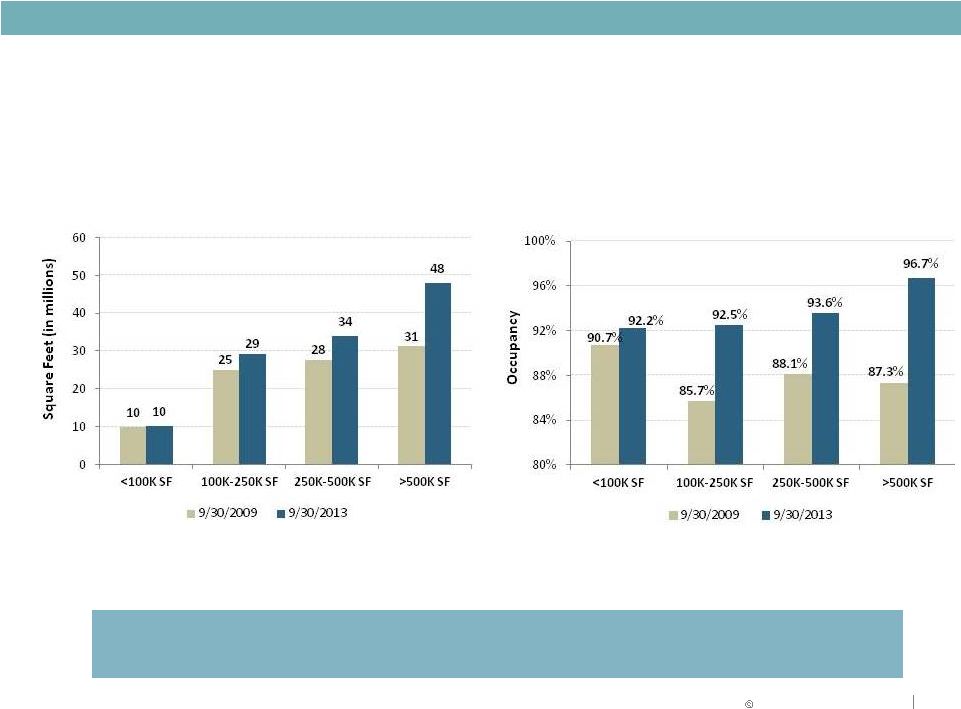
ASSET STRATEGY
Duke Realty Industrial Portfolio –
Then & Now
Significant occupancy increase and shift to
newer, bigger buildings since 2009
Total Square Feet by Building Size
Occupancy by Building Size |
 2013 Duke Realty Corporation
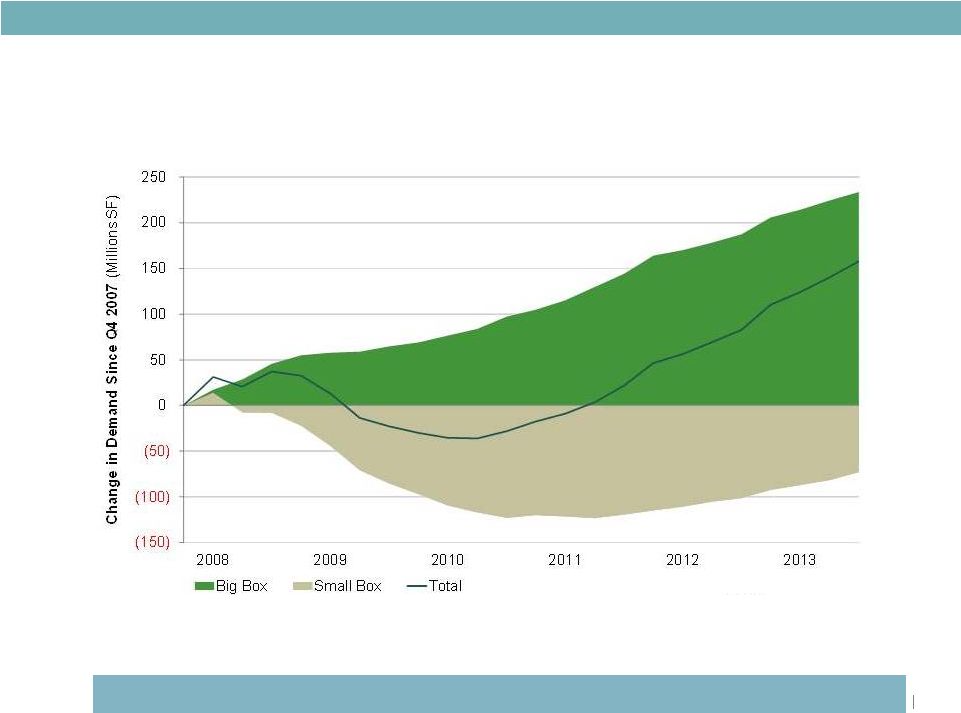
Big Box vs Small Box
Cumulative Net Absorption In Duke Realty Markets
13
Higher demand for modern bulk product
ASSET STRATEGY
As of 13Q3
Sources: CoStar Group, Inc.; PPR. Representative of Duke Realty's 22 markets
of the PPR54 *Big Box: 1990 or newer & 100K SF+; Small Box: Older than
1990 or <100K SF |
 2013 Duke Realty Corporation
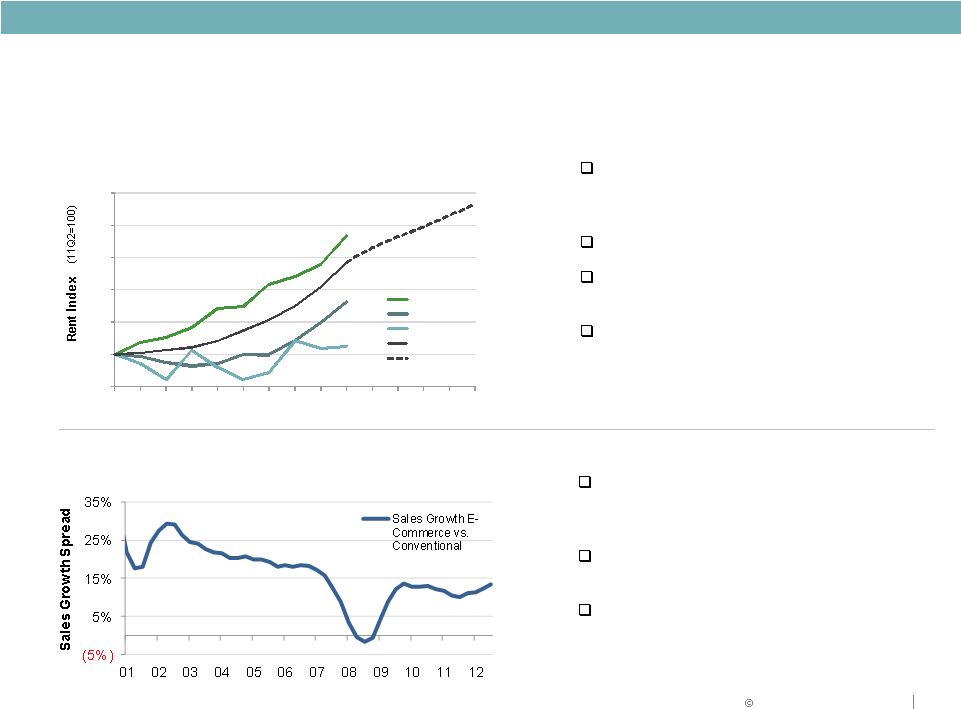
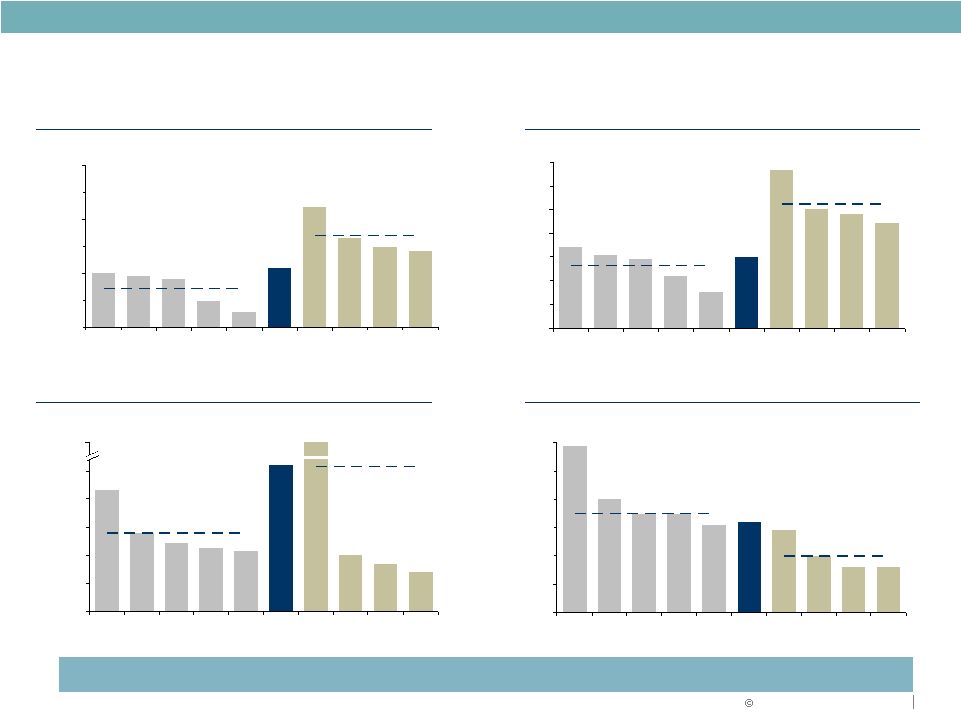
Strong Market Rent Growth Momentum
Big Box : Strong Rent Growth & E-Commerce Trends
14
E-Commerce Sales Growth Very Strong
Graph sources: CoStar / PPR; E-commerce & retail sales figures are 4Q
rolling avg; *PPR54 minus 22 Duke MSAs; Big Box 1990+ & 100K SF+;
Small Box <100K SF ASSET STRATEGY
Market rent growth continues to
accelerate. Projections are 3.3%
average annual growth through 2017
Big box continues to outperform
Duke Realty market rent growth
outperforming the PPR54
Duke Realty actual net effective rent
growth for industrial trending up: +8%
for Q3 and +4% YTD
E-commerce sales growth currently
growing at a double digit rate over
conventional retail
E-commerce currently 9% of all retail
sales, trending towards 20% by 2020
Duke Realty a leading national facility
operator/developer to leading users of
modern bulk industrial space
98
100
102
104
106
108
110
11Q2
11Q4
12Q2
12Q4
13Q2
13Q4
14Q2
14Q4
DRE Markets Big Box
DRE Markets Small Box
Non-DRE Markets* Big Box
DRE Markets All Sizes
DRE Markets Forecast |
 2013 Duke Realty Corporation
ASSET STRATEGY –
OFFICE PORTFOLIO
15 |
 2013 Duke Realty Corporation
16
Will reach 25% target by year-end 2013
Continue to sell older, non-strategic assets
Develop remaining office land bank primarily with build
to suit projects
Own highest quality assets in high growth office
markets
Office
Strategy
ASSET STRATEGY |
 2013 Duke Realty Corporation
17
ASSET STRATEGY
Office Portfolio –
Then & Now
45% decrease
in investment
Significant decrease in investment, less tenants = operating efficiencies
Invested $ by Region
# of Tenants by Region
40% decrease
in tenants |
 2013 Duke Realty Corporation
18
Office Properties Being Marketed
Various
properties
being
marketed
in
multiple
markets,
including
Cleveland,
Cincinnati
and
St.
Louis;
Average
age
of
17
years
Approximately
$190
million
of
assets
under
contract
or
LOI
with
expected
December
closings.
In
advanced
negotiations
on
another
portfolio
totaling
about
$150
million
which
we
believe
will
proceed
and
likely
close
in
early
2014.
Continue pruning suburban office according to plan
ASSET STRATEGY |
 2013 Duke Realty Corporation
ASSET STRATEGY –
MEDICAL OFFICE PORTFOLIO
19 |
 2013 Duke Realty Corporation
20
ASSET STRATEGY
MOB Platform Strategy and Benefits to Duke Realty
Solid NOI growth and low volatility
Growth industry, recession resistant asset class
Best in class development team able to produce consistent
development opportunities through economic cycles
Substantially all on-campus or aligned with major hospital systems
Long term leases averaging over 12 years
Consistent NOI growth with typical leases including 2-3% annual
net rent escalations and expense increase pass-throughs
Recycle selected assets to recognize value created and fund new
development |
 2013 Duke Realty Corporation
21
ASSET STRATEGY
Healthcare Trends
Annual Healthcare Expenditures
Source: U.S. Bureau of the Census
Growing healthcare expenditures, cost efficiency trends and the Affordable Care Act
should further improve demand for lowest-cost setting outpatient (MOB)
facilities Affordable Care Act
People insured expected to increase by 30 to 50 million –
increased demand for care
Number of physicians expected to increase –
growing MOB space demand
Patient care shifting to more cost-efficient MOB settings
with higher acuity of services
Reduced reimbursements should make real estate efficiency a priority
–
larger deals and floor plates
Healthcare system consolidation and physician practice acquisitions by hospitals
grew 25% in the last 5 years – strong MOB demand and improving
credit Inpatient and Outpatient Trends
Source: Avalere Health, American Hospital Association
Annual Survey, U.S. Census Bureau |
 2013 Duke Realty Corporation
4%
13%
83%
22
ASSET STRATEGY
In-Service
Under
Development
Total
Properties
74
12
86
Investment $
$1.3 B
$240 M
$1.5 B
Square Feet
5.6 M
817 K
6.4 M
Leased Occupancy
94%
100%
94%
MOB
On-Campus
MOB
Off-Campus
Medical Office Portfolio
Highest quality pure MOB portfolio with average age of only 7 years
MOB Aligned w/
Health System
Investment by product type
As of 9/30/13 |
 2013 Duke Realty Corporation
23
ASSET STRATEGY
Duke Realty Medical Office Portfolio –
Then & Now
Significant increase in investment and occupancy
Cumulative Invested $
Occupancy |
 2013 Duke Realty Corporation
As of 9/30/13
24
ASSET STRATEGY
2%
1%
5%
5%
11%
5%
10%
0%
2%
4%
6%
8%
10%
12%
2014
2015
2016
2017
2018
2019
2020
Lease Expirations
(% of MOB In-Service Sq. Ft.)
High credit tenants and limited lease maturities result in stable and growing cash
flow Top Health System Relationships
Health System
Credit
Rating
(Moody's)
Rentable
SF
% of Tot
Square Feet
Veterans
Administration
Aaa
224,000
3.5%
Ascension Health
Aa1
530,000
8.2%
Health & Hospital
Corp Marion County
Aa1
274,000
4.3%
Baylor Health Care
System
Aa2
452,000
7.0%
Catholic Health
Initiatives
Aa2
250,000
3.9%
Franciscan Alliance,
Inc.
Aa3
283,000
4.4%
Scott & White
Healthcare
A1
425,000
6.6%
Adventist Health
Aa3
201,000
3.1%
Overall 56% of space leased
to “A”
or better rated tenants |
 RELIABLE. ANSWERS.
2013 Duke Realty Corporation
DRE
HCN
HCP
HR
HTA
VTR
Portfolio Size
Number of Properties
86
219
208
194
279
329
Square Feet
(in MM's)
6.5
14.1
14.2
13.6
13.6
18.1
Total Investment
(in $MM's)
$1,531
$3,405
$2,649
$2,934
$2,818
$3,663
Operating Statistics
Average Age
(1)
7 yrs
12 yrs
20 yrs
--
--
--
Square Feet / Property
75k SF
65k SF
68k SF
70k SF
49k SF
55k SF
Est'd Annualized NOI $ / SF
$17.4
$18.4
$15.2
$16.0
$16.7
$15.8
In-Service Occupancy
94%
94%
90%
88%
91%
92%
Q3 Same Prop NOI Growth
3.5%
1.2%
0.7%
1.9%
3.2%
0.5%
% Leased to Health Systems
70%
--
--
38%
--
--
% of MOB’s On-Campus / Aligned
(2)
96.5%
87.9%
94.2%
87.4%
96.0%
--
Best in Class Medical Office Portfolio –
Peer Comparison
25
Notes
1.
In service portfolio
2.
On-Campus / Aligned refers to a property that is 1) located on or adjacent to a
healthcare system, 2) off-campus and leased 50% or more to a healthcare system, or 3) an ASC / specialty hospital
with a hospital partnership interest
Sources:
Company filings as of Q3 2013
= #1 in metric
Bold |
 2013 Duke Realty Corporation
26
Non-Core Medical Office Portfolio Being Marketed
Seventeen (17) medical office buildings totaling 938,000 square feet, average age
of 13 years 97% leased; located primarily in the Midwest
Under contract and expect to close in Q4 and early Q1 with proceeds estimated over
$250 million Average age and quality of remaining portfolio will improve
after sale Divesture of select MOBs affiliated with non-strategic health
systems ASSET STRATEGY |
 2013 Duke Realty Corporation
27
ASSET STRATEGY
Healthcare Development Pipeline
Department of Veterans Affairs
Tampa, FL
117,000 SF, 100% pre-leased
Wishard Health
Indianapolis, IN
274,000 SF, 100% pre-leased
Scott & White Healthcare
Temple, TX
78,000 SF, 100% pre-leased
Baylor Healthcare (6 Facilities)
Dallas, TX
207,000 total SF
100% pre-leased
Scott & White Healthcare
Waco, TX
35,000 SF, 100% pre-leased
Centerre/Mercy
Springfield, MO
60,000 SF, 100% pre-leased
TriHealth West Chester MOB
Cincinnati, OH
49,000 SF, 100% pre-leased |
 2013 Duke Realty Corporation
ASSET STRATEGY –
DEVELOPMENT CAPABILITIES
28 |
 2013 Duke Realty Corporation
Development Strategic Advantages
Development platform creates significant value
29
40 years of experience in development
Land bank in strategic locations that can support approximately
58 million square feet of development (86% bulk industrial)
$391MM pipeline that is 85% leased with 8.9% GAAP yield,
immediately accretive when complete
Strategic relationships with national users generating repeat business
Fully staffed internal team involved in all aspects of development,
including pre-construction and construction to deliver most cost effective
and profitable projects
Risk management policies in place to govern maximum development
pipeline size and speculative development starts
ASSET STRATEGY |
 2013 Duke Realty Corporation
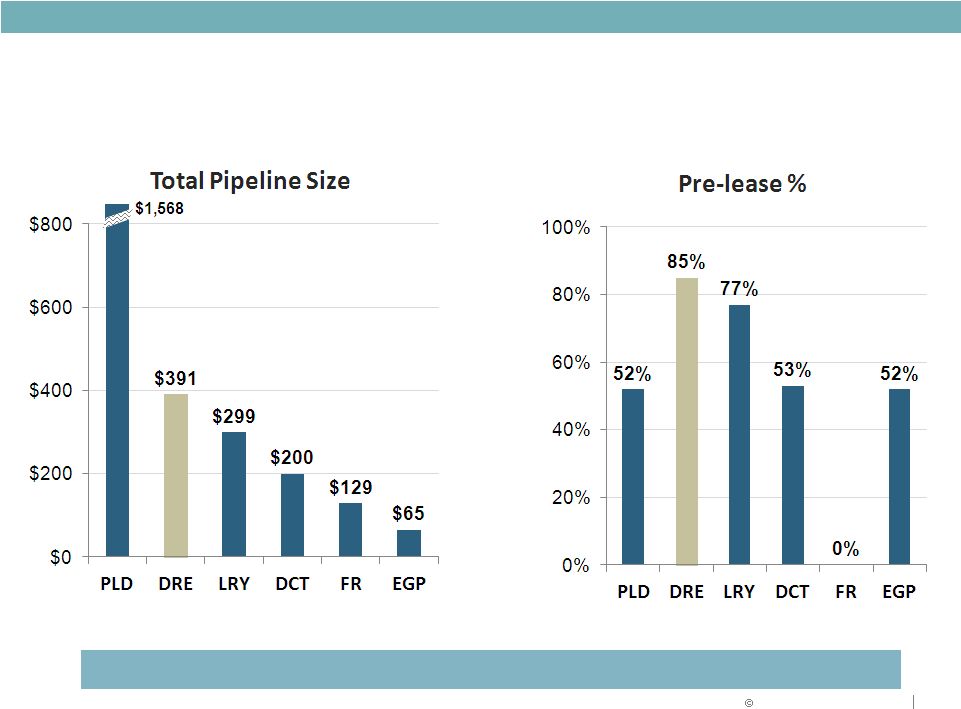
Development Pipeline Comparison
30
Duke Realty development pipeline to drive strong external growth
ASSET STRATEGY
(in $millions)
Source: Q2 2013 Company Supplementals |
 2013 Duke Realty Corporation
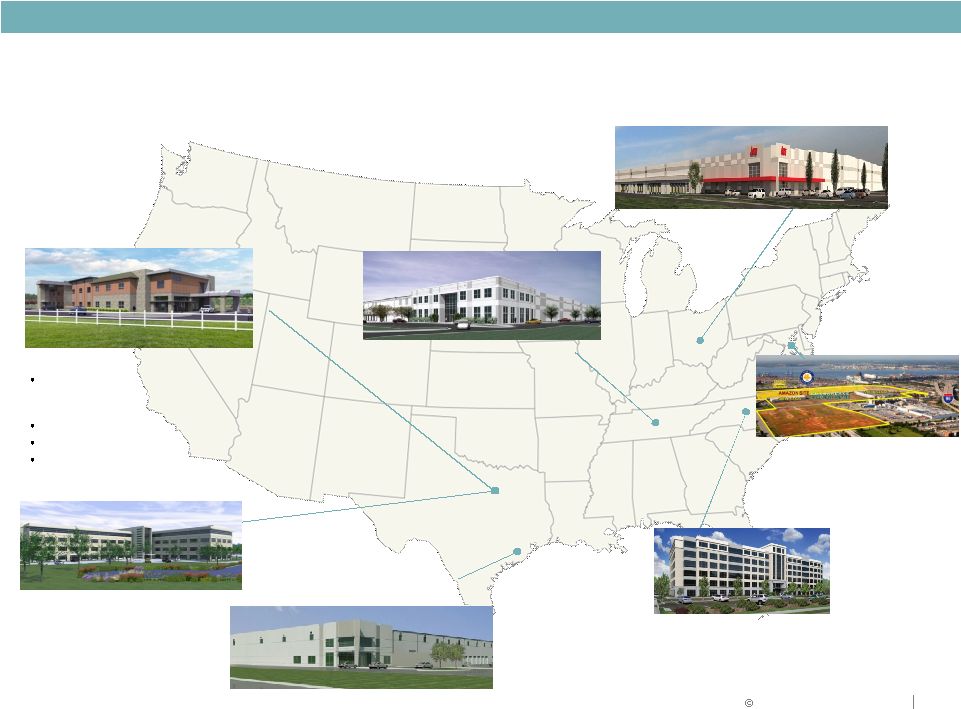
Select 2013 YTD Development Starts
31
Nashville Industrial
•
Regional distribution center build-to-suit
for Starbucks on Duke Realty land
•
680,000 SF; 8 year lease term
•
100% pre-leased
Dallas Medical Office
Five Baylor Emergency (ER) facilities in Metro
Dallas (cities of Rockwall, Murphy, Colleyville,
Mansfield and Burleson)
168,000 total SF
Over $70 million total investment
100% pre-leased, 15 year lease terms
Dallas Office
•
Build-to-suit on Duke Realty land
•
200,000 SF
•
16 year lease term
•
100% pre-leased
Houston Industrial
•
Speculative development
on Duke Realty land
•
Airport submarket
•
240,000 SF
Raleigh Office
•
Perimeter Two & Three on Duke Realty land
•
410,000 total SF
•
91% and 64% pre-leased, respectively
ASSET STRATEGY
Columbus Industrial
•
Build to suit on Duke Realty
land for Ace Hardware
•
534,000 SF
•
10+ year lease term
•
100% pre-leased
Baltimore Industrial
•
Build to suit on Duke Realty
land for major internet retailer
•
1 million SF; 15 year lease term
•
Port of Baltimore |
 2013 Duke Realty Corporation
Developable Square Feet
Industrial
Office
Primary Markets
Midwest
26.0
3.1
Indianapolis, Chicago, Cincinnati, Columbus, Minneapolis, & St. Louis
East
3.8
1.6
New Jersey, Baltimore, Raleigh and Washington D.C.
Southeast
9.4
2.1
Atlanta, Central Florida, and South Florida
Southwest
10.8
1.4
Phoenix, Dallas, Houston and Nashville
Total
50.0 million SF
8.2 million SF
32
Strategic Land Bank
HELD FOR
DEVELOPMENT
ASSET STRATEGY
•
Strategically
located
in
key
distribution
markets
and
vibrant
commercial
corridors
•
Cost
feasibility
and
development
strategies
completed
for
all
land
investments;
Land
fully
zoned
for
intended
use
•
Sales
from
non-strategic
parcels
of
$97
million
since
2009
have
resulted
in
an
approximate
6%
gain
over
book
basis |
 2013 Duke Realty Corporation
OPERATING STRATEGY
33 |
 2013 Duke Realty Corporation
34
Completed
asset
repositioning
into
higher
quality,
higher
rental
rate
growth
assets
with
minimal
FFO
per
share
dilution
and
annual
growth
in
AFFO
per
share
AFFO
payout
ratio
of
74%
and
AFFO
multiple
of
approximately
18x
at
the
low
end
of
the
sector
and
well
positioned
for
continued
growth
Proven
same
property
NOI
outperformance,
well
positioned
for
continuing
rental
rate
growth
through
lease
rent
escalations
Ability
to
push
rents
because
of
occupancy
and
asset
quality
Modern
bulk
product
and
staggered
lease
maturities
significantly
reduces
capex
Operational
Success
and
Future
Growth
Opportunities
OPERATIONS
STRATEGY |
 2013 Duke Realty Corporation
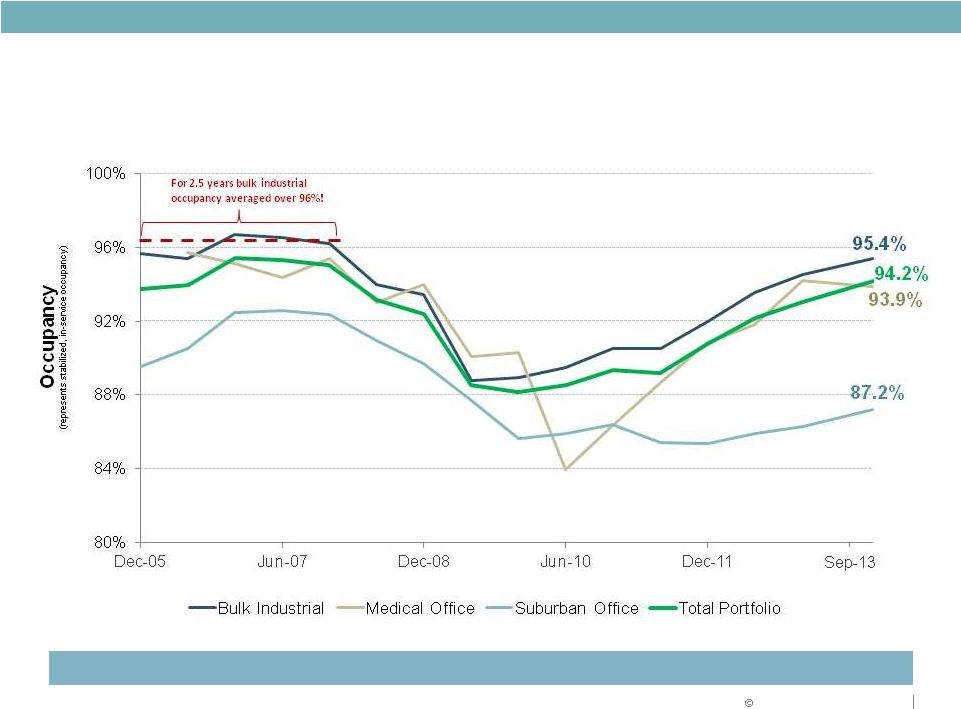
Historical Performance Supports Additional Occupancy Upside
35
Historical Occupancy
OPERATIONS STRATEGY
Sep-13 |
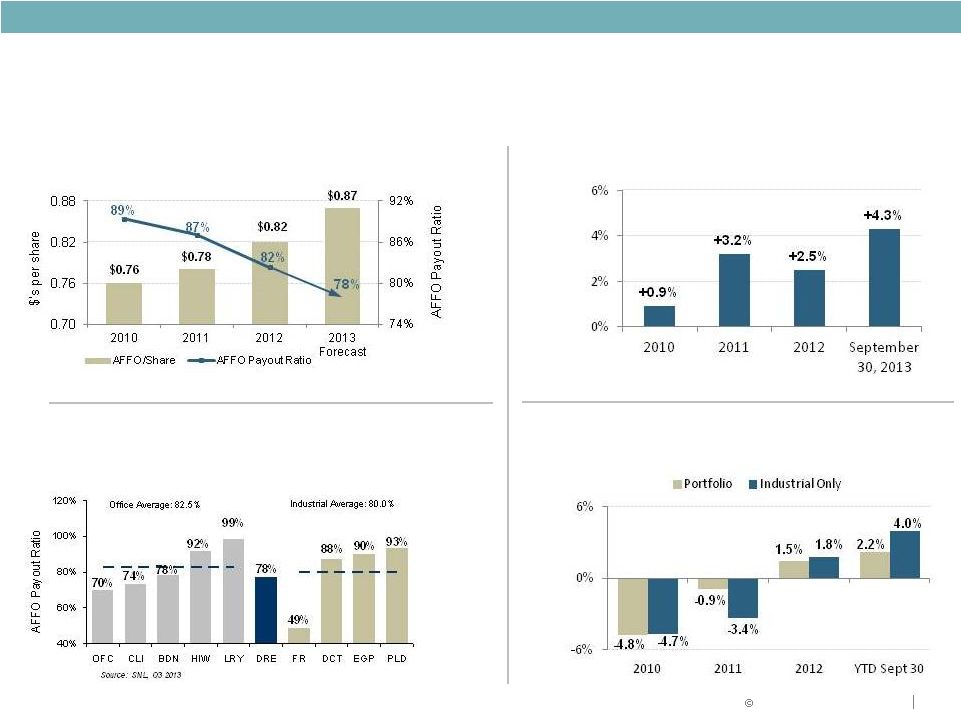 2013 Duke Realty Corporation
Accelerating Rent Growth
(Represents growth in annual net effective rent on renewal leases)
36
Improving Operating Performance
Strong Cash Flow Growth and Payout Ratio
OPERATIONS STRATEGY
Steady Same Property NOI Growth
Peer Payout Ratio Analysis |
 2013 Duke Realty Corporation
CAPITAL STRATEGY
37 |
 2013 Duke Realty Corporation
38
CAPITAL STRATEGY
Will reach original leverage goals established in 2009 by Q4
2013
Continue to delever through assets sales and funding new
development 60/40 equity/debt
Well balanced annual debt maturities
Significant liquidity with $850 million LOC with little to no
borrowings and low near-term maturities
Low percentage of secured and variable rate debt compared to
peer group
Balance Sheet Quality |
 2013 Duke Realty Corporation
Investment grade rated debt (Baa2/BBB-) for over 16
years with proven access to multiple capital sources
Available line of credit -
$850 million capacity
Conservative AFFO payout ratio for 9 months YTD (74%)
39
Key Capital Metrics & Goals
2010
Actual
2012
Actual
Sept 30,
2013
Goal
Debt to
Gross Assets
46.3%
49.7%
47.3%
45.0%
Debt + Preferred to
Gross Assets
55.5%
56.1%
51.7%
50.0%
Fixed Charge
Coverage Ratio
1.79 : 1
1.81 : 1
2.1:1
(1)
2.00 : 1
Debt + Preferred /
EBITDA
8.88
9.25
8.0
(2)
7.75
CAPITAL STRATEGY
Progressing toward strategic plan goals
(1)
Based
on
Q3
2013
annualized;
(2)
Proforma
D+P
/
EBITDA
based
on
Q3
2013
annualized
EBITDA
and
adjusted
for
asset
repositioning
on
a
full
quarter
basis. |
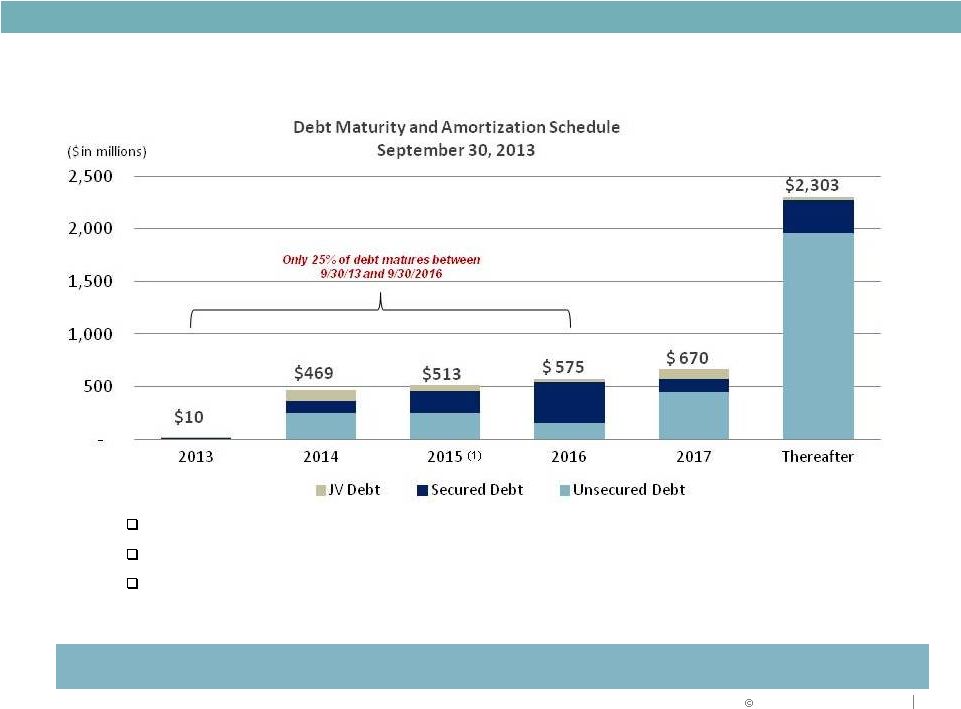 2013 Duke Realty Corporation
Current Liquidity Position
40
Maturity ladder well balanced and liquidity position significantly enhanced
Next unsecured maturity is $250MM in August 2014
No unsecured maturities > $600M in any one year ($600M in 2022)
25% of debt matures over next 3 years ($1.2 billion total), compared to January
2009 when over 46% of debt ($2.2 billion) was maturing over the subsequent
3 years CAPITAL STRATEGY
(1) Excludes $210MM outstanding LOC borrowings as of 9-30-13
|
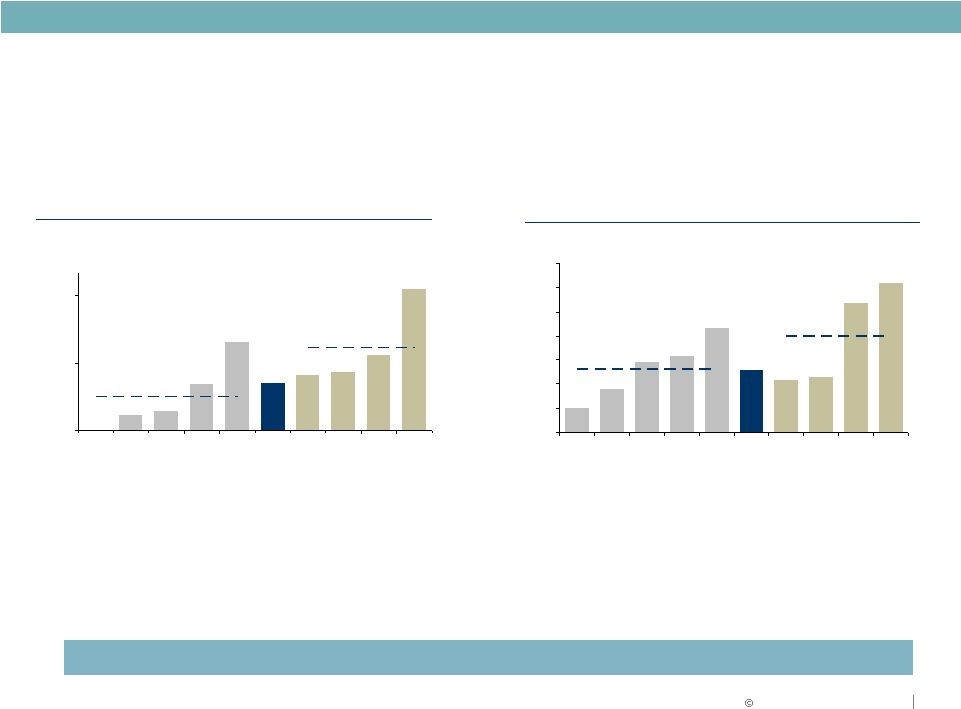 2013 Duke Realty Corporation
10%
18%
29%
32%
43%
26%
22%
23%
54%
62%
0.0%
10.0%
20.0%
30.0%
40.0%
50.0%
60.0%
70.0%
LRY
BDN
HIW
CLI
OFC
DRE
DCT
PLD
FR
EGP
Industrial Average: 40.0%
Office Average: 26.5%
Secured Debt / Total Debt
Peer
Set
Key:
Office
-
LRY=Liberty;
CLI=Mack-Cali;
HIW=Highwoods;
BDN=Brandywine;
OFC=Corp
Office;
Industrial:PLD=Prologis;
FR=First
Indus;
DCT=DCT
Indus
Trust;EGP=Eastgroup;
Datasource:SNL
Financial,
MRQ
41
0%
3%
4%
10%
20%
11%
12%
13%
17%
31%
0%
15%
30%
LRY
CLI
BDN
OFC
HIW
DRE
EGP
FR
PLD
DCT
Industrial Average: 18.4%
Office Average: 7.5%
Variable Rate Debt / Total Debt
Low
level
of
secured
and
variable
rate
debt
creates
flexibility
and
lower
volatility
Duke Realty Peer Debt Metrics
CAPITAL STRATEGY |
 2013 Duke Realty Corporation
WHY DUKE REALTY
42 |
 2013 Duke Realty Corporation
43
WHY DUKE REALTY
Duke Realty Scorecard
Asset Strategy
Asset
Concentration
2010
2013
Industrial
42%
60%
Office
49%
23%
Medical Office
6%
16%
Retail
3%
1%
Capital Strategy
Key Metrics
2010
2013
Fixed Charge Coverage
1.79
2.1
Debt Plus Preferred to EBITDA
8.68
< 7.6
Debt Plus Preferred to Gross Assets
55.5%
< 50%
Operations Strategy
Key Metrics
2010
2011
2012
2013
Forecast
Core FFO Per Share
1.15
1.15
1.02
1.09
Core AFFO Per Share
0.76
0.78
0.82
0.87
Successfully repositioned portfolio towards industrial concentration
Successfully improved all key leverage metrics
Achieved consistent growth in AFFO per share of over 4% per year
Positioned to continue positive trends in all phases of strategy
2013
Forecast
operating
metrics
are
based
on
midpoint
of
guidance;
2013
leverage
metrics
are
based
on
Q4
2013
forecast
adjusted
to
give
effect
for
asset
repositioning
activity
on
a
full
quarter
basis.
Producing strong operating results while delevering and repositioning assets
|
 2013 Duke Realty Corporation
44
Positioned for NAV Growth
KEY NAV GROWTH DRIVERS
Lease-Up
Existing Vacancy
In-service portfolio occupancy of 93.5%
Strong leasing pipeline
Demonstrated track record of 65-85% tenant renewal rate
Ability to continue to drive suburban office and MOB occupancy higher
Accretive
Development
Current development pipeline of $391 million (0.8MM SF of industrial, 0.8MM SF of
medical office and 0.6MM SF of suburban office, currently 85%
pre-leased) 2013 estimated development starts of $400 to $500
million High quality land bank to facilitate future development
Continued
Asset
Repositioning
Acquisitions of primarily core and value-add bulk industrial, located in
strategic distribution markets, leased to high quality tenants with
contractual lease escalators Dispositions focused on more capital intensive
suburban office mainly in the Midwest, retail, and select older medical and
industrial/flex assets Asset recycling has been AFFO positive, while
extending average lease duration, lowering cash flow volatility, improving
tenant credit and overall quality of portfolio Increase Rents \
Reduced Capex
Rent roll downs burning off and positive same property NOI performance
Forecasts of industrial market wide average annual rent growth of 3.3%
*
from 2014-17
*
Rent
forecasts
a
composite
of
PPR
and
Green
Street
WHY DUKE REALTY |
 2013 Duke Realty Corporation
5.6%
5.6%
6.0%
6.9%
7.2%
7.1%
7.5%
7.5%
8.0%
9.9%
4.0%
5.0%
6.0%
7.0%
8.0%
9.0%
10.0%
CLI
OFC
LRY
BDN
HIW
DRE
FR
DCT
PLD
EGP
19.8x
18.4x
17.7x
14.9x
12.1x
18.1x
32.7x
26.1x
25.2x
23.7x
6.0x
10.0x
14.0x
18.0x
22.0x
26.0x
30.0x
34.0x
HIW
LRY
BDN
OFC
CLI
DRE
PLD
EGP
FR
DCT
17.3x
17.9x
19.3x
23.8x
14.8x
8.3x
9.8x
13.1x
13.7x
14.1x
6.0x
10.0x
14.0x
18.0x
22.0x
26.0x
30.0x
LRY
OFC
HIW
BDN
CLI
DRE
PLD
EGP
FR
DCT
Industrial Average: 19.6x
Office Average: 11.8x
Industrial Average: 26.9x
Industrial Average: 6.0%
Office Average: 16.6x
Office Average: 7.9%
Price / 2013E FFO
Implied Cap Rate
(1)
Price / 2013E AFFO
Datasource:
SNL
Financial,
9/25/13.
(1)NOI
based
on
Wells
Fargo
Q3’13
annualized
NOI,
plus
an
assumed
growth
ratefor
the
forward
12
months.
Balance
sheet
adjusted
for
non-stabilizedproperties
andtangiblenetassets,
but
doesnot
include
an
adjustment
to
mark
debt
to
market.
Duke Realty Valuation Statistics
45
Total Market Cap ($ in billions)
$8.6
$5.6
$4.9
$4.5
$4.3
$10.4
$4.0
$3.4
$2.8
$0.0
$2.0
$4.0
$6.0
$8.0
$10.0
$12.0
LRY
HIW
BDN
OFC
CLI
DRE
PLD
DCT
FR
EGP
$30.9
Industrial Average: $10.3
Office Average: $5.6
Duke realty undervalued relative to peers
WHY DUKE REALTY |
 2013 Duke Realty Corporation
46
WHY DUKE REALTY?
Superior Asset Quality
Strategically Located Land Bank and Experienced
Development Capabilities
Proven Operational Success and Future Growth
Opportunities
Balance Sheet Strength
Relative Value vs. Peers
Talent and Leadership Depth to Execute
WHY DUKE REALTY |
 RELIABLE. ANSWERS.
2013 Duke Realty Corporation
Forward-Looking Statement
47
This slide presentation contains statements that constitute “forward-looking
statements” within the meaning
of the Securities Act of 1933 and the Securities Exchange Act of
1934 as amended by the Private Securities
Litigation Reform Act of 1995. These forward-looking statements include,
among others, our statements regarding (1) strategic initiatives with respect
to our assets, operations and capital and (2) the assumptions underlying our
expectations. Prospective investors are cautioned that any such forward-looking statements
are not guarantees of future performance and involve risks and uncertainties, and
that actual results may differ materially from those contemplated by such
forward-looking statements. A number of important factors could
cause actual results to differ materially from those contemplated by
forward-looking statements in this slide presentation. Many of these
factors are beyond our ability to control or predict. Factors that could cause
actual results to differ materially from those contemplated in this slide
presentation include the factors set forth in our filings with the Securities
and Exchange Commission, including our annual report on Form10-K,
quarterly reports on Form 10-Q and current reports on Form 8-K. We
believe these forward-looking statements are reasonable, however, undue
reliance should not be placed on any forward-looking statements, which are
based on current expectations. We do not assume any obligation to update any
forward-looking statements as a result of new information or future
developments or otherwise. Certain of the financial measures appearing in this
slide presentation are or may be considered to be non- GAAP financial
measures. Management believes that these non-GAAP financial measures provide additional
appropriate measures of our operating results.
While we believe these non-GAAP financial measures are
useful in evaluating our company, the information should be considered supplemental
in nature and not a substitute for the information prepared in accordance with
GAAP. We have provided for your reference
supplemental financial disclosure for these measures, including the most directly
comparable GAAP measure and an associated reconciliation in our most recent
quarter supplemental report, which is available on our website at
www.dukerealty.com. Our most recent quarter supplemental report also includes the
information
necessary to recalculate certain operational ratios and ratios of financial
position. The calculation of these non-GAAP measures may differ from
the methodology used by other REITs, and therefore, may not be
comparable. |