Attached files
| file | filename |
|---|---|
| 8-K - FORM 8-K - VEREIT, Inc. | v360254_8k.htm |
ARCP and Cole Merger to Create World’s Largest Net Lease REIT November 12, 2013
2 Information set forth herein (including information included or incorporated by reference herein) contains “forward - looking statements” (as defined in Section 21 E of the Securities Exchange Act of 1934 , as amended), which reflect American Realty Capital Properties, Inc . ’s (“ARCP”), American Realty Capital Trust IV, Inc . ’s (“ARCT IV”) and Cole Real Estate Investments, Inc . ’ (“Cole”) expectations regarding future events . The forward - looking statements involve a number of risks, uncertainties and other factors that could cause actual results to differ materially from those contained in the forward - looking statements . Such forward - looking statements include, but are not limited to, whether and when the transactions contemplated by any of the merger agreements will be consummated, the combined company’s plans, market and other expectations, objectives, intentions, as well as any expectations or projections with respect to the combined company, including regarding future dividends and market valuations, and estimates of growth, including funds from operations and adjusted funds from operations and other statements that are not historical facts . The following additional factors, among others, could cause actual results to differ from those set forth in the forward - looking statements : ( 1 ) the occurrence of any event, change or other circumstances that could give rise to the termination of any of the merger agreements ; ( 2 ) the inability to complete the ARCT IV merger due to the failure to obtain ARCT IV stockholder approval of the ARCT IV merger or the failure to satisfy other conditions to completion of the ARCT IV merger, including that a governmental entity may prohibit, delay or refuse to grant approval for the consummation of the ARCT IV merger ; ( 3 ) the inability to obtain regulatory approvals for the Cole merger transaction and the approval by ARCP’s stockholders of the issuance of ARCP common stock in connection with the Cole merger and the approval by Cole’s stockholders of the Cole merger ; ( 4 ) risks related to disruption of management’s attention from the ongoing business operations due to the proposed mergers ; ( 5 ) the effect of the announcement of the proposed mergers on ARCP’s, ARCT IV’s or Cole’s relationships with their respective customers, tenants, lenders, operating results and businesses generally ; ( 6 ) the outcome of any legal proceedings relating to any of the mergers or the merger agreements ; and ( 7 ) risks to consummation of the mergers, including the risk that the mergers will not be consummated within the expected time period or at all . Additional factors that may affect future results are contained in ARCP’s, ARCT IV’s and Cole’s filings with the U . S . Securities and Exchange Commissions (“SEC”), which are available at the SEC’s website at www . sec . gov . ARCP, ARCT IV and Cole disclaim any obligation to update and revise statements contained in these materials based on new information or otherwise . Forward - Looking Statements
3 Executive Summary Merger to Create the World’s Largest Net Lease REIT: 64% larger than the closest comparable net lease REIT. Size and scale create operating and revenue efficiencies including lower cost of capital, superior growth opportunities and higher investor returns. Significant Operating Efficiencies: $70 million of annual expense synergies expected in the first year. Financial Benefits Include Dividend Increase and AFFO Growth: Dividend per share on closing increases to $1.00. 86% (1) AFFO payout ratio still allows for future dividend increases during 2014. Guidance for 2014 AFFO growth estimates updated to $1.13 – $1.19 per share (fully diluted) (1) . Best - in - Class Portfolio: Superior diversification by asset type tenancy, industry and geography, 47% investment grade tenancy, 99% occupied, 11 years remaining average lease term. Deleveraging: Net d ebt to EBITDA ratio declines from 9.1x to 7.7x by year - end 2014. Including preferred securities, net debt to EBITDA ratio declines from 11.2x to 8.7x (1) . Exceptional Human Capital: Unification of ARCP and Cole management teams forge competitive advantage from deep industry knowledge and broad industry relationships. Extensive Portfolio Integration Experience: ARCP has extensive experience managing all aspects of approximately $12 billion of mergers and announced acquisitions year - to - date. (1) Assumes Cole stockholders elect merger consideration of 80% common stock and 20% cash.
4 Summary of Material Merger Terms Consideration per Cole Common Share: • 1.0929 ARCP shares fixed exchange ratio or $13.82 cash • Aggregate cash election limited to 20% (subject to proration) • Implied stock consideration of $14.59 represents a 13.8% premium to Cole stockholders based on closing price on October 22, 2013 Common Dividend: • ARCP common dividend increases $0.06 from $0.94 (1) to $1.00 per share at closing: - ARCP stockholders: 6.4% dividend increase - Cole stockholders: 51.8% (2) dividend increase Financing: • $2.75 billion fully committed financing provided by Barclays Timing: • Closing expected in first half of 2014 • Subject to SEC review, stockholder vote of both companies and other closing conditions (1) ARCP increased its current dividend of $0.91 to $0.94 upon the close of the transaction with CapLease, Inc. (“CapLease”) effective upon ARCP’s December 2013 dividend payment. (2) Based on an exchange ratio of 1.0929 multiplied by ARCP pro forma dividend per share of $1.00 and Cole’s existing dividend per share of $0.72. ARCP acquiring Cole for $11.2 Billion (including assumption of debt)
Net Lease Leadership 5
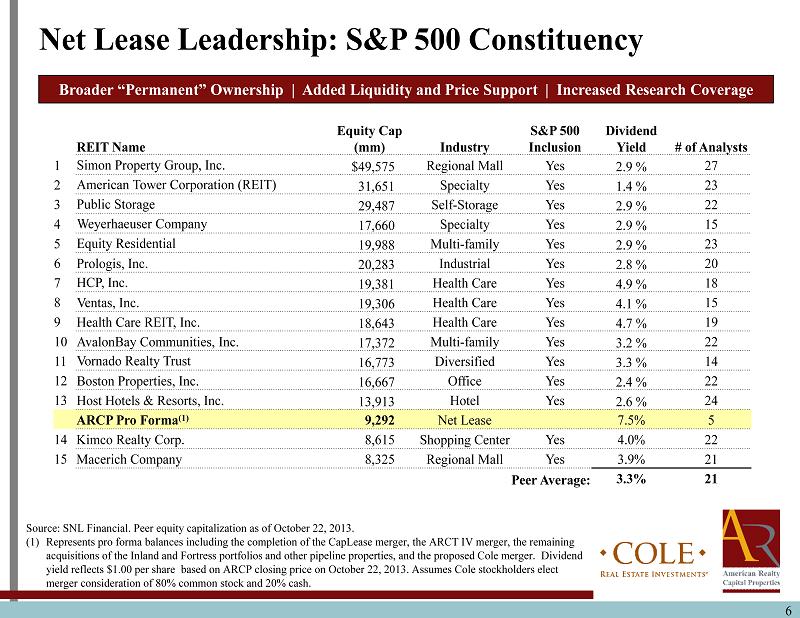
6 REIT Name Equity Cap (mm) Industry S&P 500 Inclusion Dividend Yield # of Analysts 1 Simon Property Group, Inc. $49,575 Regional Mall Yes 2.9 % 27 2 American Tower Corporation (REIT) 31,651 Specialty Yes 1.4 % 23 3 Public Storage 29,487 Self - Storage Yes 2.9 % 22 4 Weyerhaeuser Company 17,660 Specialty Yes 2.9 % 15 5 Equity Residential 19,988 Multi - family Yes 2.9 % 23 6 Prologis , Inc. 20,283 Industrial Yes 2.8 % 20 7 HCP, Inc. 19,381 Health Care Yes 4.9 % 18 8 Ventas , Inc. 19,306 Health Care Yes 4.1 % 15 9 Health Care REIT, Inc. 18,643 Health Care Yes 4.7 % 19 10 AvalonBay Communities, Inc. 17,372 Multi - family Yes 3.2 % 22 11 Vornado Realty Trust 16,773 Diversified Yes 3.3 % 14 12 Boston Properties, Inc. 16,667 Office Yes 2.4 % 22 13 Host Hotels & Resorts, Inc. 13,913 Hotel Yes 2.6 % 24 ARCP Pro Forma (1) 9,292 Net Lease 7.5% 5 14 Kimco Realty Corp. 8,615 Shopping Center Yes 4.0% 22 15 Macerich Company 8,325 Regional Mall Yes 3.9% 21 Peer Average: 3.3% 21 Broader “Permanent” Ownership | Added Liquidity and Price Support | Increased Research Coverage Net Lease Leadership: S&P 500 Constituency Source: SNL Financial. Peer equity capitalization as of October 22, 2013. (1) Represents pro forma balances including the completion of the CapLease merger, the ARCT IV merger, the remaining acquisitions of the Inland and Fortress portfolios and other pipeline properties, and the proposed Cole merger. Dividend yield reflects $1.00 per share based on ARCP closing price on October 22, 2013. Assumes Cole stockholders elect merger consideration of 80% common stock and 20% cash .

7 Net Lease Leadership: Greater MSCI US REIT Index (“RMZ ”) Weighting Source: SNL Financial as of October 22, 2013 . (1) ARCP represents pro forma balances including the completion of the CapLease merger, the ARCT IV merger, the remaining acquisitions of the Inland and Fortress portfolios and other pipeline properties. Assumes Cole stockholders elect merger consideration of 80% common stock and 20% cash . RMZ Top 15 | Superior Access to Capital | Enhanced Ability to Fund Future G rowth Company Market Cap (% of Total RMZ ) 3 - Month Avg. Daily Trading Volume ($ in millions) Dividend Yield Net Debt/ EBITDA 1 Simon Property Group 8.8% $195 2.9% 6.2x 2 Public Storage 5.3% 87 2.9% N/M 3 General Growth Properties 3.6% 69 2.7% 8.5x 4 Equity Residential 3.6% 93 2.9% 7.1x 5 Prologis 3.5% 87 2.8% 7.3x 6 HCP 3.5% 122 4.9% 5.4x 7 Ventas 3.4% 102 4.1% 5.2x 8 Health Care REIT 3.3% 110 4.7% 6.1x 9 AvalonBay Communities 3.1% 82 3.2% 5.7x 10 Vornado Realty Trust 3.0% 72 3.3% 6.9x 11 Boston Properties 3.0% 92 2.4% 6.6x 12 Host Hotels & Resorts 2.5% 112 2.6% 3.3x ARCP Pro Forma (1) 1.6% 156 7.5% 7.7x 13 SL Green Realty Corp 1.6% 60 2.2% 9.4x 14 Kimco Realty Corp 1.5% 69 4.0% 6.4x 15 Macerich Co 1.5% 50 3.9% 7.5x Top 15 51.2% $1,402 3.3% 6.6x
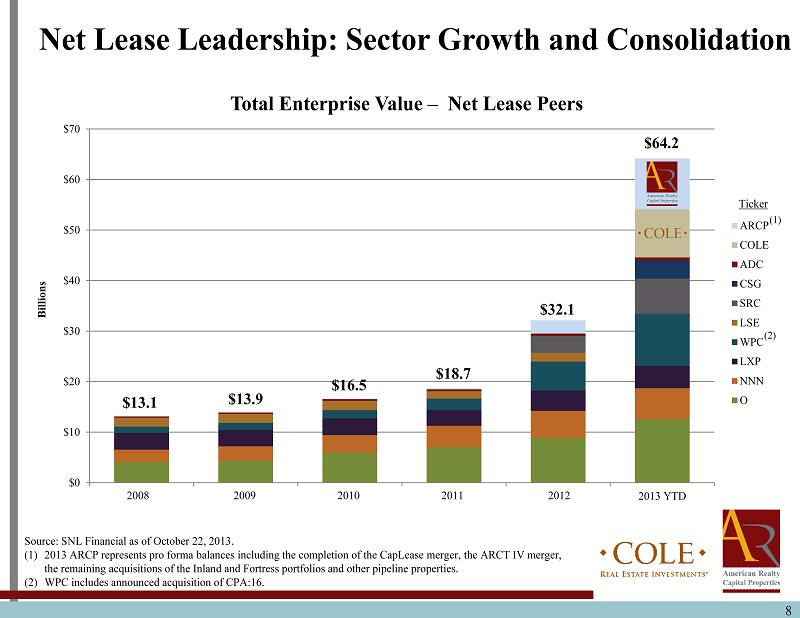
$0 $10 $20 $30 $40 $50 $60 $70 2008 FY 2009 FY 2010 FY 2011 FY 2012 FY 2013 YTD Billions Total Enterprise Value – Net Lease Peers ARCP COLE ADC CSG SRC LSE WPC LXP NNN O 8 Net Lease Leadership: Sector Growth and Consolidation Source: SNL Financial as of October 22, 2013. (1) 2013 ARCP r epresents pro forma balances including the completion of the CapLease merger, the ARCT IV merger, the remaining acquisitions of the Inland and Fortress portfolios and other pipeline properties. (2) WPC includes announced acquisition of CPA:16 . $13.1 $13.9 $16.5 $18.7 $32.1 $64.2 (1) Ticker (2) 2008 2009 2010 2011 2012
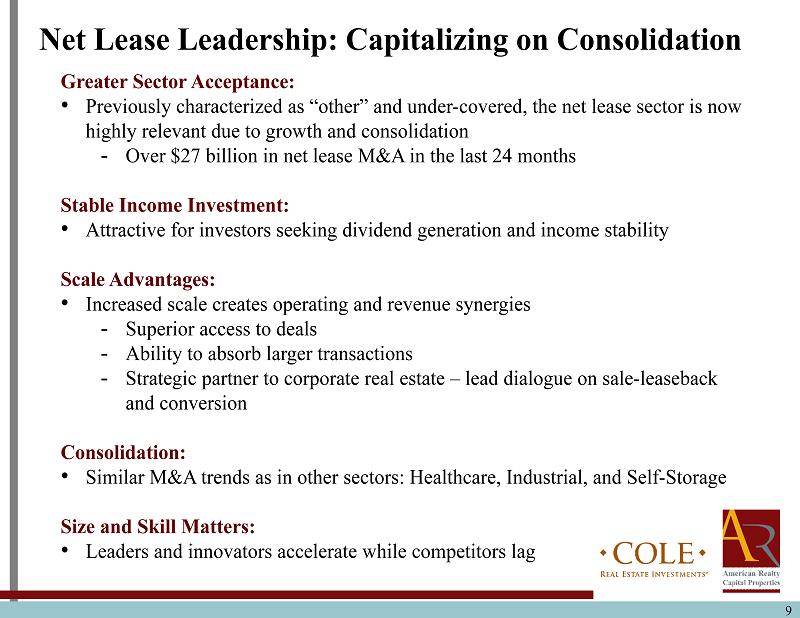
9 Net Lease Leadership: Capitalizing on Consolidation Greater Sector Acceptance: • Previously characterized as “other” and under - covered, the net lease sector is now highly relevant due to growth and consolidation - Over $27 billion in net lease M&A in the last 24 months Stable Income Investment: • Attractive for investors seeking dividend generation and income stability Scale Advantages: • Increased scale creates operating and revenue synergies - Superior access to deals - Ability to absorb larger transactions - Strategic partner to corporate real estate – lead dialogue on sale - leaseback and conversion Consolidation: • Similar M&A trends as in other sectors: Healthcare, Industrial, and Self - Storage Size and Skill Matters: • Leaders and innovators accelerate while competitors lag
Portfolio Statistics 10
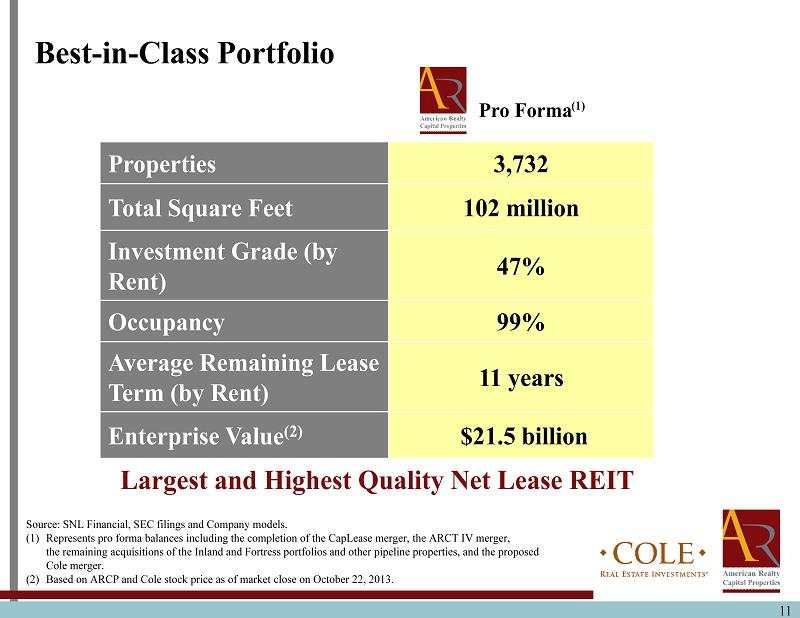
Properties 3,732 Total Square Feet 102 million Investment Grade (by Rent) 47% Occupancy 99% Average Remaining Lease Term (by Rent) 11 years Enterprise Value (2) $21.5 billion Pro Forma 11 Source: SNL Financial, SEC filings and Company models. (1) Represents pro forma balances including the completion of the CapLease merger, the ARCT IV merger, the remaining acquisitions of the Inland and Fortress portfolios and other pipeline properties, and the proposed Cole merger. (2) Based on ARCP and Cole stock price as of market close on October 22, 2013 . Best - in - Class Portfolio Largest and Highest Quality Net Lease REIT (1)
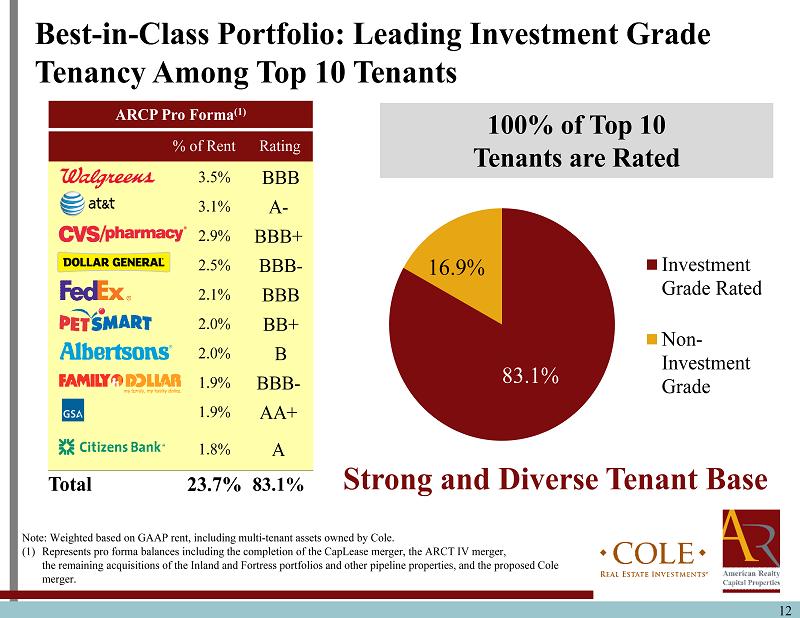
100% of Top 10 Tenants are Rated 12 ARCP Pro Forma (1) % of Rent Rating 3.5% BBB 3.1% A - 2.9% BBB+ 2.5% BBB - 2.1% BBB 2.0% BB+ 2.0% B 1.9% BBB - 1.9% AA+ 1.8% A Total 23.7% 83.1% Best - in - Class Portfolio: Leading Investment Grade Tenancy Among Top 10 Tenants Strong and Diverse Tenant Base Note: Weighted based on GAAP rent, including multi - tenant assets owned by Cole. (1) Represents pro forma balances including the completion of the CapLease merger, the ARCT IV merger, the remaining acquisitions of the Inland and Fortress portfolios and other pipeline properties, and the proposed Cole merger. 83.1% 16.9% Investment Grade Rated Non- Investment Grade
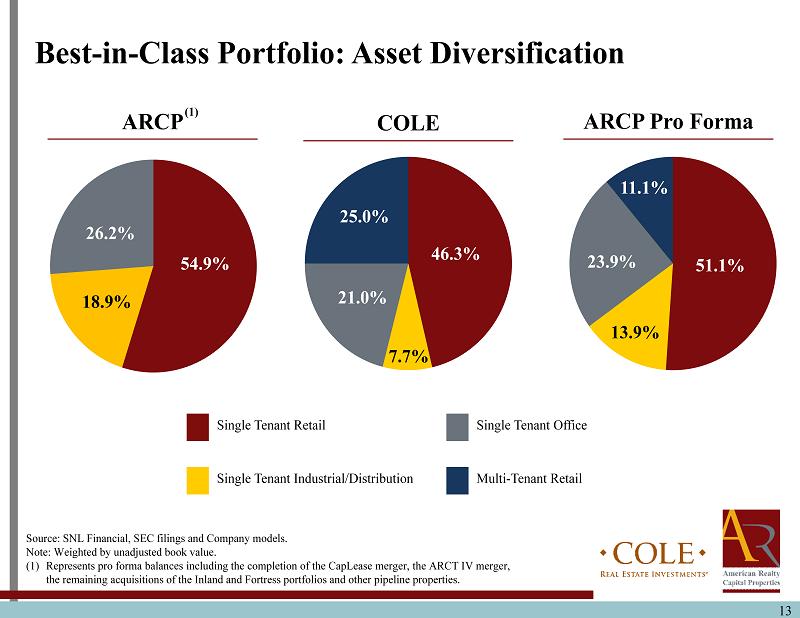
13 Single Tenant Retail Single Tenant Industrial/Distribution Single Tenant Office Multi - Tenant Retail 54.9% 26.2% 18.9% 23.9% 11.1% 51.1% 13.9% ARCP ARCP Pro Forma Source : SNL Financial, SEC filings and Company models . Note: Weighted by unadjusted book value. (1) Represents pro forma balances including the completion of the CapLease merger, the ARCT IV merger, the remaining acquisitions of the Inland and Fortress portfolios and other pipeline properties . Best - in - Class Portfolio: Asset Diversification COLE 46.3% 21.0% 25.0% 7.7% (1)
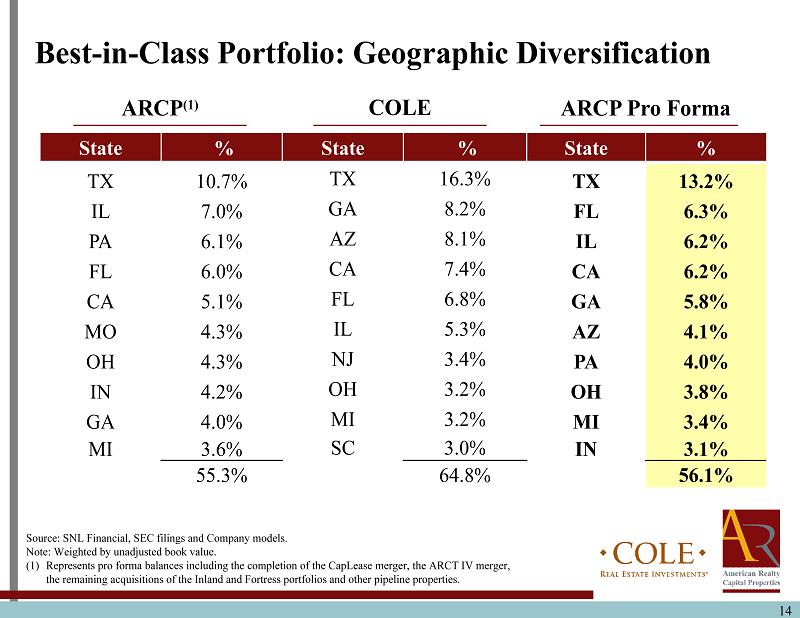
14 ARCP (1) ARCP Pro Forma COLE Best - in - Class Portfolio: Geographic D iversification State % State % State % TX 10.7% TX 16.3% TX 13.2% IL 7.0% GA 8.2% FL 6.3% PA 6.1% AZ 8.1% IL 6.2% FL 6.0% CA 7.4% CA 6.2% CA 5.1% FL 6.8% GA 5.8% MO 4.3% IL 5.3% AZ 4.1% OH 4.3% NJ 3.4% PA 4.0% IN 4.2% OH 3.2% OH 3.8% GA 4.0% MI 3.2% MI 3.4% MI 3.6% SC 3.0% IN 3.1% 55.3% 64.8% 56.1% Source : SNL Financial, SEC filings and Company models . Note: Weighted by unadjusted book value. (1) Represents pro forma balances including the completion of the CapLease merger, the ARCT IV merger, the remaining acquisitions of the Inland and Fortress portfolios and other pipeline properties.
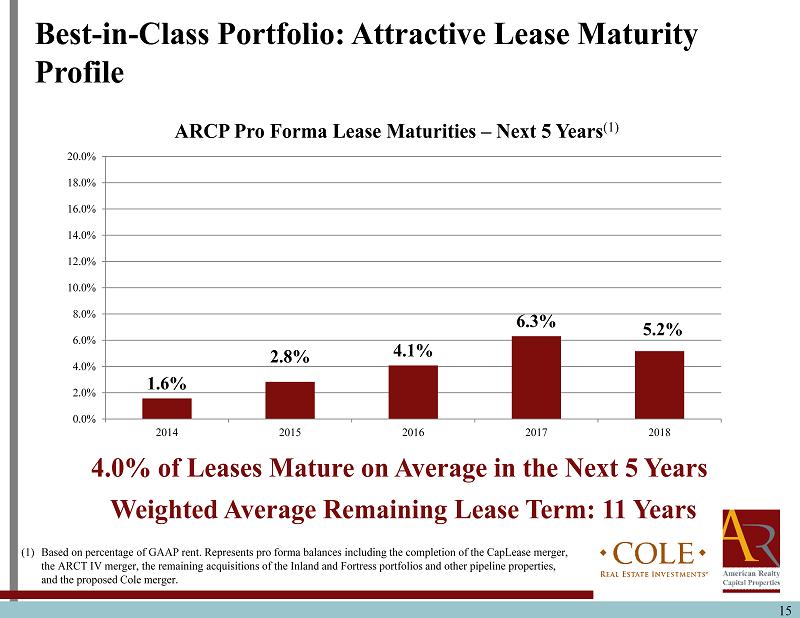
15 15 (1) Based on percentage of GAAP rent. Represents pro forma balances including the completion of the CapLease merger, the ARCT IV merger, the remaining acquisitions of the Inland and Fortress portfolios and other pipeline properties, and the proposed Cole merger. 4.0% of Leases Mature on Average in the Next 5 Years Best - in - Class Portfolio: Attractive Lease Maturity Profile Weighted Average Remaining Lease Term: 11 Years 1.6% 2.8% 4.1% 6.3% 5.2% 0.0% 2.0% 4.0% 6.0% 8.0% 10.0% 12.0% 14.0% 16.0% 18.0% 20.0% 2014 2015 2016 2017 2018 ARCP Pro Forma Lease Maturities – Next 5 Years (1)

Financial Analysis 16
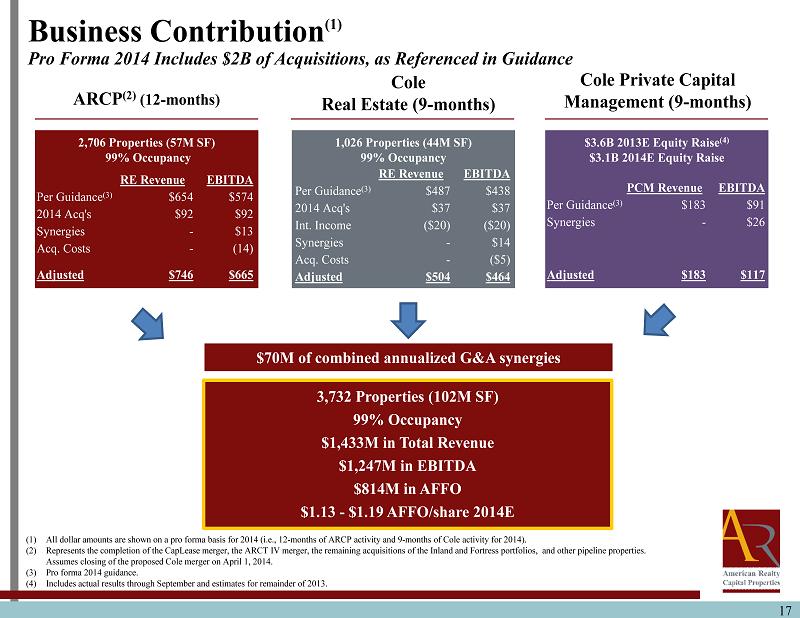
17 Business Contribution (1) Pro Forma 2014 Includes $2B of Acquisitions, as Referenced in Guidance 3,732 Properties (102M SF) 99% Occupancy $1,433M in Total Revenue $1,247M in EBITDA $814M in AFFO $1.13 - $1.19 AFFO/share 2014E ARCP (2) (12 - months) Cole Real Estate (9 - months) Cole Private Capital Management (9 - months) (1) All dollar amounts are shown on a pro forma basis for 2014 (i.e., 12 - months of ARCP activity and 9 - months of Cole activity for 2 014). (2) Represents the completion of the CapLease merger, the ARCT IV merger, the remaining acquisitions of the Inland and Fortress portfolios, and other pipeline properties. Assumes closing of the proposed Cole merger on April 1, 2014. (3) Pro forma 2014 guidance. (4) Includes actual results through September and estimates for remainder of 2013. 2,706 Properties (57M SF) 99 % Occupancy 1,026 Properties (44M SF) 99% Occupancy $ 3.6B 2013E Equity Raise (4) $3.1B 2014E Equity Raise $70M of combined annualized G&A synergies RE Revenue EBITDA Per Guidance (3) $ 654 $ 574 2014 Acq's $92 $92 Synergies - $ 13 Acq . Costs - (14) Adjusted $ 746 $665 RE Revenue EBITDA Per Guidance (3) $487 $438 2014 Acq's $37 $37 Int. Income ($ 20) ($ 20) Synergies - $14 Acq . Costs - ($5) Adjusted $504 $464 PCM Revenue EBITDA Per Guidance (3) $183 $91 Synergies - $26 Adjusted $183 $ 117
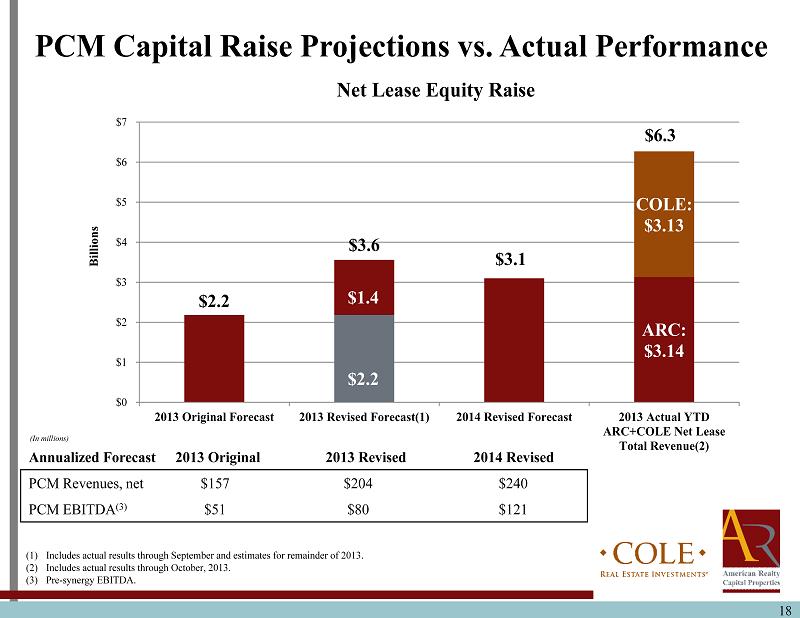
18 (1) Includes actual results through September and estimates for remainder of 2013. (2) Includes actual results through October, 2013. (3) Pre - synergy EBITDA. $2.2 $3.6 $3.1 ARC: $3.14 COLE: $3.13 $0 $1 $2 $3 $4 $5 $6 $7 2013 Original Forecast 2013 Revised Forecast(1) 2014 Revised Forecast 2013 Actual YTD ARC+COLE Net Lease Total Revenue(2) Billions Net Lease Equity Raise $1.4 $2.2 PCM Capital Raise Projections vs. Actual Performance Annualized Forecast 2013 Original 2013 Revised 2014 Revised PCM Revenues, net $157 $204 $240 PCM EBITDA (3) $51 $80 $121 (In millions) $6.3
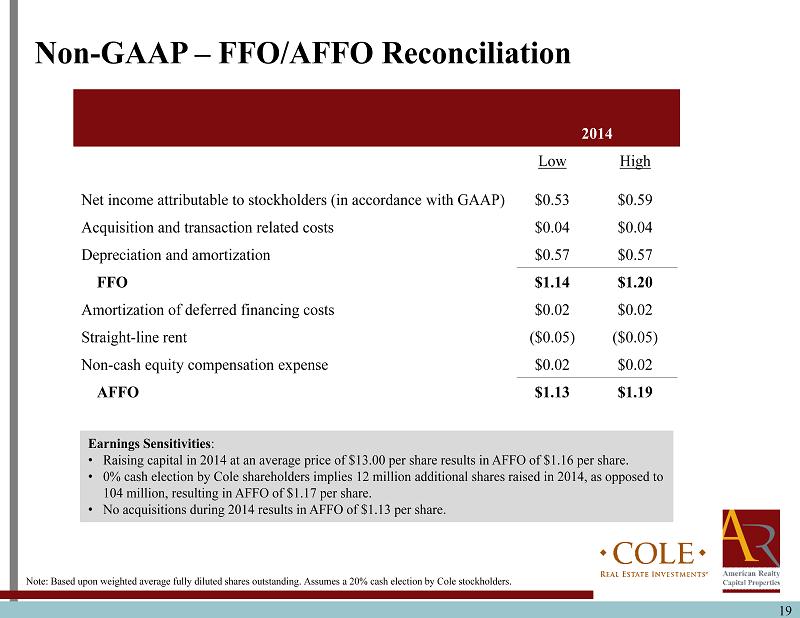
19 2014 Low High Net income attributable to stockholders (in accordance with GAAP) $0.53 $0.59 Acquisition and transaction related costs $0.04 $0.04 Depreciation and amortization $0.57 $0.57 FFO $1.14 $1.20 Amortization of deferred financing costs $0.02 $0.02 Straight - line rent ($0.05) ($0.05) Non - cash equity compensation expense $0.02 $0.02 AFFO $1.13 $1.19 Non - GAAP – FFO/AFFO Reconciliation Note: Based upon weighted average fully diluted shares outstanding. Assumes a 20% cash election by Cole stockholders. Earnings Sensitivities : • Raising capital in 2014 at an average price of $13.00 per share results in AFFO of $1.16 per share. • 0% cash election by Cole shareholders implies 12 million additional shares raised in 2014, as opposed to 104 million, resulting in AFFO of $1.17 per share. • No acquisitions during 2014 results in AFFO of $ 1.13 per share.
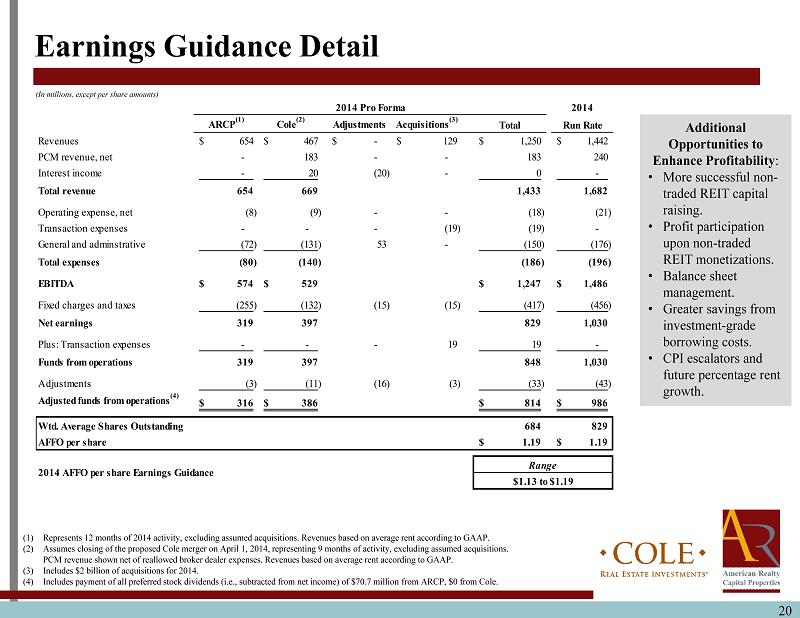
20 Earnings Guidance Detail (In millions, except per share amounts) Additional Opportunities to Enhance Profitability : • More successful non - traded REIT capital raising. • Profit participation upon non - traded REIT monetizations. • Balance sheet management. • Greater savings from investment - grade borrowing costs. • CPI escalators and future percentage rent growth. (1) Represents 12 months of 2014 activity, excluding assumed acquisitions. Revenues based on average rent according to GAAP. (2) Assumes closing of the proposed Cole merger on April 1, 2014, representing 9 months of activity, excluding assumed acquisitio ns. PCM revenue shown net of reallowed broker dealer expenses. Revenues based on average rent according to GAAP. (3) Includes $2 billion of acquisitions for 2014. (4) Includes payment of all preferred stock dividends (i.e., subtracted from net income ) of $70.7 million from ARCP, $0 from Cole. 2014 ARCP (1) Cole (2) Adjustments Acquisitions (3) Total Run Rate Revenues 654$ 467$ -$ 129$ 1,250$ 1,442$ PCM revenue, net - 183 - - 183 240 Interest income - 20 (20) - 0 - Total revenue 654 669 1,433 1,682 Operating expense, net (8) (9) - - (18) (21) Transaction expenses - - - (19) (19) - General and adminstrative (72) (131) 53 - (150) (176) Total expenses (80) (140) (186) (196) EBITDA 574$ 529$ 1,247$ 1,486$ Fixed charges and taxes (255) (132) (15) (15) (417) (456) Net earnings 319 397 829 1,030 Plus: Transaction expenses - - - 19 19 - Funds from operations 319 397 848 1,030 Adjustments (3) (11) (16) (3) (33) (43) Adjusted funds from operations (4) 316$ 386$ 814$ 986$ Wtd. Average Shares Outstanding 684 829 AFFO per share 1.19$ 1.19$ 2014 AFFO per share Earnings Guidance Range $1.13 to $1.19 2014 Pro Forma
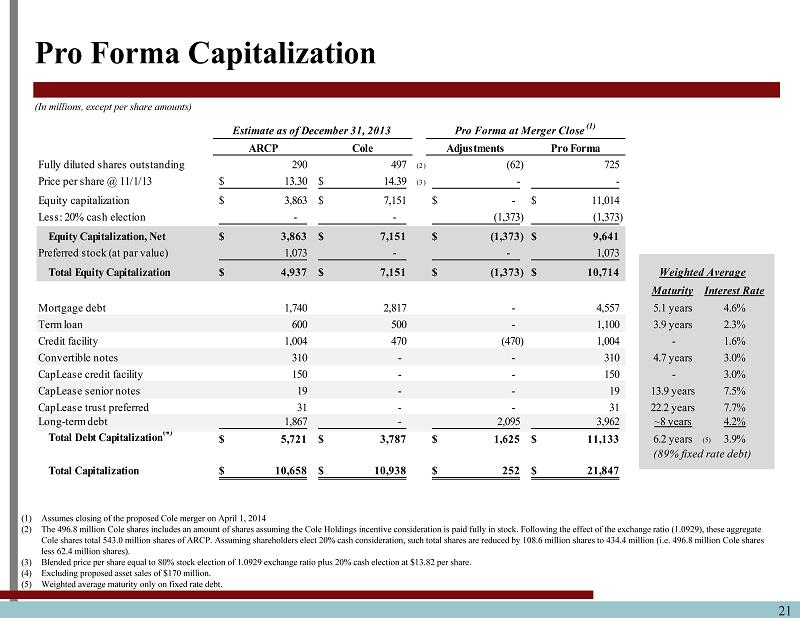
21 Pro Forma Capitalization (1) Assumes closing of the proposed Cole merger on April 1, 2014 (2) The 496.8 million Cole shares includes an amount of shares assuming the Cole Holdings incentive consideration is paid fully in stock. F oll owing the effect of the exchange ratio (1.0929), these aggregate Cole shares total 543.0 million shares of ARCP. Assuming shareholders elect 20% cash consideration, such total shares are reduced by 108.6 million shares to 434.4 million (i.e. 496.8 million Cole shares less 62.4 million shares). (3) Blended price per share equal to 80% stock election of 1.0929 exchange ratio plus 20% cash election at $13.82 per share. (4) Excluding proposed asset sales of $170 million. (5) Weighted average maturity only on fixed rate debt. (In millions, except per share amounts) Estimate as of December 31, 2013 Pro Forma at Merger Close (1)ARCP Cole Adjustments Pro Forma Fully diluted shares outstanding 290 497 (2) (62) 725 Price per share @ 11/1/13 13.30$ 14.39$ (3) - - Equity capitalization 3,863$ 7,151$ -$ 11,014$ Less: 20% cash election - - (1,373) (1,373) Equity Capitalization, Net 3,863$ 7,151$ (1,373)$ 9,641$ Preferred stock (at par value) 1,073 - - 1,073 Total Equity Capitalization 4,937$ 7,151$ (1,373)$ 10,714$ Maturity Interest Rate Mortgage debt 1,740 2,817 - 4,557 5.1 years 4.6% Term loan 600 500 - 1,100 3.9 years 2.3% Credit facility 1,004 470 (470) 1,004 - 1.6% Convertible notes 310 - - 310 4.7 years 3.0% CapLease credit facility 150 - - 150 - 3.0% CapLease senior notes 19 - - 19 13.9 years 7.5% CapLease trust preferred 31 - - 31 22.2 years 7.7% Long-term debt 1,867 - 2,095 3,962 ~8 years 4.2% Total Debt Capitalization (4) 5,721$ 3,787$ 1,625$ 11,133$ 6.2 years (5) 3.9% Total Capitalization 10,658$ 10,938$ 252$ 21,847$ (89% fixed rate debt) Weighted Average
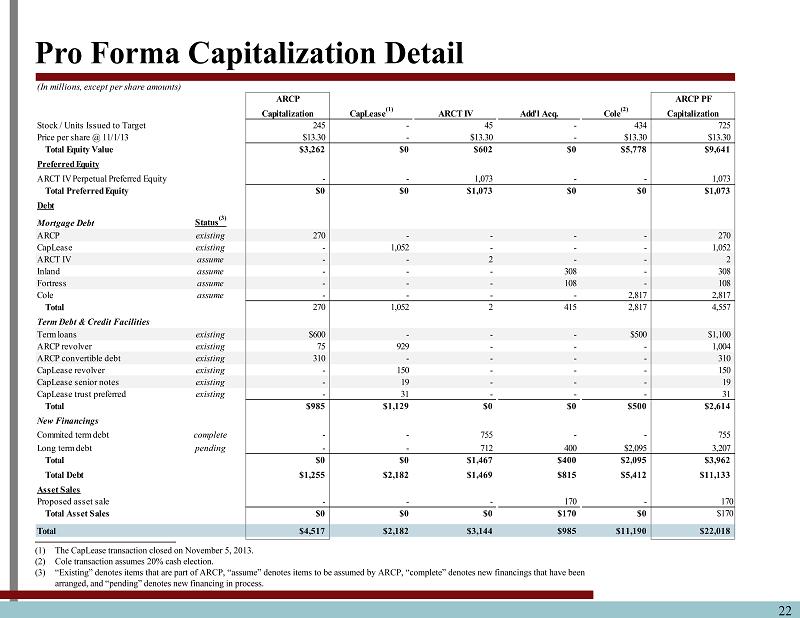
22 Pro Forma Capitalization Detail (1) The CapLease transaction closed on November 5, 2013. (2) Cole transaction assumes 20% cash election. (3) “Existing ” denotes items that are part of ARCP, “assume” denotes items to be assumed by ARCP, “complete” denotes new financings that h ave been arranged, and “pending” denotes new financing in process. (In millions, except per share amounts) ARCP ARCP PF Capitalization CapLease (1) ARCT IV Add'l Acq. Cole (2) Capitalization Stock / Units Issued to Target 245 - 45 - 434 725 Price per share @ 11/1/13 $13.30 - $13.30 - $13.30 $13.30 Total Equity Value $3,262 $0 $602 $0 $5,778 $9,641 Preferred Equity ARCT IV Perpetual Preferred Equity - - 1,073 - - 1,073 Total Preferred Equity $0 $0 $1,073 $0 $0 $1,073 Debt Mortgage Debt Status (3) ARCP existing 270 - - - - 270 CapLease existing - 1,052 - - - 1,052 ARCT IV assume - - 2 - - 2 Inland assume - - - 308 - 308 Fortress assume - - - 108 - 108 Cole assume - - - - 2,817 2,817 Total 270 1,052 2 415 2,817 4,557 Term Debt & Credit Facilities Term loans existing $600 - - - $500 $1,100 ARCP revolver existing 75 929 - - - 1,004 ARCP convertible debt existing 310 - - - - 310 CapLease revolver existing - 150 - - - 150 CapLease senior notes existing - 19 - - - 19 CapLease trust preferred existing - 31 - - - 31 Total $985 $1,129 $0 $0 $500 $2,614 New Financings Commited term debt complete - - 755 - - 755 Long term debt pending - - 712 400 $2,095 3,207 Total $0 $0 $1,467 $400 $2,095 $3,962 Total Debt $1,255 $2,182 $1,469 $815 $5,412 $11,133 Asset Sales Proposed asset sale - - - 170 - 170 Total Asset Sales $0 $0 $0 $170 $0 $170 Total $4,517 $2,182 $3,144 $985 $11,190 $22,018
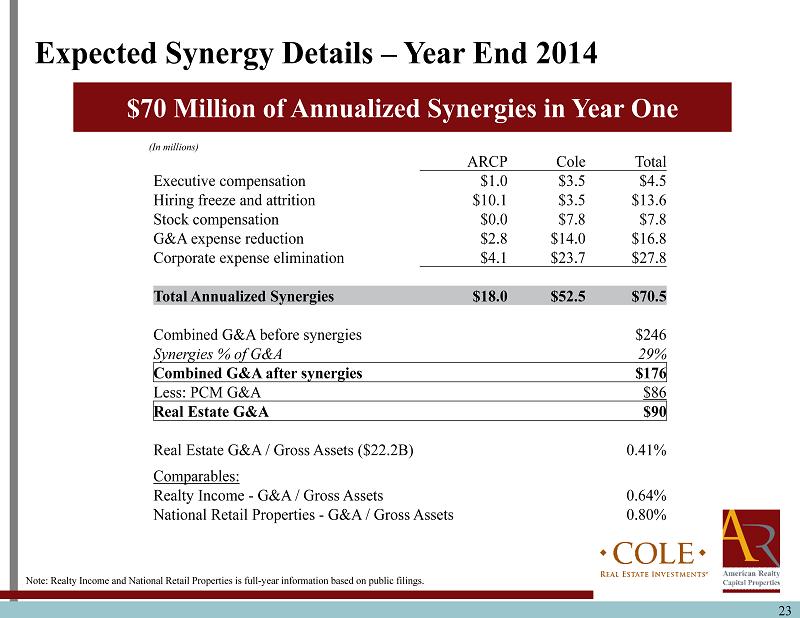
23 $70 Million of Annualized Synergies in Year One Expected Synergy Details – Year End 2014 Note: Realty Income and National Retail Properties is full - year information based on public filings. (In millions) ARCP Cole Total Executive compensation $1.0 $3.5 $4.5 Hiring freeze and attrition $10.1 $3.5 $13.6 Stock compensation $0.0 $7.8 $7.8 G&A expense reduction $2.8 $14.0 $16.8 Corporate expense elimination $4.1 $23.7 $27.8 Total Annualized Synergies $18.0 $52.5 $70.5 Combined G&A before synergies $246 Synergies % of G&A 29% Combined G&A after synergies $176 Less: PCM G&A $86 Real Estate G&A $90 Real Estate G&A / Gross Assets ($22.2B) 0.41% Comparables: Realty Income - G&A / Gross Assets 0.64% National Retail Properties - G&A / Gross Assets 0.80%
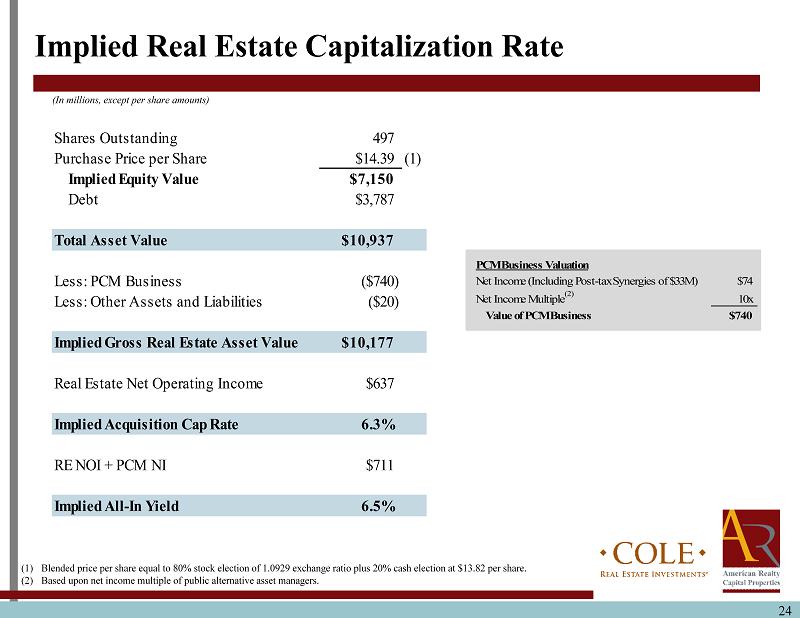
24 Implied Real Estate Capitalization Rate (In millions, except per share amounts) (1) Blended price per share equal to 80% stock election of 1.0929 exchange ratio plus 20% cash election at $13.82 per share. (2) Based upon net income multiple of public alternative asset managers. Shares Outstanding 497 Purchase Price per Share $14.39 (1) Implied Equity Value $7,150 Debt $3,787 Total Asset Value $10,937 Less: PCM Business ($740) Less: Other Assets and Liabilities ($20) Implied Gross Real Estate Asset Value $10,177 Real Estate Net Operating Income $637 Implied Acquisition Cap Rate 6.3% RE NOI + PCM NI $711 Implied All-In Yield 6.5% PCM Business Valuation Net Income (Including Post-tax Synergies of $33M) $74 Net Income Multiple (2) 10x Value of PCM Business $740
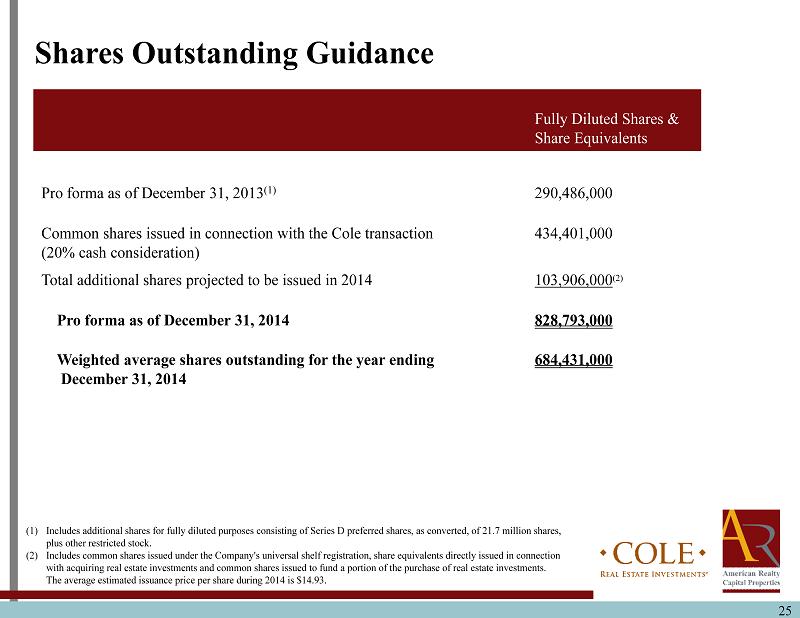
25 Shares Outstanding Guidance Fully Diluted Shares & Share Equivalents Pro forma as of December 31, 2013 (1) 290,486,000 Common shares issued in connection with the Cole transaction (20% cash consideration) 434,401,000 Total additional shares projected to be issued in 2014 103,906,000 (2) Pro forma as of December 31, 2014 828,793,000 Weighted average shares outstanding for the year ending December 31, 2014 684,431,000 (1) Includes additional shares for fully diluted purposes consisting of Series D preferred shares, as converted, of 21.7 million sha res, plus other restricted stock. (2) Includes common shares issued under the Company's universal shelf registration, share equivalents directly issued in connection with acquiring real estate investments and common shares issued to fund a portion of the purchase of real estate investments. The average estimated issuance price per share during 2014 is $14.93.

Moving Toward Self - Management 26
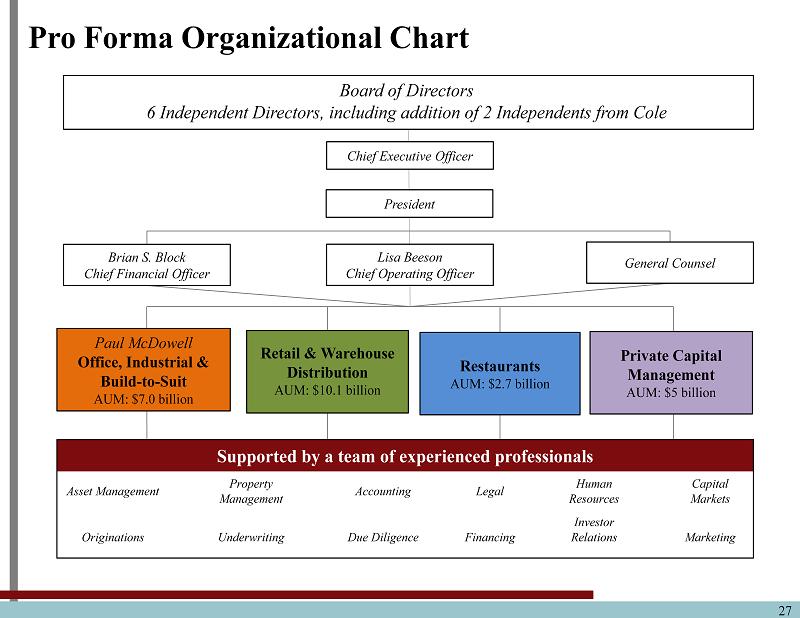
27 Paul McDowell Office , Industrial & Build - to - Suit AUM: $7.0 billion Retail & Warehouse Distribution AUM: $10.1 billion Restaurants AUM: $2.7 billion Private Capital Management AUM: $5 billion General Counsel Lisa Beeson Chief Operating Officer Brian S. Block Chief Financial Officer President Pro Forma Organizational Chart Supported by a team of experienced professionals Asset Management Property Management Accounting Legal Human Resources Capital Markets Originations Underwriting Due Diligence Financing Investor Relations Marketing Board of Directors 6 Independent Directors, including addition of 2 Independents from Cole Chief Executive Officer
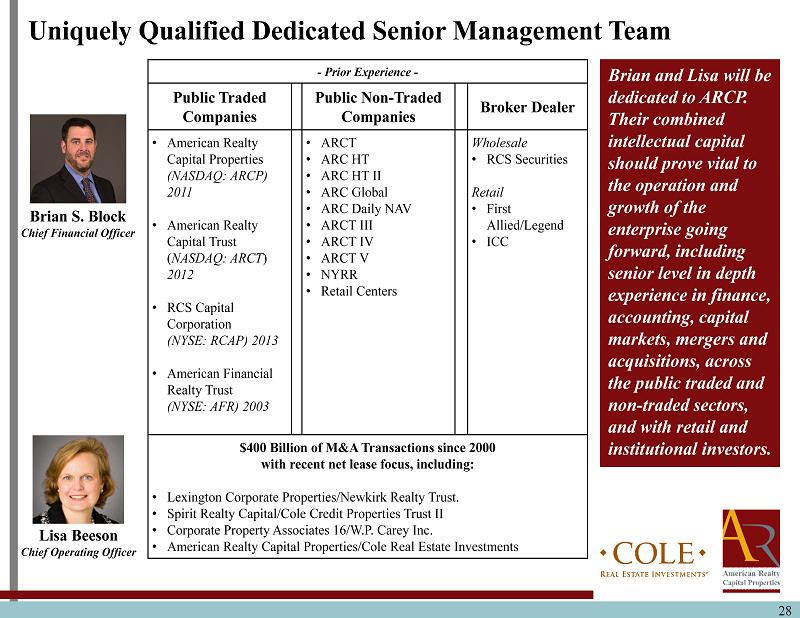
28 Uniquely Qualified Dedicated Senior Management Team - Prior Experience - Public Traded Companies Public Non - Traded Companies Broker Dealer • American Realty Capital Properties (NASDAQ: ARCP) 2011 • American Realty Capital Trust ( NASDAQ: ARCT ) 2012 • RCS Capital Corporation (NYSE: RCAP) 2013 • American Financial Realty Trust (NYSE: AFR) 2003 • ARCT • ARC HT • ARC HT II • ARC Global • ARC Daily NAV • ARCT III • ARCT IV • ARCT V • NYRR • Retail Centers Wholesale • RCS Securities Retail • First Allied /Legend • ICC $400 Billion of M&A Transactions since 2000 with recent net lease focus, including: • Lexington Corporate Properties/Newkirk Realty Trust. • Spirit Realty Capital/Cole Credit Properties Trust II • Corporate Property Associates 16/W.P. Carey Inc. • American Realty Capital Properties/Cole Real Estate Investments Brian S. Block Chief Financial Officer Lisa Beeson Chief Operating Officer Brian and Lisa will be dedicated to ARCP. Their combined intellectual capital should prove vital to the operation and growth of the enterprise going forward, including senior level in depth experience in finance, accounting, capital markets, mergers and acquisitions, across the public traded and non - traded sectors, and with retail and institutional investors.

29 Brian S. Block – Chief Financial Officer Uniquely qualified financial executive with 20 years experience, including public and corporate accounting, and as chief financial officer of public - traded and non - traded companies; skill set includes wholesale and retail broker dealer issues, SEC and FINRA matters, and integration of corporate and portfolio assets, systems and management teams. Public Accounting Experience • 1994 to 2000 – Ernst & Young and Arthur Andersen • Focused on initial public offerings, material capital markets events, mergers and acquisitions Corporate Accounting Experience • 2001 – CFO venture capital - backed technology company • 2002 to 2007 – American Financial Realty Trust – Chief Accounting Officer • Led initial public offering 2003 on NYSE • Oversaw implementation of Sarbanes - Oxley 2004 • Responsible for all SEC filings • Supervised integration of over $ 4 billion of acquired real estate investments • Managed technology system conversions and all application integrations Chief Financial Officer Experience • Public Traded Companies : American Realty Capital Properties (NASDAQ: ARCP) and RCS Capital Corporation (NYSE: RCAP) • Public Non - Traded Companies: Multiple public non - traded REITs; internalized and listed ARCT I; integrated ARCT III, ARCT IV, CapLease and significant property portfolios in ARCP; over $10 billion of acquired real estate • Wholesale Broker Dealer : Realty Capital Securities (“RCS”), a FINRA licensed wholesale broker dealer (formed 2008); operating subsidiary of RCAP; leading dealer manager for multiple non - traded REIT offerings; experienced in due diligence process performed by independent broker dealers • SEC/FINRA : Deep experience with SEC and FINRA regulations and compliance matters • Integration : Supervised integration of $12 billion of equity raised within private capital management arena • 2007 to Present – CFO/Partner AR Capital, privately - owned holding company
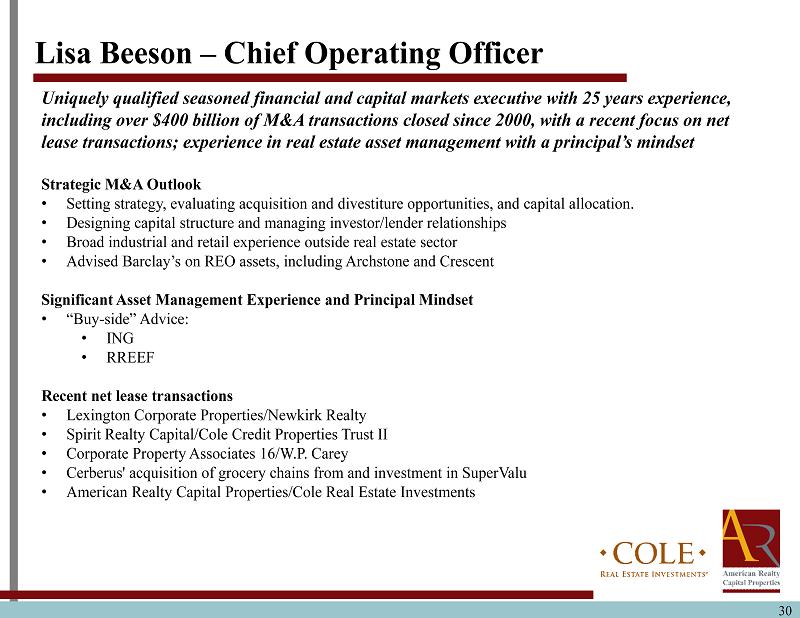
30 Lisa Beeson – Chief Operating Officer Uniquely qualified seasoned financial and capital markets executive with 25 years experience, including over $400 billion of M&A transactions closed since 2000, with a recent focus on net lease transactions; experience in real estate asset management with a principal’s mindset Strategic M&A Outlook • Setting strategy, evaluating acquisition and divestiture opportunities, and capital allocation. • Designing capital structure and managing investor/lender relationships • Broad industrial and retail experience outside real estate sector • Advised Barclay’s on REO assets, including Archstone and Crescent Significant Asset Management Experience and Principal Mindset • “Buy - side” Advice: • ING • RREEF Recent net lease transactions • Lexington Corporate Properties/Newkirk Realty • Spirit Realty Capital/Cole Credit Properties Trust II • Corporate Property Associates 16/W.P. Carey • Cerberus ' acquisition of grocery chains from and investment in SuperValu • American Realty Capital Properties/Cole Real Estate Investments
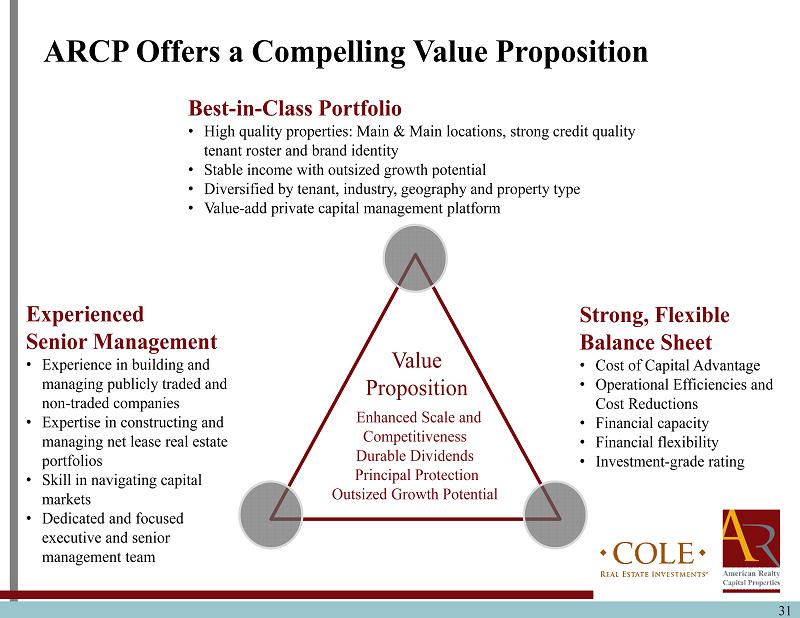
31 Experienced Senior Management • Experience in building and managing publicly traded and non - traded companies • Expertise in constructing and managing net lease real estate portfolios • Skill in navigating capital markets • Dedicated and focused executive and senior management team Best - in - Class Portfolio • High quality properties: Main & Main locations, strong credit quality tenant roster and brand identity • Stable income with outsized growth potential • Diversified by tenant, industry, geography and property type • Value - add private capital management platform Value Proposition Enhanced Scale and Competitiveness Durable Dividends Principal Protection Outsized Growth Potential Strong, Flexible Balance Sheet • Cost of Capital Advantage • Operational Efficiencies and Cost Reductions • Financial capacity • Financial flexibility • Investment - grade rating ARCP Offers a Compelling Value Proposition

32 Funds from Operations and Adjusted Funds from Operations ARCP considers funds from operations (“FFO”) and AFFO, which is FFO as adjusted to exclude acquisition - related fees and expenses, amortization of above - market lease assets and liabilities, amortization of deferred financing costs, straight - line rent, non - cash mark - to - market adjustments, amortization of restricted stock, non - cash compensation and gains and losses useful indicators of the performance of a REIT . Because FFO calculations exclude such factors as depreciation and amortization of real estate assets and gains or losses from sales of operating real estate assets (which can vary among owners of identical assets in similar conditions based on historical cost accounting and useful - life estimates), they facilitate comparisons of operating performance between periods and between other REITs in our peer group . Accounting for real estate assets in accordance with generally accepted accounting principles (“GAAP”) implicitly assumes that the value of real estate assets diminishes predictably over time . Since real estate values have historically risen or fallen with market conditions, many industry investors and analysts have considered the presentation of operating results for real estate companies that use historical cost accounting to be insufficient by themselves . FFO and AFFO are not in accordance with, or a substitute for, measures prepared in accordance with GAAP, and may be different from non - GAAP measures used by other companies . In addition, FFO and AFFO are not based on any comprehensive set of accounting rules or principles . Non - GAAP measures, such as FFO and AFFO, have limitations in that they do not reflect all of the amounts associated with ARCP's results of operations that would be reflected in measures determined in accordance with GAAP . These measures should only be used to evaluate ARCP's performance in conjunction with corresponding GAAP measures . Additionally, ARCP believes that AFFO, by excluding acquisition - related fees and expenses, amortization of above - market lease assets and liabilities, amortization of deferred financing costs, straight - line rent, non - cash mark - to - market adjustments, amortization of restricted stock, non - cash compensation and gains and losses, provides information consistent with management's analysis of the operating performance of the properties . By providing AFFO, ARCP believes it is presenting useful information that assists investors and analysts to better assess the sustainability of our operating performance . Further, ARCP believes AFFO is useful in comparing the sustainability of our operating performance with the sustainability of the operating performance of other real estate companies, including exchange - traded and non - traded REITs . As a result, ARCP believes that the use of FFO and AFFO, together with the required GAAP presentations, provide a more complete understanding of our performance relative to our peers and a more informed and appropriate basis on which to make decisions involving operating, financing, and investing activities .

33 This communication does not constitute an offer to sell or the solicitation of an offer to buy any securities or a solicitation of any vote or approval . In connection with the proposed Cole merger, ARCP and Cole expect to prepare and file with the SEC a registration statement on Form S - 4 containing a joint proxy statement/prospectus and other documents with respect to ARCP’s proposed acquisition of Cole . The joint proxy/prospectus will contain important information about the proposed transaction and related matters . INVESTORS ARE URGED TO READ THE JOINT PROXY STATEMENT/PROSPECTUS (INCLUDING ALL AMENDMENTS AND SUPPLEMENTS THERETO) AND OTHER RELEVANT DOCUMENTS FILED BY ARCP OR COLE WITH THE SEC CAREFULLY IF AND WHEN THEY BECOME AVAILABLE BECAUSE THEY WILL CONTAIN IMPORTANT INFORMATION ABOUT ARCP, COLE AND THE PROPOSED COLE MERGER . Investors and stockholders of ARCP and Cole may obtain free copies of the registration statement, the joint proxy statement/prospectus and other relevant documents filed by ARCP and Cole with the SEC (if and when they become available) through the website maintained by the SEC at www . sec . gov . Copies of the documents filed by ARCP with the SEC are also available free of charge on ARCP’s website at www . arcpreit . com and copies of the documents filed by Cole with the SEC are available free of charge on Cole’s website at www . ColeREIT . com . ARCP , Cole, AR Capital, LLC and their respective directors and executive officers may be deemed to be participants in the solicitation of proxies from ARCP’s and Cole’s stockholders in respect of the proposed Cole merger . Information regarding ARCP’s directors and executive officers can be found in ARCP’s definitive proxy statement filed with the SEC on April 30 , 2013 . Information regarding Cole’s directors and executive officers can be found in Cole’s definitive proxy statement filed with the SEC on April 11 , 2013 . Additional information regarding the interests of such potential participants will be included in the joint proxy statement/prospectus and other relevant documents filed with the SEC in connection with the proposed Cole merger if and when they become available . These documents are available free of charge on the SEC’s website and from ARCP or Cole, as applicable, using the sources indicated above . Additional Information about the Cole Merger and Where to Find It
34 This communication does not constitute an offer to sell or the solicitation of an offer to buy any securities or a solicitation of any vote or approval . In connection with the proposed ARCT IV merger, ARCP and ARCT IV expect to prepare and file with the SEC an amendment to their proxy statement/prospectus and ARCP expects to prepare and file with the SEC an amendment to its registration statement on Form S - 4 and other documents with respect to ARCP’s proposed acquisition of ARCT IV . INVESTORS ARE URGED TO READ THE PROXY STATEMENT/PROSPECTUS AND REGISTRATION STATEMENT (INCLUDING ALL AMENDMENTS AND SUPPLEMENTS THERETO) AND OTHER RELEVANT DOCUMENTS FILED WITH THE SEC IF AND WHEN THEY BECOME AVAILABLE BECAUSE THEY WILL CONTAIN IMPORTANT INFORMATION ABOUT THE PROPOSED ARCT IV MERGER . Investors may obtain free copies of the registration statement, the proxy statement/prospectus and other relevant documents filed by ARCP and ARCT IV with the SEC (if and when they become available) through the website maintained by the SEC at www . sec . gov . Copies of the documents filed by ARCP with the SEC are also available free of charge on ARCP’s website at www . arcpreit . com and copies of the documents filed by ARCT IV with the SEC are available free of charge on ARCT IV’s website at www . arct - 4 . com . ARCP , ARCT IV, AR Capital, LLC and their respective directors and executive officers may be deemed to be participants in the solicitation of proxies from ARCT IV’s stockholders in respect of the proposed ARCT IV merger . Information regarding ARCP’s directors and executive officers can be found in ARCP’s definitive proxy statement filed with the SEC on April 30 , 2013 . Information regarding ARCT IV’s directors and executive officers can be found in ARCT IV’s definitive proxy statement filed with the SEC on April 30 , 2013 . Additional information regarding the interests of such potential participants will be included in the proxy statement/prospectus, the registration statement and other relevant documents filed with the SEC in connection with the proposed ARCT IV merger if and when they become available . These documents are available free of charge on the SEC’s website and from ARCP or ARCT IV, as applicable, using the sources indicated above . Additional Information about the ARCT IV Merger and Where to Find It