Attached files
| file | filename |
|---|---|
| 8-K - FORM 8-K - PEABODY ENERGY CORP | btu_8-k20131112.htm |
Exhibit 99.1

Life Empowered
Cowen Securities Global Metals, Mining & Materials Conference
November 12, 2013
Vic Svec Senior Vice President Global Investor and Corporate Relations
Peabody Energy
Statement on Forward-Looking Information Peabody Energy
The use of the words “Peabody,” “the company,” “our” and “we” relate to Peabody Energy Corporation, its subsidiaries and majority-owned affiliates. Certain statements in this presentation are forward-looking within the meaning of Section 27A of the Securities Act of 1933 and Section 21E of the Securities Exchange Act of 1934, as amended, and are intended to come within the safe harbor protection provided by those sections. The company uses words such as “anticipate,” “believe,” “expect,” “may,” “forecast,” “project,” “should,” “estimate,” “plan” or “outlook” or other similar words to identify forward-looking statements. These forward-looking statements are based on numerous assumptions that the company believes are reasonable, but they are open to a wide range of uncertainties and business risks that may cause actual results to differ materially from expectations as of November 12, 2013. These factors are difficult to accurately predict and may be beyond the company’s control. The company does not undertake to update its forward-looking statements. Factors that could affect the company’s results include, but are not limited to: global supply and demand for coal, including the seaborne thermal and metallurgical coal markets; price volatility, particularly in higher-margin products and in the company’s trading and brokerage businesses; impact of alternative energy sources, including natural gas and renewables; global steel demand and the downstream impact on metallurgical coal prices; impact of weather and natural disasters on demand, production and transportation; reductions and/or deferrals of purchases by major customers and ability to renew sales contracts; credit and performance risks associated with customers, suppliers, contract miners, co-shippers, and trading, banks and other financial counterparties; geologic, equipment, permitting, site access and operational risks related to mining; transportation availability, performance and costs; availability, timing of delivery and costs of key supplies, capital equipment or commodities such as diesel fuel, steel, explosives and tires; impact of take-or-pay agreements with rail and port commitments for the delivery of coal; successful implementation of business strategies; negotiation of labor contracts, employee relations and workforce availability; changes in postretirement benefit and pension obligations and funding requirements; replacement and development of coal reserves; availability, access to and related cost of capital and financial markets; effects of changes in interest rates and currency exchange rates (primarily the Australian dollar); effects of acquisitions or divestitures; economic strength and political stability of countries in which we have operations or serve customers; legislation, regulations and court decisions or other government actions, including, but not limited to, new environmental and mine safety requirements; changes in income tax regulations, sales-related royalties, or other regulatory taxes and changes in derivative laws and regulations; litigation, including claims not yet asserted; terrorist attacks or security threats; impact of pandemic illnesses and other factors detailed in the company's reports filed with the Securities and Exchange Commission.
Adjusted EBITDA is defined as (loss) income from continuing operations before deducting net interest expense, income taxes, asset retirement obligation expenses, depreciation, depletion and amortization, asset impairment and mine closure costs and amortization of basis difference related to equity affiliates. Adjusted EBITDA, which is not calculated identically by all companies, is not a substitute for operating income, net income or cash flow as determined in accordance with United States generally accepted accounting principles. Management uses Adjusted EBITDA as the primary metric to measure segment operating performance and also believes it is useful to investors in evaluating the company’s operating performance without regard to its capital structure or the cost basis of its assets.
Adjusted Income from Continuing Operations and Adjusted Diluted EPS are defined as income (loss) from continuing operations and diluted earnings per share from continuing operations, respectively, excluding the impacts of asset impairment and mine closure costs, net of tax, and the remeasurement of foreign income tax accounts on our income tax provision. The income tax benefits related to asset impairment and mine closure costs are calculated based on the enacted tax rate in the jurisdiction in which they have been or will be realized, adjusted for the estimated recoverability of those benefits. Management has included these measures because, in the opinion of management, excluding those foregoing items is useful in comparing the company's current results with those of prior and future periods. Management also believes that excluding the impact of the remeasurement of foreign income tax accounts represents a meaningful indicator of the company's ongoing effective tax rate.
11/12/13
2
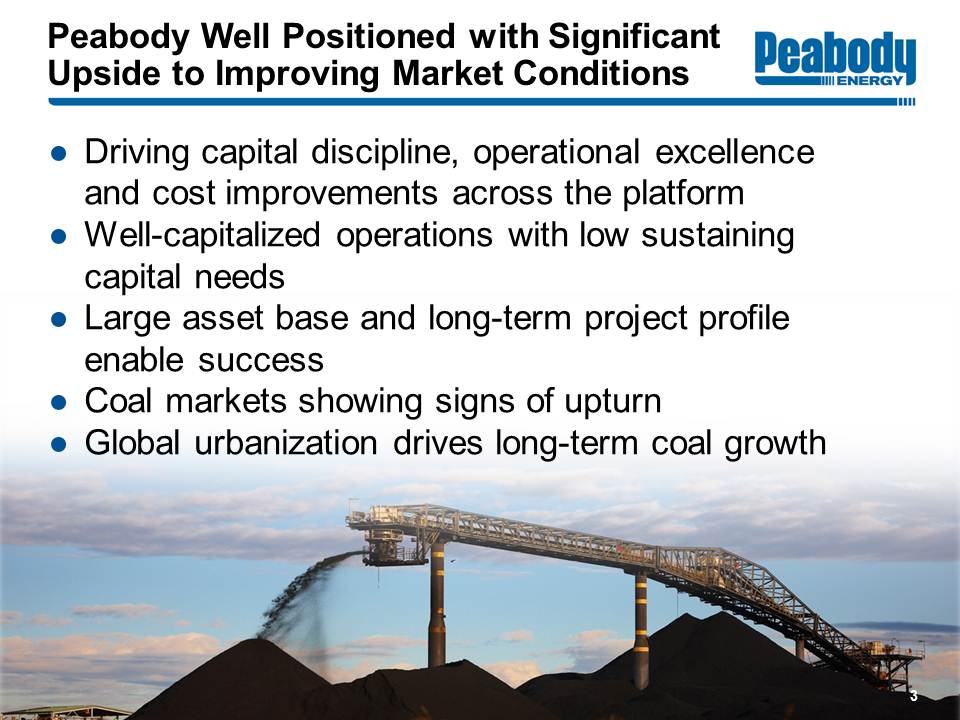
Peabody Well Positioned with Significant Upside to Improving Markets
Peabody Energy
Driving capital discipline, operational excellence and cost improvements across the platform
Well-capitalized operations with low sustaining capital needs
Large asset base and long-term project profile enable success
Coal markets showing signs of upturn
Global urbanization drives long-term coal growth
3

Global Coal Markets
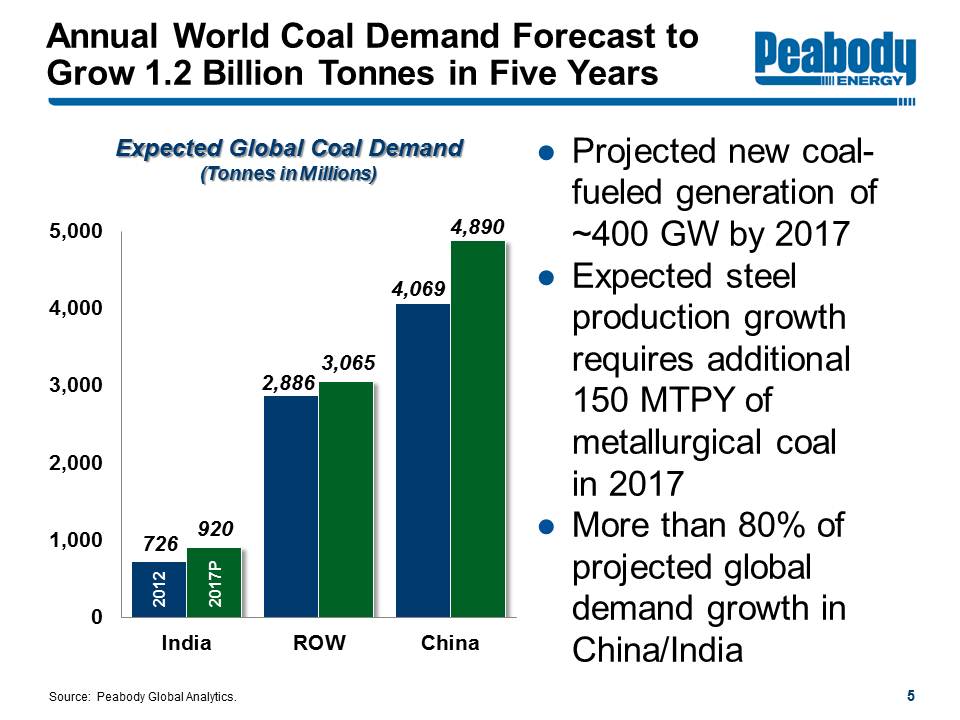
Annual World Coal Demand Forecast to Grow 1.2 Billion Tonnes in Five Years
Peabody Energy
Expected Global Coal Demand (Tonnes in Millions) 0 1,000 2,000 3,000 4,000 5,000
India ROW China
2012 726 2,886 4,069 2017P 920 3,065 4,890
Projected new coal-fueled generation of ~400 GW by 2017
Expected steel production growth requires additional 150 MTPY of metallurgical coal in 2017
More than 80% of projected global demand growth in China/India
Source: Peabody Global Analytics.
5
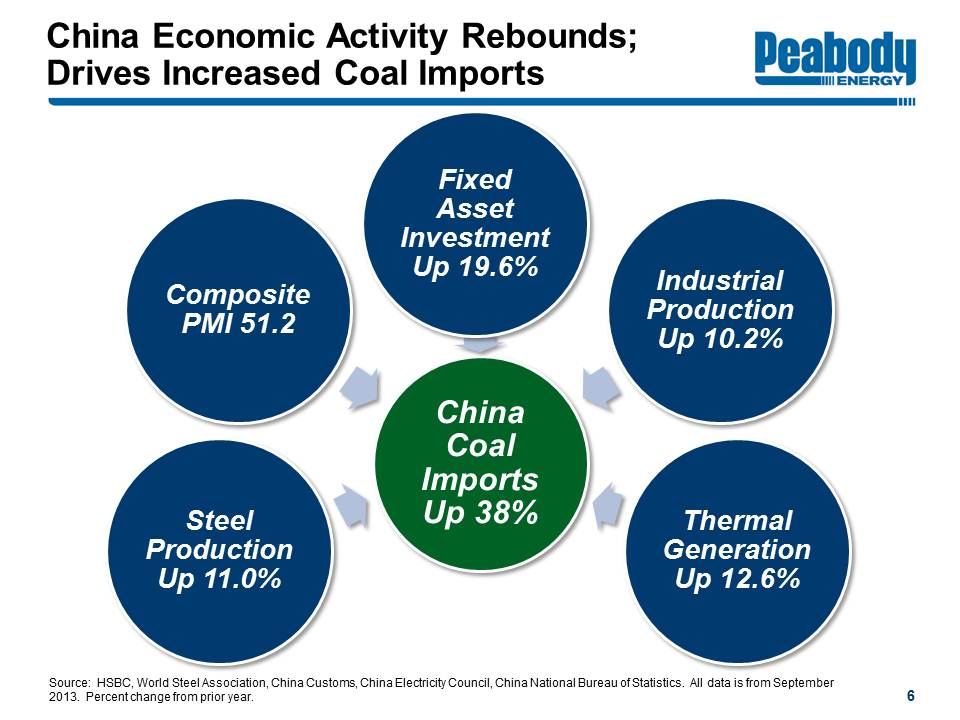
China Economic Activity Rebounds; Drives Increased Coal Imports
Peabody Energy
Steal Production Up 11.0%
Composite PMI 51.2
Fixed Asset Investment Up 19.6%
Industrial Production Up 10.2%
Thermal Generation Up 12.6%
China Coal Imports Up 38%
Source: HSBC, World Steel Association, China Customs, China Electricity Council, China National Bureau of Statistics. All data is from September 2013. Percent change from prior year.
6
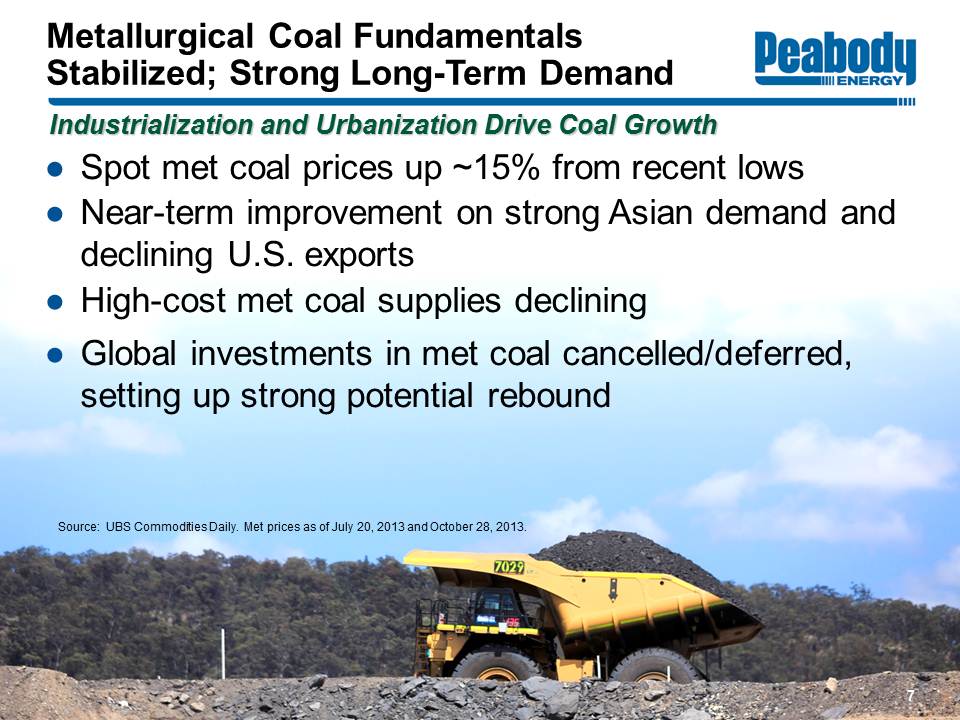
Metallurgical Coal Fundamentals Stabilized; Strong Long-Term Demand
Peabody Energy
Industrialization and Urbanization Drive Coal Growth
Spot met prices up ~15% from recent lows
Near-term markets improving on strong Asian demand and declining U.S. exports
High-cost met coal supplies declining
Global investments in met coal cancelled/deferred, setting up strong potential rebound
Source: UBS Commodities Daily. Met prices as of July 20, 2013 and October 28, 2013.
7
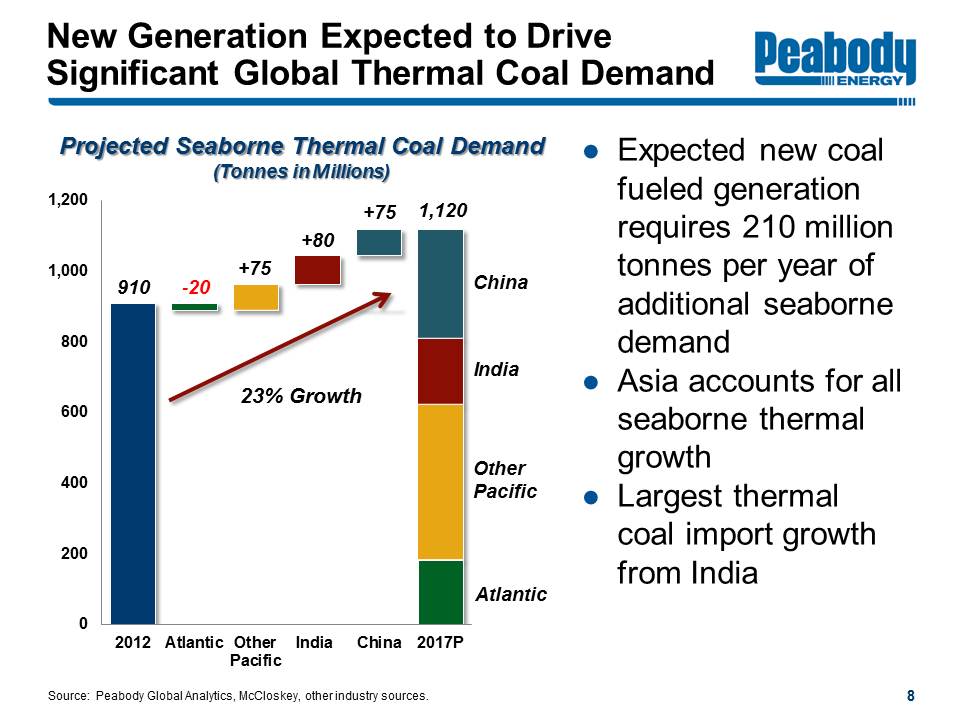
New Generation Expected to Drive Significant Global Thermal Coal Demand
Peabody Energy
Projected Seaborne Thermal Coal Demand (Tonnes in Millions)
2012 Atlantic Other Pacific India China 2017P
0 200 400 600 800 1,000 1,200
23% Growth
910 -20 +75 +80 +75 1,120
Expected new coal fueled generation requires 210 million tonnes per year of additional seaborne demand
Asia accounts for all seaborne thermal growth
Largest thermal coal import growth from India
Source: Peabody Global Analytics, McCloskey, other industry sources.
8
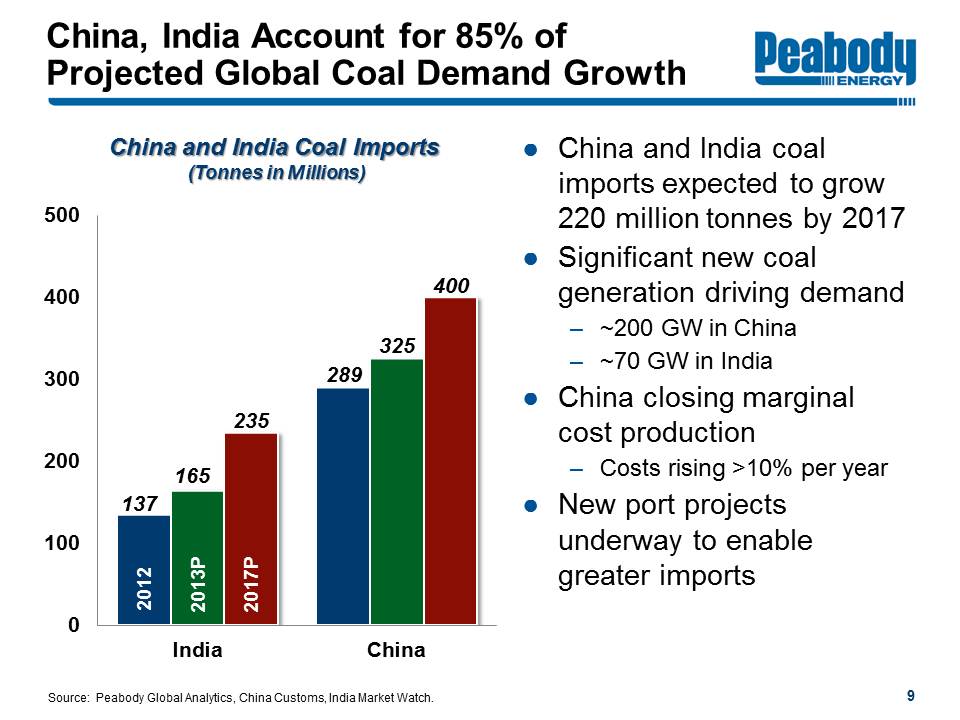
China, India Account for 85% of Projected Global Coal Demand Growth
Peabody Energy
China and India Coal Imports (Tonnes in Millions)
India China 0 100 200 300 400 500 2012 2013P 2017P
137 165 235 289 325 400
China and India coal imports expected to grow 220 million tonnes by 2017
Significant new coal generation driving demand ~225 GW in China ~70 GW in India
China closing marginal cost production Costs rising >10% per year
New port projects underway to enable greater imports
Source: Peabody Global Analytics, China Customs, India Market Watch.
9
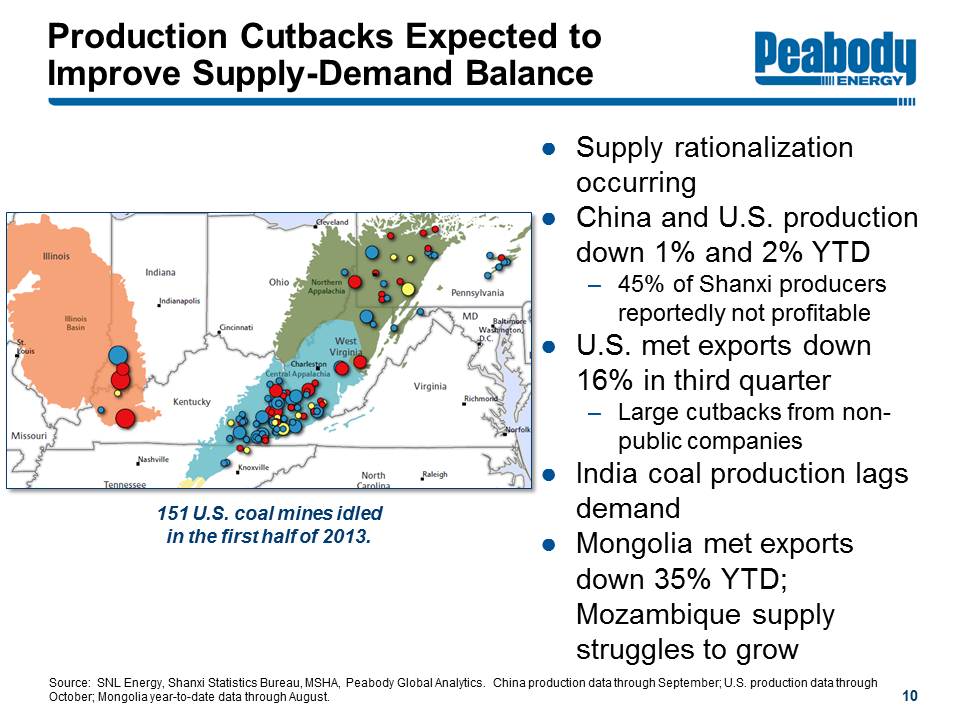
Production Cutbacks Expected to Improve Supply-Demand Balance
Peabody Energy
151 U.S. coal mines idled in the first half of 2013.
Illinois Illinois Basin Missouri St. Louis Indiana Indianapolis Kentucky Tennessee Nashville Knoxville Ohio Cincinnati Cleveland Northern Appalachia West Virginia Charleston Central Appalachia Pennsylvania MD Baltimore Washington, D.C. Virginia Richmond Norfolk North Carolina Raleigh
Supply rationalization occurring
China and U.S. production down 1% and 2% YTD 45% of Shanxi producers reportedly not profitable
U.S. met exports down 16% in third quarter Large cutbacks from non-public companies
India coal production lags demand
Mongolia met exports down 35% YTD; Mozambique supply struggles to grow
Source: SNL Energy, Shanxi Statistics Bureau, MSHA, Peabody Global Analytics. China production data through September; U.S. production data through October; Mongolia year-to-date data through August.
10
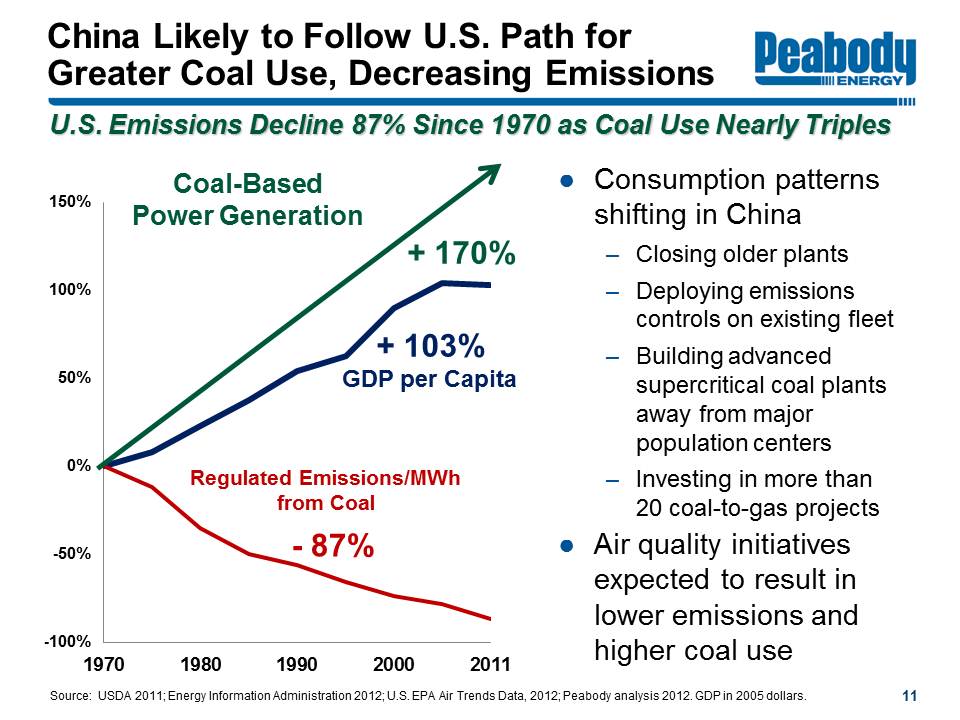
China Likely to Follow U.S. Path for Greater Coal Use, Decreasing Emissions
Peabody Energy
U.S. Emissions Decline 87% Since 1970 as Coal Use Nearly Triples
1970 1980 1990 2000 2011 -100% -50% 0% 50% 100% 150%
Coal-Based Power Generation +170% GDP per Capita +103% Regulated Emissions/MWh from Coal -87%
Consumption patterns shifting in China Closing older plants Deploying emissions controls on existing fleet Building advanced supercritical coal plants away from major population centers Investing in more than 20 coal-to-gas projects
Air quality initiatives expected to result in lower emissions and higher coal use
Source: USDA 2011; Energy Information Administration 2012; U.S. EPA Air Trends Data, 2012; Peabody analysis 2012. GDP in 2005 dollars.
11
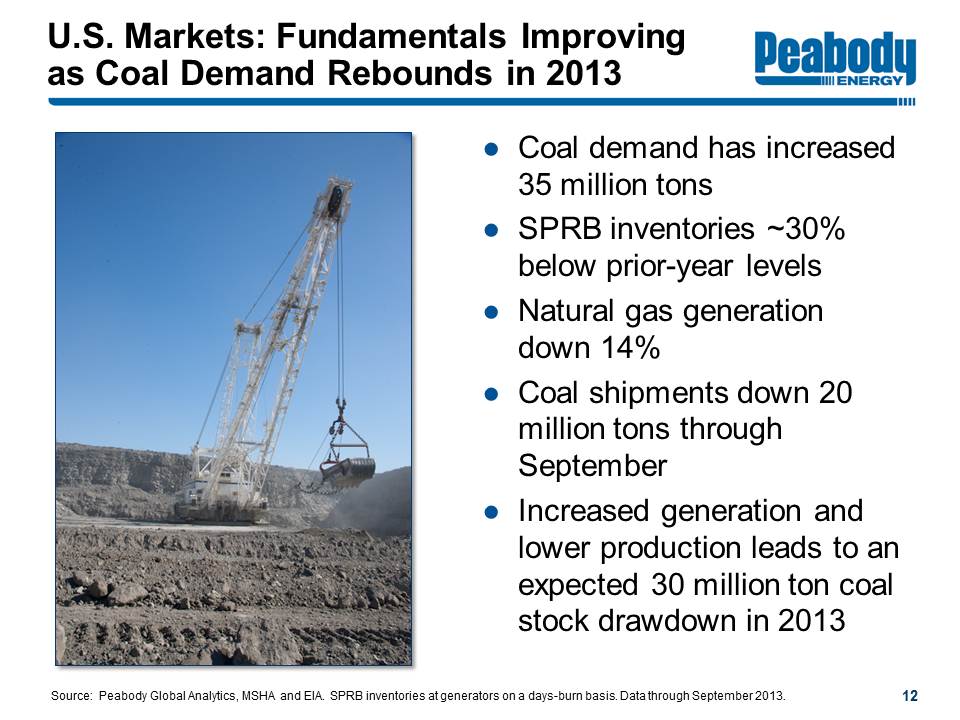
U.S. Markets: Fundamentals Improving as Coal Demand Rebounds in 2013
Peabody Energy
Coal demand has increased 35 million tons
SPRB inventories ~30% below prior-year levels
Natural gas generation down 14%
Coal shipments down 20 million tons through September
Increased generation and lower production leads to an expected 30 million ton coal stock drawdown in 2013
Source: Peabody Global Analytics, MSHA and EIA. SPRB inventories at generators on a days-burn basis. Data through September 2013.
12
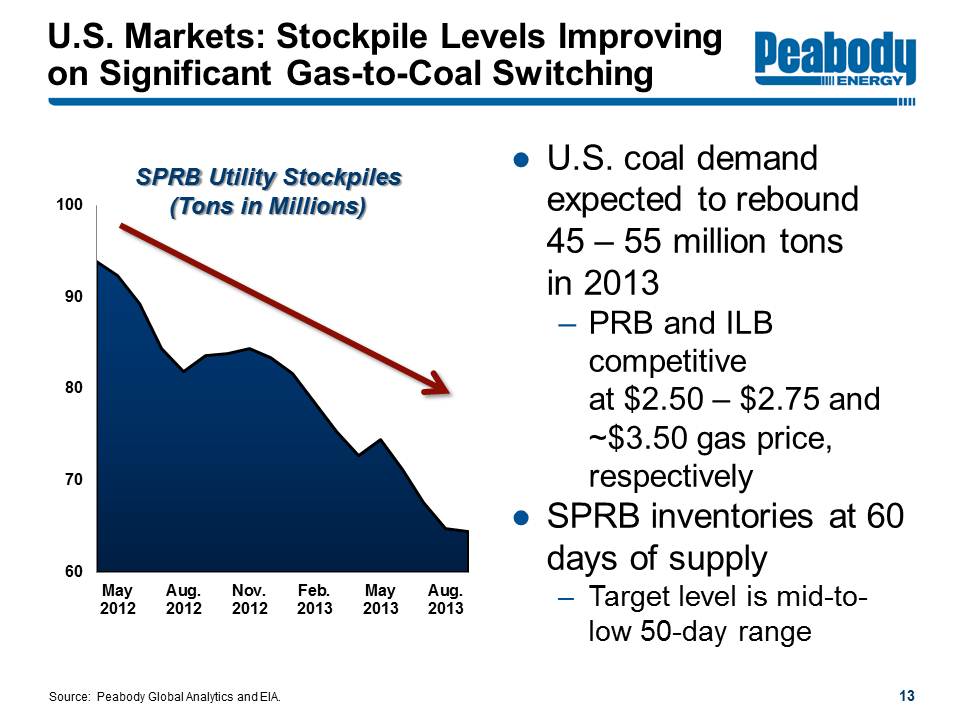
U.S. Markets: Stockpile Levels Improving on Significant Gas-to-Coal Switching
Peabody Energy
SPRB Utility Stockpiles (Tons in Millions)
May 2012 Aug. 2012 Nov. 2012 Feb. 2013 May 2013 Aug. 2013 60 70 80 90 100
U.S. coal demand expected to rebound 45 - 55 million tons in 2013 PRB and ILB competitive at $2.50 - $2.75 and ~$3.50 gas price, respectively
SPRB inventories at 60 days of supply Target level is mid-to-low 50-day range
Source: Peabody Global Analytics and EIA.
13
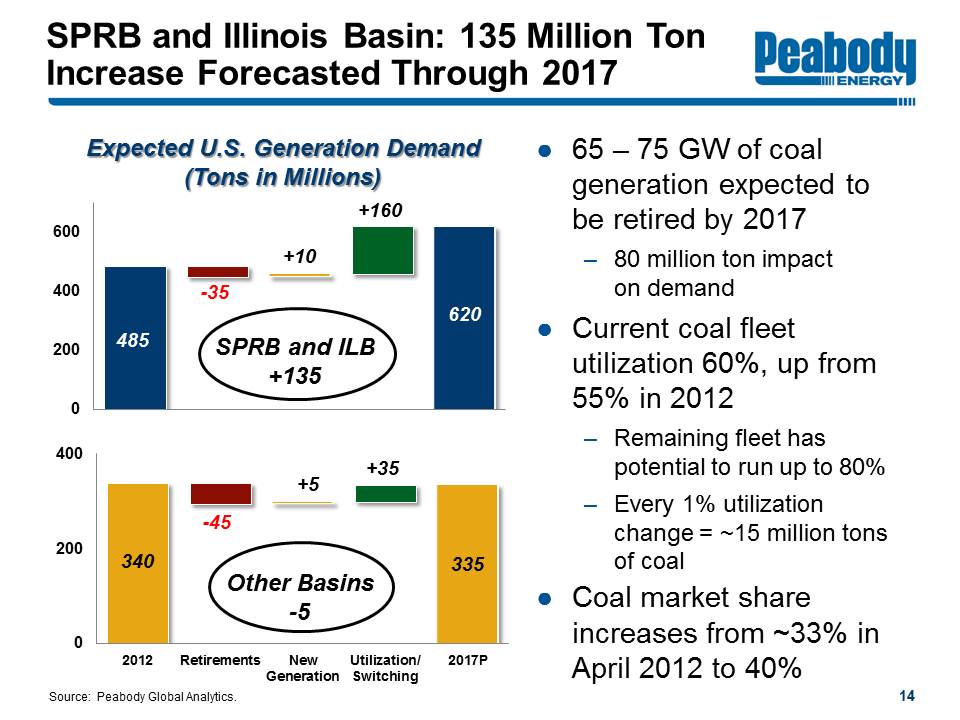
SPRB and Illinois Basin: 135 Million Ton Increase Forecasted Through 2017
Peabody Energy
Expected U.S. Generation Demand (Tons in Millions)
0 200 400 600 485 -35 +10 +160 620 SPRB and ILB +135
0 200 400 340 -45 +5 +35 335 Other Basins -5
2012 Retirements New Generation Utilization/Switching 2017P
65 - 75 GW of coal generation expected to be retired by 2017 80 million ton impact on demand
Current coal fleet utilization 60%, up from 55% in 2012 Remaining fleet has potential to run up to 80% Every 1% utilization change = ~15 million tons of coal
Coal market share increases from ~33% in April 2012 to 40%
Source: Peabody Global Analytics.
14
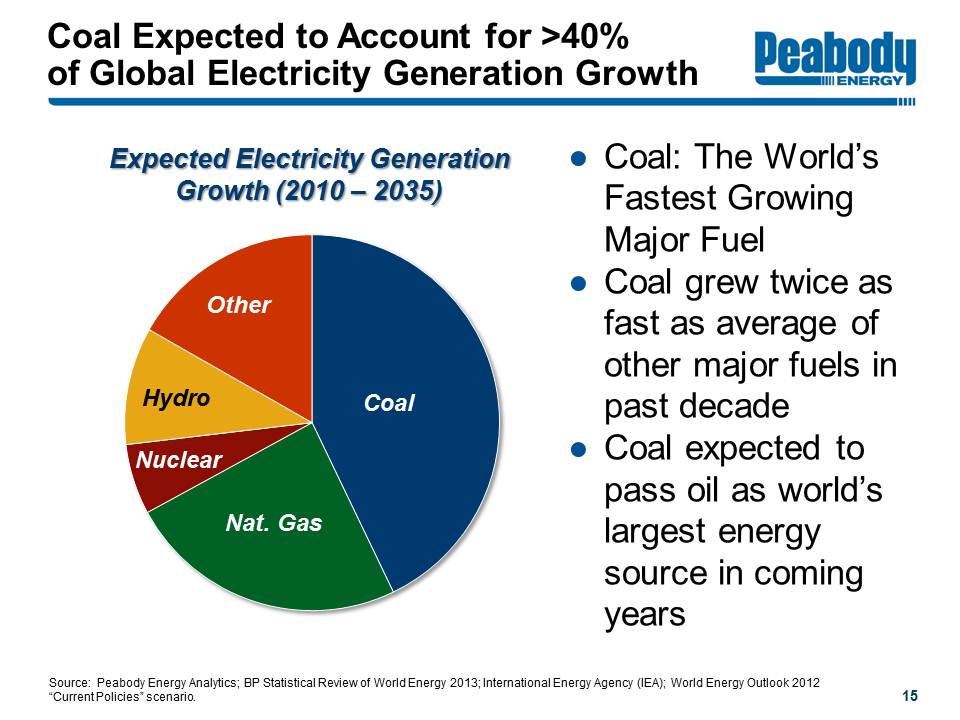
Coal Expected to Account for >40% of Global Electricity Generation Growth
Peabody Energy
Expected Electricity Generation Growth (2010 - 2035) Coal Nat. Gas Nuclear Hydro Other
Coal: The World’s Fastest Growing Major Fuel
Coal grew twice as fast as average of other major fuels in past decade
Coal expected to pass oil as world’s largest energy source in coming years
Source: Peabody Energy Analytics; BP Statistical Review of World Energy 2013; International Energy Agency (IEA); World Energy Outlook 2012 “Current Policies” scenario.
15
Peabody Energy Outlook
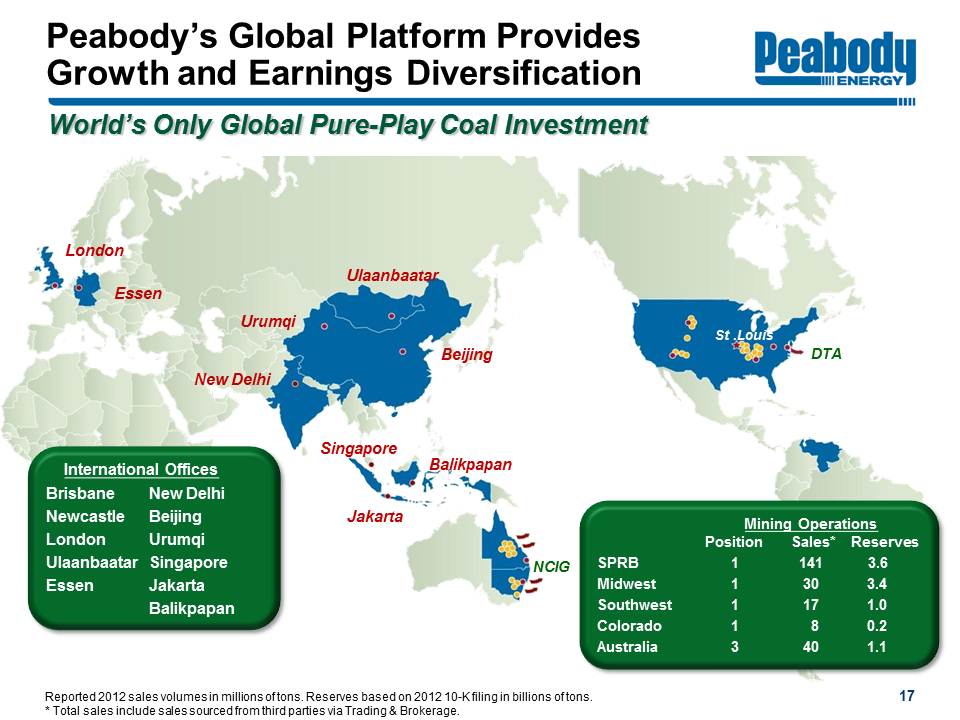
Peabody’s Global Platform Provides Growth and Earnings Diversification
Peabody Energy
World’s Only Global Pure-Play Coal Investment
London Essen Urumqi New Delhi Ulaanbaatar Beijing Singapore Jakarta Balikpapan NCIG St. Louis DTA International Offices Brisbane Newcastle
Mining Operations Position Sales* Reserves SPRB Midwest Southwest Colorado Australia
1 1 1 1 3 141 30 17 8 40 3.6 3.4 1.0 0.2 1.1
Reported 2012 sales volumes in millions of tons. Reserves based on 2012 10-K filing in billions of tons.
* Total sales include sales sourced from third parties via Trading & Brokerage.
17
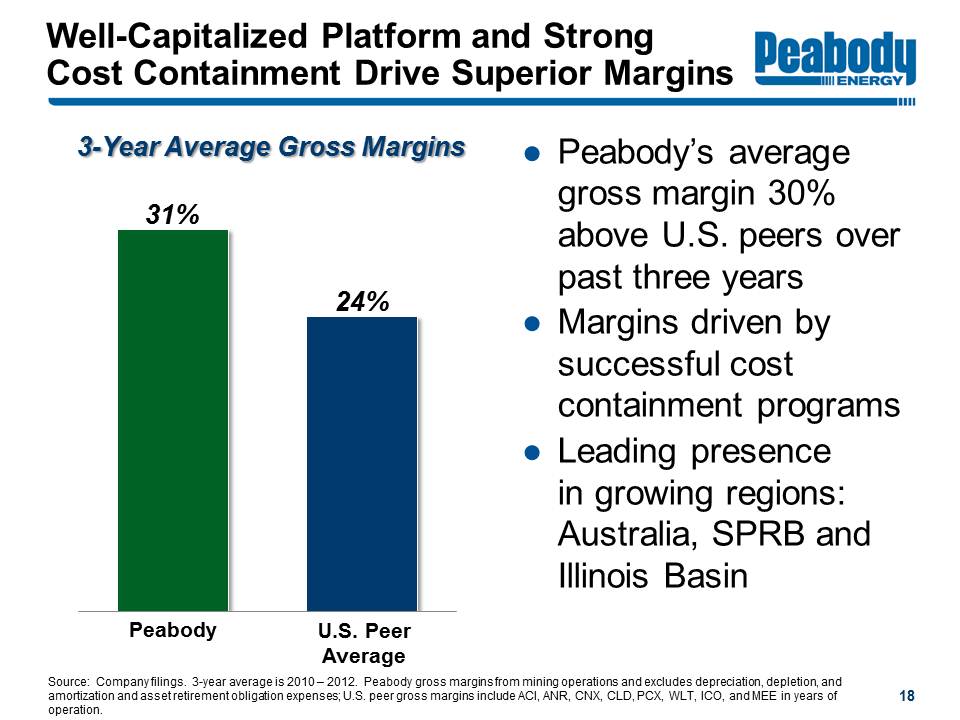
Well-Capitalized Platform and Strong Cost Containment Drive Superior Margins
Peabody Energy
3-Year Average Gross Margins Peabody 31% U.S. Peer Average 24%
Peabody’s average gross margin 30% above U.S. peers over past three years
Margins driven by successful cost containment programs
Leading presence in growing regions: Australia, SPRB and Illinois Basin
Source: Company filings. 3-year average is 2010 - 2012. Peabody gross margins from mining operations and excludes depreciation, depletion, and amortization and asset retirement obligation; U.S. peer gross margins include ACI, ANR, CNX, CLD, PCX, WLT, ICO, and MEE in years of operation.
18
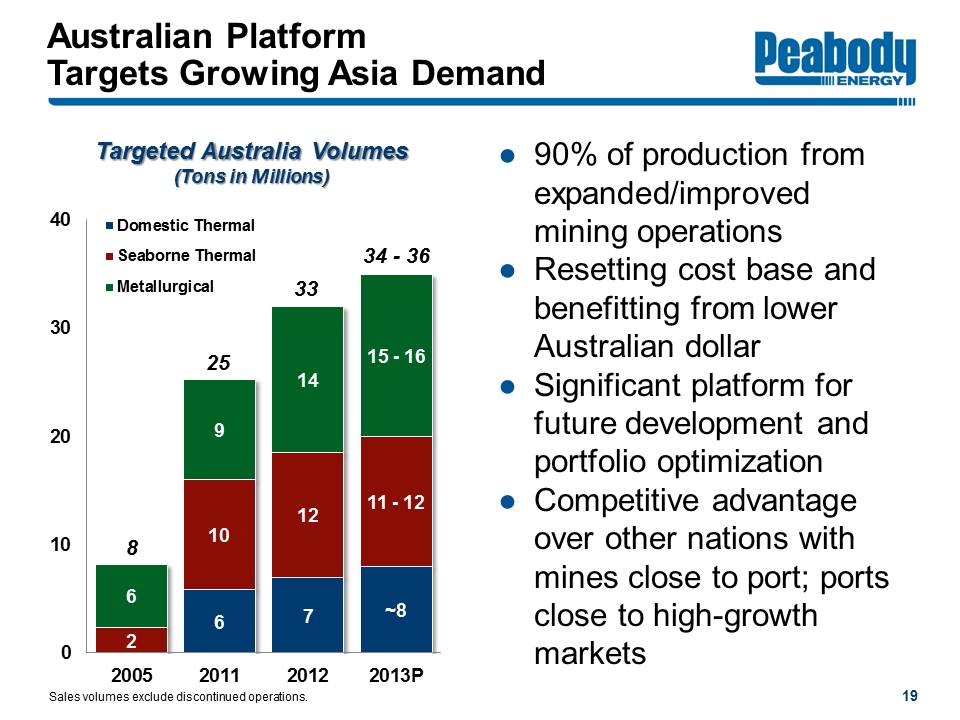
Australian Platform Targets Growing Asia Demand
Peabody Energy
Targeted Australia Volumes (Tons in Millions) 0 10 20 30 40
2005 8 Seaborne Thermal 2 Metallurgical 6
2011 25 Domestic Thermal 6 Seaborne Thermal10 Metallurgical 9
2012 33 Domestic Thermal 7 Seaborne Thermal 12 Metallurgical 14
2013P 34 - 36 Domestic Thermal ~8 Seaborne Thermal 11-12 Metallurgical 15-16
90% of production from expanded/improved mining operations
Resetting cost base and benefitting from lower Australian dollar
Significant platform for future development and portfolio optimization
Competitive advantage over other nations with mines close to port; ports close to high-growth markets
Sales volumes exclude discontinued operations.
19
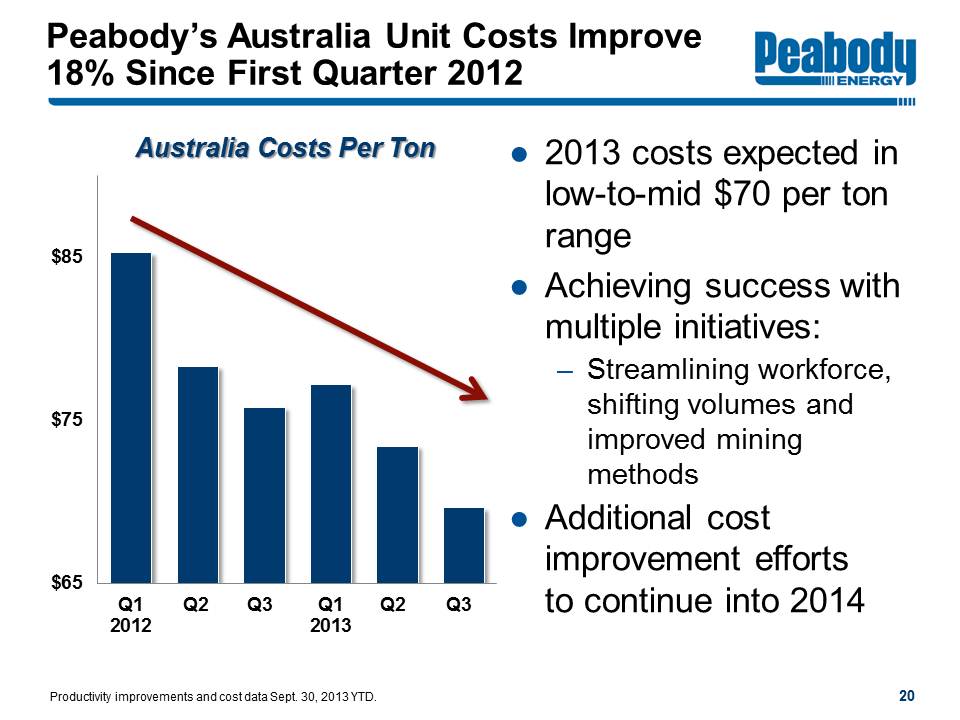
Peabody’s Australia Unit Costs Improve 18% Since First Quarter 2012
Peabody Energy
Australia Costs Per Ton Q1 2012 Q2 Q3 Q1 2013 Q2 Q3 $65 $75 $85
2013 costs expected in low-to-mid $70 per ton range
Achieving success with multiple initiatives: Streamlining workforce, shifting volumes and improved mining methods
Additional cost improvement efforts to continue into 2014
Productivity improvements and cost data Sept. 30, 2013 YTD.
20
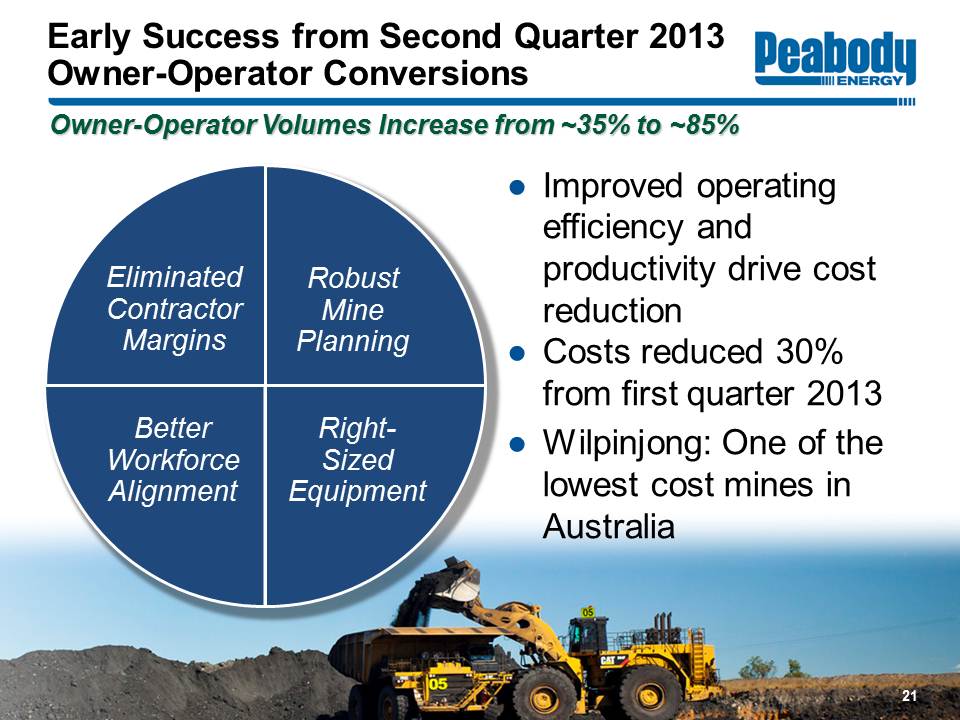
Early Success from Second Quarter 2013 Owner-Operator Conversions
Peabody Energy
Owner-Operator Volumes Increase from ~35% to ~85%
Eliminated Contractor Margins Robust Mine Planning Better Workforce Alignment Right-Sized Equipment
Improved operating efficiency and productivity drive cost reduction
Costs reduced 30% from first quarter 2013
Wilpinjong: One of the lowest cost mines in Australia
21
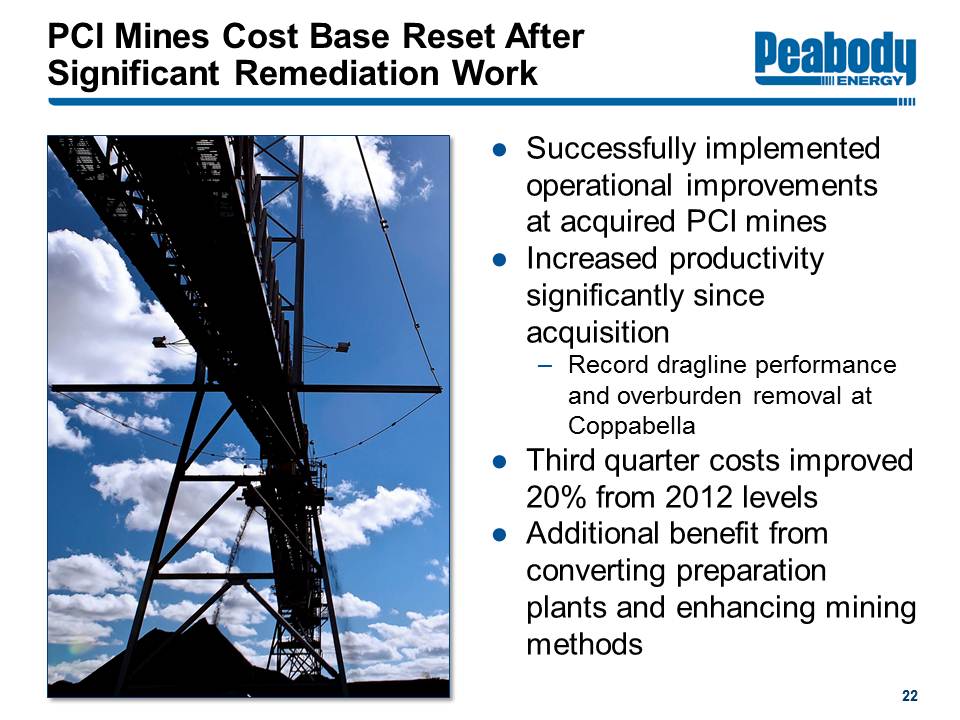
PCI Mines Cost Base Reset After Significant Remediation Work
Peabody Energy
Successfully implemented operational improvements at acquired PCI mines
Increased productivity significantly since acquisition Record dragline performance and overburden removal at Coppabella
Third quarter costs improved 20% from 2012 levels
Additional benefit from converting preparation plants and enhancing mining methods
22
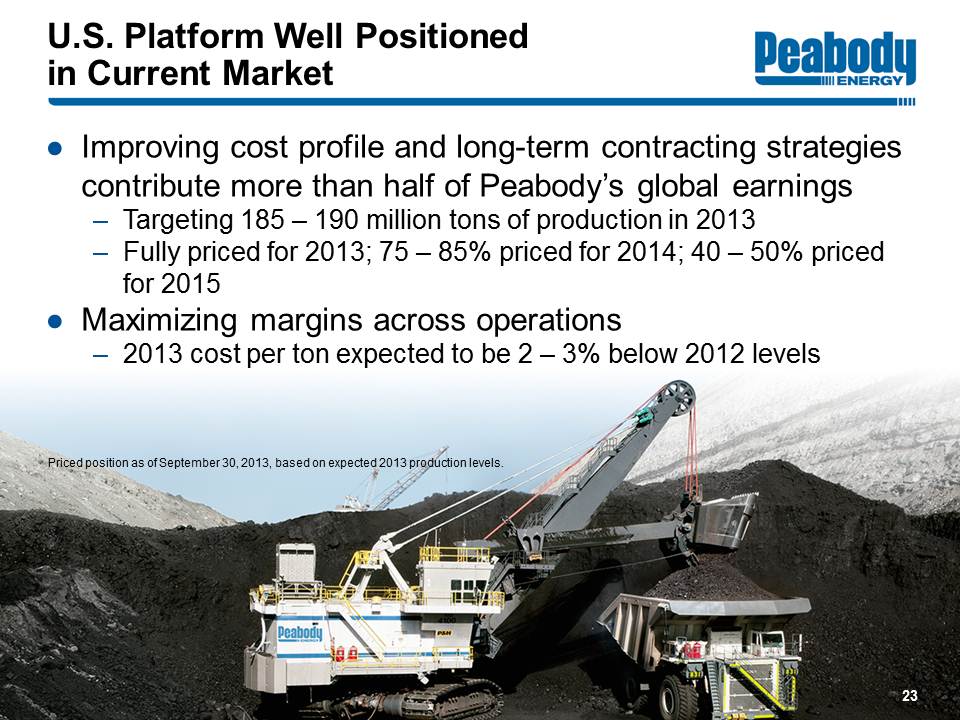
U.S. Platform Well Positioned in Current Market
Peabody Energy
Improving cost profile and long-term contracting strategies contribute more than half of Peabody’s global earnings Targeting 180 - 190 million tons of production in 2013 Fully priced for 2013; 75 - 85% priced for 2014; 40 - 50% priced for 2015
Maximizing margins across operations 2013 cost per ton expected to be 2 - 3% below 2012 levels
Priced position as of September 30, 2013, based on expected 2013 production levels.
23
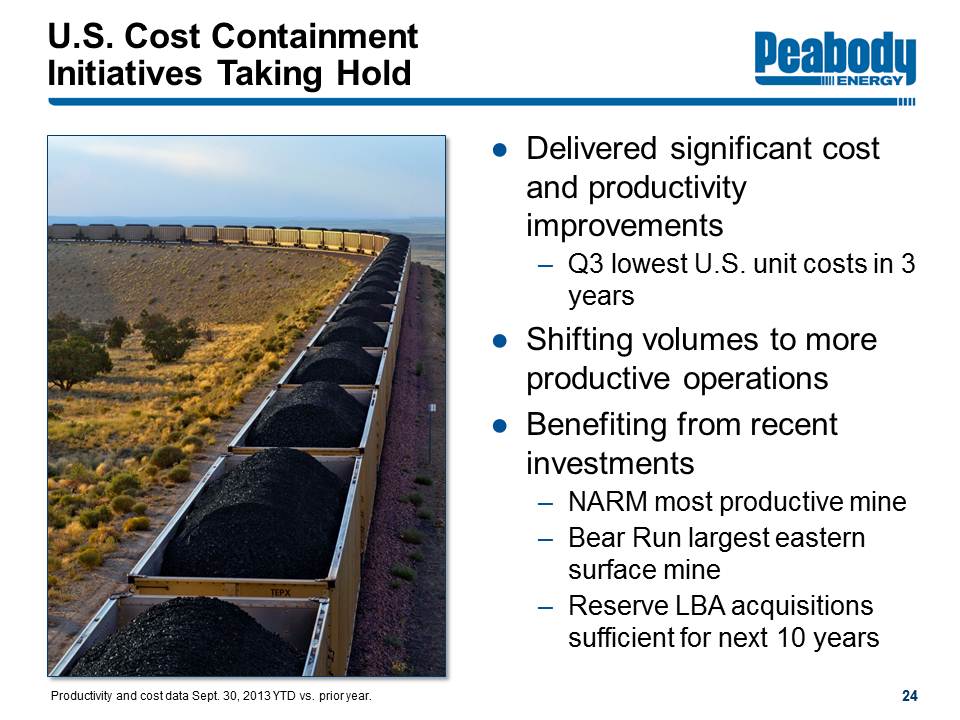
U.S. Cost Containment Initiatives Taking Hold
Peabody Energy
Delivered significant cost and productivity improvements Q3 lowest U.S. unit costs in 3 years
Shifting volumes to more productive operations
Benefiting from recent investments NARM most productive mine Bear Run largest eastern surface mine Reserve LBA acquisitions sufficient for 10 years
Productivity and cost data Sept. 30, 2013 YTD vs. prior year.
24
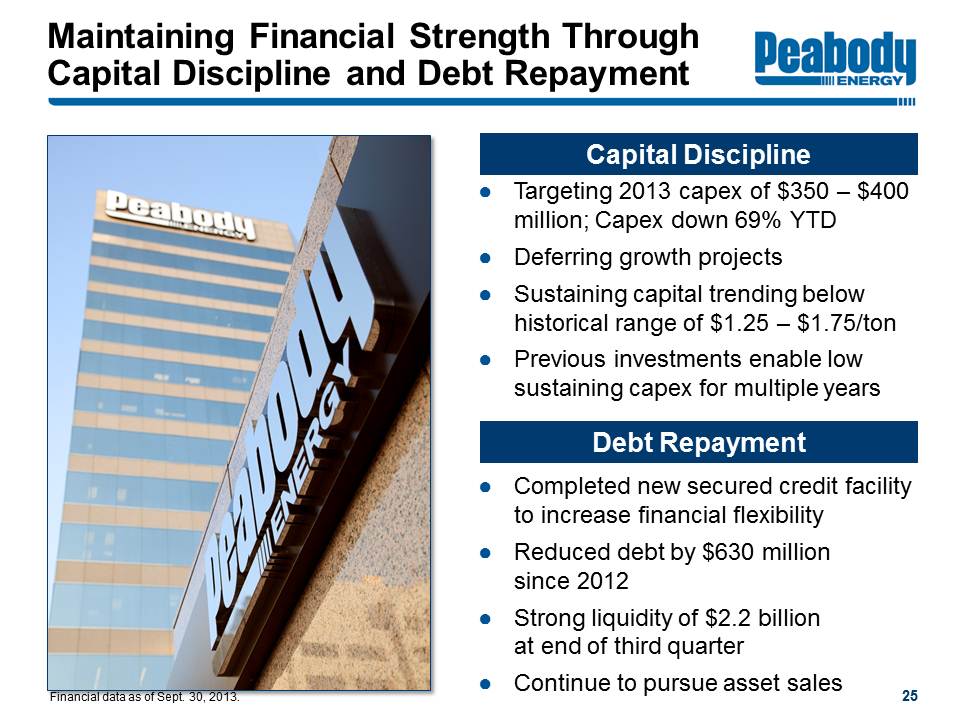
Maintaining Financial Strength Through Capital Discipline and Debt Repayment
Peabody Energy
Capital Discipline
Targeting 2013 capex of $350 - $400 million; Capex down 69% YTD
Deferring growth projects
Sustaining capital trending below historical range of $1.25 - $1.75/ton
Previous investments enable low sustaining capex for multiple years
Debt Repayment
Completed new secured credit facility to increase financial flexibility
Reduced debt by $630 million since 2012
Strong liquidity of $2.2 billion at end of third quarter
Continue to pursue asset sales
25
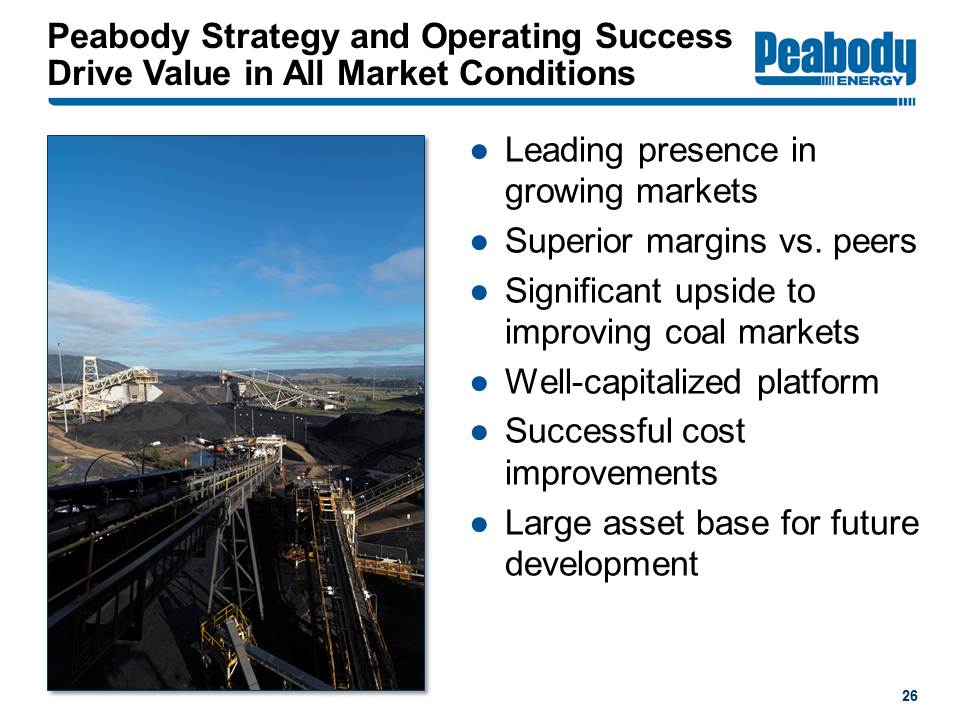
Peabody Strategy and Operating Success Drive Value in All Market Conditions
Peabody Energy
Leading presence in growing markets
Superior margins vs. peers
Significant upside to improving coal markets
Well-capitalized platform
Successful cost improvements
Large asset base for future development
26

Peabody Energy
www.PeabodyEnergy.com
Life Empowered
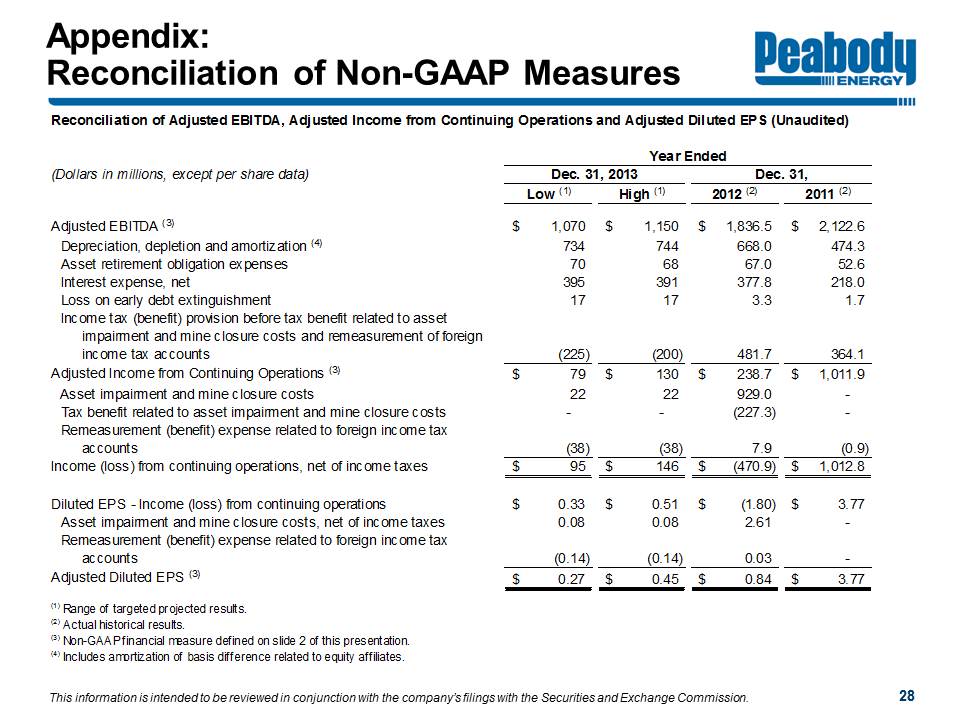
Appendix: Reconciliation of Non-GAAP Measures
Peabody Energy
Reconciliation of Adjusted EBITDA, Adjusted Income from Continuing Operations and Adjusted Diluted EPS (Unaudited)
Year Ended (Dollars in millions, except per share data)
Dec. 31, 2013 Dec. 31,
Low (1) High (1) 2012 (2) 2011 (2)
Adjusted EBITDA (3) $1,070 $1,150 $1,836.5 $2,122.6
Depreciation, depletion and amortization (4) 734 744 668.0 474.3
Asset retirement obligation expenses 70 744 67.0 52.6
Interest expense, net 17 17 3.3 1.7
Income tax (benefit) provision before tax benefit related to asset impairment and mine closure costs and remeasurement of foreign income tax accounts (225) (200) 481.7 364.1
Adjusted Income from Continuing Operations (3) $79 $130 $238.7 $1,011.9
Asset impairment and mine closure costs 22 22 929.0 -
Tax benefit related to asset impairment and mine closure costs - - (227.3) -
Remeasurement (benefit) expense related to foreign income tax accounts (38) (38) 7.9 (0.9)
Income (loss) from continuing operations, net of income taxes $95 $146 $(470.9) $1,012.8
Diluted EPS - Income (loss) from continuing operations $0.33 $0.51 $(1.80) $3.77
Asset impairment and mine closure costs, net of income taxes 0.08 0.08 2.61 -
Remeasurement (benefit) expense related to foreign income tax accounts (0.14) (0.14) 0.03 -
Adjusted Diluted EPS (3) $0.27 $0.45 $0.84 $3.77
(1) Range of targeted projected results.
(2) Actual historical results.
(3) Non-GAAP financial measure defined on slide 2 of this presentation.
(4) Includes amortization of basis difference related to equity affiliates.
This information is intended to be reviewed in conjunction with the company’s filings with the Securities and Exchange Commission.
28