Attached files
| file | filename |
|---|---|
| 8-K - FORM 8-K - EXELON CORP | d623892d8k.htm |
 Edison Electric Institute
Financial Conference
November 11 –
12, 2013
Exhibit 99.1 |
 1
Cautionary Statements Regarding Forward-Looking Information
This presentation contains certain forward-looking statements within the
meaning of the Private Securities Litigation Reform Act of 1995, that are
subject to risks and uncertainties. The factors that could cause actual
results to differ materially from the forward-looking statements
made by Exelon Corporation, Commonwealth Edison Company, PECO Energy
Company, Baltimore Gas and Electric Company and Exelon
Generation Company, LLC (Registrants) include those factors discussed herein,
as well as the items discussed in (1) Exelon’s 2012 Annual
Report on Form 10-K in (a) ITEM 1A. Risk Factors, (b) ITEM 7.
Management’s Discussion and Analysis of Financial Condition and
Results of Operations and (c) ITEM 8. Financial Statements and
Supplementary Data: Note 19; (2) Exelon’s Third Quarter 2013 Quarterly
Report on Form 10-Q in (a) Part II, Other Information, ITEM 1A. Risk
Factors; (b) Part 1, Financial Information, ITEM 2. Management’s
Discussion and Analysis of Financial Condition and Results of Operations
and (c) Part I, Financial Information, ITEM 1. Financial Statements:
Note 18; and (3) other factors discussed in filings with the SEC by the
Registrants. Readers are cautioned not to place undue reliance on these
forward- looking statements, which apply only as of the date of this
presentation. None of the Registrants undertakes any obligation to
publicly release any revision to its forward- looking statements to
reflect events or circumstances after the date of this
presentation.
2013 EEI Conference |
 2
While we believe in market recovery, we are not waiting for it and are taking
actions to improve our value
The current trends in the
industry…
…
are continuing to create
a challenging
environment…
…
and Exelon is
responding…
…while monitoring the
power markets for
recovery.
Increasing natural gas production
Expanding renewable capacity
Growing demand response and energy efficiency
Low natural gas and power prices
Low load growth
Lack of volatility
Asset optimization and rationalization
Leverage business model to identify and invest in growth areas
Manage costs and improve efficiencies
Advocate for policies that enable well-functioning competitive markets and
create value for shareholders
Full impact of coal retirements is not currently reflected in the forward
markets Significant number of coal plants need additional controls to
comply with MATS Forward market implied heat rates are trading at a
discount to the spot market Upside in both forward and spot markets as
current heat rates move higher 2013 EEI Conference
2
Setting the Context |
 3
Exelon’s Strategic Response to the Current Environment
We are biased towards action while we leverage our competencies and strengths
to influence our financial future
Asset Optimization
Growth Investments
Cost Management
Utilities
Invest $15 billion across the
planning period
Upgrade aging infrastructure
Invest in infrastructure and new
technologies
Provide stable earnings growth
ExGen
Invest in renewables and
expand footprint in the natural
gas business to diversify
Maintain retail pricing discipline
Bolster presence in core regions
Research and invest in
emerging technologies
Review
Solutions
from
All
Angles
Infrastructure
Commercial
Policy
Legal
Scenarios for Optimization
Cost and productivity
enhancement
Operations improvement
Transmission
PPAs
Sale
Retirement
Our Record
Record of managing costs
$550 million in merger
synergies
Reduced 2013 ExGen O&M by
$150 million
CENG annual projected
synergies of $50-70 million
(1)
Continued Focus
Expand cost management
efforts
Efficiency gains through
productivity and technology
enhancements
Share best practices across the
utilities
(1)
At 100% ownership, Exelon share is 50%
2013 EEI Conference |
 4
Advocating for Public Policy to Enhance Customer and
Shareholder Value
PJM:
Engaged in stakeholder process
regarding PJM reliance on
planned resources
Minimum Offer Price Rule
(MOPR) Reform
Demand Response Reforms
ERCOT:
•
Resource adequacy
New England:
•
Energy and capacity market
reforms
RGGI:
•
New Model Rule
Oppose Subsidized Generation:
IL: Defeated Taylorsville Energy
Project Subsidy legislation
MA: Opposed Footprint Power
Subsidy legislation
NJ: Won LCAPP Court decision
Infrastructure & Ratemaking
Improvements:
IL: Energy Infrastructure and
Modernization Legislation
(Senate Bill 9)
MD/PA: Policies to speed
recovery for gas and
infrastructure investments
Market Policy
Federal Policy
State Policy
Regulatory / Policy Actions
Subsidies:
Leading voice against extension
of the Production Tax Credit and
other electric generation
subsidies
EPA Regulations:
Mercury and Air Toxics
Standards (MATS)
Greenhouse gases (new and
existing sources)
316(b)
2013 EEI Conference |
 5
Investing in a Stronger Future
Utility Investment
Operating Excellence
Asset Optimization
Portfolio Management
Strong Balance Sheet
Significant infrastructure and technology enhancements under
regulatory structures that allow a fair rate of return.
Generating fleet will continue unwavering focus on world class
performance.
Disciplined
fleet
evaluation
will
drive
strategic
decisions
to
unlock
value,
improve cash flow and grow earnings.
Enhance the value of our portfolio through implementation of our
fundamental view and disciplined retail pricing.
Solid
financial
footing
and
investment
grade
credit
rating
will
allow
us
to
grow in challenging times.
Core Strength
Strategic Focus and Actions
Well-Crafted Public Policies
Advocate for policies that strengthen competitive markets, limit
subsidies and enhance the value of clean generation.
2013 EEI Conference |
 Financial Update
*
*
*
*
* |
 7
2013 Operating Earnings Guidance
2013 Prior Guidance
(prior to 3Q earnings call)
$2.35 -
$2.65
(1)
$1.40 -
$1.60
$0.35 -
$0.45
$0.35 -
$0.45
$0.15 -
$0.25
ExGen
ComEd
PECO
BGE
(1)
Earnings guidance for OpCos may not add up to consolidated EPS guidance. Refer to slide 15 for a list of adjustments from GAAP EPS to adjusted (non-GAAP) operating EPS.
Key Drivers of Change in
Full-Year Guidance
•
Strong YTD earnings
through Q3
•
Lower than expected ExGen
gross margin largely offset
by O&M savings
•
Delay of AVSR project
•
Lower storm costs at
utilities
2013 EEI Conference
2013 Revised Guidance
(disclosed at 3Q earnings call)
$2.40 -
$2.60
(1)
$1.40 -
$1.50
$0.45 -
$0.50
$0.40 -
$0.45
$0.20 -
$0.25
ExGen
ComEd
PECO
BGE |
 Capital Expenditure Expectations
75
100
100
25
50
25
125
100
75
50
25
50
25
75
150
2,075
750
1,050
100
2015
2,350
875
950
200
2014
2,400
900
900
150
2016
2013
2,725
950
1,000
25
500
150
Base Capex
Nuclear Fuel
Fukushima Response
(2)
MD Commitments
Wind
Solar
Upstream Gas
Nuclear Uprates
1,400
575
200
450
1,725
850
225
300
2014
3,025
1,650
700
225
450
2013
2,625
2016
2,950
1,750
725
250
225
2015
3,100
Electric Distribution
Electric Transmission
Gas Delivery
Smart Grid/Smart Meter
Exelon Utilities
Exelon
Generation
(1)
(in $M)
(in $M)
8
2013 EEI Conference
(1)
Excludes CENG
(2)
Fukushima Response spend excludes Salem, which is included in Base CapEx
|
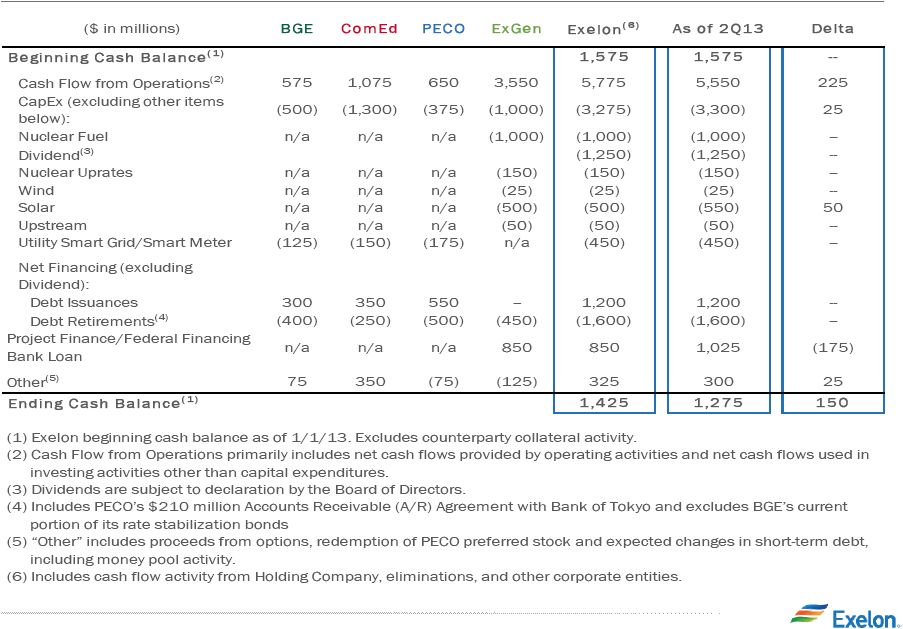 2013 Projected Sources and Uses of Cash
9
2013 EEI Conference |
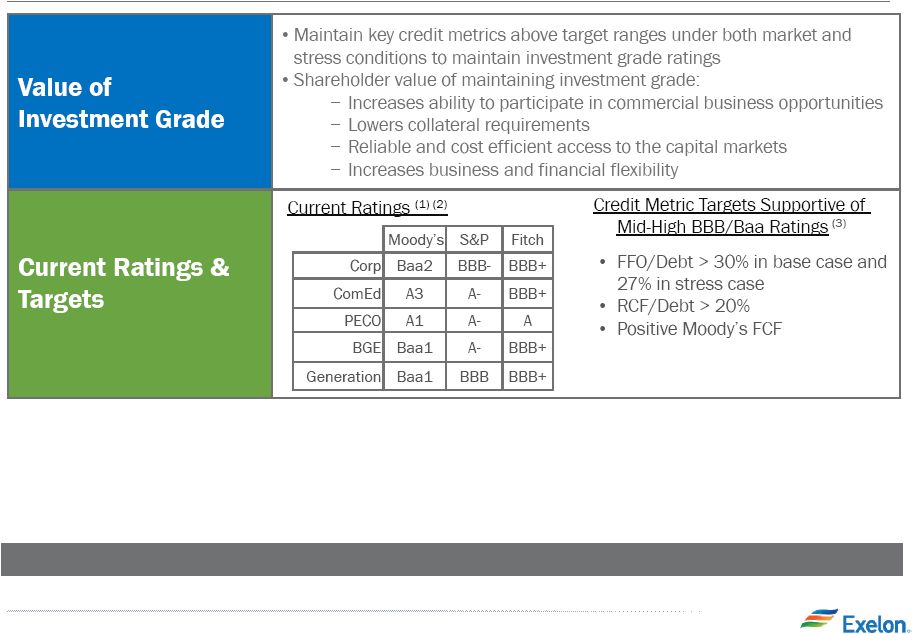 Commitment to Investment Grade
Exelon remains committed to maintaining investment grade ratings
(1)
Current senior unsecured ratings for Exelon, Exelon Generation and BGE and
senior secured ratings for ComEd and PECO as of September 25,
2013. (2)
All
ratings
at
S&P
and
Moody’s
have
a
stable
outlook.
On
August
23rd,
BGE
was
upgraded
one
notch
to
A-
as
part
of
S&P’s
annual
review. All other entities were affirmed. Additionally, on February 8th,
Fitch affirmed all ratings for Exelon and subs and placed ComEd on
positive outlook. (3)
Credit metric target ranges are for ExGen and include the debt obligations of
Exelon Corp. 10
2013 EEI Conference |
 Pension and OPEB Forecast
Current Forecast:
•
The table below provides the combined company’s forecasted 2014 and 2015
pension and OPEB expense and contributions
11
2013 EEI Conference |
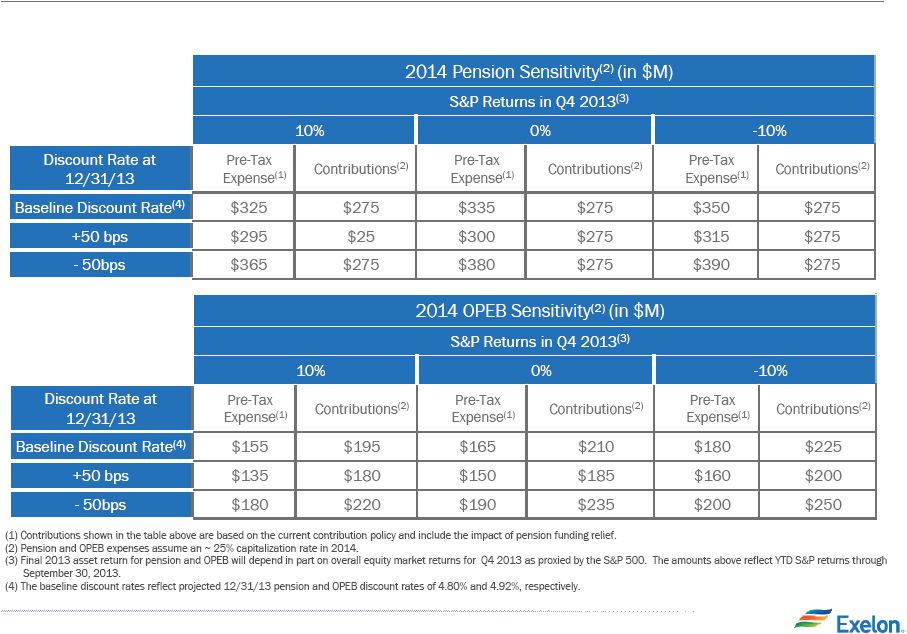 2014 Pension and OPEB Sensitivities
12
2013 EEI Conference
•
Tables below provide sensitivities for the combined company’s 2014 pension
and OPEB expense and contributions
(1)
under various discount rate and S&P 500 asset return scenarios
|
 13
Additional 2013 ExGen and CENG Modeling
(1)
ExGen
amounts
for
O&M,
TOTI
and
Depreciation
&
Amortization
exclude
the
impacts
of
CENG.
CENG
impact
is
reflected
in
“Equity
earnings
of
unconsolidated
affiliates”
in
the
Income
Statement.
(2)
ExGen O&M excludes P&L neutral decommissioning costs and the
impact from O&M related to entities consolidated solely as a result of the application of FIN 46R.
(3)
TOTI excludes gross receipts tax for retail.
(4)
ExGen Depreciation & Amortization excludes the impact of P&L neutral
decommissioning. (5)
The CENG model inputs are intended to support Exelon’s guidance range and
do not represent CENG’s final estimates. 2013 EEI Conference
P&L Item
2013 Estimate
ExGen
Model
Inputs
(1)
O&M
(2)
$4,275M
Taxes Other Than Income (TOTI)
(3)
$300M
Depreciation & Amortization
(4)
$825M
Interest Expense
$350M
CENG
Model
Inputs
(at
ownership)
(5)
Gross Margin
Included in ExGen Disclosures
O&M/TOTI
$400M -
$450M
Depreciation & Amortization/Accretion of Asset
Retirement Obligations
$100M -
$150M
Capital Expenditures
$75M -
$125M
Nuclear Fuel Capital Expenditures
$100M -
$150M |
 Debt Maturity Schedule
(in $M)
Debt Maturity Profile
(1)
(2014-2020)
14
2013 EEI Conference
(1)
As of 9/30/13
(2)
Includes $550M in 2015 and 2020 of inter-company loan agreements between
Exelon and Exelon Generation that mirror the terms and amounts of the third party
obligations of Exelon.
500
840
2017
2020
1,600
1,100
1,340
2019
2018
600
500
1,125
700
425
2016
1,342
77
300
665
300
2015
1,610
550
260
800
2014
1,482
615
250
617
Exelon Corp
BGE
ExGen
(2)
PECO
ComEd |
 GAAP to Operating Adjustments
15
2013 EEI Conference |
 Exelon Utilities
*
*
*
*
*
* |
 17
ComEd April 2013 Distribution Formula Rate Updated Filing
2013 EEI Conference |
 18
BGE Rate Case
2013 EEI Conference
Rate Case Request
Electric
Gas
Docket #
9326
Test Year
August 2012 –
July 2013
Common Equity Ratio
51.1%
Requested Returns
ROE: 10.5%; ROR: 7.87%
ROE: 10.35%; ROR: 7.79%
Rate Base
$2.8B
$1.0B
Revenue Requirement Increase
$82.6M
$24.4M
Proposed Distribution Price
Increase as % of overall bill
2%
3%
Timeline
•
5/17/13: BGE filed application with the MDPSC seeking increases in gas &
electric distribution base rates •
8/5/13: Staff/Intervenors file direct testimony
•
8/23/13: Update 8 months actual/4 month estimated test period data with actuals
for last 4 months (March -
July 2013)
•
9/17/13: BGE and staff/intervenors file rebuttal testimony
•
10/3/13: Staff/Intervenors and BGE file surrebuttal testimony
•
10/18/13 –
10/29/13: Hearings
•
11/12/13: Initial Briefs
•
11/22/13: Reply Briefs
•
12/13/13: Final Order
•
New rates are in effect shortly after the final order
|
 19
ComEd Load
2013 EEI Conference
Weather-Normalized Load YoY Growth
Economic
Forecast
of
Drivers
that
Influence
Load
2013E
0.1%
-0.6%
-0.5%
-0.3%
1.2%
2012
-0.3%
0.2%
-0.6%
-0.1%
2.1%
GMP
Large C&I
Small C&I
Residential
All Customers
Driver or
Indicator
2014 Outlook
Gross Metro
Product (GMP)
2.2% growth in GMP reflects overall better
economic conditions than the slow growth in
2013 (Manufacturing and Professional Business
Services employment accelerate in 2014)
Employment
1.4% increase in total employment is expected
for 2014, which is consistent with the past three
years
Manufacturing
Manufacturing employment is expected to grow
1.4% in 2014. This is a significant improvement
over the 0.7% growth in 2012 and the 0.4%
growth in 2013
Households
Household formations are expected to increase
0.4% in 2014. This is a slight improvement over
the 0.3% realized in the past couple of years
Energy
Efficiency
Continued expansion of EE program expected to
reduce usage in 2014 by approximately 1.2%
Notes: 2012 data is not adjusted for leap year. Source of 2014 economic
outlook data is Global Insight (July 2013). Moderate growth economy and
energy efficiency initiatives will continue to impact load growth
|
 20
PECO Load
Weather-Normalized Load YoY Growth
Economic
Forecast
of
Drivers
that
Influence
Load
2013E
-2.4%
1.7%
-0.2%
0.2%
1.0%
2012
-2.7%
-2.3%
-1.7%
-2.2%
1.5%
GMP
Large C&I
Small C&I
Residential
All Customers
Driver or Indicator
2014 Outlook
Gross Metro
Product (GMP)
GMP projected to grow at 2.1% for 2014,
vs. pre-recession average of 2.5%
Resident
Employment
Resident Employment outlook is 1.0% in
2014 vs. 0.8% in 2013
Manufacturing
Employment
Manufacturing employment is expected to
grow at 1.1%. Philadelphia has had
negative growth from 2000 to 2013
Households
Household growth is expected to be 0.7%,
strongest growth since 2010
Energy Efficiency
Deemed Energy Efficiency impact
forecasted to be ~1% reduction in usage
in 2014
Moderately strong economic recovery will drive sales in 2014, but this will be
partially offset by on-going energy efficiency initiatives
2013 EEI Conference
Notes: 2012 data is not adjusted for leap year. Source of 2013 economic
outlook data is Global Insight (August 2013) |
 21
BGE Load
Weather-Normalized Load YoY Growth
Economic
Forecast
of
Drivers
that
Influence
Load
2013E
-3.6%
1.4%
-1.1%
1.8%
2012
-0.2%
-2.8%
-2.1%
-1.5%
GMP
Large C&I
Small C&I
Residential
All Customers
2014 Outlook
Gross Metro
Product (GMP)
GMP is projected to grow at 2.4% for
2014.
Employment
1.4% growth projected. BGE’s decoupled
non-rate case revenue growth is primarily
driven by customer growth. The main
driver for customer growth is employment.
Manufacturing
Manufacturing employment is expected to
be fairly flat to 2013 levels in 2014
Households
Household growth is projected to be
0.9%, the same as 2013.
Energy Efficiency
Continued expansion of EE programs will
partially offset growth seen due to
improvements in economic conditions.
2014 is expected to be another transition year for the Baltimore
economy with
continued slow to moderate growth
Notes: 2012 Data is not adjusted for leap year. Source of 2014 economic
outlook data is Global Insight (August 2013). 1.4%
2.5%
2013 EEI Conference
Driver or Indicator |
 22
Exelon Utilities: Rate Base
(1)
and ROE Targets
Continued investment in Utilities will provide stable earnings growth
($ in billions)
2013E
$5.4
$3.5
$0.7
$1.1
$1.3
2016E
$4.0
$0.8
$6.1
2015E
$5.9
$3.9
$0.7
$1.3
2014E
$5.7
$3.8
$0.7
$1.2
Electric Distribution
Electric Transmission
Gas Delivery
2014E
$9.5
$7.2
$2.3
2013E
$8.7
$6.6
$2.1
2016E
2015E
$10.7
$7.9
$2.9
$11.6
$3.1
$8.5
Distribution
Transmission
$3.1
$5.1
$3.0
$0.8
$1.2
2014E
$4.8
$3.0
$0.7
$1.2
2013E
$4.6
$2.9
$0.6
$1.1
$0.9
2016E
$5.3
$1.3
2015E
Electric Distribution
Electric Transmission
Gas Delivery
(1)
ComEd and PECO rate base represents end-of-year; and BGE rate base
represents a trailing 13-month average. Numbers may not add
due to rounding. (2)
Equity component for distribution rates will be the actual capital structure
adjusted for goodwill.
(3)
Earned ROE will reflect the weighted average of 11.5% allowed transmission ROE
and distribution ROE resulting from 30-year Treasury plus 580 basis
points for each calendar year. 2013 EEI Conference
(4)
Per MDPSC merger commitment, BGE is precluded from paying dividends through
2014. Per MDPSC orders, BGE cannot pay out a dividend to its parent
company if said dividend would cause BGE’s equity ratio to fall
below 48%. |
 23
Capital Expenditures
($ in millions)
$275
$25
$75
$100
2014E
$625
$300
$175
$50
$100
2013E
$550
2016E
$425
$250
$75
$100
2015E
$475
$225
$175
$50
$100
Electric Distribution
Smart Meter/Smart Grid
(1)
Electric Transmission
Gas Delivery
2015E
$2,025
$1,150
$275
$600
2014E
$1,775
$1,050
$175
$550
2013E
$1,450
$850
$150
$450
2016E
$1,925
$225
$500
$1,200
2015E
$600
$300
$175
$125
2014E
$625
$150
$150
$300
$300
$100
$100
$125
2013E
$625
$300
$100
$100
$125
2016E
$600
(1)
Smart Meter/Smart Grid CapEx net of proceeds from U.S. Department of Energy
(DOE) grant. For BGE, includes CapEx from Smart Energy Savers program of ~$10M per year.
2013 EEI Conference |
 24
Regulatory Schedule
4Q13
1Q14
2Q14
3Q14
2014 formula rate
case filing (by
5/15/14)
ComEd Distribution
Formula Rate
Illinois Power
Agency
Procurement
ComEd
Transmission Rate
Update
2014 formula rate case
filing (by 5/15/14);
rates effective June
2014 thru May 2015
2014 formula rate case
filing final order (by
12/31/14); rates
effective 1/2/15 –
12/31/15
4Q14
BGE Distribution Rates
PECO Supply
Procurement
BGE Transmission Rate
Update
2014 formula rate case
filing (by 5/15/14);
rates effective June
2014 thru May 2015
MDPSC Order expected
December 13, 2013
BGE Supply
Procurement
Regular procurement
event (January)
Regular procurement
event (April and June)
Potential Electric and
Gas DSIC Filing
PECO Distribution
Filing
13-0318 final order
(by 12/25); rates
effective 1/2/14 –
12/31/14
DSP II Procurement
(January)
DSP II Procurement
(September)
Regular
procurement event
(October)
Regular
procurement event
(October)
IPA proposed procurement events in April and September
2013 EEI Conference |
 *
* |
 26
Commercial Business Overview
Scale, Scope and Flexibility Across the Energy Value Chain
Development and
exploration of natural gas
and liquids properties
12 assets in
seven states
~255 BCFe of proved
Reserves
(1)
Leading merchant power
generation portfolio in the
U.S.
~35 GW of owned
generation capacity
(2)
Clean portfolio, well
positioned for evolving
regulatory requirements
Industry-leading wholesale
and retail sales and
marketing platform
~150 TWh of load and
~410 BCF of gas delivered
(3)
~ 1 million residential and
100,000 business and
public sector customers
One of the largest and most
experienced Energy
Management providers
~2,000 MW of Load
Response under contract
(4)
Over 4,000 energy savings
projects implemented
across the U.S.
Benefiting from scale, scope and flexibility across the value chain
(1) Estimated
proved
reserves
as
of
12/31/2012.
Includes
Natural
Gas
(NG),
NG
Liquids
(NGL)
and
Oil.
NGL
and
Oil
are
converted
to
BCFe
at
a
ratio
of
6:1.
(2) Total owned generation capacity as of 9/30/2013.
(3) Expected for 2013 as of 9/30/2013. Electric load and gas includes fixed
price and indexed products. (4) Load Response estimate as of
9/30/2013. 2013 EEI Conference |
 New York
New England
ERCOT
MidAtlantic
27
Generation and Load Match
The combination establishes an industry-leading platform with regional
diversification of the generation fleet and customer-facing load
business Generation Capacity, Expected Generation and Expected Load
2014 in TWh
(1,2)
Expected Load
Expected Generation
Generation
capacity:
2013 EEI Conference
Peaking
Intermediate
Baseload
Renewables
(1)
Owned and contracted generation capacity converted from MW to MWh assuming 100%
capacity factor for all technology types, except for renewable capacity which is shown at estimated capacity factor.
(2)
Expected generation and load shown in the chart above will not tie out with
load volume and ExGen disclosures. Load shown above does not include indexed products and generation reflects a net
owned and contracted position. Estimates as of 9/30/2013.
South/West/
Canada
MidWest |
 28
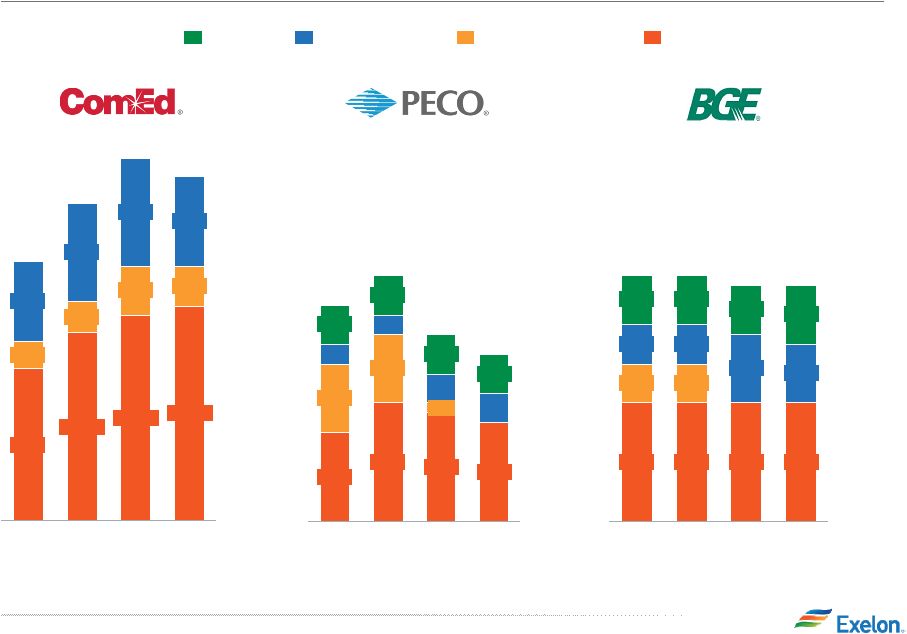
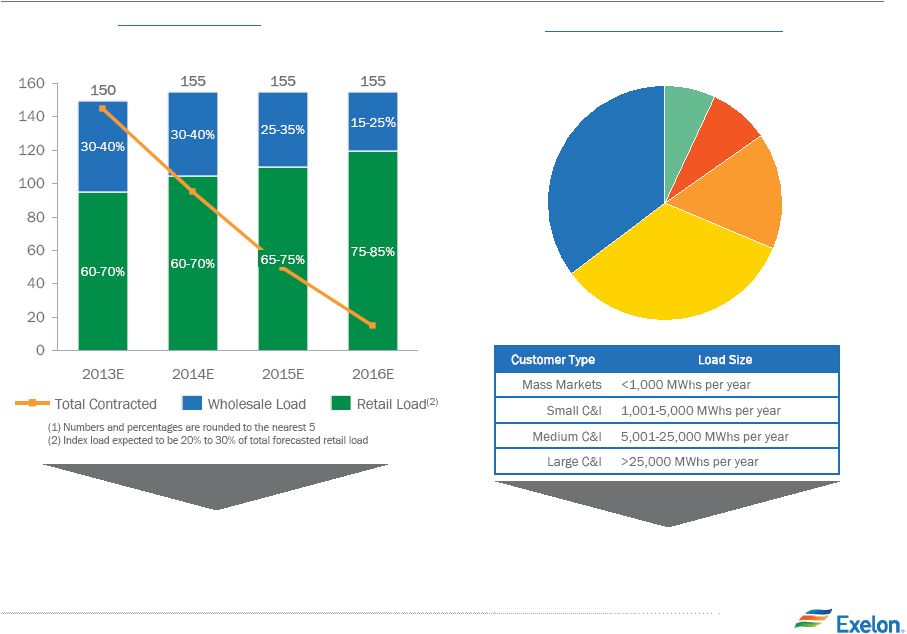
Electric Load Serving Business: Growth Target
Commercial Load
(1)
2013 –
2016 TWh
8%
Load Split by Customer Class
(2013 TWh)
Focus on disciplined pricing and
maximizing margin potential through
all channels to market
A diverse set of customers enhances
margin opportunities from a sales and
portfolio management standpoint
33%
Wholesale
35%
Large C&I
Medium C&I
16%
Small C&I
8%
Mass Markets
7%
C&I = Commercial & Industrial
2013 EEI Conference |
 29
Electric Load Serving Business: Strategy
Constellation is well positioned in a U.S. market where capacity
available for
competitive supply has room to grow
Total U.S. Power Market in 2013
Estimated Load ~ 3,700 TWh
(1)
(1) Source: EIA, KEMA and internal estimates.
Through retail and wholesale channels, Constellation
currently serves 150 TWhs, or approximately 4%, of total
U.S. power demand
18%
Eligible Non-Switched
14%
Eligible Switched
20%
Muni/Co-Op Market
Other
Ineligible
48%
2013 EEI Conference |
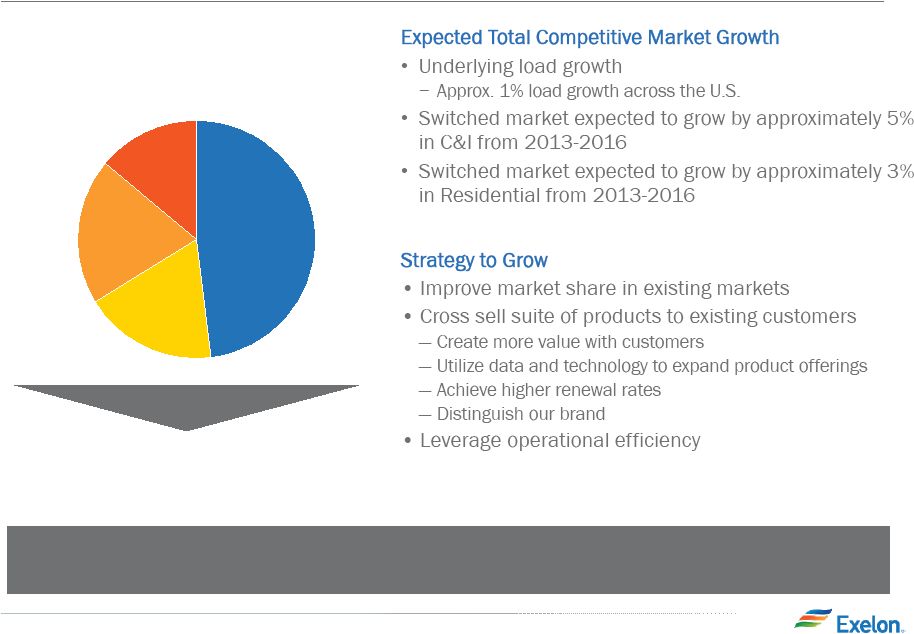
 Capacity Markets
30
2013 EEI Conference |
 31
Retail and Wholesale Gas
(1)
Estimate as of 9/30/2013.
Retail Gas
Portfolio Size:
•
410 Bcf expected to be served in 2013 with
moderate growth thereafter
•
Month by month renewals, with high retention
rates
Market Potential:
•
All states are competitive markets with an
estimated total market size of 15,000 Bcf, of
which 7,500 Bcf is currently switched
Growth Strategy and Objectives:
•
Looking to grow Northeast gas markets as well
as ONEOK territories
Wholesale Gas
Portfolio Size:
•
8 Bcf wholesale storage
•
450,000 MMBtu’s per day of term transport
•
Over 1 Bcf/day of plant supply
•
~4Bcf/day of NG flows to meet growing
customer business, asset optimization, and
plant supply
Growth Strategy and Objectives:
•
Continue to expand wholesale presence to
complement power assets
•
Increase market knowledge of regional and
basis transport information to assist power
forecasting
•
Continue to expand physically based customer
business
•
Continue to grow NG asset portfolio that
complements customer business & plant supply
requirements
2013 EEI Conference |
 32
(1)
Oil/NGL conversion to gas is 6:1.
(2)
Constellation does not operate any of its properties.
Note: E&P = Exploration and Production
(3)
12/31/12 Year end reserves excluding Eagle Ford
(4)
Net daily production as of Q2 2013 excluding Eagle Ford
Upstream E&P Assets
2013 EEI Conference |
 2013 EEI Conference
33
Energy Price Upside -
NIHub
We continue to believe there is $4 of upside in NiHub energy prices in
2015/2016 driven by several factors including compliance with
environmental regulations $31.00
$30.50
$31.25
$33.07
$4.21
$4.10
$3.91
2011
2012
2013
2014
2015
2016
$2.50
$3.00
$3.50
$4.00
$4.50
$5.00
$5.50
$6.00
$36.00
$34.00
$32.00
$30.00
$28.00
$26.00
$24.00
$30.25
$3.68
$2.75
$28.95
$3.99
Realized
Forward
Key Drivers
•
Year over year increases in fuel prices
•
Current and future coal retirements
•
Higher variable unit costs due to MATS
•
Modest load growth
•
Offset by new generation (gas and renewable)
Other factors (not included)
•
Demand Response energy bidding
•
Increased variable costs due to RGGI
•
Scarcity pricing
NG-NYMEX
NIHub Upside
NIHub ATC |
 34
Exelon Generation Disclosures
September 30, 2013
(As disclosed in Third Quarter 2013 Earnings materials)
2013 EEI Conference |
 35
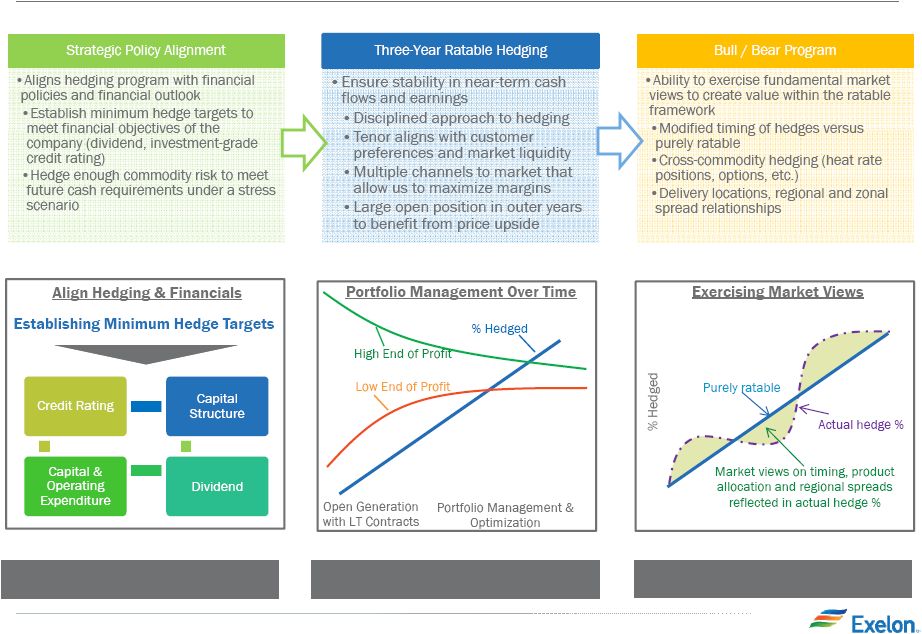
Portfolio Management Strategy
Protect Balance Sheet
Ensure Earnings Stability
Create Value
2013 EEI Conference |
 36
Components of Gross Margin Categories
Gross margin linked to power production and sales
Gross margin from
other business activities
2013 EEI Conference |
 37
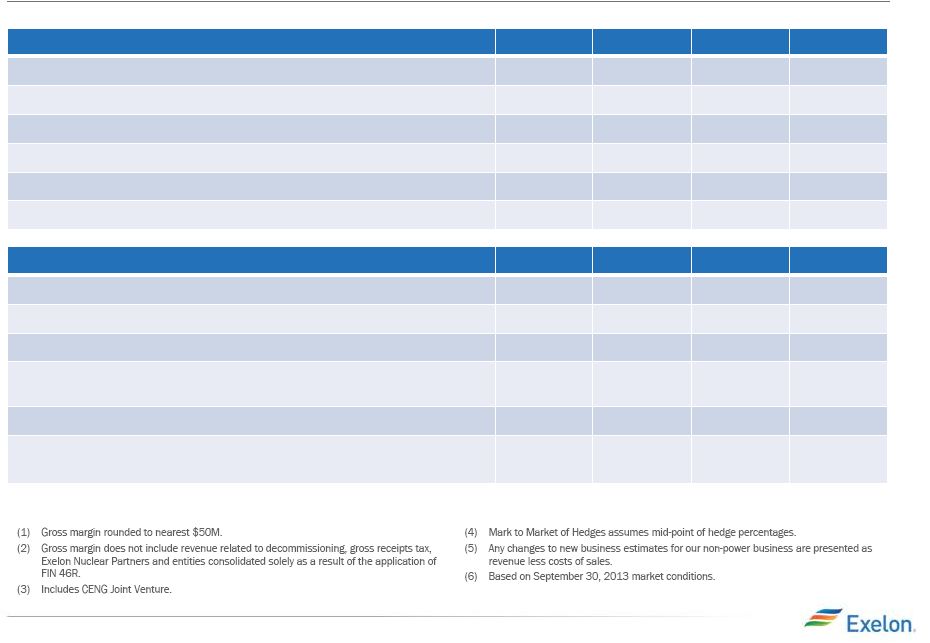
ExGen Disclosures
2013 EEI Conference
Gross Margin Category ($M)
(1,2)
2013
2014
2015
2016
Open
Gross
Margin
(including
South,
West
&
Canada
hedged
GM)
(3)
$5,600
$5,650
$5,800
$5,800
Mark
to
Market
of
Hedges
(3,4)
$1,700
$900
$450
$250
Power
New
Business
/
To
Go
$50
$500
$750
$750
Non-Power
Margins
Executed
(5)
$400
$200
$100
$100
Non-Power
New
Business
/
To
Go
(5)
$200
$400
$500
$500
Total
Gross
Margin
$7,950
$7,650
$7,600
$7,400
Reference Prices
(6)
2013
2014
2015
2016
Henry Hub Natural Gas ($/MMbtu)
$3.65
$3.86
$4.06
$4.17
Midwest: NiHub ATC prices ($/MWh)
$31.18
$30.25
$30.47
$30.99
Mid-Atlantic: PJM-W ATC prices ($/MWh)
$37.58
$37.19
$37.53
$38.13
ERCOT-N ATC Spark Spread ($/MWh)
HSC Gas, 7.2HR, $2.50 VOM
$1.09
$6.30
$8.18
$7.13
New York: NY Zone A ($/MWh)
$37.07
$35.54
$35.70
$36.07
New England: Mass Hub ATC Spark Spread($/MWh)
ALQN Gas, 7.5HR, $0.50 VOM
$3.70
$4.88
$3.69
$2.33 |
 38
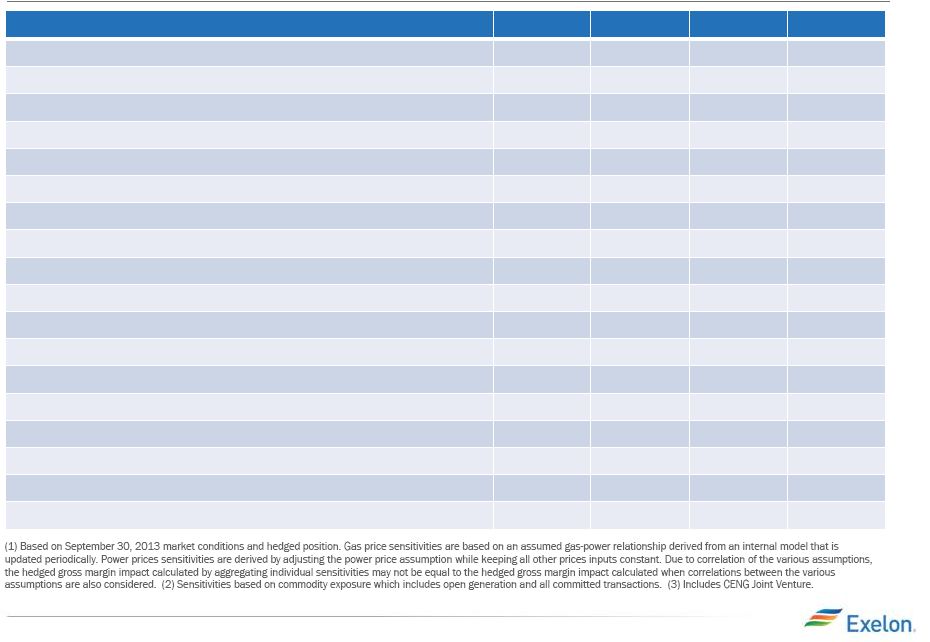
ExGen Disclosures
Generation and Hedges
2013
2014
2015
2016
Exp. Gen (GWh)
(1)
214,700
215,500
209,400
211,000
Midwest
97,200
96,900
96,400
97,400
Mid-Atlantic
(2)
74,500
73,600
70,100
71,400
ERCOT
13,200
17,800
19,600
19,400
New York
(2)
14,000
12,500
9,300
9,300
New England
15,800
14,700
14,000
13,500
% of Expected Generation Hedged
(3)
97-100%
84-87%
48-51%
19-22%
Midwest
97-100%
85-88%
47-50%
16-19%
Mid-Atlantic
(2)
97-100%
90-93%
56-59%
21-24%
ERCOT
92-95%
81-84%
39-42%
31-34%
New York
(2)
98-101%
87-90%
54-57%
19-22%
New England
95-98%
49-52%
22-25%
7-10%
Effective Realized Energy Price ($/MWh)
(4)
Midwest
$37.00
$33.50
$33.00
$34.00
Mid-Atlantic
(2)
$49.00
$45.00
$45.00
$49.00
ERCOT
(5)
$24.00
$11.00
$9.50
$6.50
New York
(2)
$32.00
$37.00
$42.50
$39.50
New England
(5)
$6.00
$3.50
$2.00
$5.50
2013 EEI Conference |
 39
ExGen Hedged Gross Margin Sensitivities
Gross Margin Sensitivities (With Existing Hedges)
(1, 2,3)
2013
2014
2015
2016
Henry Hub Natural Gas ($/MMbtu)
+ $1/MMbtu
$10
$110
$370
$575
-
$1/MMbtu
$0
$(45)
$(305)
$(550)
NiHub ATC Energy Price
+ $5/MWh
$0
$65
$325
$450
-
$5/MWh
$0
$(60)
$(325)
$(450)
PJM-W ATC Energy Price
+ $5/MWh
$0
$35
$175
$290
-
$5/MWh
$0
$(35)
$(170)
$(280)
NYPP Zone A ATC Energy Price
+ $5/MWh
$0
$5
$20
$35
-
$5/MWh
$0
$(10)
$(20)
$(35)
Nuclear Capacity Factor
+/-
1%
+/-
$10
+/-
$40
+/-
$45
+/-
$45
2013 EEI Conference |
 40
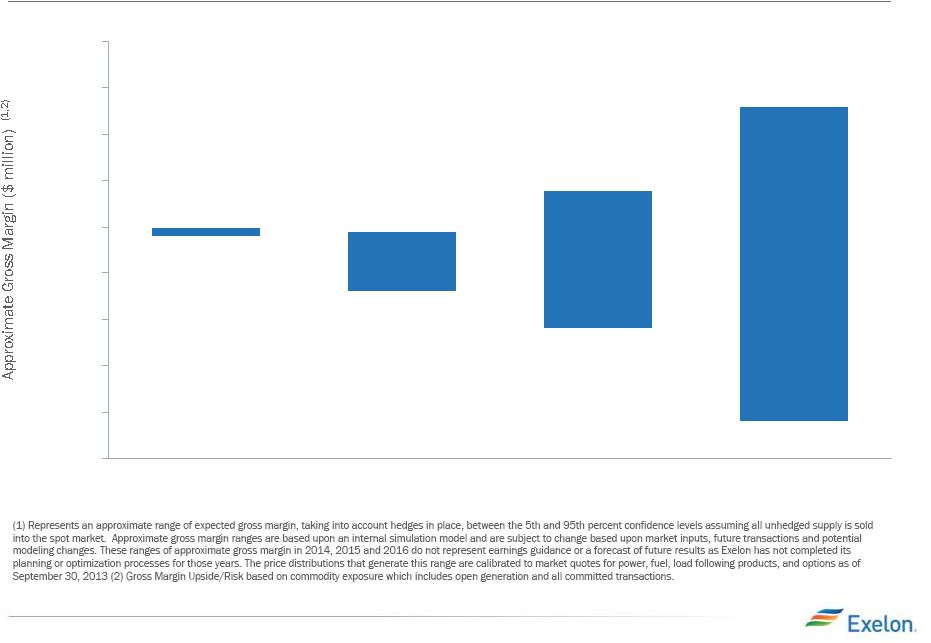
Exelon Generation Hedged Gross Margin Upside/Risk
5,500
6,000
6,500
7,000
7,500
8,000
8,500
9,000
9,500
10,000
2016
2015
2014
2013
$9,300
$8,400
$7,950
$8,000
$7,900
$7,300
2013 EEI Conference
$6,900
$5,900 |
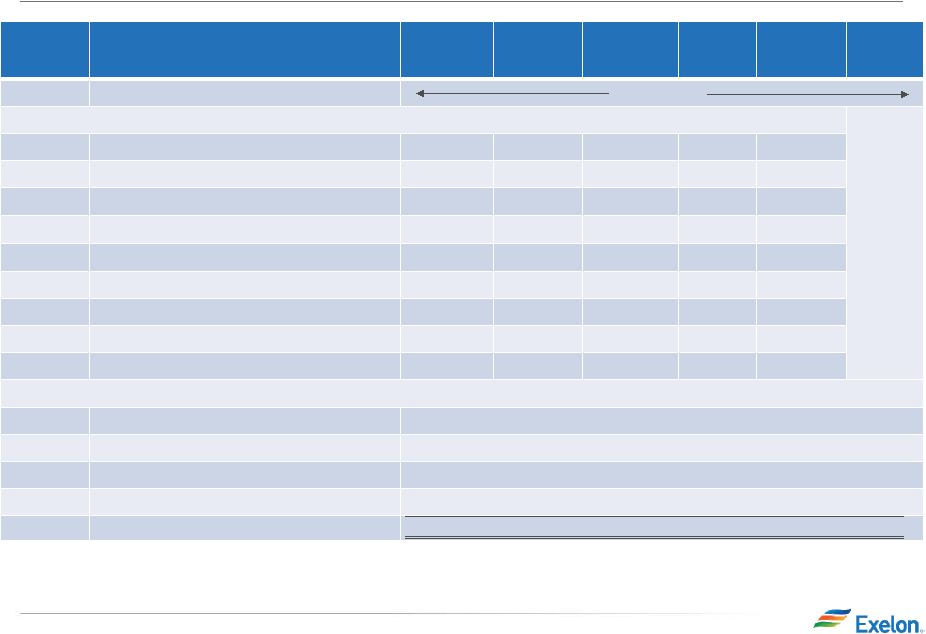 Row
Item
Midwest
Mid-
Atlantic
ERCOT
New York
New
England
South,
West &
Canada
(A)
Start with fleet-wide open gross margin
$5.65 billion
(B)
Expected Generation (TWh)
96.9
73.6
17.8
12.5
14.7
(C)
Hedge % (assuming mid-point of range)
86.5%
91.5%
82.5%
88.5%
50.5%
(D=B*C)
Hedged Volume (TWh)
83.8
67.3
14.7
11.1
7.4
(E)
Effective Realized Energy Price ($/MWh)
$33.50
$45.00
$11.00
$37.00
$3.50
(F)
Reference Price ($/MWh)
$30.25
$37.19
$6.30
$35.54
$4.88
(G=E-F)
Difference ($/MWh)
$3.25
$7.81
$4.70
$1.46
$(1.38)
(H=D*G)
Mark-to-market value of hedges ($ million)
(1)
$275 million
$525 million
$70 million
$15 million
$(10) million
(I=A+H)
Hedged Gross Margin ($ million)
$6,550 million
(J)
Power New Business / To Go ($ million)
$500 million
(K)
Non-Power Margins Executed ($ million)
$200 million
(L)
Non-
Power New Business / To Go ($ million)
$400 million
(N=I+J+K+L)
Total Gross Margin
$7,650 million
41
Illustrative Example of Modeling Exelon
Generation
2014 Gross Margin
(1) Mark-to-market rounded to the nearest $5 million.
2013 EEI Conference |
 42
Constellation Energy Nuclear Group (CENG) Background
As
a
result
of
Exelon’s
equity
interest
in
CENG,
CENG
gross
margins
and
earnings
are
reflected
in
ExGen
disclosures
and
other
financial
statements.
The
following
is
information
related
to
PPA
contracts
between
CENG
and
3
rd
parties
and
the
PPA
between
CENG
and
its
equity
parents.
2013 EEI Conference |
 43
Constellation
Energy
Nuclear
Group
(CENG)
Background
2013 EEI Conference |
 Generation
*
*
*
*
* |
 Exelon Generation Fleet
A clean and diverse portfolio that is well positioned for environmental upside
from EPA regulations
(1)
Total owned generation capacity as of 9/30/2013. Nuclear capacity
reflects EXC ownership of CENG and Salem. 45
National Scope
•
Power generation assets in 20 states and
Canada
•
Low-cost generation capacity provides
unparalleled leverage to rising commodity
prices
Large and Diverse
•
35 GW of diverse generation
(1)
–
19 GW of Nuclear
–
10 GW of Gas
–
2 GW of Hydro
–
2 GW of Oil
–
1 GW of Coal
–
1 GW of Wind/Solar/Other
Clean
•
One of nation’s cleanest fleets as
measured by CO2, SO2 and NOx intensity
•
Less than 5% of generation capacity will
require capital expenditures to comply
with Air Toxic rules
2013 EEI Conference |
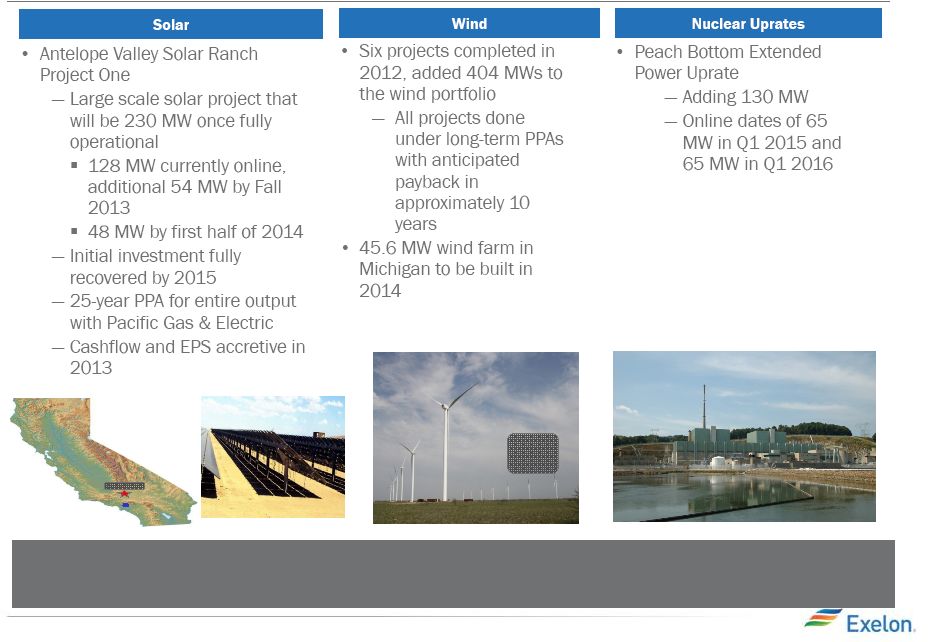 Executing on Generation Development and Growth Projects
Expanding the contracted renewable portfolio of Solar and Wind while adding
incremental MWs to our existing nuclear fleet
46
Los Angeles
AVSR 1
Wildcat
Wind
2013 EEI Conference |
 Exelon Nuclear Fleet Overview (including CENG and Salem)
(1)
Operating license renewal process takes approximately 4-5 years from
commencement until completion of NRC review. (2)
The date for loss of full core reserve identifies when the on-site storage
pool will no longer have sufficient space to receive a full complement of fuel from the reactor core. Dry cask storage will be in operation at those sites prior to losing full core discharge
capacity in their on-site storage pools.
(3)
On December 8, 2010, Exelon announced that it will permanently cease generation
operations at Oyster Creek by December 31, 2019. Oyster Creek’s
current NRC license expires in 2029. (4)
Exelon Generation has a 50.01% ownership interest in CENG (Constellation Energy
Nuclear Group, LLC). Electricite de France SA (EDF) has a 49.99% ownership interest in CENG.
47
2013 EEI Conference |
 48
1,208
1,169
1,104
(1)
Exelon fleet averages exclude Salem and CENG
(2)
Source: 2012 Electric Utility Cost Group (EUCG) survey. Includes
Fuel Cost plus Direct O&M divided by net generation.
(3)
Source:
Platts
Nuclear
News,
Nuclear
Energy
Institute
and
Energy
Information
Administration
(Department
of
Energy).
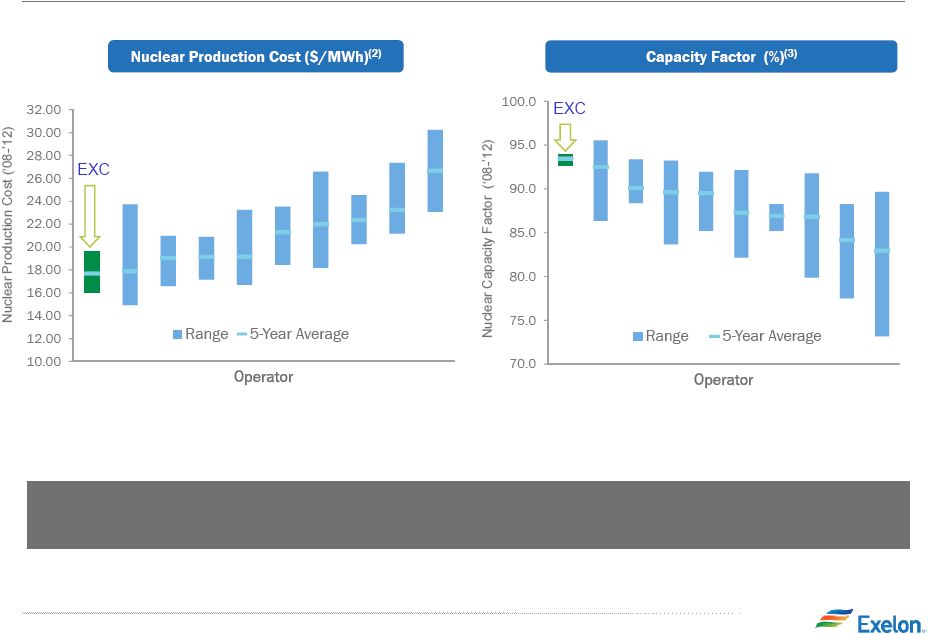
World Class Nuclear Operator
(1)
Among major nuclear plant fleet operators, Exelon is consistently one of the
lowest-cost and most efficient producers of electricity in the
nation 2013 EEI Conference |
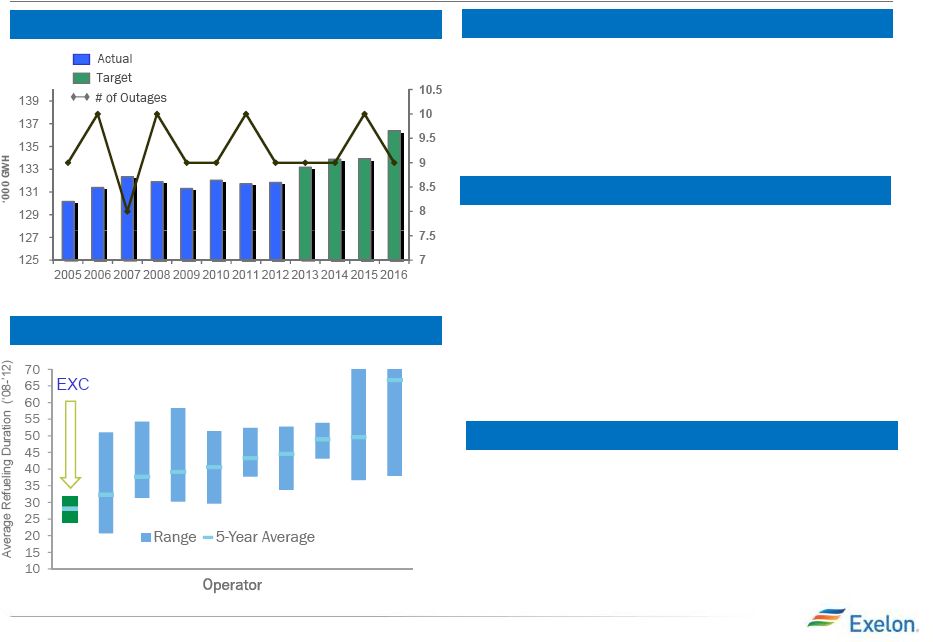 Nuclear Output and Refueling Outages
Fleet Average Refueling Outage Duration (Days)
(1)
31%
36%
14%
14%
Nuclear Output
(1)
(1) Net nuclear generation data at ownership excluding
Salem and CENG. 2016 includes
Clinton Refueling Only outage of shortened duration. 49
Nuclear Refueling Cycle
•
All Exelon owned units on a 24 month cycle
except for Braidwood U1/U2, Byron U1/U2 and
Salem U1/U2, which are on 18 month cycles
•
Starting in 2015 Clinton is on annual cycles
2013 Refueling Outage Impact
•
10 planned refueling outages, including 1 at
Salem
•
Exelon completed 4 refueling outages in the
Spring with an average duration of 24 days
•
Salem completed 1 refueling outage in the
Spring
•
5 Exelon planned Fall refueling outages
(Braidwood 1, Peach Bottom 3, Clinton, Three
Mile Island and Dresden 2)
(1) Exelon fleet averages exclude Salem and CENG.
2013 EEI Conference
2014 Refueling Outage Impact
•
11 planned refueling outages, including 2 at
Salem
•
5 Exelon planned Spring refueling outages and
4 planned Fall refueling outages
•
1 Salem planned Spring refueling outage and 1
planned Fall refueling outage |
 Nuclear Fuel Costs
(1)
Projected Exelon (100%) Uranium Demand
Components of Fuel Expense in 2013
2013 –
2016: 100% hedged in volume
2017:
~80% hedged in volume
2018:
~50% hedged in volume
2
1
0
11
10
9
8
7
6
5
4
3
2018E
2017E
2016E
2015E
2014E
2013
Enrichment
30%
Tax/Interest
2%
Conversion
3%
Uranium
38%
Nuclear Waste
13%
Fabrication
14%
(1)
All charts exclude Salem and CENG.
(2)
At ownership, excluding Salem and CENG. Excludes costs reimbursed under the
settlement agreement with the DOE. 50
Nuclear Fuel Capex
2013 EEI Conference |
 Constellation Energy Nuclear Group (CENG)
Operating Services Agreement
51
•
Agreements
signed
between
Exelon
and
EDF,
with
expected
close
in
2014
(first
quarter
or early second quarter)
•
Nuclear Operating services agreement
•
Integrate CENG and their 3 plants into Exelon Nuclear with transfer of
operating licenses •
Utilize Exelon Nuclear Management Model to improve plant performance
•
Leverage
scale
and
obtain
cost
efficiencies
of
running
a
larger,
integrated
fleet
•
Expect cost synergies of $50-$70M at 100% ownership
•
Loan to CENG and distributions to EDF/Exelon Generation
•
Exelon Generation $400M loan to CENG at 5.25% annual interest rate
•
CENG $400M special distribution to EDF
•
Exelon Generation to receive preferred distributions from CENG’s available
cash flows until loan is fully repaid
•
Exelon Generation also to receive aggregate distributions of $400M plus a
return of 8.5% per annum from the date of the special dividend
•
Option provision for EDF to sell its 49.99% interest in CENG to Exelon
Generation •
Exercisable from January 2016 to June 2022, priced at fair market value
•
Indemnify EDF in the event of a future nuclear incident (as defined in the Price
Anderson Act) in connection with the CENG nuclear plants or their
operations •
Given Exelon’s size and past performance, no material impact to
premiums Leverages Exelon’s best-in-class operations, scale
and low-cost fleet to add value 2013 EEI Conference
|