Attached files
| file | filename |
|---|---|
| 8-K - CURRENT REPORT - Wendy's Co | d622804d8k.htm |
 Third
Quarter 2013 Conference Call
November 7, 2013
©
2013 Oldemark LLC
Exhibit 99.1 |
 JOHN
BARKER Chief Communications
Officer
2
©
2013 Oldemark LLC |
 Today’s Agenda
CEO Overview
Emil Brolick
Financial Update
Q&A
3
Todd
Penegor |
 4
Forward-Looking Statements and Non-GAAP Financial Measures
This presentation, and certain information that management may discuss in connection with
this presentation, contains certain statements that are not historical facts,
including information concerning possible or assumed future results of our
operations. Those statements constitute “forward-looking statements”
within the meaning of the Private Securities Litigation Reform Act of 1995 (The “Reform
Act”). For all forward-looking statements, we claim the protection of the safe
harbor for forward-looking statements contained in the Reform Act. Many
important factors could affect our future results and could cause those results to differ materially
from those expressed in or implied by our forward-looking statements. Such factors,
all of which are difficult or impossible to predict accurately, and many of which
are beyond our control, include but are not limited to those identified under the
caption “Forward-Looking Statements” in our news release issued on
November 7, 2013 and in the “Special Note Regarding Forward-Looking Statements and
Projections” and “Risk Factors” sections of our most recent Form 10-K
/ Form 10-Qs.
In addition, this presentation and certain information management may discuss in
connection with this presentation reference non-GAAP financial measures, such
as adjusted earnings before interest, taxes, depreciation and amortization, or
adjusted EBITDA, and adjusted earnings per share. Adjusted EBITDA and adjusted
earnings per share exclude certain expenses, net of certain benefits. Reconciliations of
non-GAAP financial measures to the most directly comparable GAAP financial measures
are provided in the Appendix to this presentation, and are included in our news
release issued on November 7, 2013 and posted on www.aboutwendys.com. |
 EMIL
BROLICK President & CEO
5
5
©
2013 Oldemark LLC |
 ©
2013 Oldemark LLC
SYSTEM OPTIMIZATION
PROCEEDING AS PLANNED
CONFIDENT IN 4Q; RAISING
2013 EARNINGS OUTLOOK
BRAND TRANSFORMATION
MOMENTUM CONTINUES
STRONG QUARTER OF SALES
AND EARNINGS GROWTH
6
IMAGE ACTIVATION
PROGRESSING |
 Adjusted
EBITDA* $98.7 mil
vs. $84.5 mil
Adjusted EPS*
$0.08 vs.
$0.02
N.A. Rest. Margin
15.6% vs. 13.9%
Co.-Op. SSS
3.2% vs. 2.7%
7
Q3 2013 Highlights
2013
2012
*See reconciliation of Adjusted EBITDA and Adjusted EPS in the appendix.
+17%
+$0.06
5.9%
2-year
+170bps |
 8
HIGH
LOW
FUNCTIONAL
EMOTIONAL
BRAND VISION
NEW
QSRs
TRADITIONAL
QSRs
EXPERIENCE |
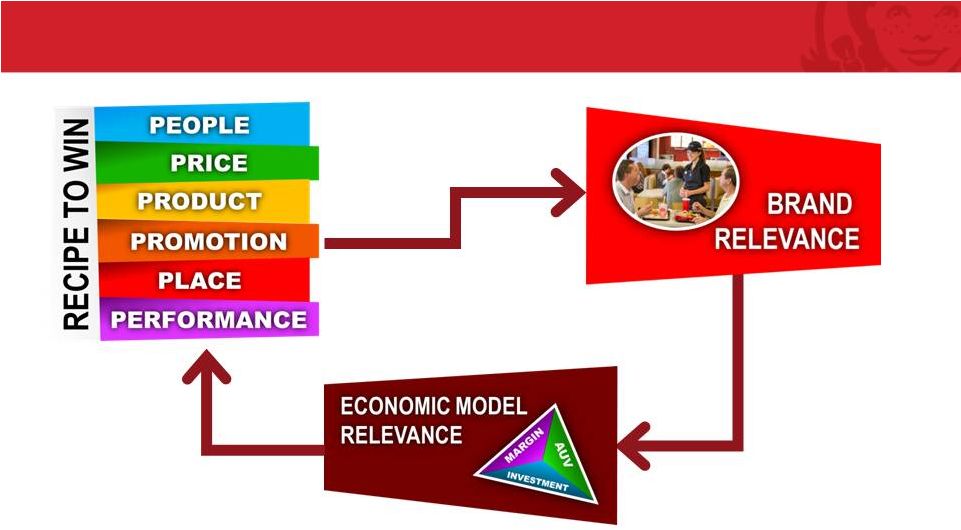
 PRODUCT
Play a different game
PRICE
New QSR Quality at QSR Price
PROMOTION
Strategically driven, tactically brilliant
PEOPLE
5-Star Performers
PERFORMANCE
Keeping the brand promise
PLACE
The complete brand experience
9
THE RECIPE TO WIN |
 10
Regaining Heritage of Product Innovation |
 11 |
 12
PREMIUM
PRICE / VALUE
Executing the High-Low Strategy |
 13 |
 14
Ultimate source of differentiation |
 wendys.com
LinkedIn
Ultimate source of differentiation |
 16
Source: QSR Magazine’s 2013 Drive-Thru Performance Study
Fastest Drive-Thru in QSR
134
158
181
189
198
204
218
Average Drive
-
Thru Time in Seconds |
 17
IMAGE ACTIVATION
New QSR Experience |
 SYSTEM
OPTIMIZATION Selling 425 Restaurants to Franchisees
SHAREHOLDER VALUE
EFFICIENCY
OPERATIONAL EFFECTIVENESS
GROWTH |
 •
Completed sale of 118 restaurants through Nov. 7, 2013
•
New and existing franchisees
•
Strong operators with proven success
•
Strong financially and well-capitalized
•
Growth mindset –
commitment to Image Activation and new restaurant
development
•
Demonstrated commitment to customer service
SYSTEM OPTIMIZATION PROGRESS |
 20
Brand Relevance Drives Economic Model Relevance |
 ©
2013 Oldemark LLC
TODD PENEGOR
Chief Financial Officer
21 |
 Image
Activation Continues to Evolve 22
Core Remodel Costs*
* Does not include deferred maintenance
$1,200
$800
$650
$550
2011
2014 |
 STANDARD DESIGN
IMAGE ACTIVATION
New QSR Experience |
 Expect
System Optimization to Produce Higher Quality Earnings
24
Royalties
$25 M
Rent
$20 M
G&A
$30 M
EBITDA Lost
EBITDA Gained
=
* Estimates based on Company’s current outlook.
Restaurant
EBITDA
$75 M |
 25
Q3 2013 Highlights
N.A. Company Restaurant
Margin +170 bps
Q3 2013 15.6%
Q3 2012 13.9%
N.A. Company Restaurant
Margin +170 bps
Q3 2013 15.6%
Q3 2012 13.9%
Q3 2013 North America
Same-Store Sales
1-Year
2-Year
Company-Operated
Franchise
3.1%
6.0%
3.2%
5.9% |
 26
Q3 2013 Financial Summary
Q3
2013
Q3
2012
%
Change
Sales
558.0
$
558.3
$
-0.1%
Franchise revenues
82.8
78.0
6.2%
Total revenues
640.8
$
636.3
$
0.7%
Adjusted EBITDA*
98.7
$
84.5
$
16.8%
($ in millions)
(Unaudited)
*See reconciliation of Adjusted EBITDA in the appendix.
|
 27
Q3 2013 Financial Summary
Q3
2013
Q3
2012
$
Change
Adjusted EPS*
0.08
$
0.02
$
0.06
$
Reported EPS
(0.00)
$
(0.07)
$
0.07
$
(Unaudited)
*See reconciliation of Adjusted EPS in the appendix.
|
 Solid
Four Quarters Earnings 28
2013
2012
Q4
Q1
Q2
Adjusted EBITDA
Adjusted EPS
Q3
$98.7*
Actual
Prior Year
% Change
$102.1
$77.3
$95.9
$84.5
$89.1
$63.9
$80.9
+17%
+15%
+21%
+19%
$0.08*
Actual
Prior Year
% Change
$0.08
$0.03
$0.09
$0.02
$0.05
$0.01
$0.04
+300%
+60%
+200%
+125%
* See reconciliation of Adjusted EBITDA and Adjusted EPS in the appendix.
|
 29
YTD 2013 Cash Flow Highlights
($ in millions)
YTD 2013
YTD 2012
Cash flow from operations
252.7
$
124.6
$
Capital expenditures
130.8
126.3
Beginning cash balance
453.4
$
475.2
$
Change in cash
60.1
(21.6)
Ending cash balance
513.4
$
453.6
$ |
 30
Selected Balance Sheet Highlights
($ in millions)
Cash
513
$
Senior Debt
1,429
$
Capital Leases and Other Debt
43
Total Debt
1,472
$
TTM Adjusted EBITDA
374
$
Total Debt / TTM Adjusted EBITDA
3.9x
Net Debt / TTM Adjusted EBITDA
2.6x
Sept. 29, 2013 |
 Raising
2013 Outlook Estimates based on Company’s current outlook.
31
Adjusted EBITDA:
Approximately $365 million
Adjusted EPS:
Approximately $0.25 |
 2013
Outlook Estimates based on Company’s current outlook.
32
•
Adjusted EBITDA of approximately $365 million
•
Adjusted EPS of approximately $0.25
•
SSS of approximately 2.0 percent
•
Restaurant margin of 15.0 percent
•
25 Company IA openings & 100 Company IA reimages
•
Expect to make incremental fourth-quarter investments to drive growth
•
As a result, project fourth-quarter Adjusted EBITDA to decline approximately 10
percent. |
 ©
2013 Oldemark LLC
SYSTEM OPTIMIZATION
DRIVING IMPROVED EARNINGS
QUALITY
HIGH-QUALITY Q3 DRIVEN BY
SSS GROWTH
33
SOLID MOMENTUM; RAISING
2013 EARNINGS OUTLOOK
CONFIDENT IN LONG-TERM
OUTLOOK |
 ©
2013 Oldemark LLC
JOHN BARKER
Chief Communications
Officer
34 |
 ©
2013 Oldemark LLC
MEG NOLLEN
Senior Vice President
Strategy and Investor
Relations
35 |
 2013
Events Nov. 13: Image Activation tour in Dublin (host: Stephens)
2014 Events
Jan. 13: ICR Conference –
Preliminary 2013 Earnings and
2014 Guidance
36
Investor Relations Calendar |
 Q&A
37 |
 Appendix
38 |
 Reconciliation of Adjusted EBITDA from Continuing Operations
to Net (Loss) Income Attributable to The Wendy's Company
39
(In Thousands)
(Unaudited)
Three Months
Nine Months
2013
2012
2013
2012
Adjusted EBITDA from continuing operations
$ 98,737
$ 84,491
$ 278,122
$ 237,445
Less:
Depreciation and amortization
(44,325)
(41,878)
(134,841)
(110,136)
Impairment of long-lived assets
(5,327)
-
(5,327)
(7,781)
Facilities action charges, net
(22,275)
(11,430)
(31,690)
(27,561)
Costs associated with closed restaurants in other operating
(income) expense, net
-
-
-
(1,477)
Operating profit
26,810
31,183
106,264
90,490
Interest expense
(15,620)
(21,566)
(55,548)
(77,803)
Loss on early extinguishment of debt
-
(49,881)
(21,019)
(75,076)
Investment income and other income (expense), net
2,273
900
50
30,471
Income (loss) from continuing operations before income taxes
and noncontrolling interests
13,463
(39,364)
29,747
(31,918)
(Provision for) benefit from income taxes
(15,625)
12,672
(17,774)
14,467
(Loss) income from continuing operations
(2,162)
(26,692)
11,973
(17,451)
Discontinued operations:
Income from discontinued operations, net of income taxes
-
784
-
784
Loss on disposal of discontined operations, net of income taxes
-
(254)
-
(254)
Net income from discontinued operations
-
530
-
530
Net (loss) income
(2,162)
(26,162)
11,973
(16,921)
Net loss (income) attributable to noncontrolling
interests 223
-
445
(2,384)
Net (loss) income attributable to The Wendy's Company
$ (1,939)
$ (26,162)
$ 12,418
$ (19,305)
|
 40
Reconciliation of Adjusted Income and Adjusted Earnings Per Share from
Continuing Operations to Net (Loss) Income and Earnings Per Share
Attributable to The Wendy's Company
(a)
Adjusted earnings per share amounts for the three months ended September 29, 2013 and
the three and nine months ended September 30, 2012, include the dilutive effect of stock
options and restricted shares, which were excluded from the reported number of shares
used to calculate basic and diluted loss per share, as the impact would have been anti-dilutive.
Included above is a reconciliation of the number of shares used to calculate adjusted
earnings per share amounts.
(In Thousands Except Per Share Amounts)
(Unaudited)
Per share
(a)
Per share
(a)
Per share
Per share
(a)
Adjusted income and adjusted earnings per share from continuing operations
30,254
$
0.08
$
9,119
$
0.02
$
75,132
$
0.19
$
31,687
$
0.08
$
(Less) plus:
Facilities action charges, net
(24,990)
(0.06)
(7,066)
(0.02)
(30,875)
(0.08)
(17,038)
(0.04)
Depreciation of assets that will be replaced as part of the Image Activation
initiative (3,591)
(0.01)
-
-
(15,312)
(0.04)
-
-
Loss on early extinguishment of debt
-
-
(30,926)
(0.08)
(13,137)
(0.03)
(46,547)
(0.12)
Impairment of long-lived assets
(3,332)
(0.01)
-
-
(3,332)
(0.01)
(4,801)
(0.02)
(Loss) gain on sale of investment, net
(503)
(0.00)
-
-
(503)
(0.00)
17,978
0.05
Benefits of prior years' tax matters
-
-
2,181
0.01
-
-
2,181
0.01
Costs associated with closed restaurants in other operating (income) expense,
net -
-
-
-
-
-
(911)
(0.00)
Total adjustments
(32,416)
(0.08)
(35,811)
(0.09)
(63,159)
(0.16)
(49,138)
(0.12)
(Loss) income from continuing operations
(2,162)
(0.00)
(26,692)
(0.07)
11,973
0.03
(17,451)
(0.04)
Net income from discontinued operations
-
-
530
0.00
-
-
530
0.00
Net (loss) income
(2,162)
(0.00)
(26,162)
(0.07)
11,973
0.03
(16,921)
(0.04)
Net loss (income) attributable to noncontrolling interests
223
0.00
-
-
445
0.00
(2,384)
(0.01)
Net (loss) income and earnings per share attributable to The Wendy's Company
(1,939)
$
(0.00)
$
(26,162)
$
(0.07)
$
12,418
$
0.03
$
(19,305)
$
(0.05)
$
Reported number of shares used to calculate diluted (loss) income per
share 392,579
390,406
398,101
390,028
Plus: Dilutive effect of stock options and restricted shares
8,145
1,514
-
1,946
Adjusted number of shares used to calculate adjusted earnings per share
400,724
391,920
398,101
391,974
2013
2012
2013
2012
Three Months
Nine Months |