Attached files
| file | filename |
|---|---|
| 8-K - 8-K - PennyMac Mortgage Investment Trust | a13-23723_18k.htm |
| EX-99.1 - EX-99.1 - PennyMac Mortgage Investment Trust | a13-23723_1ex99d1.htm |
Exhibit 99.2
|
|
PennyMac Mortgage Investment Trust November 6, 2013 Third Quarter 2013 Earnings Report |

|
|
3Q13 Earnings Report 2 This presentation contains forward-looking statements within the meaning of Section 21E of the Securities Exchange Act of 1934, as amended, regarding management’s beliefs, estimates, projections and assumptions with respect to, among other things, the Company’s financial results, future operations, business plans and investment strategies, as well as industry and market conditions, all of which are subject to change. Words like “believe,” “expect,” “anticipate,” “promise,” “plan,” and other expressions or words of similar meanings, as well as future or conditional verbs such as “will,” “would,” “should,” “could,” or “may” are generally intended to identify forward-looking statements. Actual results and operations for any future period may vary materially from those projected herein, from past results discussed herein, or illustrative examples provided herein. Factors which could cause actual results to differ materially from historical results or those anticipated include, but are not limited to: changes in our investment objectives or investment or operational strategies; volatility in our industry, the debt or equity markets, the general economy or the residential finance and real estate markets; changes in general business, economic, market, employment and political conditions or in consumer confidence; declines in residential real estate or significant changes in U.S. housing prices or activity in the U.S. housing market; availability of, and level of competition for, attractive risk-adjusted investment opportunities in residential mortgage loans and mortgage-related assets that satisfy our investment objectives; concentration of credit risks to which we are exposed; the degree and nature of our competition; our dependence on our manager and servicer, potential conflicts of interest with such entities, and the performance of such entities; availability, terms and deployment of short-term and long-term capital; unanticipated increases or volatility in financing and other costs; the performance, financial condition and liquidity of borrowers; incomplete or inaccurate information or documentation provided by customers or counterparties, or adverse changes in the financial condition of our customers and counterparties; the quality and enforceability of the collateral documentation evidencing our ownership and rights in the assets in which we invest; increased rates of delinquency, default and/or decreased recovery rates on our investments; increased prepayments of the mortgages and other loans underlying our mortgage-backed securities and other investments; the degree to which our hedging strategies may protect us from interest rate volatility; our failure to maintain appropriate internal controls over financial reporting; our ability to comply with various federal, state and local laws and regulations that govern our business; changes in legislation or regulations or the occurrence of other events that impact the business, operations or prospects of government agencies, mortgage lenders and/or publicly-traded companies; the creation of the Consumer Financial Protection Bureau, or CFPB, and enforcement of its rules; changes in government support of homeownership; changes in government or government-sponsored home affordability programs; changes in governmental regulations, accounting treatment, tax rates and similar matters (including changes to laws governing the taxation of real estate investment trusts, or REITs; limitations imposed on our business and our ability to satisfy complex rules for us to qualify as a REIT for U.S. federal income tax purposes and qualify for an exclusion from the Investment Company Act of 1940 and the ability of certain of our subsidiaries to qualify as REITs or as taxable REIT subsidiaries for U.S. federal income tax purposes and our ability and the ability of our subsidiaries to operate effectively within the limitations imposed by these rules; and the effect of public opinion on our reputation. You should not place undue reliance on any forward-looking statement and should consider all of the uncertainties and risks described above, as well as those more fully discussed in reports and other documents filed by the Company with the Securities and Exchange Commission from time to time. The Company undertakes no obligation to publicly update or revise any forward-looking statements or any other information contained herein, and the statements made in this presentation are current as of the date of this presentation only. Forward-Looking Statements |
|
|
3Q13 Earnings Report 3 Third Quarter Highlights Net income of $39.7 million on net investment income of $86.1 million Diluted EPS of $0.57 per share and dividend of $0.57 per share Segment pretax income (loss): Investment Activities: $36.4 million; Correspondent Lending: $(0.3) million Issued $250 million of new equity in August Strong investment activity across multiple strategies, deploying over $350 million in equity capital: Acquired two pools of nonperforming whole loans totaling $930 million in unpaid principal balance (UPB) Completed $550.5 million jumbo securitization, retaining $367 million in senior, subordinate and IO securities Completed initial investments in excess servicing spread from MSRs acquired by PennyMac Financial Services, Inc. (NYSE: PFSI) Grew originated mortgage servicing rights (MSR) asset from $227 million to $270 million Correspondent acquisitions totaled $7.7 billion; correspondent locks totaled $6.7 billion |
|
|
3Q13 Earnings Report 4 Significant New Investments Continued After Quarter End Investments in excess servicing spread on bulk MSR portfolio acquisitions totaling $21 billion in UPB Acquired $62 million in excess servicing spread on a portfolio of recently originated Fannie Mae MSRs totaling $10.3 billion in UPB Expected to enter into an agreement with PFSI relating to the acquisition of approximately $85 million in excess servicing spread from a $10.8 billion UPB portfolio of legacy Ginnie Mae MSRs that PFSI is expected to acquire from a third party(1) Entered into an agreement to acquire $563 million in UPB of nonperforming whole loans expected to settle in late November(2) Expect to close the pending investments in Q4 through a combination of cash and additional debt financing (1) The MSR acquisition by PFSI and the Company’s purchase of excess servicing spread are subject to the negotiation and execution of definitive documentation, continuing due diligence and customary closing conditions. There can be no assurance that the committed amounts will ultimately be acquired or that the transactions will be completed at all. (2) This pending transaction is subject to the negotiation and execution of definitive documentation, continuing due diligence, and customary closing conditions. There can be no assurance that the committed amounts will ultimately be acquired or that the transaction will be completed. |
|
|
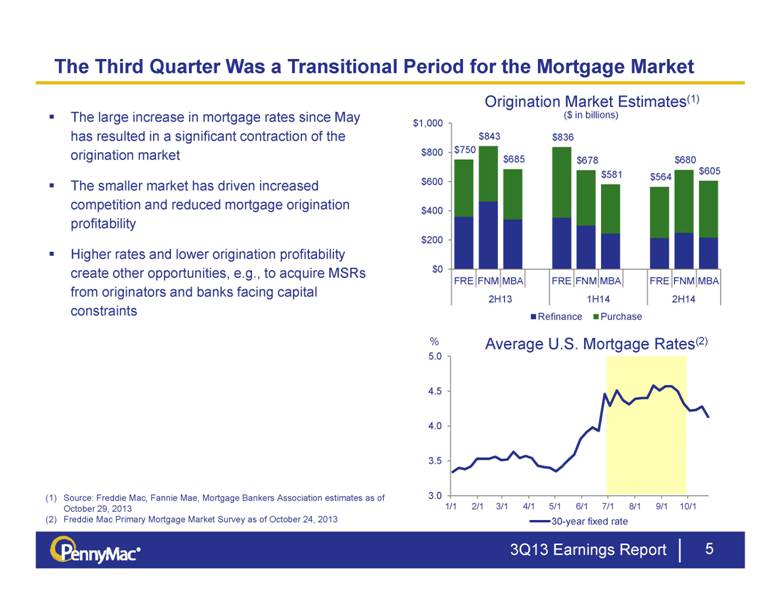
5 The Third Quarter Was a Transitional Period for the Mortgage Market 3Q13 Earnings Report Source: Freddie Mac, Fannie Mae, Mortgage Bankers Association estimates as of October 29, 2013 Freddie Mac Primary Mortgage Market Survey as of October 24, 2013 Origination Market Estimates(1) The large increase in mortgage rates since May has resulted in a significant contraction of the origination market The smaller market has driven increased competition and reduced mortgage origination profitability Higher rates and lower origination profitability create other opportunities, e.g., to acquire MSRs from originators and banks facing capital constraints % ($ in billions) Average U.S. Mortgage Rates(2) |
|
|
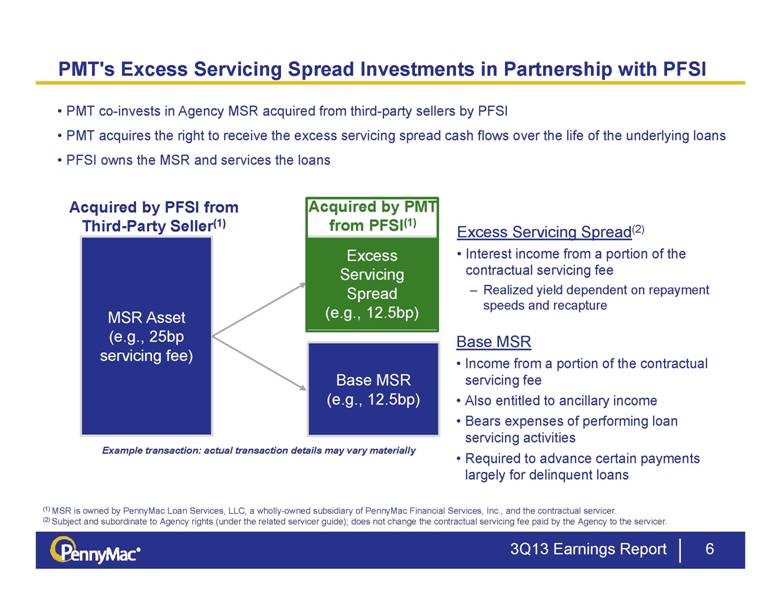
Excess Servicing Spread (e.g., 12.5bp) MSR Asset (e.g., 25bp servicing fee) 3Q13 Earnings Report 6 PMT's Excess Servicing Spread Investments in Partnership with PFSI Acquired by PFSI from Third-Party Seller(1) PMT co-invests in Agency MSR acquired from third-party sellers by PFSI PMT acquires the right to receive the excess servicing spread cash flows over the life of the underlying loans PFSI owns the MSR and services the loans (1) MSR is owned by PennyMac Loan Services, LLC, a wholly-owned subsidiary of PennyMac Financial Services, Inc., and the contractual servicer. (2) Subject and subordinate to Agency rights (under the related servicer guide); does not change the contractual servicing fee paid by the Agency to the servicer. Excess Servicing Spread(2) Interest income from a portion of the contractual servicing fee Realized yield dependent on repayment speeds and recapture Base MSR Income from a portion of the contractual servicing fee Also entitled to ancillary income Bears expenses of performing loan servicing activities Required to advance certain payments largely for delinquent loans Base MSR (e.g., 12.5bp) Acquired by PMT from PFSI(1) Example transaction: actual transaction details may vary materially |
|
|
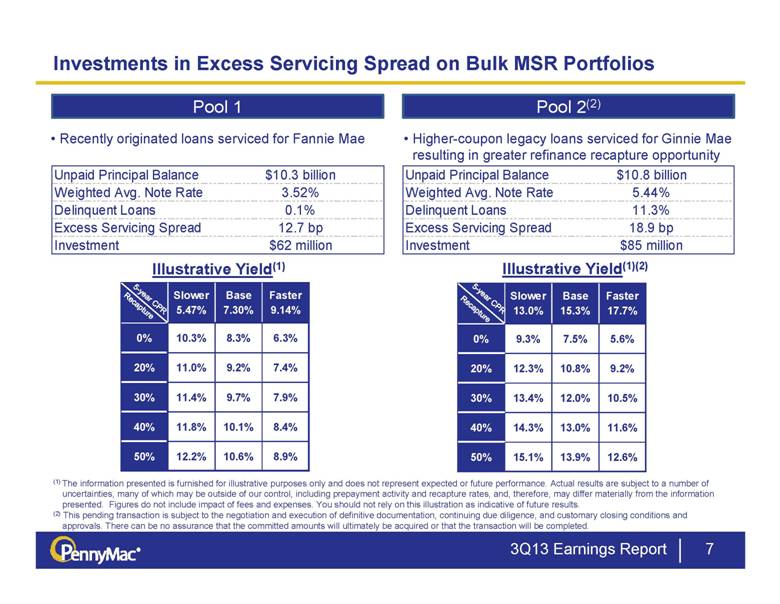
Investments in Excess Servicing Spread on Bulk MSR Portfolios 3Q13 Earnings Report 7 5-year CPR Recapture Recently originated loans serviced for Fannie Mae Pool 1 Pool 1 Pool 2(2) Higher-coupon legacy loans serviced for Ginnie Mae resulting in greater refinance recapture opportunity (1) The information presented is furnished for illustrative purposes only and does not represent expected or future performance. Actual results are subject to a number of uncertainties, many of which may be outside of our control, including prepayment activity and recapture rates, and, therefore, may differ materially from the information presented. Figures do not include impact of fees and expenses. You should not rely on this illustration as indicative of future results. (2) This pending transaction is subject to the negotiation and execution of definitive documentation, continuing due diligence, and customary closing conditions and approvals. There can be no assurance that the committed amounts will ultimately be acquired or that the transaction will be completed. Illustrative Yield(1)(2) 5-year CPR Recapture Illustrative Yield(1) Slower 5.47% Base 7.30% Faster 9.14% 0% 10.3% 8.3% 6.3% 20% 11.0% 9.2% 7.4% 30% 11.4% 9.7% 7.9% 40% 11.8% 10.1% 8.4% 50% 12.2% 10.6% 8.9% Unpaid Principal Balance $10.3 billion Weighted Avg. Note Rate 3.52% Delinquent Loans 0.1% Excess Servicing Spread 12.7 bp Investment $62 million Unpaid Principal Balance $10.8 billion Weighted Avg. Note Rate 5.44% Delinquent Loans 11.3% Excess Servicing Spread 18.9 bp Investment $85 million Slower 13.0% Base 15.3% Faster 17.7% 0% 9.3% 7.5% 5.6% 20% 12.3% 10.8% 9.2% 30% 13.4% 12.0% 10.5% 40% 14.3% 13.0% 11.6% 50% 15.1% 13.9% 12.6% |
|
|
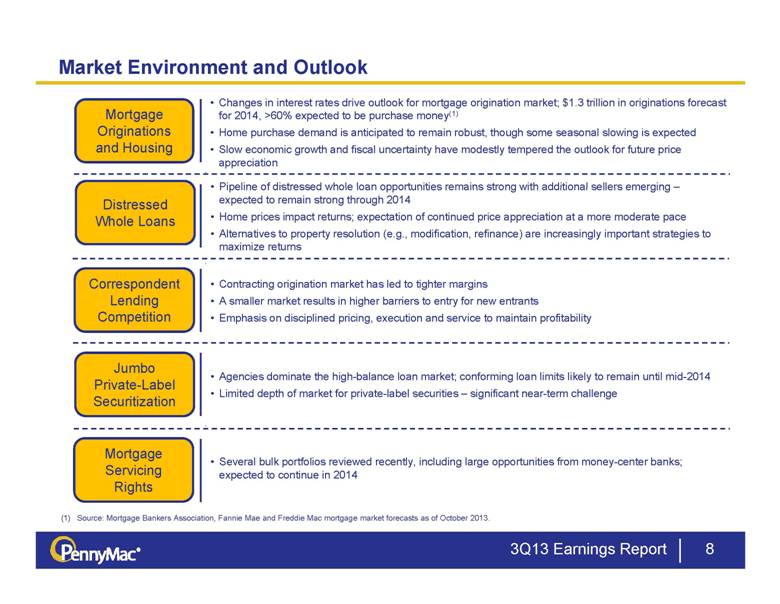
Market Environment and Outlook 8 Correspondent Lending Competition Jumbo Private-Label Securitization Mortgage Originations and Housing Changes in interest rates drive outlook for mortgage origination market; $1.3 trillion in originations forecast for 2014, >60% expected to be purchase money(1) Home purchase demand is anticipated to remain robust, though some seasonal slowing is expected Slow economic growth and fiscal uncertainty have modestly tempered the outlook for future price appreciation Contracting origination market has led to tighter margins A smaller market results in higher barriers to entry for new entrants Emphasis on disciplined pricing, execution and service to maintain profitability Pipeline of distressed whole loan opportunities remains strong with additional sellers emerging – expected to remain strong through 2014 Home prices impact returns; expectation of continued price appreciation at a more moderate pace Alternatives to property resolution (e.g., modification, refinance) are increasingly important strategies to maximize returns 3Q13 Earnings Report Distressed Whole Loans Agencies dominate the high-balance loan market; conforming loan limits likely to remain until mid-2014 Limited depth of market for private-label securities – significant near-term challenge Source: Mortgage Bankers Association, Fannie Mae and Freddie Mac mortgage market forecasts as of October 2013. Mortgage Servicing Rights Several bulk portfolios reviewed recently, including large opportunities from money-center banks; expected to continue in 2014 |
|
|
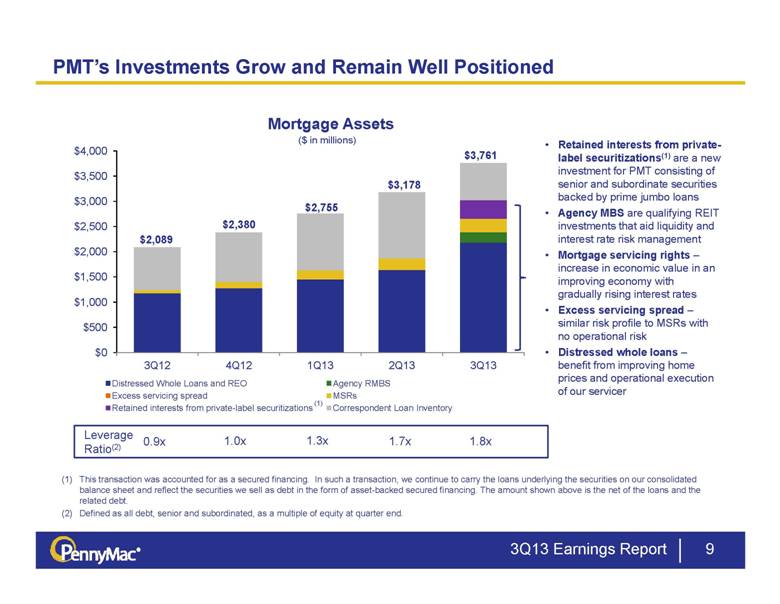
9 PMT’s Investments Grow and Remain Well Positioned Mortgage Assets ($ in millions) This transaction was accounted for as a secured financing. In such a transaction, we continue to carry the loans underlying the securities on our consolidated balance sheet and reflect the securities we sell as debt in the form of asset-backed secured financing. The amount shown above is the net of the loans and the related debt. Defined as all debt, senior and subordinated, as a multiple of equity at quarter end. 1.7x 1.3x 1.0x 0.9x 1.8x Leverage Ratio(2) Retained interests from private-label securitizations(1) are a new investment for PMT consisting of senior and subordinate securities backed by prime jumbo loans Agency MBS are qualifying REIT investments that aid liquidity and interest rate risk management Mortgage servicing rights – increase in economic value in an improving economy with gradually rising interest rates Excess servicing spread – similar risk profile to MSRs with no operational risk Distressed whole loans – benefit from improving home prices and operational execution of our servicer 3Q13 Earnings Report (1) |
|
|
Mortgage Investment Activities |

|
|
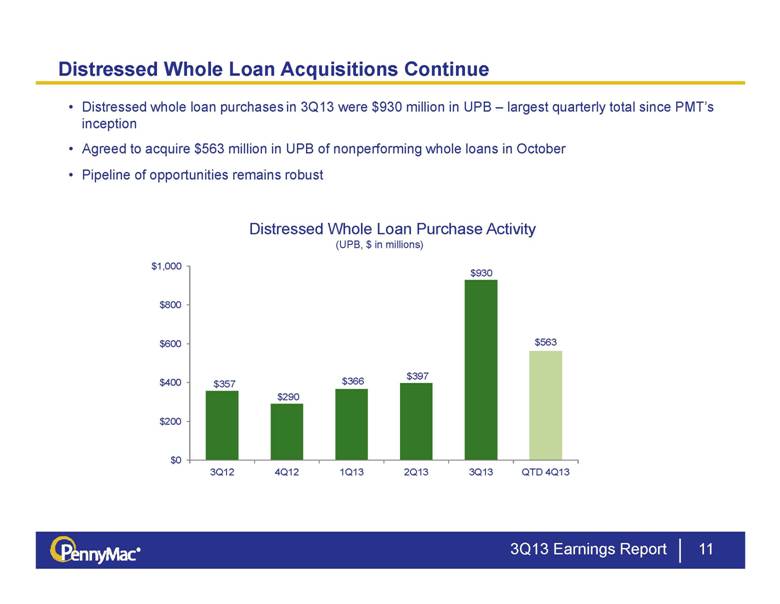
11 Distressed whole loan purchases in 3Q13 were $930 million in UPB – largest quarterly total since PMT’s inception Agreed to acquire $563 million in UPB of nonperforming whole loans in October Pipeline of opportunities remains robust Distressed Whole Loan Acquisitions Continue Distressed Whole Loan Purchase Activity (UPB, $ in millions) 3Q13 Earnings Report |
|
|
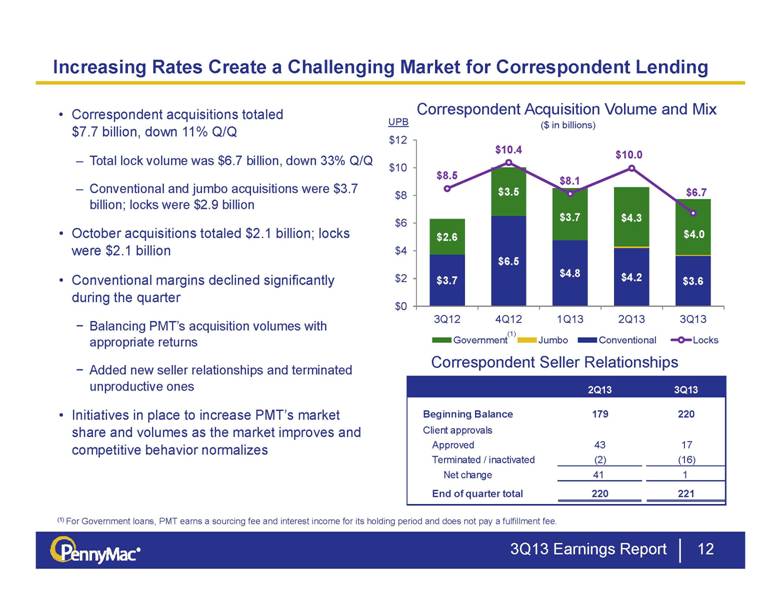
Correspondent Acquisition Volume and Mix 3Q13 Earnings Report 12 Increasing Rates Create a Challenging Market for Correspondent Lending (1) For Government loans, PMT earns a sourcing fee and interest income for its holding period and does not pay a fulfillment fee. ($ in billions) UPB Correspondent acquisitions totaled $7.7 billion, down 11% Q/Q Total lock volume was $6.7 billion, down 33% Q/Q Conventional and jumbo acquisitions were $3.7 billion; locks were $2.9 billion October acquisitions totaled $2.1 billion; locks were $2.1 billion Conventional margins declined significantly during the quarter Balancing PMT’s acquisition volumes with appropriate returns Added new seller relationships and terminated unproductive ones Initiatives in place to increase PMT’s market share and volumes as the market improves and competitive behavior normalizes (1) Correspondent Seller Relationships 2Q13 3Q13 Beginning Balance 179 220 Client approvals Approved 43 17 Terminated / inactivated (2) (16) Net change 41 1 End of quarter total 220 221 |
|
|
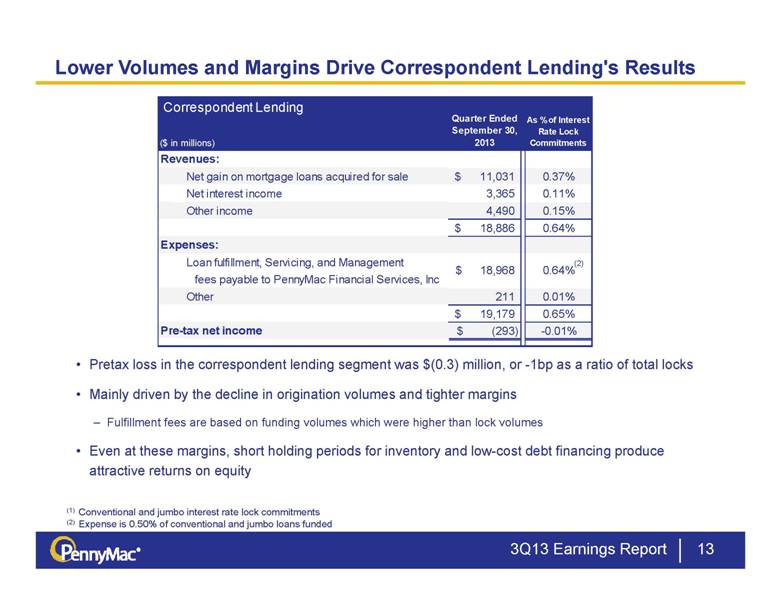
13 Lower Volumes and Margins Drive Correspondent Lending's Results Pretax loss in the correspondent lending segment was $(0.3) million, or -1bp as a ratio of total locks Mainly driven by the decline in origination volumes and tighter margins Fulfillment fees are based on funding volumes which were higher than lock volumes Even at these margins, short holding periods for inventory and low-cost debt financing produce attractive returns on equity (1) Conventional and jumbo interest rate lock commitments (2) Expense is 0.50% of conventional and jumbo loans funded 3Q13 Earnings Report (2) ($ in millions) Quarter Ended September 30, 2013 As % of Interest Rate Lock Commitments Revenues: Net gain on mortgage loans acquired for sale 11,031 $ 0.37% Net interest income 3,365 0.11% Other income 4,490 0.15% 18,886 $ 0.64% Expenses: Loan fulfillment, Servicing, and Management fees payable to PennyMac Financial Services, Inc Other 211 0.01% 19,179 $ 0.65% Pre-tax net income (293) $ -0.01% 18,968 $ 0.64% Correspondent Lending |
|
|
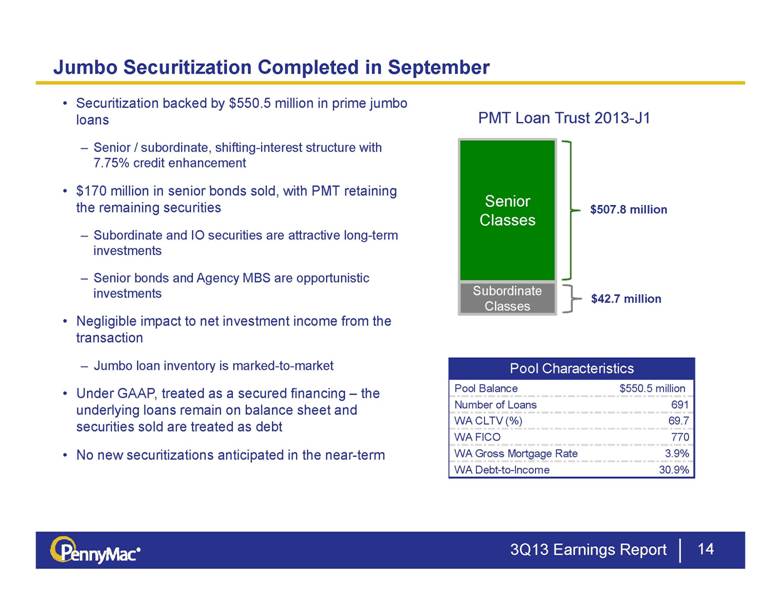
Securitization backed by $550.5 million in prime jumbo loans Senior / subordinate, shifting-interest structure with 7.75% credit enhancement $170 million in senior bonds sold, with PMT retaining the remaining securities Subordinate and IO securities are attractive long-term investments Senior bonds and Agency MBS are opportunistic investments Negligible impact to net investment income from the transaction Jumbo loan inventory is marked-to-market Under GAAP, treated as a secured financing – the underlying loans remain on balance sheet and securities sold are treated as debt No new securitizations anticipated in the near-term Jumbo Securitization Completed in September 14 3Q13 Earnings Report Senior Classes Subordinate Classes PMT Loan Trust 2013-J1 $507.8 million $42.7 million Pool Balance $550.5 million Number of Loans 691 WA CLTV (%) 69.7 WA FICO 770 WA Gross Mortgage Rate 3.9% WA Debt-to-Income 30.9% Pool Characteristics |
|
|
Financial Results |

|
|
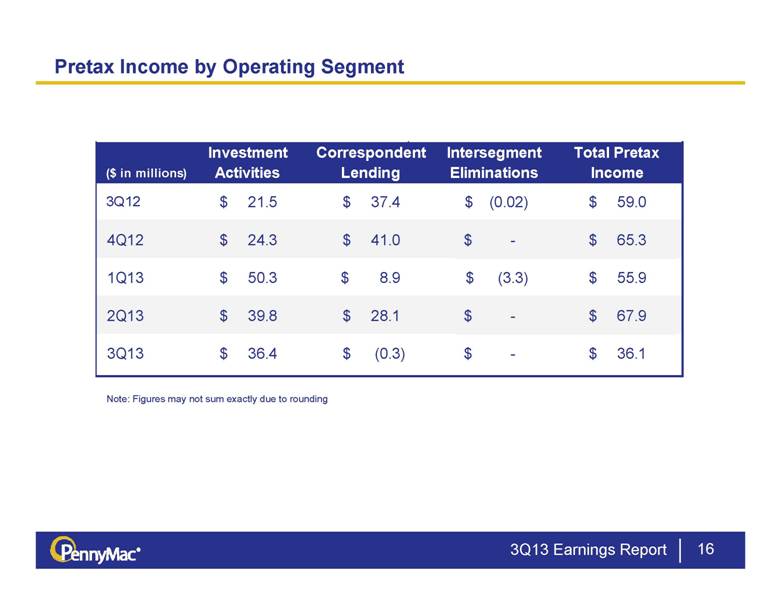
16 Pretax Income by Operating Segment 3Q13 Earnings Report Note: Figures may not sum exactly due to rounding Investment Correspondent Intersegment Total Pretax ($ in millions) Activities Lending Eliminations Income 3Q12 21.5 $ 37.4 $ (0.02) $ 59.0 $ 4Q12 24.3 $ 41.0 $ - $ 65.3 $ 1Q13 50.3 $ 8.9 $ (3.3) $ 55.9 $ 2Q13 39.8 $ 28.1 $ - $ 67.9 $ 3Q13 36.4 $ (0.3) $ - $ 36.1 $ |
|
|
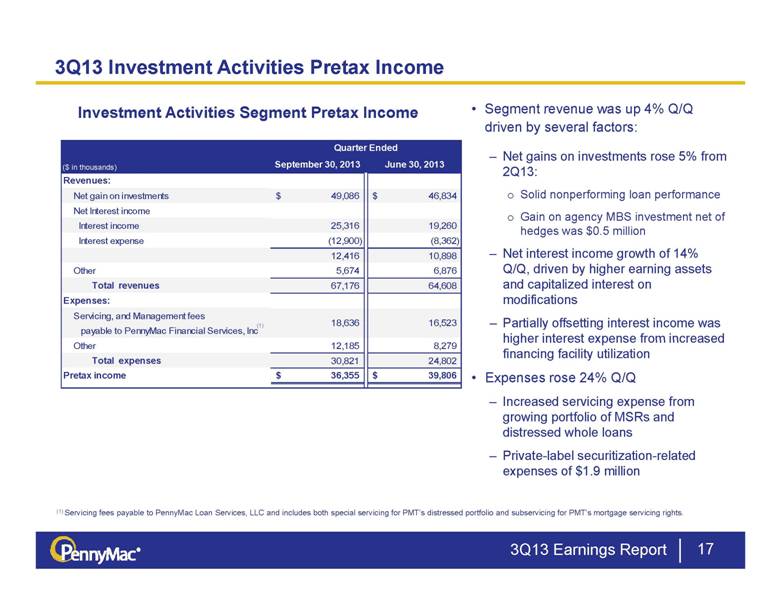
3Q13 Earnings Report 17 3Q13 Investment Activities Pretax Income Investment Activities Segment Pretax Income Segment revenue was up 4% Q/Q driven by several factors: Net gains on investments rose 5% from 2Q13: Solid nonperforming loan performance Gain on agency MBS investment net of hedges was $0.5 million Net interest income growth of 14% Q/Q, driven by higher earning assets and capitalized interest on modifications Partially offsetting interest income was higher interest expense from increased financing facility utilization Expenses rose 24% Q/Q Increased servicing expense from growing portfolio of MSRs and distressed whole loans Private-label securitization-related expenses of $1.9 million (1) Servicing fees payable to PennyMac Loan Services, LLC and includes both special servicing for PMT’s distressed portfolio and subservicing for PMT’s mortgage servicing rights. (1) Quarter Ended ($ in thousands) September 30, 2013 June 30, 2013 Revenues: Net gain on investments 49,086 $ 46,834 $ Net Interest income Interest income 25,316 19,260 Interest expense (12,900) (8,362) 12,416 10,898 Other 5,674 6,876 Total revenues 67,176 64,608 Expenses: Servicing, and Management fees payable to PennyMac Financial Services, Inc Other 12,185 8,279 Total expenses 30,821 24,802 Pretax income 36,355 $ 39,806 $ 18,636 16,523 |
|
|
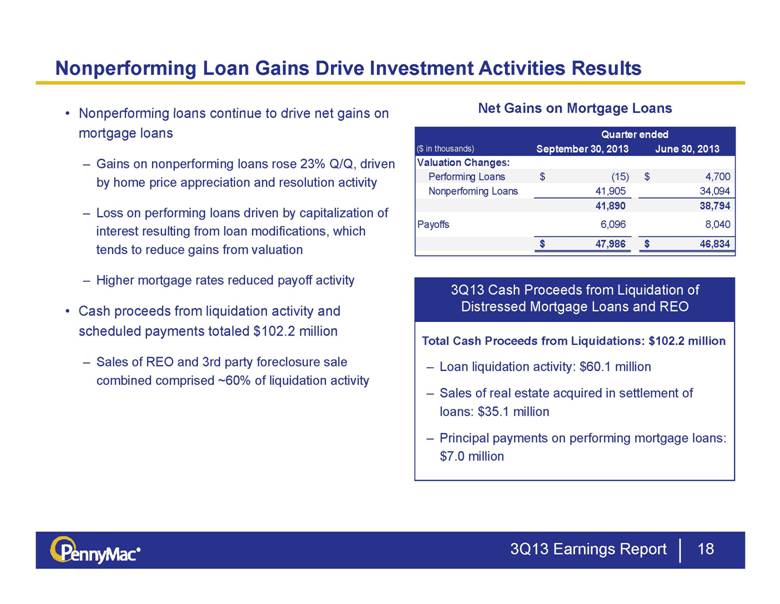
18 Nonperforming Loan Gains Drive Investment Activities Results Nonperforming loans continue to drive net gains on mortgage loans Gains on nonperforming loans rose 23% Q/Q, driven by home price appreciation and resolution activity Loss on performing loans driven by capitalization of interest resulting from loan modifications, which tends to reduce gains from valuation Higher mortgage rates reduced payoff activity Cash proceeds from liquidation activity and scheduled payments totaled $102.2 million Sales of REO and 3rd party foreclosure sale combined comprised ~60% of liquidation activity 3Q13 Earnings Report Net Gains on Mortgage Loans Cash proceeds from liquidation of Total Cash Proceeds from Liquidations: $102.2 million Loan liquidation activity: $60.1 million Sales of real estate acquired in settlement of loans: $35.1 million Principal payments on performing mortgage loans: $7.0 million 3Q13 Cash Proceeds from Liquidation of Distressed Mortgage Loans and REO ($ in thousands) September 30, 2013 June 30, 2013 Valuation Changes: Performing Loans (15) $ 4,700 $ Nonperfoming Loans 41,905 34,094 41,890 38,794 Payoffs 6,096 8,040 47,986 $ 46,834 $ Quarter ended |
|
|
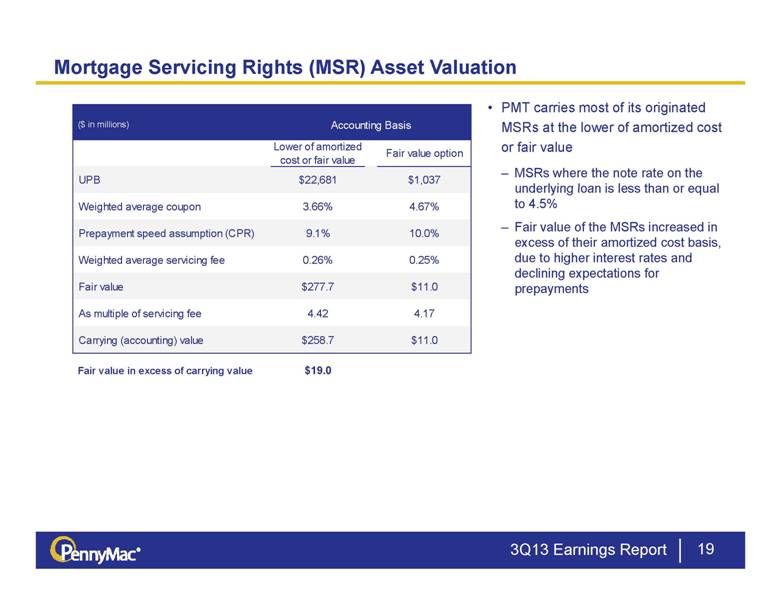
3Q13 Earnings Report 19 Mortgage Servicing Rights (MSR) Asset Valuation PMT carries most of its originated MSRs at the lower of amortized cost or fair value MSRs where the note rate on the underlying loan is less than or equal to 4.5% Fair value of the MSRs increased in excess of their amortized cost basis, due to higher interest rates and declining expectations for prepayments Lower of amortized cost or fair value Fair value option UPB $22,681 $1,037 Weighted average coupon 3.66% 4.67% Prepayment speed assumption (CPR) 9.1% 10.0% Weighted average servicing fee 0.26% 0.25% Fair value $277.7 $11.0 As multiple of servicing fee 4.42 4.17 Carrying (accounting) value $258.7 $11.0 Fair value in excess of carrying value $19.0 Accounting Basis ($ in millions) |
|
|
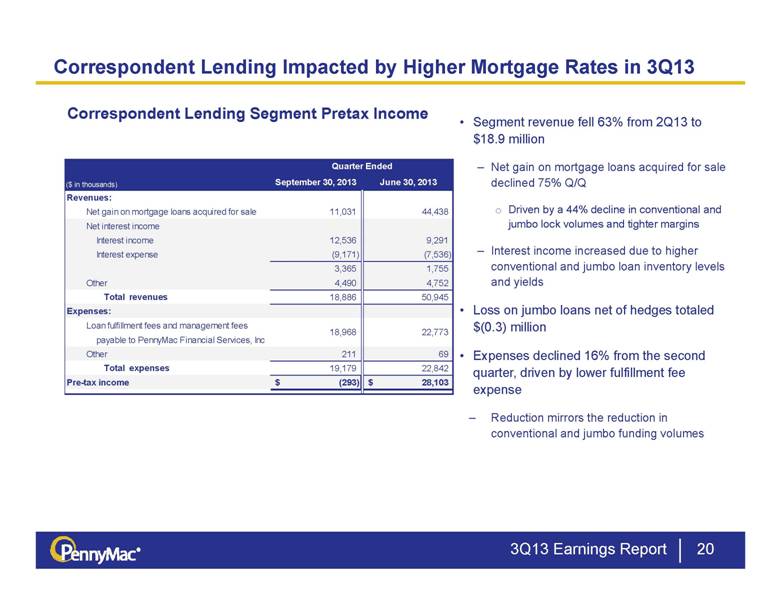
3Q13 Earnings Report 20 Correspondent Lending Impacted by Higher Mortgage Rates in 3Q13 Correspondent Lending Segment Pretax Income Segment revenue fell 63% from 2Q13 to $18.9 million Net gain on mortgage loans acquired for sale declined 75% Q/Q Driven by a 44% decline in conventional and jumbo lock volumes and tighter margins Interest income increased due to higher conventional and jumbo loan inventory levels and yields Loss on jumbo loans net of hedges totaled $(0.3) million Expenses declined 16% from the second quarter, driven by lower fulfillment fee expense Reduction mirrors the reduction in conventional and jumbo funding volumes Quarter Ended ($ in thousands) September 30, 2013 June 30, 2013 Revenues: Net gain on mortgage loans acquired for sale 11,031 44,438 Net interest income Interest income 12,536 9,291 Interest expense (9,171) (7,536) 3,365 1,755 Other 4,490 4,752 Total revenues 18,886 50,945 Expenses: Loan fulfillment fees and management fees payable to PennyMac Financial Services, Inc Other 211 69 Total expenses 19,179 22,842 Pre-tax income (293) $ 28,103 $ 18,968 22,773 |
|
|
Appendix |
|
|
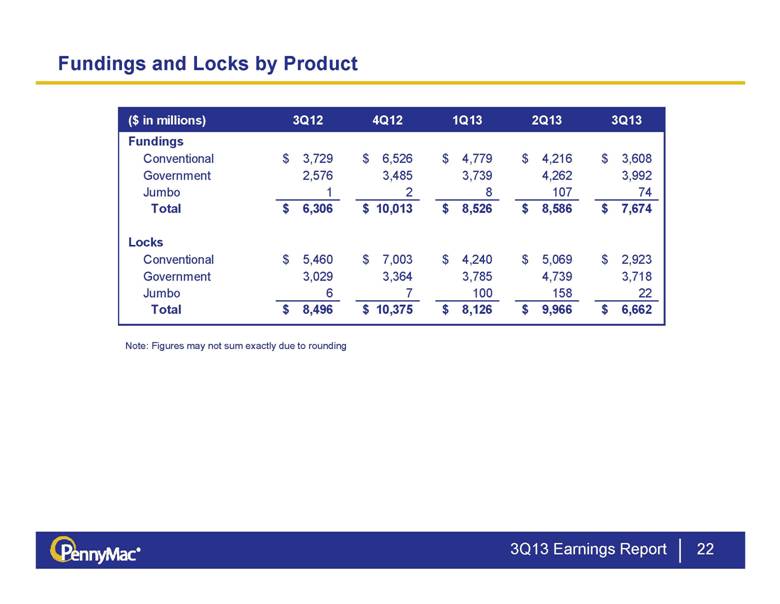
Fundings and Locks by Product 3Q13 Earnings Report 22 Note: Figures may not sum exactly due to rounding ($ in millions) 3Q12 4Q12 1Q13 2Q13 3Q13 Fundings Conventional 3,729 $ 6,526 $ 4,779 $ 4,216 $ 3,608 $ Government 2,576 3,485 3,739 4,262 3,992 Jumbo 1 2 8 107 74 Total 6,306 $ 10,013 $ 8,526 $ 8,586 $ 7,674 $ Locks Conventional 5,460 $ 7,003 $ 4,240 $ 5,069 $ 2,923 $ Government 3,029 3,364 3,785 4,739 3,718 Jumbo 6 7 100 158 22 Total 8,496 $ 10,375 $ 8,126 $ 9,966 $ 6,662 $ |
|
|
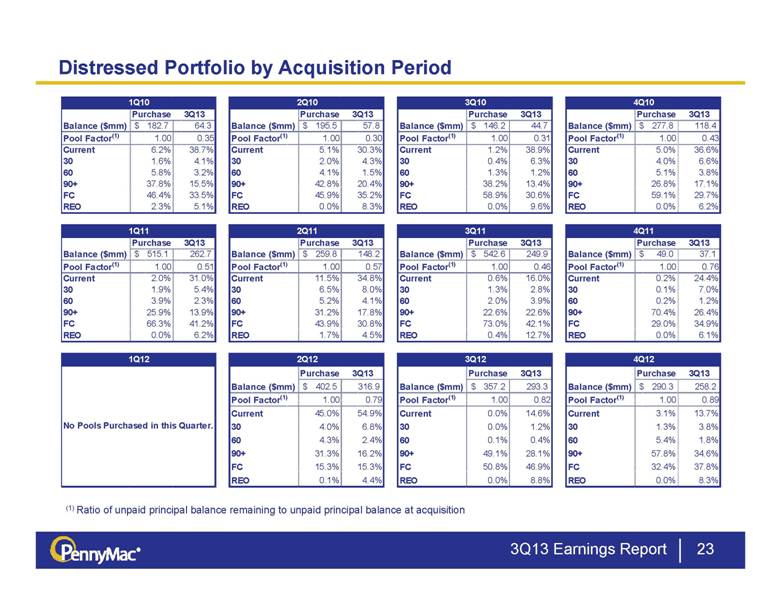
Distressed Portfolio by Acquisition Period 23 (1) Ratio of unpaid principal balance remaining to unpaid principal balance at acquisition 3Q13 Earnings Report Purchase 3Q13 Purchase 3Q13 Purchase 3Q13 Purchase 3Q13 Balance ($mm) 182.7 $ 64.3 Balance ($mm) 195.5 $ 57.8 Balance ($mm) 146.2 $ 44.7 Balance ($mm) 277.8 $ 118.4 Pool Factor (1) 1.00 0.35 Pool Factor (1) 1.00 0.30 Pool Factor (1) 1.00 0.31 Pool Factor (1) 1.00 0.43 Current 6.2% 38.7% Current 5.1% 30.3% Current 1.2% 38.9% Current 5.0% 36.6% 30 1.6% 4.1% 30 2.0% 4.3% 30 0.4% 6.3% 30 4.0% 6.6% 60 5.8% 3.2% 60 4.1% 1.5% 60 1.3% 1.2% 60 5.1% 3.8% 90+ 37.8% 15.5% 90+ 42.8% 20.4% 90+ 38.2% 13.4% 90+ 26.8% 17.1% FC 46.4% 33.5% FC 45.9% 35.2% FC 58.9% 30.6% FC 59.1% 29.7% REO 2.3% 5.1% REO 0.0% 8.3% REO 0.0% 9.6% REO 0.0% 6.2% Purchase 3Q13 Purchase 3Q13 Purchase 3Q13 Purchase 3Q13 Balance ($mm) 515.1 $ 262.7 Balance ($mm) 259.8 $ 148.2 Balance ($mm) 542.6 $ 249.9 Balance ($mm) 49.0 $ 37.1 Pool Factor (1) 1.00 0.51 Pool Factor (1) 1.00 0.57 Pool Factor (1) 1.00 0.46 Pool Factor (1) 1.00 0.76 Current 2.0% 31.0% Current 11.5% 34.8% Current 0.6% 16.0% Current 0.2% 24.4% 30 1.9% 5.4% 30 6.5% 8.0% 30 1.3% 2.8% 30 0.1% 7.0% 60 3.9% 2.3% 60 5.2% 4.1% 60 2.0% 3.9% 60 0.2% 1.2% 90+ 25.9% 13.9% 90+ 31.2% 17.8% 90+ 22.6% 22.6% 90+ 70.4% 26.4% FC 66.3% 41.2% FC 43.9% 30.8% FC 73.0% 42.1% FC 29.0% 34.9% REO 0.0% 6.2% REO 1.7% 4.5% REO 0.4% 12.7% REO 0.0% 6.1% Purchase 3Q13 Purchase 3Q13 Purchase 3Q13 Balance ($mm) 402.5 $ 316.9 Balance ($mm) 357.2 $ 293.3 Balance ($mm) 290.3 $ 258.2 Pool Factor (1) 1.00 0.79 Pool Factor (1) 1.00 0.82 Pool Factor (1) 1.00 0.89 Current 45.0% 54.9% Current 0.0% 14.6% Current 3.1% 13.7% 30 4.0% 6.8% 30 0.0% 1.2% 30 1.3% 3.8% 60 4.3% 2.4% 60 0.1% 0.4% 60 5.4% 1.8% 90+ 31.3% 16.2% 90+ 49.1% 28.1% 90+ 57.8% 34.6% FC 15.3% 15.3% FC 50.8% 46.9% FC 32.4% 37.8% REO 0.1% 4.4% REO 0.0% 8.8% REO 0.0% 8.3% No Pools Purchased in this Quarter. 1Q12 2Q12 3Q12 4Q12 1Q10 2Q10 3Q10 4Q10 1Q11 2Q11 3Q11 4Q11 |
|
|
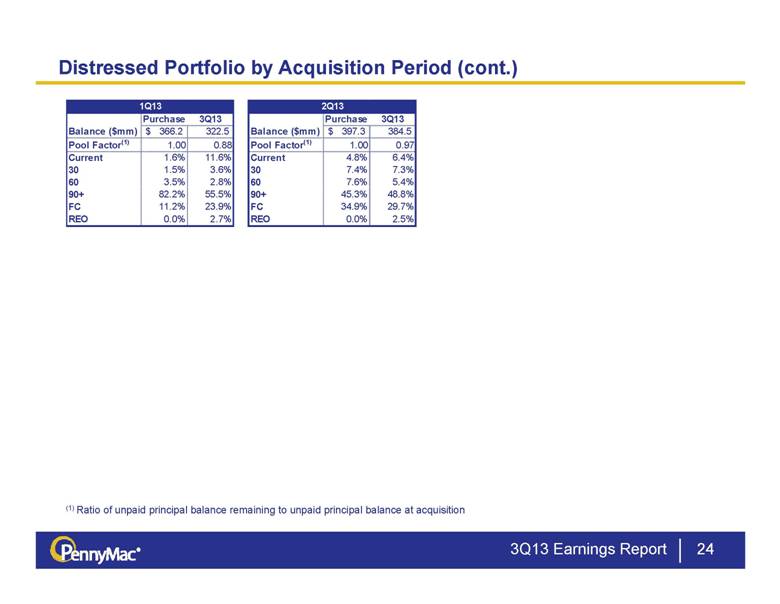
Distressed Portfolio by Acquisition Period (cont.) 24 (1) Ratio of unpaid principal balance remaining to unpaid principal balance at acquisition 3Q13 Earnings Report Purchase 3Q13 Purchase 3Q13 Balance ($mm) 366.2 $ 322.5 Balance ($mm) 397.3 $ 384.5 Pool Factor (1) 1.00 0.88 Pool Factor (1) 1.00 0.97 Current 1.6% 11.6% Current 4.8% 6.4% 30 1.5% 3.6% 30 7.4% 7.3% 60 3.5% 2.8% 60 7.6% 5.4% 90+ 82.2% 55.5% 90+ 45.3% 48.8% FC 11.2% 23.9% FC 34.9% 29.7% REO 0.0% 2.7% REO 0.0% 2.5% 1Q13 2Q13 |