Attached files
| file | filename |
|---|---|
| 8-K - 8-K - PNMAC Holdings, Inc. | a13-23726_18k.htm |
| EX-99.1 - EX-99.1 - PNMAC Holdings, Inc. | a13-23726_1ex99d1.htm |
Exhibit 99.2
|
|
Third Quarter 2013 Earnings Report |
|
|
Forward Looking Statements 1 This presentation contains forward-looking statements within the meaning of Section 21E of the Securities Exchange Act of 1934, as amended, regarding management’s beliefs, estimates, projections and assumptions with respect to, among other things, the Company’s financial results, future operations, business plans and investment strategies, as well as industry and market conditions, all of which are subject to change. Words like “believe,” “expect,” “anticipate,” “promise,” “plan,” and other expressions or words of similar meanings, as well as future or conditional verbs such as “will,” “would,” “should,” “could,” or “may” are generally intended to identify forward-looking statements. Actual results and operations for any future period may vary materially from those projected herein, from past results discussed herein, or from illustrative examples provided herein. Factors which could cause actual results to differ materially from historical results or those anticipated include, but are not limited to: changes in federal, state and local laws and regulations applicable to the highly regulated industry in which we operate; lawsuits or governmental actions if we do not comply with the laws and regulations applicable to our businesses; the creation of the Consumer Financial Protection Bureau, or CFPB, and enforcement of its rules; changes in existing U.S. government-sponsored entities, their current roles or their guarantees or guidelines; changes to government mortgage modification programs; the licensing and operational requirements of states and other jurisdictions applicable to our businesses, to which our bank competitors are not subject; foreclosure delays and changes in foreclosure practices; certain banking regulations that may limit our business activities; changes in macroeconomic and U.S. residential real estate market conditions; difficulties in growing loan production volume; changes in prevailing interest rates; increases in loan delinquencies and defaults; our reliance on PennyMac Mortgage Investment Trust as a significant source of financing for, and revenue related to, our correspondent lending business; availability of required additional capital and liquidity to support business growth; our obligation to indemnify third-party purchasers or repurchase loans that we originate, acquire or assist in with fulfillment; our obligation to indemnify advised entities or investment funds to meet certain criteria or characteristics or under other circumstances; decreases in the historical returns on the assets that we select and manage for our clients, and our resulting management and incentive fees; regulation applicable to our investment management segment; conflicts of interest in allocating our services and investment opportunities among ourselves and our advised entities; the potential damage to our reputation and adverse impact to our business resulting from ongoing negative publicity; and our rapid growth. You should not place undue reliance on any forward-looking statement and should consider all of the uncertainties and risks described above, as well as those more fully discussed in reports and other documents filed by the Company with the Securities and Exchange Commission from time to time. The Company undertakes no obligation to publicly update or revise any forward-looking statements or any other information contained herein, and the statements made in this presentation are current as of the date of this presentation only. |
|
|
Third Quarter Highlights and Recent Activity 2 Third Quarter Highlights Pretax income of $34.9 million; diluted earnings per common share of $0.28 Total net revenues totaled $87.2 million, down 18% from 2Q13 Expenses totaled $52.3 million, down 7% from 2Q13 Loan production totaled $8.0 billion in unpaid principal balance (UPB), down 11% from 2Q13 Correspondent loan acquisitions were $7.7 billion, down 11% from 2Q13 Retail originations were $283 million, down 18% from 2Q13 Servicing portfolio reached $52.9 billion, up 19% from June 30, 2013 Net assets under management reached $2.1 billion, up 14% from June 30, 2013 Recent Activity Since the End of the Quarter Two bulk MSR portfolio acquisitions totaling $21 billion in UPB, with PMT committed to investing in the excess servicing spread Acquired $10.3 billion in UPB of recently originated Fannie Mae MSRs that closed November 1st Entered into a letter of intent with a third party to acquire an $10.8 billion in UPB of legacy Ginnie Mae MSRs and expected to enter into an agreement with PMT relating to the sale of the excess servicing spread associated with this portfolio(1) (1) This pending transaction is subject to continuing negotiation and execution and definitive documentation, due diligence, customary closing conditions, and approvals. There can be no assurance that the committed amount will ultimately be acquired or that the transaction will be completed. |
|
|
Correspondent Lending Aggregates newly originated loans from approved third-party sellers Revenue sources: Gain on mortgage loans for government-insured correspondent acquisitions Fulfillment fees from PMT’s conventional and jumbo correspondent acquisitions Loan origination fees and warehouse spread Q3 Results Were Aided by Stability of Servicing and Investment Management 3 Loan Production Loan Servicing Collect and remit payments and provide borrower services on existing loans Revenue sources: Servicing fees on owned MSRs Servicing and subservicing fees from Advised Entities, including special servicing of distressed loans Ancillary income Investment Management Serve as external manager to pools of capital investing in mortgage-related assets Revenue sources: Management fees from all Advised Entities Performance-based incentive fees from PMT Carried interest from Investment Funds Retail Lending Originates loans to consumers for the purchase or refinance of a home Revenue sources: Gain on mortgage loans Loan origination fees and warehouse spread Correspondent Lending Retail Lending Loan Servicing Investment Management |
|
|
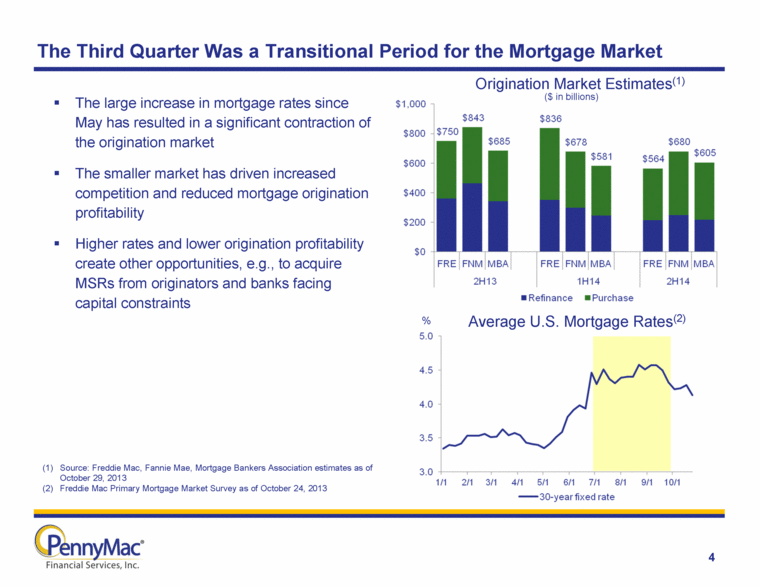
The Third Quarter Was a Transitional Period for the Mortgage Market Average U.S. Mortgage Rates(2) % Source: Freddie Mac, Fannie Mae, Mortgage Bankers Association estimates as of October 29, 2013 Freddie Mac Primary Mortgage Market Survey as of October 24, 2013 Origination Market Estimates(1) ($ in billions) The large increase in mortgage rates since May has resulted in a significant contraction of the origination market The smaller market has driven increased competition and reduced mortgage origination profitability Higher rates and lower origination profitability create other opportunities, e.g., to acquire MSRs from originators and banks facing capital constraints 4 |
|
|
Expense Reduction While Realigning Operations for Servicing Growth Total expenses fell 7% from 2Q13 Headcount reductions to align operations with size of the market opportunity in loan production 186 FTEs reduced during 3Q13 and shortly after quarter end Primarily reductions in correspondent and retail lending operations and corporate overhead 25% were reassigned to the growing servicing operations Increased servicing staff in preparation for pending bulk MSR acquisitions Reductions balanced by continued investments in future growth and flexibility to respond to market opportunities Total Expenses ($ in millions) Compensation as a % of total expenses 76% 75% 69% Compensation expense Other expenses 5 |
|
|
6 PMT's Excess Servicing Spread Investments in Partnership with PFSI Excess Servicing Spread (e.g., 12.5bp) MSR Asset (e.g., 25bp servicing fee) Acquired by PFSI from Third-Party Seller(1) PMT co-invests in Agency MSR acquired from third-party sellers by PFSI PMT acquires the right to receive the excess servicing spread cash flows over the life of the underlying loans PFSI owns the MSR and services the loans (1) The contractual servicer and MSR owner is PennyMac Loan Services, LLC, a wholly-owned subsidiary of PennyMac Financial Services, Inc. (2) Subject and subordinate to Agency rights (under the related servicer guide); does not change the contractual servicing fee paid by the Agency to the servicer. Excess Servicing Spread(2) Interest income from a portion of the contractual servicing fee Realized yield dependent on repayment speeds and recapture Base MSR Income from a portion of the contractual servicing fee Also entitled to ancillary income Bears expenses of performing loan servicing activities Required to advance certain payments largely for delinquent loans Base MSR (e.g., 12.5bp) Acquired by PMT from PFSI(1) Example transaction: actual transaction details may vary materially |
|
|
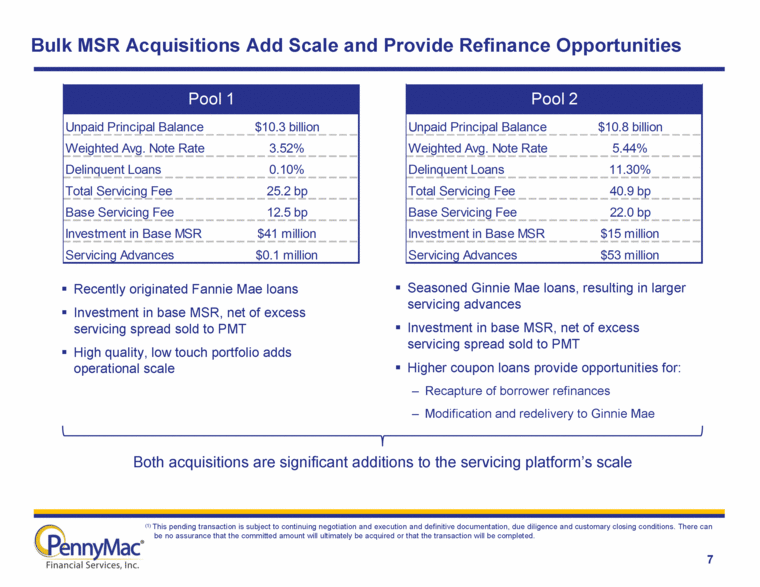
Bulk MSR Acquisitions Add Scale and Provide Refinance Opportunities 7 Recently originated Fannie Mae loans Investment in base MSR, net of excess servicing spread sold to PMT High quality, low touch portfolio adds operational scale Seasoned Ginnie Mae loans, resulting in larger servicing advances Investment in base MSR, net of excess servicing spread sold to PMT Higher coupon loans provide opportunities for: Recapture of borrower refinances Modification and redelivery to Ginnie Mae Both acquisitions are significant additions to the servicing platform’s scale (1) This pending transaction is subject to continuing negotiation and execution and definitive documentation, due diligence and customary closing conditions. There can be no assurance that the committed amount will ultimately be acquired or that the transaction will be completed. (1) Unpaid Principal Balance $10.8 billion Weighted Avg. Note Rate 5.44% Delinquent Loans 11.30% Total Servicing Fee 40.9 bp Base Servicing Fee 22.0 bp Investment in Base MSR $15 million Servicing Advances $53 million Pool 2 |
|
|
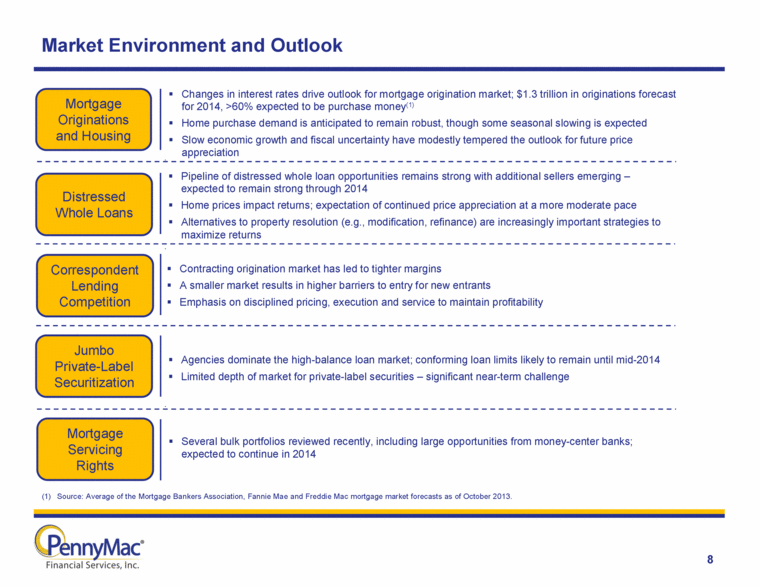
Market Environment and Outlook 8 Correspondent Lending Competition Jumbo Private-Label Securitization Mortgage Originations and Housing Changes in interest rates drive outlook for mortgage origination market; $1.3 trillion in originations forecast for 2014, >60% expected to be purchase money(1) Home purchase demand is anticipated to remain robust, though some seasonal slowing is expected Slow economic growth and fiscal uncertainty have modestly tempered the outlook for future price appreciation Contracting origination market has led to tighter margins A smaller market results in higher barriers to entry for new entrants Emphasis on disciplined pricing, execution and service to maintain profitability Pipeline of distressed whole loan opportunities remains strong with additional sellers emerging – expected to remain strong through 2014 Home prices impact returns; expectation of continued price appreciation at a more moderate pace Alternatives to property resolution (e.g., modification, refinance) are increasingly important strategies to maximize returns Distressed Whole Loans Agencies dominate the high-balance loan market; conforming loan limits likely to remain until mid-2014 Limited depth of market for private-label securities – significant near-term challenge Source: Average of the Mortgage Bankers Association, Fannie Mae and Freddie Mac mortgage market forecasts as of October 2013. Mortgage Servicing Rights Several bulk portfolios reviewed recently, including large opportunities from money-center banks; expected to continue in 2014 |
|
|
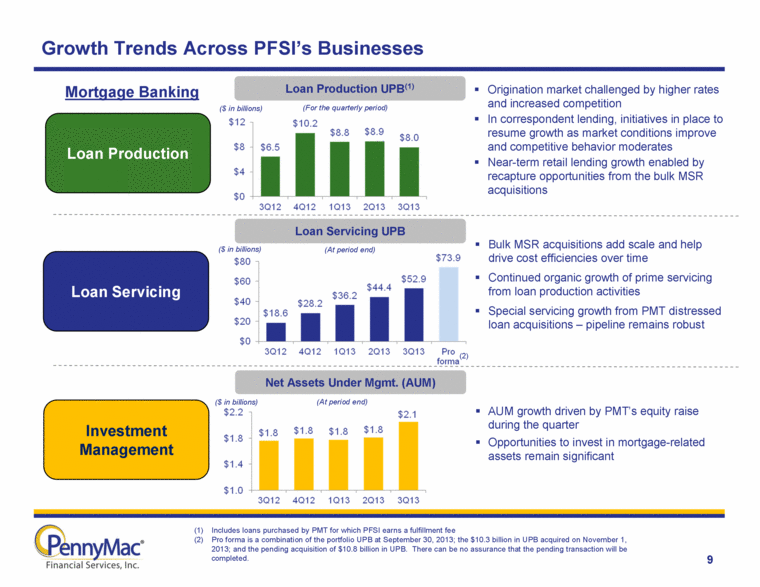
Growth Trends Across PFSI’s Businesses 9 Loan Production Loan Servicing Mortgage Banking Investment Management Loan Production UPB(1) Loan Servicing UPB Net Assets Under Mgmt. (AUM) (At period end) (For the quarterly period) Includes loans purchased by PMT for which PFSI earns a fulfillment fee Pro forma is a combination of the portfolio UPB at September 30, 2013; the $10.3 billion in UPB acquired on November 1, 2013; and the pending acquisition of $10.8 billion in UPB. There can be no assurance that the pending transaction will be completed. Bulk MSR acquisitions add scale and help drive cost efficiencies over time Continued organic growth of prime servicing from loan production activities Special servicing growth from PMT distressed loan acquisitions – pipeline remains robust AUM growth driven by PMT’s equity raise during the quarter Opportunities to invest in mortgage-related assets remain significant Origination market challenged by higher rates and increased competition In correspondent lending, initiatives in place to resume growth as market conditions improve and competitive behavior moderates Near-term retail lending growth enabled by recapture opportunities from the bulk MSR acquisitions (At period end) ($ in billions) ($ in billions) ($ in billions) (2) |
|
|
10 (UPB in billions) $7.7 billion in total correspondent acquisitions by PMT in 3Q13 52% government-insured loans (gain on mortgage loans); 48% fulfillment for PMT (fee revenue) Significant declines in margins on government-insured loans during 3Q13 October correspondent production totaled $2.1 billion; locks totaled $2.1 billion Growth trajectory slowed by a difficult origination market environment Rationalizing expenses given volume declines; reduced operations headcount by 186 FTEs PennyMac’s Businesses – Correspondent Lending (1) Conventional and jumbo loans are acquired by PMT, for which PFSI earns a fulfillment fee. Correspondent Volume and Mix Growth Opportunities (1) Operational Highlights Initiatives in place to profitably expand market share and grow volume as the market improves and competitor behavior normalizes Greater emphasis on smaller / local mortgage banks Strengthening seller relationships with a broad product menu and a complete array of delivery methods Continuing to optimize the seller network (1) |
|
|
Retail originations totaled $283 million in 3Q13, down 18% from 2Q13 Consumer direct (non-portfolio) originations up 43% from 2Q13; comprised 57% of total retail originations Portfolio-sourced originations declined due to lower refinancing activity Consumer direct originations benefited from improvements in marketing, including new campaigns 11 (UPB in millions) PennyMac’s Businesses – Retail Lending Retail Origination Volume Growth Opportunities Operational Highlights Near-term growth enabled by MSR acquisitions(1) Recapture of refinances and other portfolio leads Continued development of the consumer direct platform for a purchase-money market Focuses on effective service, products and pricing to provide value to Realtors and consumers Targeted hiring to facilitate growth and deliver superior service and process (1) One of the MSR acquisitions is pending. This pending transaction is subject to the negotiation and execution of definitive documentation, continuing due diligence,, customary closing conditions, and approvals. There can be no assurance that we will acquire these assets or that the transaction will be completed. |
|
|
12 PennyMac’s Businesses – Loan Servicing Loan Servicing Portfolio UPB as of 9/30/13 Growth Opportunities Operational Highlights Servicing portfolio totaled $52.9 billion in UPB at quarter-end, up 19% from 2Q13 Net growth in prime servicing and subservicing of $8.4 billion in UPB from organic loan production activities Special servicing growth of over $1 billion in UPB from distressed loan acquisitions by PMT Continued to position the servicing platform for future growth, including reassignment of staff from other functions in the company New bulk MSR acquisitions grow prime servicing and are expected to drive cost efficiencies over time Servicing portfolio expected to exceed $75 billion in UPB by the end of 4Q13(1) Additional MSR growth opportunities expected in 2014 Continued growth in prime portfolio from loan production activities Continued growth in special servicing from PMT’s distressed acquisitions 100% = $52.9 billion in UPB (1) This includes a pending transaction which is subject to continuing negotiation and execution and definitive documentation, due diligence, customary closing conditions, and approvals. There can be no assurance that the committed amount will ultimately be acquired or that the transaction will be completed. |
|
|
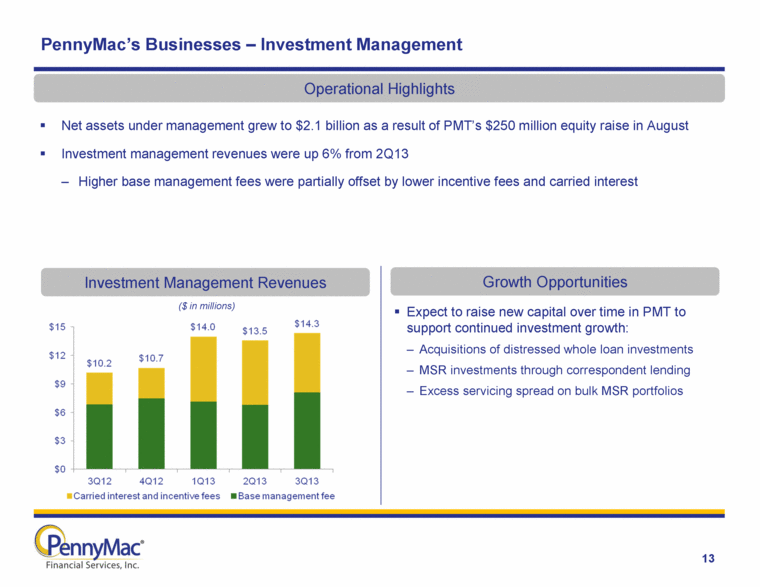
13 ($ in millions) PennyMac’s Businesses – Investment Management Investment Management Revenues Growth Opportunities Operational Highlights Expect to raise new capital over time in PMT to support continued investment growth: Acquisitions of distressed whole loan investments MSR investments through correspondent lending Excess servicing spread on bulk MSR portfolios Net assets under management grew to $2.1 billion as a result of PMT’s $250 million equity raise in August Investment management revenues were up 6% from 2Q13 Higher base management fees were partially offset by lower incentive fees and carried interest |
|
|
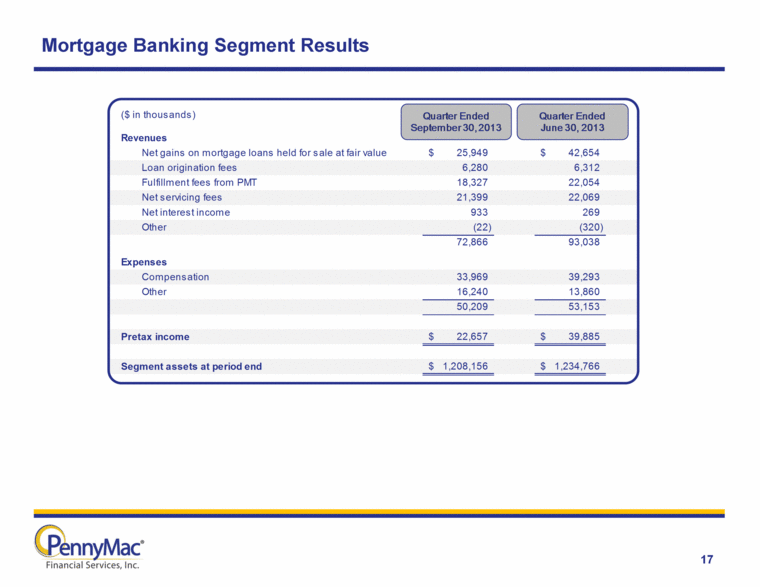
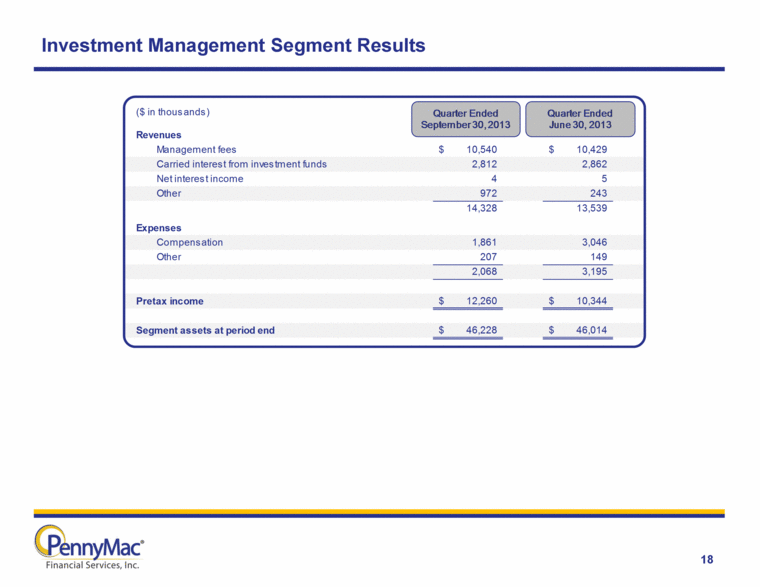
Third Quarter Financial Review 14 Diluted earnings per common share of $0.28 Net income of $31.4 million, down 35% from 2Q13 Net income attributable to PFSI shareholders of $5.2 million Total net revenue of $87.2 million, down 18% from 2Q13 Business Segment Results Mortgage Banking segment pretax income of $22.7 million, down 43% from 2Q13 Net gain on mortgage loans held for sale totaled $25.9 million, down 39 percent from 2Q13 Government locks in correspondent lending declined 22% from 2Q13 as a result of higher mortgage rates and increased competition Net loan servicing fees totaled $21.4 million, down 3% from 2Q13 Higher servicing fees offset by MSR impairment and fair value adjustments Investment Management segment pretax income of $12.3 million, up 19% from 2Q13 |
|
|
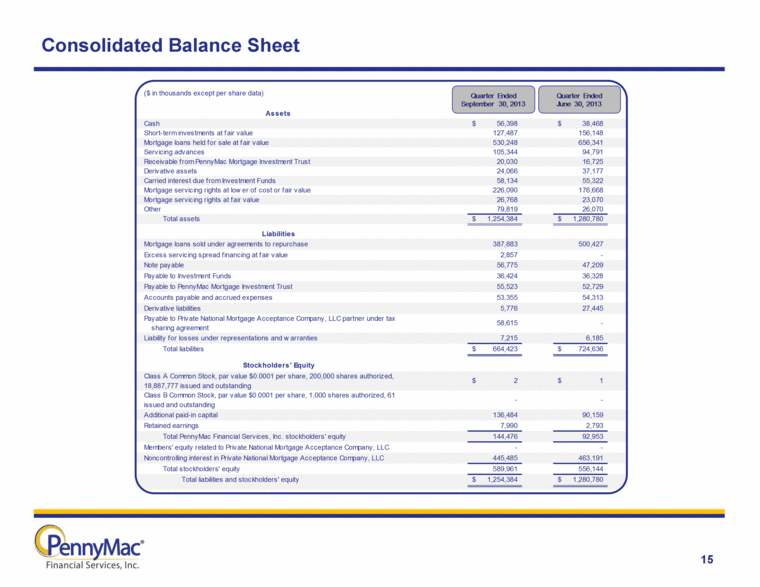
Consolidated Balance Sheet 15 Assets Cash 56,398 $ 38,468 $ Short-term investments at fair value 127,487 156,148 Mortgage loans held for sale at fair value 530,248 656,341 Servicing advances 105,344 94,791 Receivable from PennyMac Mortgage Investment Trust 20,030 16,725 Derivative assets 24,066 37,177 Carried interest due from Investment Funds 58,134 55,322 Mortgage servicing rights at lower of cost or fair value 226,090 176,668 Mortgage servicing rights at fair value 26,768 23,070 Other 79,819 26,070 Total assets 1,254,384 $ 1,280,780 $ Liabilities Mortgage loans sold under agreements to repurchase 387,883 500,427 Excess servicing spread financing at fair value 2,857 - Note payable 56,775 47,209 Payable to Investment Funds 36,424 36,328 Payable to PennyMac Mortgage Investment Trust 55,523 52,729 Accounts payable and accrued expenses 53,355 54,313 Derivative liabilities 5,776 27,445 Payable to Private National Mortgage Acceptance Company, LLC partner under tax sharing agreement 58,615 - Liability for losses under representations and warranties 7,215 6,185 Total liabilities 664,423 $ 724,636 $ Stockholders' Equity Class A Common Stock, par value $0.0001 per share, 200,000 shares authorized, 18,887,777 issued and outstanding 2 $ 1 $ Class B Common Stock, par value $0.0001 per share, 1,000 shares authorized, 61 issued and outstanding - - Additional paid-in capital 136,484 90,159 Retained earnings 7,990 2,793 Total PennyMac Financial Services, Inc. stockholders' equity 144,476 92,953 Members' equity related to Private National Mortgage Acceptance Company, LLC - - Noncontrolling interest in Private National Mortgage Acceptance Company, LLC 445,485 463,191 Total stockholders' equity 589,961 556,144 Total liabilities and stockholders' equity 1,254,384 $ 1,280,780 $ ($ in thousands except per share data) Quarter Ended September 30, 2013 Quarter Ended June 30, 2013 |
|
|
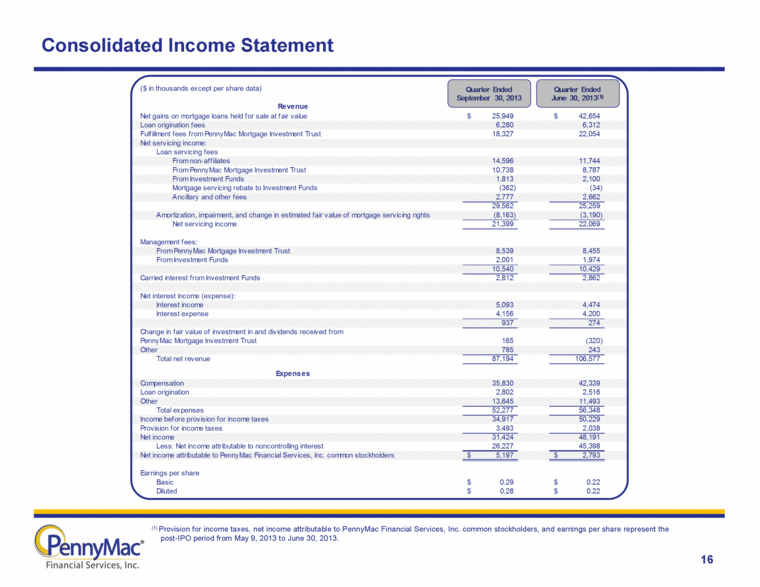
Consolidated Income Statement 16 (1) Provision for income taxes, net income attributable to PennyMac Financial Services, Inc. common stockholders, and earnings per share represent the post-IPO period from May 9, 2013 to June 30, 2013. Net gains on mortgage loans held for sale at fair value 25,949 $ 42,654 $ Loan origination fees 6,280 6,312 Fulfillment fees from PennyMac Mortgage Investment Trust 18,327 22,054 Net servicing income: Loan servicing fees From non-affiliates 14,596 11,744 From PennyMac Mortgage Investment Trust 10,738 8,787 From Investment Funds 1,813 2,100 Mortgage servicing rebate to Investment Funds (362) (34) Ancillary and other fees 2,777 2,662 29,562 25,259 Amortization, impairment, and change in estimated fair value of mortgage servicing rights (8,163) (3,190) Net servicing income 21,399 22,069 Management fees: From PennyMac Mortgage Investment Trust 8,539 8,455 From Investment Funds 2,001 1,974 10,540 10,429 Carried interest from Investment Funds 2,812 2,862 Net interest income (expense): Interest income 5,093 4,474 Interest expense 4,156 4,200 937 274 Change in fair value of investment in and dividends received from PennyMac Mortgage Investment Trust 165 (320) Other 785 243 Total net revenue 87,194 106,577 Compensation 35,830 42,339 Loan origination 2,802 2,516 Other 13,645 11,493 Total expenses 52,277 56,348 Income before provision for income taxes 34,917 50,229 Provision for income taxes 3,493 2,038 Net income 31,424 48,191 Less: Net income attributable to noncontrolling interest 26,227 45,398 Net income attributable to PennyMac Financial Services, Inc. common stockholders 5,197 $ 2,793 $ Earnings per share Basic 0.29 $ 0.22 $ Diluted 0.28 $ 0.22 $ Expenses ($ in thousands except per share data) Quarter Ended September 30, 2013 Quarter Ended June 30, 2013 (1) Revenue Quarter Ended September 30, 2013 Quarter Ended June 30, 2013 (1) |
|
|
Mortgage Banking Segment Results 17 Net gains on mortgage loans held for sale at fair value 25,949 $ 42,654 $ Loan origination fees 6,280 6,312 Fulfillment fees from PMT 18,327 22,054 Net servicing fees 21,399 22,069 Net interest income 933 269 Other (22) (320) 72,866 93,038 Compensation 33,969 39,293 Other 16,240 13,860 50,209 53,153 Pretax income 22,657 $ 39,885 $ Segment assets at period end 1,208,156 $ 1,234,766 $ Expenses ($ in thousands) Revenues Quarter Ended September 30, 2013 Quarter Ended June 30, 2013 |
|
|
Investment Management Segment Results 18 Management fees 10,540 $ 10,429 $ Carried interest from investment funds 2,812 2,862 Net interest income 4 5 Other 972 243 14,328 13,539 Compensation 1,861 3,046 Other 207 149 2,068 3,195 Pretax income 12,260 $ 10,344 $ Segment assets at period end 46,228 $ 46,014 $ Expenses ($ in thousands) Revenues Quarter Ended September 30, 2013 Quarter Ended June 30, 2013 |
|
|
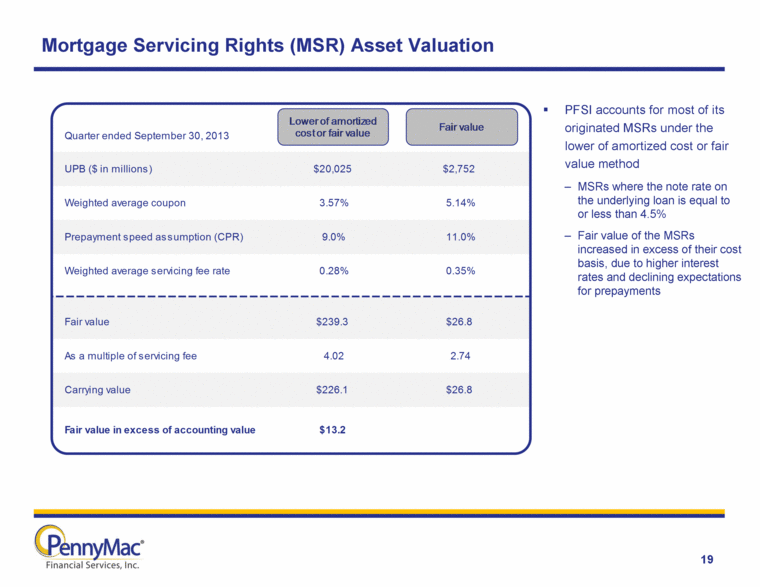
Mortgage Servicing Rights (MSR) Asset Valuation 19 PFSI accounts for most of its originated MSRs under the lower of amortized cost or fair value method MSRs where the note rate on the underlying loan is equal to or less than 4.5% Fair value of the MSRs increased in excess of their cost basis, due to higher interest rates and declining expectations for prepayments UPB ($ in millions) $20,025 $2,752 Weighted average coupon 3.57% 5.14% Prepayment speed assumption (CPR) 9.0% 11.0% Weighted average servicing fee rate 0.28% 0.35% Fair value $239.3 $26.8 As a multiple of servicing fee 4.02 2.74 Carrying value $226.1 $26.8 Fair value in excess of accounting value $13.2 Quarter ended September 30, 2013 Lower of amortized cost or fair value Fair value |
|
|
Appendix |
|
|
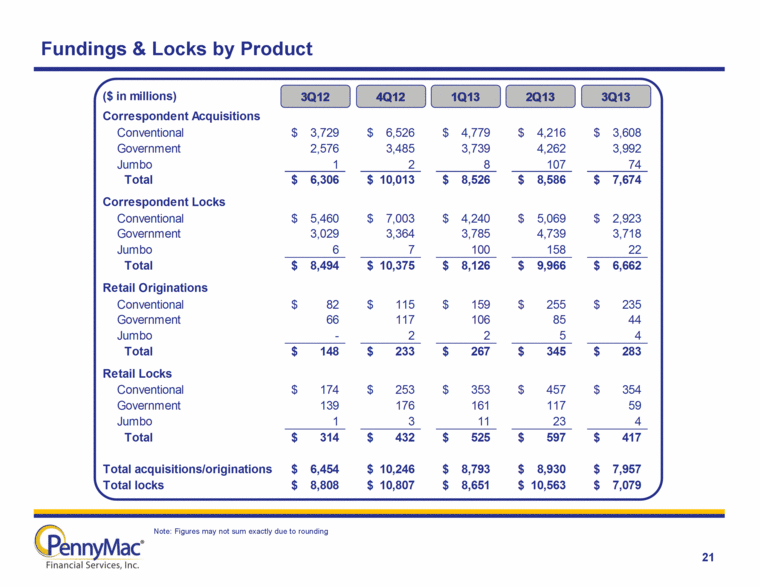
Fundings & Locks by Product 21 Note: Figures may not sum exactly due to rounding ($ in millions) Correspondent Acquisitions Conventional 3,729 $ 6,526 $ 4,779 $ 4,216 $ 3,608 $ Government 2,576 3,485 3,739 4,262 3,992 Jumbo 1 2 8 107 74 Total 6,306 $ 10,013 $ 8,526 $ 8,586 $ 7,674 $ Correspondent Locks Conventional 5,460 $ 7,003 $ 4,240 $ 5,069 $ 2,923 $ Government 3,029 3,364 3,785 4,739 3,718 Jumbo 6 7 100 158 22 Total 8,494 $ 10,375 $ 8,126 $ 9,966 $ 6,662 $ Retail Originations Conventional 82 $ 115 $ 159 $ 255 $ 235 $ Government 66 117 106 85 44 Jumbo - 2 2 5 4 Total 148 $ 233 $ 267 $ 345 $ 283 $ Retail Locks Conventional 174 $ 253 $ 353 $ 457 $ 354 $ Government 139 176 161 117 59 Jumbo 1 3 11 23 4 Total 314 $ 432 $ 525 $ 597 $ 417 $ Total acquisitions/originations 6,454 $ 10,246 $ 8,793 $ 8,930 $ 7,957 $ Total locks 8,808 $ 10,807 $ 8,651 $ 10,563 $ 7,079 $ 3Q12 4Q12 1Q13 2Q13 3Q13 |


