Attached files
| file | filename |
|---|---|
| 8-K - FORM 8-K - HUNTINGTON INGALLS INDUSTRIES, INC. | q32013earningsrelease8-k.htm |
| EX-99.1 - EXHIBIT 99.1 - HUNTINGTON INGALLS INDUSTRIES, INC. | hii2013q3earningsrelease.htm |

Q3 2013 Earnings Presentation November 7, 2013 Mike Petters President and Chief Executive Officer Barb Niland Corporate Vice President, Business Management and Chief Financial Officer EXHIBIT 99.2

Statements in this presentation, other than statements of historical fact, constitute "forward-looking statements" within the meaning of the Private Securities Litigation Reform Act of 1995. Forward-looking statements involve risks and uncertainties that could cause our actual results to differ materially from those expressed in these statements. Factors that may cause such differences include: changes in government and customer priorities and requirements (including government budgetary constraints, shifts in defense spending, and changes in customer short-range and long-range plans); our ability to obtain new contracts, estimate our future contract costs and perform our contracts effectively; changes in government regulations and procurement processes and our ability to comply with such requirements; our ability to realize the expected benefits from consolidation of our Ingalls facilities; natural disasters; adverse economic conditions in the United States and globally; risks related to our indebtedness and leverage; and other risk factors discussed in our filings with the U.S. Securities and Exchange Commission. There may be other risks and uncertainties that we are unable to predict at this time or that we currently do not expect to have a material adverse effect on our business, and we undertake no obligation to update any forward-looking statements. You should not place undue reliance on any forward-looking statements that we may make. This presentation also contains non-GAAP financial measures and includes a GAAP reconciliation of these financial measures. Non-GAAP financial measures should not be construed as being more important than comparable GAAP measures. Safe Harbor 2

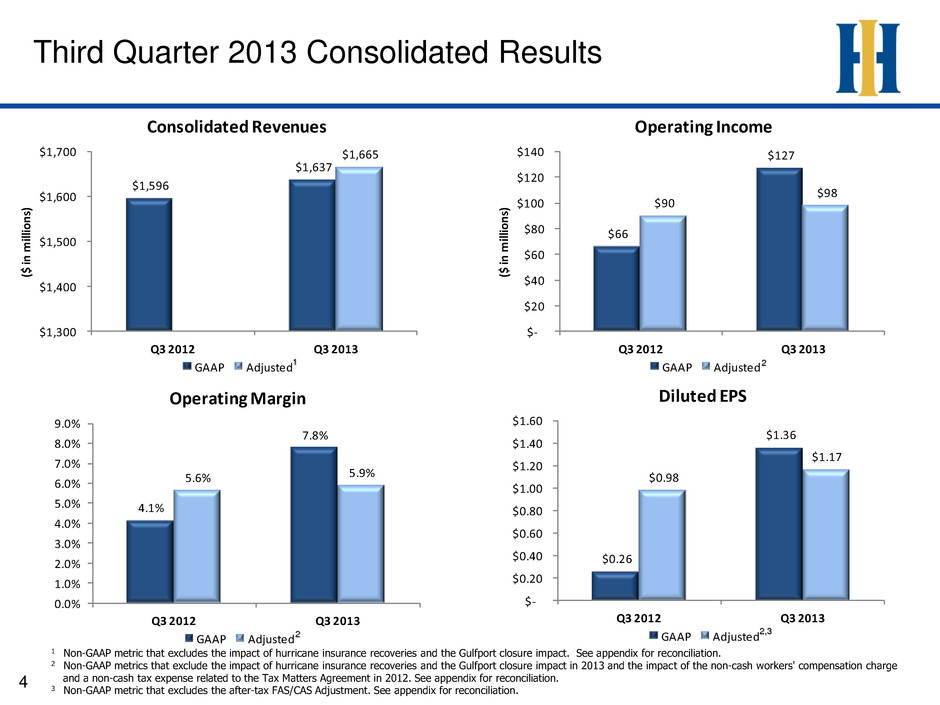
1 Non-GAAP metric that excludes the impact of hurricane insurance recoveries and the Gulfport closure impact. See appendix for reconciliation. 2 Non-GAAP metrics that exclude the impact of hurricane insurance recoveries and the Gulfport closure impact in 2013 and the impact of the non-cash workers' compensation charge and a non-cash tax expense related to the Tax Matters Agreement in 2012. See appendix for reconciliation. 3 Non-GAAP metric that excludes the after-tax FAS/CAS Adjustment. See appendix for reconciliation. Highlights from the Third Quarter 3 Revenues were $1.6 billion for the quarter; Adjusted revenues1 were $1.7 billion Segment operating margin was 8.7%; Total operating margin was 7.8% Adjusted segment operating margin2 was 6.8%; Adjusted total operating margin2 was 5.9% Ingalls adjusted operating margin2 was 3.0% for the quarter, up from 1.5% last year on an adjusted basis Newport News operating margin was 9.1% for the quarter, down from 10.9% last year on an adjusted basis Diluted EPS of $1.36 for the quarter Adjusted Diluted EPS2,3 of $1.17 for the quarter, up 19.4% over prior year on an adjusted basis Excludes the after-tax FAS/CAS Adjustment of $0.18 per share in 2013 and $0.24 per share in 2012

1 Non-GAAP metric that excludes the impact of hurricane insurance recoveries and the Gulfport closure impact. See appendix for reconciliation. 2 Non-GAAP metrics that exclude the impact of hurricane insurance recoveries and the Gulfport closure impact in 2013 and the impact of the non-cash workers' compensation charge and a non-cash tax expense related to the Tax Matters Agreement in 2012. See appendix for reconciliation. 3 Non-GAAP metric that excludes the after-tax FAS/CAS Adjustment. See appendix for reconciliation. $1,596 $1,637 $1,665 $1,300 $1,400 $1,500 $1,600 $1,700 Q3 2012 Q3 2013 ($ in m illi on s) Consolidated Revenues GAAP Adjusted $66 $127 $90 $98 $- $20 $40 $60 $80 $100 $120 $140 Q3 2012 Q3 2013 ($ in m illi on s) Op rating Income GAAP Adjusted $0.26 $1.36 $0.98 $1.17 $- $0.20 $0.40 $0.60 $0.80 $1.0 $1.20 $1.40 $1.60 Q3 2012 Q3 2013 Diluted EPS GAAP Adjusted Third Quarter 2013 Consolidated Results 4 4.1% 7.8% 5.6% 5.9% 0.0% 1.0% 2.0% 3.0% 4.0% 5.0% 6.0% 7.0% 8.0% 9. % Q3 2012 Q3 2013 Operating Margin GAAP Adjusted 1 2 2,3 2

$ 1 $49 $ 10 $ 20 $ 0 $ 10 $ 20 $ 30 $ 40 $ 50 $ 60 Q3 2012 Q3 2013 ($ in mi llio ns ) Operating Income GAAP Adjusted $670 $ 639 $ 667 $- $100 $200 $300 $40 $500 $600 $700 $800 Q3 2012 Q3 2013 ($ in mi llio ns ) Segment Revenues GAAP Adjusted Ingalls Shipbuilding 5 Ingalls Q3 revenues were down YoY due to lower sales on amphibious assault ships and surface combatants Q3 segment margin was up YoY due to risk retirement on the NSC program. Q3 income included additional cost to complete LHA-6 and LPD-25 at a level similar to Q3 2012 0.1% 7.7% 1.5% 3.0% 0.0% 1.0% 2.0% 3.0% 4.0% 5.0% 6.0% 7.0% 8.0% 9.0% Q3 2012 Q3 2013 Operating Margin GAAP Adjusted 1 Non-GAAP metric that excludes the impact of hurricane insurance recoveries and the Gulfport closure impact. See appendix for reconciliation. 2 Non-GAAP metrics that exclude the impact of hurricane insurance recoveries and the Gulfport closure impact in 2013 and the impact of the non-cash workers' compensation charge and a non-cash tax expense related to the Tax Matters Agreement in 2012. See appendix for reconciliation. 1 2 2

9.3% 9.1% 10.9% 5.0% 6.0% 7.0% 8.0% 9.0% 10.0% 11.0% 12.0% Q3 2012 Q3 2013 Operating Margin GAAP Adjusted $88 $93 $103 $50 $60 $70 $80 $90 $100 $110 Q3 2012 Q3 2013 ($ in m illi on s) Operating Income GAAP Adjusted Newport News Shipbuilding 6 Newport News Q3 revenues were up YoY due to higher sales on aircraft carriers and fleet support, offset by lower sales on submarines Q3 segment operating income and margin decreased YoY primarily due to a favorable resolution of outstanding contract changes in 2012 related to the Enterprise EDSRA $944 $ 1,018 $500 $600 $700 $800 $900 $1,000 $1,100 Q3 2012 Q3 2013 ($ in m illi on s) Segment Revenues 1 Non-GAAP metrics that exclude the impact of the non-cash workers' compensation charge in 2012. See appendix for reconciliation. 1 1

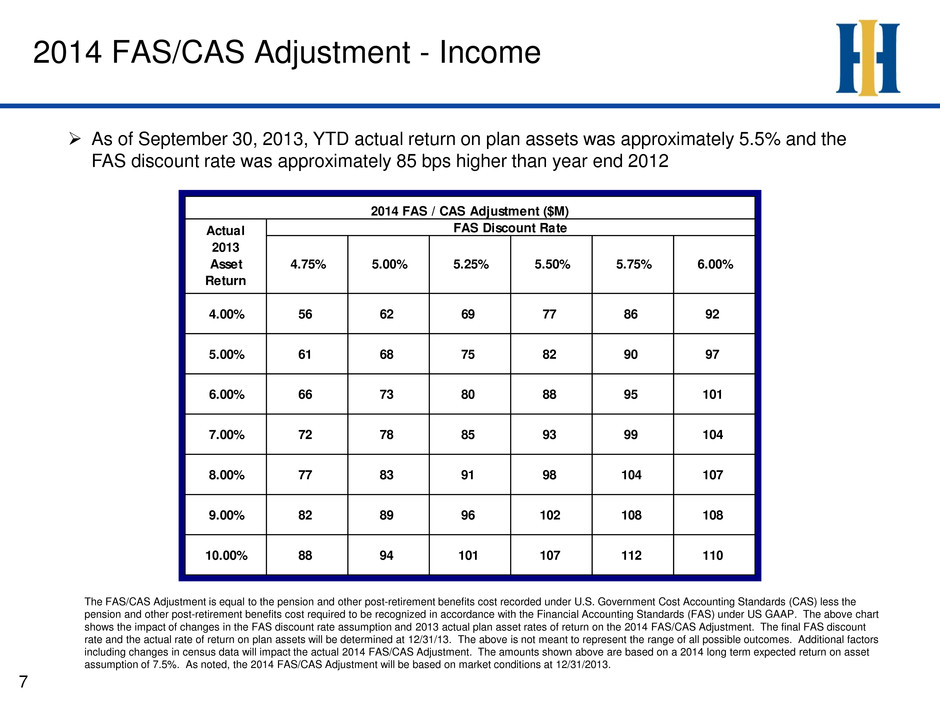
2014 FAS/CAS Adjustment - Income 7 As of September 30, 2013, YTD actual return on plan assets was approximately 5.5% and the FAS discount rate was approximately 85 bps higher than year end 2012 4.00% 56 62 69 77 86 92 5.00% 61 68 75 82 90 97 6.00% 66 73 80 88 95 101 7.00% 72 78 85 93 99 104 8.00% 77 83 91 98 104 107 9.00% 82 89 96 102 108 108 10.00% 88 94 101 107 112 110 2014 FAS / CAS Adjustment ($M) Actual 2013 Asset Return FAS Discount Rate 4.75% 5.00% 5.25% 5.50% 5.75% 6.00% The FAS/CAS Adjustment is equal to the pension and other post-retirement benefits cost recorded under U.S. Government Cost Accounting Standards (CAS) less the pension and other post-retirement benefits cost required to be recognized in accordance with the Financial Accounting Standards (FAS) under US GAAP. The above chart shows the impact of changes in the FAS discount rate assumption and 2013 actual plan asset rates of return on the 2014 FAS/CAS Adjustment. The final FAS discount rate and the actual rate of return on plan assets will be determined at 12/31/13. The above is not meant to represent the range of all possible outcomes. Additional factors including changes in census data will impact the actual 2014 FAS/CAS Adjustment. The amounts shown above are based on a 2014 long term expected return on asset assumption of 7.5%. As noted, the 2014 FAS/CAS Adjustment will be based on market conditions at 12/31/2013.

U n sa ve d Docum e n t / 1 2 /2 9 /1 0 / 1 0 :0 2 Appendix

Reconciliations 9 We make reference to “segment operating income,” “segment operating margin,” “adjusted sales and service revenues,” “adjusted segment operating income,” “adjusted segment operating margin,” “adjusted total operating income,” adjusted operating margin,” “adjusted net earnings,” and “adjusted diluted earnings per share.” Adjusted sales and service revenues is defined as total sales and service revenues adjusted for the impact of the hurricane insurance recoveries and the Gulfport closure impact in 2013. Segment operating income is defined as total operating income before the FAS/CAS Adjustment and deferred state income taxes. Segment operating margin is defined as segment operating income as a percentage of total sales and service revenues. Adjusted segment operating income is defined as segment operating income adjusted for the impact of the hurricane insurance recoveries and the Gulfport closure impact in 2013 and the impact of the non-cash workers' compensation charge in 2012. Adjusted segment operating margin is defined as adjusted segment operating income as a percentage of adjusted segment sales and service revenues. Adjusted total operating income is defined as total operating income adjusted for the impact of the hurricane insurance recoveries and the Gulfport closure impact in 2013 and the impact of the non-cash workers' compensation charge in 2012. Adjusted operating margin is defined as adjusted total operating income as a percentage of adjusted sales and service revenues. Adjusted net earnings is defined as net income adjusted for the 2013 tax effected impact of the hurricane insurance recoveries, the 2013 tax effected impact of the Gulfport closure, the 2012 tax effected impact of the non-cash workers’ compensation charge, the 2012 tax expense related to the spin-off Tax Matters Agreement with Northrop Grumman and the tax effected FAS/CAS Adjustment. Adjusted diluted earnings per share is defined as adjusted net earnings divided by the weighted-average diluted common shares outstanding. Segment operating income and segment operating margin are two of the key metrics we use to evaluate operating performance because they exclude items that do not affect segment performance. We believe adjusted sales and service revenues, adjusted total operating income, adjusted operating margin, adjusted net earnings and adjusted diluted earnings per share are also useful metrics because they exclude non-operating items that we do not consider indicative of our core operating performance. Therefore, we believe it is appropriate to disclose these measures to help investors analyze our operating performance. However, these measures are not measures of financial performance under GAAP and may not be defined or calculated by other companies in the same manner.

Reconciliation of Non-GAAP Measures 10 Three Months Ended September ($ in millions) 2013 2012 Sales and Service Revenues Ingalls 639$ 670$ Newport News 1,018 944 Intersegment eliminations (20) (18) Total Sales and Service Revenues 1,637 1,596 Segment Operating Income Ingalls 49 1 As a percentage of revenues 7.7% 0.1% Newport News 93 88 As a percentage of revenues 9.1% 9.3% Total Segment Operating Income 142 89 As a percentage of revenues 8.7% 5.6% Non-segment factors affecting operating income FAS/CAS Adjustment (13) (19) Deferred state income taxes (2) (4) Total Operating Income 127 66 Interest expense (28) (29) Federal income taxes (30) (24) Net Earnings 69$ 13$

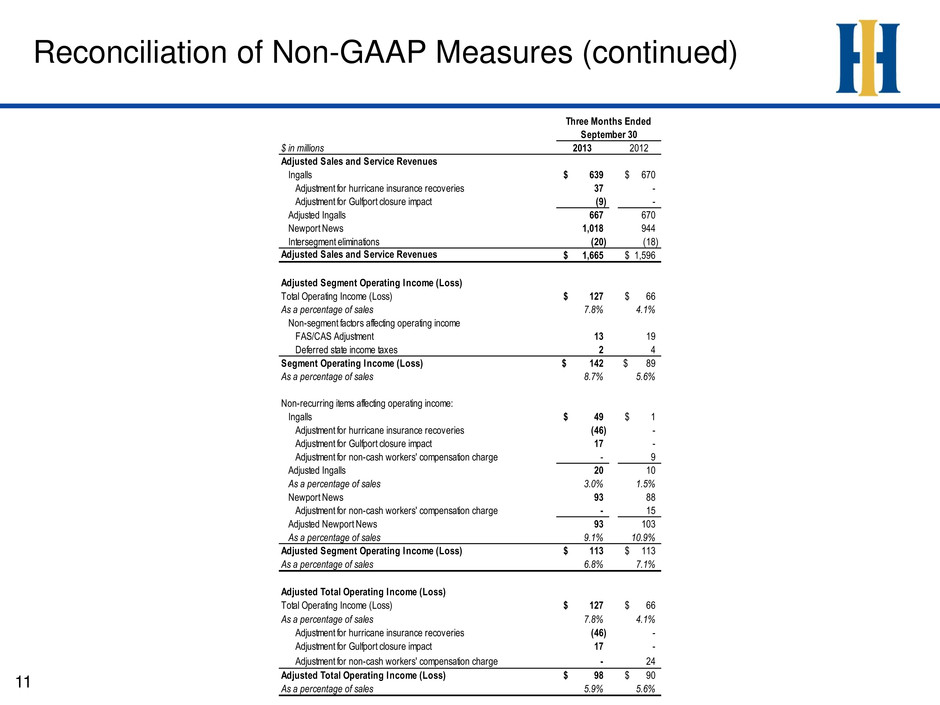
Reconciliation of Non-GAAP Measures (continued) 11 Three Months Ended September 30 $ in millions 2013 2012 Adjusted Sales and Service Revenues Ingalls 639$ 670$ Adjustment for hurricane insurance recoveries 37 - Adjustment for Gulfport closure impact (9) - Adjusted Ingalls 667 670 Newport News 1,018 944 Intersegment eliminations (20) (18) Adjusted Sales and Service Revenues 1,665$ 1,596$ Adjusted Segment Operating Income (Loss) Total Operating Income (Loss) 127$ 66$ As a percentage of sales 7.8% 4.1% Non-segment factors affecting operating income FAS/CAS Adjustment 13 19 Deferred state income taxes 2 4 Segment Operating Income (Loss) 142$ 89$ As a percentage of sales 8.7% 5.6% Non-recurring items affecting operating income: Ingalls 49$ 1$ Adjustment for hurricane insurance recoveries (46) - Adjustment for Gulfport closure impact 17 - Adjustment for non-cash workers' compensation charge - 9 Adjusted Ingalls 20 10 As a percentage of sales 3.0% 1.5% Newport News 93 88 Adjustment for non-cash workers' compensation charge - 15 Adjusted Newport News 93 103 As a percentage of sales 9.1% 10.9% Adjusted Segment Operating Income (Loss) 113$ 113$ As a percentage of sales 6.8% 7.1% Adjusted Total Operating Income (Loss) Total Operating Income (Loss) 127$ 66$ As a percentage of sales 7.8% 4.1% Adjustment for hurricane insurance recoveries (46) - Adjustment for Gulfport closure impact 17 - Adjustment for non-cash workers' compensation charge - 24 Adjusted Total Operating Income (Loss) 98$ 90$ As a percentage of sales 5.9% 5.6%

Reconciliation of Non-GAAP Measures (continued) 12 1 Tax effected at 35% federal statutory tax rate. Three Months Ended September 30 $ in millions 2013 2012 Adjusted Net Earnings (Loss) Net Earnings (Loss) 69$ 13$ Adjustment for hurricane insurance recoveries(1) (30) - Adjustment for Gulfport closure impact(1) 11 - Adjustment for non-cash workers' compensation charge (1) - 16 Adjustment for non-cash tax expense - 8 Adjustment for FAS/CAS Adjustment(1) 9 12 Adjusted Net Earnings (Loss) 59 49 Per Share Amounts Weighted-Average Diluted Shares Outstanding 50.6 50.3 Adjusted Diluted EPS Diluted earnings (loss) per share $1.36 $0.26 After-tax hurricane insurance recoveries per share ($0.59) - After-tax Gulfport closure impact per share $0.22 - After-tax non-cash workers' compensation charge per share - $0.32 Non-cash tax expense per share - $0.16 After-tax FAS/CAS Adjustment per share $0.18 $0.24 Adjusted Diluted EPS $1.17 $0.98
