Attached files
| file | filename |
|---|---|
| 8-K - FORM 8-K - FIFTH THIRD BANCORP | d623756d8k.htm |
 ©
Fifth Third Bank | All Rights Reserved
BancAnalysts Association of Boston
Conference
Tayfun Tuzun
Executive Vice President & Chief Financial Officer
November 7, 2013
Please refer to earnings release dated October 17, 2013 and 10-Q dated
November 6, 2013 for further information.
Exhibit 99.1 |
 2
Well-positioned in current environment
©
Fifth Third Bank | All Rights Reserved
Disciplined
expense control
Traditional
banking focus
consistent with
direction of
financial reform
Strong levels of
profitability
Broad-based
credit
improvements
Exceed fully
phased-in Basel
III capital
standards today
Well-established
franchise in key
markets
Organic growth
success
Continued
investments to
maintain and
enhance
revenue-
generation |
 Earnings per diluted share of $0.47 up 24% from prior year
—
3Q13 included $85MM of pre-tax gains on the sale of Vantiv shares and a
positive $6MM Vantiv warrant valuation
Return on assets of 1.4% (or 1.2% ex-Vantiv) and return on average tangible
common equity¹
of 14.7% (or 12.6% ex-Vantiv)
Pre-provision net revenue¹
up 15% from prior year (fees up 7%; expenses down 5%)
Maintained momentum with strong 3Q results
1
Non-GAAP measure; see Reg. G reconciliation in appendix.
2
Capital ratios presented under current U.S. capital regulations.
The pro forma Basel III Tier I common equity ratio is management’s estimate based upon
its current interpretation of recent prospective regulatory capital requirements
approved in July 2013. 3
Not including any potential future incremental repurchases of common shares in the amount of
any after-tax gains from the sale of Vantiv, Inc. stock. Optimizing retail
distribution strategy and prioritizing key segments within consumer
bank
—
Consumer deposit fees up 17%; credit card balances up 8% from 3Q12
Segment and industry specialization in mid-corporate, energy, and healthcare
within commercial bank
Investment and retirement focus driving 12% growth in retail brokerage and 10%
growth in private client fees within investment advisors business
Strong capital ratios²
—
Tier 1 common ratio¹
9.9%, Basel III pro forma estimate¹
of ~9.5%; reflect benefit
of conversion of Series G preferred stock
Tangible book value per share¹
of $13.09 up 8% from 3Q12
~$600MM of remaining repurchase capacity³
approved under 2013 CCAR plan
3
©
Fifth Third Bank | All Rights Reserved
Strong
Profitability
Executing on
Strategic
Plans
Prudent
Capital
Management |
 4
©
Fifth Third Bank | All Rights Reserved
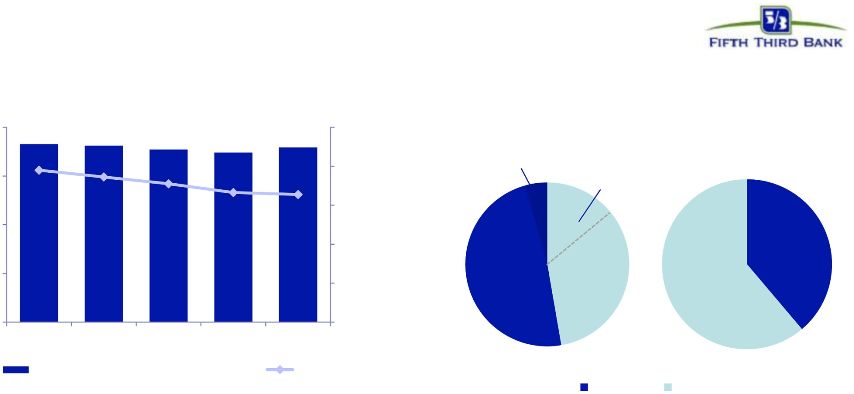
NII results reflect continued moderate NIM
pressure offset by balance sheet growth
1
Estimate; funding (DDAs + interest-bearing liabilities); liabilities attributed
to fixed or floating using terms and expected beta Fixed / Floating
Portfolio Interest-Earning
Assets
Funding
Fixed
~55-60%
Loans
49%
Loans
32%
Investment
Portfolio 4%
NII and NIM (FTE)
($MM)
3.56%
3.49%
3.42%
3.33%
3.31%
$450
$550
$650
$750
$850
$950
2.0%
2.5%
3.0%
3.5%
4.0%
3Q12
4Q12
1Q13
2Q13
3Q13
Net Interest Income (right axis)
NIM
$907
$903
$893
$885
$898
Fixed
47%
Floating
53%
Investment
Portfolio
15%
Floating
~40-45%
Floating
Fixed
1
•
Sequential increase in NII due to higher balances and yields in investment
securities, lower interest expense, and the benefit of an extra day in the
quarter, partially offset by the effects of loan repricing, lower balances of
held-for-sale loans, and the 2Q13 maturity of interest rate floors
•
Changed composition and size of investment portfolio in 3Q13; expect benefit to NII
in future quarters •
New origination spreads remain tight (reflects increased level of competition, impact
of better credit, and overall relationship profitability targets)
•
Increase in short-term LIBOR rates key driver for long-term upside on NII and
NIM •
Coupons on new fixed rate loan originations continue to converge with portfolio avg. coupons (~40%
of loan book is fixed)
|
 5
©
Fifth Third Bank | All Rights Reserved
Strengthened deposit profile
and increased value proposition to customers
Average core deposit balances ($B)
Deposit growth benefited
from focus on
full customer relationship
$86.9
$81.7
Simplified deposit products
•
Straightforward, easy to use
accounts
•
Reduced complexity
•
Elimination of certain fees
•
Total relationship earns better
rates and lower costs
•
Compatible with Fifth Third’s
strategic direction and the new
regulatory landscape
•
Fully converted 2.1 million
households as of the end of the
second quarter
Cost of funds
0.48%
0.47% 0.42% 0.40%
0.38%
0.51%
0.47% 0.44% 0.41%
0.39%
FITB
Peer avg.
Source: SNL Financial. Peer average includes: BBT, CMA, HBAN, KEY, MTB, PNC, RF,
STI, USB, WFC, and ZION. $77.5
$80.2
$80.9
$81.7
$83.2
3Q12
4Q12
1Q13
2Q13
3Q13
Transaction deposits
Other time deposits |
 6
©
Fifth Third Bank | All Rights Reserved
Deposit momentum delivering franchise value
Naples
Source: FDIC, SNL Financial.
Note: branches included are full service retail / brick and mortar; data excludes
headquarters branches with over $250 million in deposits ($500MM for Chicago CBSA).
Cincinnati affiliate
#1 market share (22% or $10.6B
of FITB footprint deposits) and
Fifth Third’s largest affiliate
market; home of our corporate
headquarters
Western Michigan and Northwestern Ohio affiliates
#1 market shares (17% and 18% of FITB footprint deposits,
respectively); incl. Grand Rapids, MI and Toledo, OH
Chicago affiliate
Fifth Third’s second largest affiliate market;
strongest affiliate deposit growth in footprint
vs. 2012; significant expansion through Old
Kent acquisition in 2000
•
Deposit growth in 15 of 18
affiliates
–
Top 3 deposit share in
7 affiliates
–
Deposit growth
outperforming market
in 14 affiliates
•
Fifth Third grew deposit
market share in 78% of
affiliates
Strong market share in mature Midwest markets;
Southeast markets remain key focus area and source of future growth.
North Carolina affiliate
#4 market share in Charlotte;
Entered market through First
Charter acquisition in 2008
Florida region
5.4% increase in deposits vs. 2012,
strongest regional growth market |
 7
©
Fifth Third Bank | All Rights Reserved
Strong loan growth,
ample opportunities for ongoing growth
Loan balances ($B)
Loan composition (EOP HFI)
48% C&I / lease
10% Commercial real estate
Commercial
25% Resi. mtg. / home equity
14% Auto
3% Card / other
Consumer
•
Solid loan growth with
disciplined lending standards
•
C&I and residential mortgage
balance growth more than
offset run-off in both home
equity and commercial real
estate loans
$83.1
$87.2
$82.9
$83.9
$85.9
$86.7
$87.3
3Q12
4Q12
1Q13
2Q13
3Q13
EOP loans HFI
Avg loans HFI
©
Fifth Third Bank | All Rights Reserved
7 |
 Commercial loans –
C&I driving growth
•
Continued run-off in CRE portfolio has
impacted overall loan growth
•
Commercial construction balances are
showing accelerating growth
–
+1%, +3%, and +11% in 1Q13, 2Q13,
and 3Q13, respectively
•
Expect CRE portfolio to contribute to
overall loan growth in future
–
Growth focused primarily on
multi-family and industrial sectors
Source: SNL Financial and Company Reports. Peer average includes: BBT, CMA, HBAN,
KEY, MTB, PNC, RF, STI, USB, WFC, and ZION. BBT & ZION exclude
government guaranteed loans.
1
Presented on a yearly weighted average basis; Excluding held-for-sale
loans. 2
Presented on an average basis; Excluding held-for-sale loans.
•
Growth driven by investments in mid-corporate
segment ($500MM to $2B in revenue) and industry
specializations (i.e. Healthcare and Energy)
•
Loan utilization at record low level
($ in billions)
$10.3
$9.1
$9.3
$9.7
$9.9
+7%
+16%
+15%
Peer average: 26%
$40
$35
$30
$25
$20
$15
$10
28.0
32.4
37.4
3Q11
3Q12
3Q13
44%
32%
31%
30%
29%
27%
25%
21%
21%
21%
18%
13%
CMA
STI
FITB
HBAN
PNC
KEY
RF
ZION
BBT
MTB
USB
WFC
$10
$8
$6
$4
$2
$0
0.7
0.7
0.7
0.7
0.8
3Q12
4Q12
1Q13
2Q13
3Q13
Commercial Mortgage ($B)
Commercial Construction ($B)
©
Fifth Third Bank | All Rights Reserved
8
C&I Portfolio YTD growth
1
CRE balance trend
2
3Q13 C&I Loans / Average Assets
2
9.6
9.2
9.0
8.6
8.3 |
 Growth
opportunities in consumer loans •
5 consecutive quarters of average growth
•
Sequential and yearly growth driven by
stronger cross sell activity and account
growth
•
Significant cross-sell opportunity remains
•
Continued innovation in card products
designed to fit customers’
needs (i.e.
DUO, Access 360)
•
DUO Card balance per active account up
34% from prior year
1
Presented on an average basis; excluding held-for-sale loans.
2
Presented on an end of period basis; excluding held-for-sale loans.
•
Represents 14% of total loans
•
5
largest
bank
originator
of
indirect
auto loans
•
Expanded footprint from 36 to 45 states
•
Careful margin management to
optimize volume/return levels
•
High quality portfolio with ~760 average
FICO
Automobile
balances
2
($B)
Automobile
Credit
Card
Credit
card
balances
1
($B)
# Purchase Active Cards
th
$9.0
$10.7
$11.6
$11.9
$12.1
$0.0
$2.0
$4.0
$6.0
$8.0
$10.0
$12.0
$14.0
3Q09
3Q10
3Q11
3Q12
3Q13
In Footprint
Out of Footprint
47%
53%
57%
60%
62%
47%
53%
43%
40%
38%
$1.5
$1.6
$1.7
$1.8
$1.9
$2.0
$2.1
$2.2
3Q12
4Q12
1Q13
2Q13
3Q13
Mortgage
34%
Home
equity
26%
Auto
33%
Credit
card
6%
Other
consumer
1%
3Q12
3Q13
All Other
DUO Card
Consumer loan portfolio
1
9
©
Fifth Third Bank | All Rights Reserved |
 10
©
Fifth Third Bank | All Rights Reserved
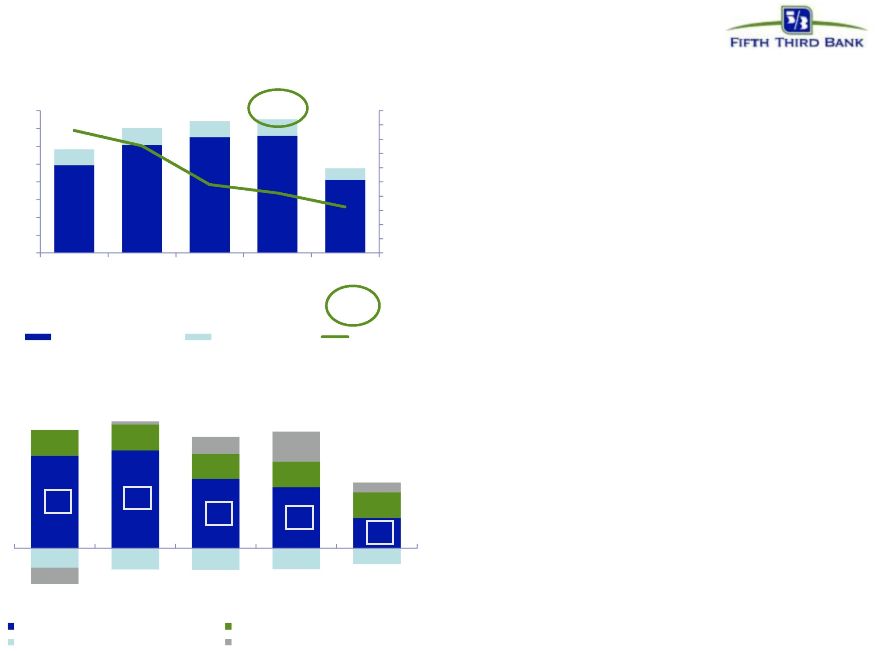
Mortgage banking results
1
Gain-on-sale margin represents gains on all loans originated for
sale. Note: numbers may not sum due to rounding
Mortgage Banking Net Revenue ($MM)
$233
$200
$258
$220
$121
Mortgage originations
and gain-on-sale
margin
1
•
Purchase originations of $2.0B, strongest
absolute level and highest relative to total
originations since 2Q11; key focus area near-term
•
3Q13 mortgage components
–
Origination fees and gains on loan sales down
50% due to lower gain-on-sale margins and
lower origination volumes
–
Lower gains-on-sale partially offset MSR
valuation adjustments of positive $23 million
•
Expect lower mortgage gain-on-sale revenue on
lower volume as higher mortgage rates persist and
competitive pressure on industry margins remains
high
•
Managing expenses in line with reduction in
revenue, 3Q13 mortgage-related expenses down
$25MM
–
elimination of overtime and contract work
–
some reduction in full-time employee costs
–
lower incentive compensation due to lower
origination volumes
•
Potential for better mortgage servicing results as
rates increase
0.0%
0.5%
1.0%
1.5%
2.0%
2.5%
3.0%
3.5%
4.0%
4.5%
5.0%
$0.0
$1.0
$2.0
$3.0
$4.0
$5.0
$6.0
$7.0
$8.0
3Q12
4Q12
1Q13
2Q13
3Q13
Originations for sale
Originations HFI
Margin
($B)
$7.5B
record
1
226
239
169
150
74
62
64
61
62
63
(48)
(52)
(53)
(51)
(39)
(40)
7
42
73
23
3Q12
4Q12
1Q13
2Q13
3Q13
Orig fees and gains on loan sales
Gross servicing fees
Servicing rights amortization
MSR valuation adjustments
% purchase 26%
21% 14% 24% 43%
% refinance 74%
79% 86% 76% 57% |
 11
©
Fifth Third Bank | All Rights Reserved
Strong revenue and profit generation
3Q13 returns strong relative to peers
ROAA
ROATCE
•
Business mix provides higher than average
diversity between spread and fee revenues
•
Relatively strong margin and fee income
contribution drive strong profitability despite
interest rate environment
3Q13 PPNR
/ Average Assets
Source:
SNL
Financial
and
Company
Reports.
Data
as
of
3Q13.
Peer
median
includes:
BBT,
CMA,
HBAN,
KEY,
MTB,
PNC,
RF,
STI,
USB,
WFC,
and
ZION.
PPNR
and
ROATCE
are
Non-GAAP
measures.
See
Reg.
G
reconciliation
in
appendix.
1
Annualized;
excludes
securities
gains
/
losses
for
FITB
and
peers.
STI
also
excludes
$323MM
of
legal
expense,
$96MM
allowance
for
servicing
assets,
and
$63MM
addition
to
repurchase
reserve.
2
See Page 18 in the Appendix for adjustments.
Peer median 1.8%
2.1% /
1.9%
2
Significant purchase
accounting
benefit
14.7%
1.35%
Adjusted
As reported
NII
3Q13 fee income as % of revenue
Fee income
45%
55%
0.0%
0.5%
1.0%
1.5%
2.0%
2.5%
3.0%
USB
WFC
MTB
FITB
PNC
BBT
HBAN
STI
RF
KEY
CMA
ZION
13.5%
13.2%
FITB
Peer Median
1.24%
1.22%
FITB
Peer Median
1
2 |
 12
©
Fifth Third Bank | All Rights Reserved
•
Long-term target for mid-50% efficiency
ratio in normalized environment
–
Potential benefit of higher interest
rates in future
–
Current level reflects below-capacity
balance sheet and lower revenue than
we expect to generate in the future
Disciplined expense management
Expense trend ($MM)
Managing expenses carefully in response to revenue environment;
continuous process of expense evaluation
Efficiency ratio trend
Reported expense
$1,006
$1,163
$978
$1,035
$959
Significant
items
impacting
expenses :
Benefit
$5
--
$9
$2
$16
Detriment
($59)
($176)
($12)
($61)
($40)
Adjusted Expense
$952
$987
$975
$976
$935
1
$600
$700
$800
$900
$1,000
$1,100
$1,200
3Q12
4Q12
1Q13
2Q13
3Q13
64%
65%
60%
53%
59%
60%
60%
62%
60%
61%
Adjusted
Efficiency Ratio
1
1
Significant
items
listed
on
page
18
in
the
appendix
under
“Adjustments
to
remove
(benefit)
/
detriment
in
noninterest
expense.”
3Q13
also
included
a
$15
million
reduction
in the mortgage representation and warranty reserve; 2Q13, 4Q12,
and 3Q12 also included mortgage repurchase reserve builds of $9 million, $26
million, and $24 million, respectively related to additional guidance
received from Freddie Mac. These impacts are reflected in “Credit-related items in noninterest expense”.
3Q12
4Q12
1Q13
2Q13
3Q13 |
 13
Strong asset quality and coverage
Continued
decline
in
problem
assets
and
corresponding
decline
in
charge-offs
combined with strong reserves on an absolute and relative basis
3Q13 coverage ratios
strong relative to peers
Fifth Third
Peer Median
$112
Net charge-offs ($MM)
$109
$156
$147
NCO ratio
0.75%
0.70%
0.63%
0.51%
0.49%
$133
Nonperforming assets ($MM)
$1,210
$1,150
$1,014
$1,446
$1,286
$1,750
$1,500
$1,250
$1,000
$750
$500
$250
$0
334
356
382
403
429
3Q12
4Q12
1Q13
2Q13
3Q13
Commercial
Consumer
1,017
883
828
794
680
$175
$150
$125
$100
$75
$50
$25
$0
65
67
79
91
94
3Q12
4Q12
1Q13
2Q13
3Q13
Commercial
Consumer
62
56
54
45
44
160%
218%
165%
355%
152%
320%
Reserves / NPLs
Reserves / NPAs
Reserves / Annualized YTD
NCOs
©
Fifth Third Bank | All Rights Reserved
1.73%
1.49%
1.41%
1.32%
1.16%
NPA ratio |
 14
©
Fifth Third Bank | All Rights Reserved
Strong capital position and capital generation
support ability to return capital to shareholders
Very strong capital
levels support balance
sheet growth and
higher returns to
shareholders.
~$1.9 billion in capital returned to common shareholders
(7 quarters through 9/30/13)
$175MM
Vantiv-related
repurchases
$600MM
other
repurchases
$421MM
dividends
$539MM
repurchases
$207MM
dividends
~$600MM
remaining
capacity for
repurchases
1
Not including any potential future incremental repurchases of common shares in the
amount of any after-tax gains from the sale of Vantiv, Inc. stock. 2
Included $157MM of repurchases related to after-tax gains from the sale of
Vantiv, Inc. stock. 3
Non-GAAP measure; see Reg. G reconciliation in Appendix. Capital ratios
presented under current U.S. capital regulations. The pro forma Basel III Tier I common equity
ratio is management’s estimate based upon its current interpretation of recent
prospective regulatory capital requirements approved in July 2013. 9.5%
9.9%
3Q13 Tier 1
common ratio
(Basel I)
3Q13 Tier 1
common ratio
(Basel III)
Relative to 5.0% unofficial CCAR
supervisory reference minimum
Relative
to
2015
Basel
III
minimum
of
4.5% and 2019 Basel III buffered
minimum of 7.0%
(5 Quarters)
(through 2 Quarters)
$0
$200
$400
$600
$800
$1,000
$1,200
$1,400
2012 CCAR
$0
$200
$400
$600
$800
$1,000
$1,200
$1,400
2013 CCAR
3
3
1
2
|
 15
Well-positioned for the future
•
Cash currently sufficient to satisfy all fixed obligations in a stressed
environment for approximately 2 years (debt maturities, common and preferred
dividends, interest and other expenses) without accessing capital markets; relying on dividends from
subsidiaries or any other discretionary actions
•
~9.5%
pro
forma
Basel
III
Tier
1
common
capital
ratio
1
under
recent
prospective
regulatory
capital
requirements
•
Strong returns to shareholders through dividends and share repurchases, additional
capacity from capital generation Superior capital and liquidity position
•
NCO
ratio
lowest
reported
in
more
than
6
years;
delinquencies
at
historically
low
levels
•
Very low relative exposure to areas of concern, e.g. European financials, mortgage
repurchase risk •
Traditional commercial banking franchise built on customer-oriented localized
operating model •
Strong market share in key markets with focus on further improving density
•
Fee income ~45% of total revenue
Diversified traditional banking platform
•
PPNR remained strong throughout the credit cycle
•
Solid returns on both assets and equity, with or without gains related to our
Vantiv holding •
Disciplined expense management
Industry leader in earnings power
1
Non-GAAP measure; see Reg. G reconciliation in Appendix. Capital ratios
presented under current U.S. capital regulations. The pro forma Basel III Tier I common
equity ratio is management’s estimate based upon its current interpretation of
recent prospective regulatory capital requirements approved in July 2013.
©
Fifth Third Bank | All Rights Reserved
Credit
trends
reflective
of
excellent
asset
quality
with
further
opportunity
for
improvement |
 16
©
Fifth Third Bank | All Rights Reserved
This report contains statements that we believe are “forward-looking
statements” within the meaning of Section 27A of the Securities Act of 1933, as
amended, and Rule 175 promulgated thereunder, and Section 21E of the Securities Exchange Act of 1934, as amended, and Rule
3b-6 promulgated thereunder. These statements relate to our financial condition, results
of operations, plans, objectives, future performance or business. They usually can be
identified by the use of forward-looking language such as “will likely result,” “may,” “are expected to,” “is
anticipated,” “estimate,” “forecast,” “projected,”
“intends to,” or may include other similar words or phrases such as “believes,” “plans,” “trend,”
“objective,” “continue,” “remain,” or similar expressions, or
future or conditional verbs such as “will,” “would,” “should,” “could,” “might,” “can,”
or similar verbs. You should not place undue reliance on these statements, as they are
subject to risks and uncertainties, including but not limited to the risk factors set
forth in our most recent Annual Report on Form 10-K. When considering these forward-looking statements, you
should keep in mind these risks and uncertainties, as well as any cautionary statements we
may make. Moreover, you should treat these statements as speaking only as of the date
they are made and based only on information then actually known to us.
There are a number of important factors that could cause future results to differ materially
from historical performance and these forward- looking statements. Factors that
might cause such a difference include, but are not limited to: (1) general economic conditions and weakening
in the economy, specifically the real estate market, either nationally or in the states in
which Fifth Third, one or more acquired entities and/or the combined company do
business, are less favorable than expected; (2) deteriorating credit quality; (3) political developments, wars or other
hostilities may disrupt or increase volatility in securities markets or other economic
conditions; (4) changes in the interest rate environment reduce interest margins; (5)
prepayment speeds, loan origination and sale volumes, charge-offs and loan loss provisions; (6) Fifth Third’s
ability to maintain required capital levels and adequate sources of funding and liquidity;
(7) maintaining capital requirements may limit Fifth Third’s operations and
potential growth; (8) changes and trends in capital markets; (9) problems encountered by larger or similar financial
institutions may adversely affect the banking industry and/or Fifth Third; (10) competitive
pressures among depository institutions increase significantly; (11) effects of
critical accounting policies and judgments; (12) changes in accounting policies or procedures as may be required
by the Financial Accounting Standards Board (FASB) or other regulatory agencies; (13)
legislative or regulatory changes or actions, or significant litigation, adversely
affect Fifth Third, one or more acquired entities and/or the combined company or the businesses in which Fifth
Third, one or more acquired entities and/or the combined company are engaged, including the
Dodd-Frank Wall Street Reform and Consumer Protection Act; (14) ability to
maintain favorable ratings from rating agencies; (15) fluctuation of Fifth Third’s stock price; (16) ability to attract
and retain key personnel; (17) ability to receive dividends from its subsidiaries; (18)
potentially dilutive effect of future acquisitions on current shareholders’
ownership of Fifth Third; (19) effects of accounting or financial results of one or more acquired entities; (20) difficulties from the
separation of or the results of operations of Vantiv, LLC; (21) loss of income from any sale
or potential sale of businesses that could have an adverse effect on Fifth
Third’s earnings and future growth; (22) ability to secure confidential information and deliver products and services
through the use of computer systems and telecommunications networks; and (23) the impact of
reputational risk created by these developments on such matters as business
generation and retention, funding and liquidity.
You should refer to our periodic and current reports filed with the Securities and Exchange
Commission, or “SEC,” for further information on other factors, which could
cause actual results to be significantly different from those expressed or implied by these forward-looking
statements.
Cautionary statement |
 ©
Fifth Third Bank | All Rights Reserved
Appendix |
 18
Pre-tax
pre-provision
earnings
1
1
Non-GAAP measure; see Reg. G reconciliation on following pages.
2
Prior quarters include similar adjustments.
3
See
Slide
7
and
Slide
8
of
earnings
presentation
dated
10/17/13
for
detailed
breakout
of
credit-related
items.
4
There
are
limitations
on
the
usefulness
of
credit-adjusted
PPNR,
including
the
significant
degree
to
which
changes
in
credit
and
fair
value
are
integral,
recurring
components
of
the
Bancorp’s
core
operations
as
a
financial
institution.
This
measure
has
been
included
herein
to
facilitate
a
greater
understanding
of
the
Bancorp’s
financial
condition.
Note:
3Q13
also
included
a
$15
million
reduction
in
the
mortgage
representation
and
warranty
reserve;
2Q13,
4Q12,
and
3Q12
also
included
mortgage
repurchase
reserve
builds of $9 million, $26 million, and $24 million, respectively, related to additional
guidance received from Freddie Mac. These impacts are reflected in “Credit-related items in
noninterest expense”
listed above.
PPNR of $655MM up 15%; Adjusted PPNR of $603MM up 1% from 3Q12.
PPNR reconciliation
$800
$700
$600
$500
$400
$300
$200
$100
$0
3Q12
4Q12
1Q13
2Q13
3Q13
59
68
24
14
13
10
6
35
16
5
600
640
605
632
603
$568
$616
$653
$905
$655
PPNR
Credit-related items in noninterest expense
Credit-related items in noninterest income
Adjusted PPNR
($ in millions)
3Q12
4Q12
1Q13
2Q13
3Q13
Income before income taxes (U.S. GAAP) (a)
$503
$540
$591
$841
$605
Add: Provision expense (U.S. GAAP) (b)
65
76
62
64
51
PPNR (a) + (b)
$568
$616
$653
$905
$655
Adjustments
to
remove
(benefit)
/
detriment
2
:
In
noninterest
income:
Gain from sales of Vantiv shares
-
(157)
-
(242)
(85)
Vantiv warrant & puts
16
19
(34)
(76)
(6)
Valuation of 2009 Visa total return swap
1
15
7
5
2
Sale of certain Fifth Third funds
(13)
-
(7)
-
-
BOLI settlement
-
-
-
(10)
-
Securities (gains) / losses
(2)
(2)
(17)
-
(2)
In
noninterest
expense:
Debt extinguishment (gains) / losses
26
134
-
-
-
Severance expense
2
3
3
1
5
Sale of certain Fifth Third funds
2
-
-
-
-
Large bank assessment fees
-
-
-
-
5
Gain on sale of affordable housing investments
(5)
-
(9)
(2)
(1)
Additions to litigation reserves
5
13
9
51
30
Adjusted PPNR
$600
$640
$605
$632
$603
Credit-related
items
3
:
In noninterest income
14
13
10
6
5
In noninterest expense
59
68
24
35
16
Credit-adjusted
PPNR
4
$673
$721
$639
$673
$624
©
Fifth Third Bank | All Rights Reserved
PPNR trend |
 Available and
contingent borrowing capacity (3Q13): –
FHLB ~$9B available, ~$11B total
–
Federal Reserve ~$28B
Holding Company cash at 9/30/13: $1.9B
Cash currently sufficient to satisfy all fixed
obligations in a stressed environment for over
2 years (debt maturities, common and
preferred dividends, interest and other
expenses) without accessing capital markets;
relying on dividends from subsidiaries or any
other discretionary actions
Holding company unsecured debt maturities ($MM)
Bank
unsecured
debt
maturities
($MM
–
excl.
Brokered
CDs)
Heavily core funded
Strong liquidity profile
S-T
wholesale
9%
19
©
Fifth Third Bank | All Rights Reserved
$1,250
$500
$500
$2,312
$1,458
$62
$500
$700
$600
2013
2014
2015
2016
2017
2018
2019 on
2017
2013
2014
2015
2016
2018
2019 on
Fifth Third Bancorp
Fifth Third Capital Trust (Bancorp)
L-T debt
6%
Equity
12%
Other
liabilities
4%
S-T
borrowings
3%
Non-Core
Deposits
6%
Foreign
Office
1%
Consumer
time
3%
Savings
MMDA
22%
Interest
checking
19%
Demand
24% |
 20
©
Fifth Third Bank | All Rights Reserved
Capital management philosophy
1
Subject to Board of Directors and regulatory approval
Organic growth opportunities
•
Support growth of core banking franchise
•
Continued loan growth despite sluggish
economy
Strategic opportunities
•
Prudently evaluate opportunities to increase
density of franchise via disciplined
acquisitions or selective de novos
•
Expect future acquisition opportunities
although activity likely to remain muted in
near-term
•
Attain top 3 market position in 65% of
markets or more longer term
Dividends
•
As previously indicated, target levels more
consistent with Fed’s near-term payout ratio
guidance of 30%
•
Strong levels of profitability would support
higher dividend than current level
•
Quarterly dividend increased to $0.12 in 2Q13
Repurchases / Redemptions
Consistent and prudent capital management philosophy
Capital Retention / Deployment
Capital Return
•
Common share repurchases to limit / manage growth of
excess capital levels
•
2013 CCAR included:
–
Potential repurchase of ~$1.2B in common stock
(including repurchases related to already realized
Vantiv gains)
o
Repurchased $539MM of common shares in
2Q13
–
Potential issuance of $1.05B in preferred stock
o
$593MM of preferred stock issued in 2Q13
–
Conversion of $398MM in 8.5% convertible preferred
stock into ~35.5MM common shares –
July 2013
•
Ability to repurchase shares in amount equal to any
future after-tax gains on sale of Vantiv shares
1
1
1 |
 21
©
Fifth Third Bank | All Rights Reserved
Regulation G Non-GAAP reconciliation
Fifth Third Bancorp and Subsidiaries
Regulation G Non-GAAP Reconcilation
$ and shares in millions
(unaudited)
September
June
March
December
September
2013
2013
2013
2012
2012
Income before income taxes (U.S. GAAP)
$604
$841
$591
$540
$503
Add:
Provision expense (U.S. GAAP)
51
64
62
76
65
Pre-provision net revenue (a)
655
905
653
616
568
Net income available to common shareholders (U.S. GAAP)
421
582
413
390
354
Add:
Intangible amortization, net of tax
1
1
1
2
2
Tangible net
income available to common shareholders 422
583
414
392
356
Tangible net income available to common
shareholders (annualized) (b) 1,674
2,338
1,679
1,559
1,416
Average Bancorp shareholders' equity (U.S. GAAP)
14,440
14,221
13,779
13,855
13,887
Less:
Average preferred stock
(593)
(717)
(398)
(398)
(398)
Average goodwill
(2,416)
(2,416)
(2,416)
(2,417)
(2,417)
Average intangible assets
(22)
(24)
(26)
(28)
(31)
Average tangible common equity
(c) 11,409
11,064
10,939
11,012
11,041
Total Bancorp shareholders' equity (U.S. GAAP)
14,641
14,239
13,882
13,716
13,718
Less:
Preferred stock
(593)
(991)
(398)
(398)
(398)
Goodwill
(2,416)
(2,416)
(2,416)
(2,416)
(2,417)
Intangible assets
(21)
(23)
(25)
(27)
(30)
Tangible common equity, including
unrealized gains / losses (d) 11,611
10,809
11,043
10,875
10,873
Less: Accumulated other comprehensive income / loss
(218)
(149)
(333)
(375)
(468)
Tangible common equity, excluding unrealized gains /
losses (e) 11,393
10,660
10,710
10,500
10,405
Total assets (U.S. GAAP)
125,673
123,360
121,382
121,894
117,483
Less:
Goodwill
(2,416)
(2,416)
(2,416)
(2,416)
(2,417)
Intangible assets
(21)
(23)
(25)
(27)
(30)
Tangible assets, including
unrealized gains / losses (f) 123,236
120,921
118,941
119,451
115,036
Less: Accumulated other comprehensive income / loss, before tax
(335)
(229)
(512)
(577)
(720)
Tangible assets, excluding unrealized gains / losses
(g) 122,901
120,692
118,429
118,874
114,316
Common shares outstanding (h)
887
851
875
882
897
Ratios:
Return on average tangible common equity (b) / (c)
14.7%
21.1%
15.4%
14.1%
12.8%
Tangible common equity (excluding unrealized gains/losses) (e) / (g)
9.27%
8.83%
9.03%
8.83%
9.10%
Tangible common equity (including unrealized gains/losses) (d) / (f)
9.42%
8.94%
9.28%
9.10%
9.45%
Tangible book value per share (d) / (h)
13.09
12.69
12.62
12.33
12.12
For the Three Months Ended |
 22
Regulation G Non-GAAP reconciliation
Fifth Third Bancorp and Subsidiaries
Regulation G Non-GAAP Reconcilation
$ and shares in millions
(unaudited)
September
June
March
December
September
2013
2013
2013
2012
2012
Total Bancorp shareholders' equity (U.S. GAAP)
$14,641
$14,239
$13,882
$13,716
$13,718
Goodwill and certain other intangibles
(2,492)
(2,496)
(2,504)
(2,499)
(2,504)
Unrealized gains
(218)
(149)
(333)
(375)
(468)
Qualifying trust preferred securities
810
810
810
810
810
Other
21
22
23
33
38
Tier I capital
12,762
12,426
11,878
11,685
11,594
Less:
Preferred stock
(593)
(991)
(398)
(398)
(398)
Qualifying trust preferred securities
(810)
(810)
(810)
(810)
(810)
Qualifying noncontrolling interest in consolidated subsidiaries
(39)
(38)
(38)
(48)
(51)
Tier I common equity (a)
11,320
10,587
10,632
10,429
10,335
Risk-weighted
assets
1
(b)
114,544
112,285
109,626
109,699
106,858
Ratio:
Tier I common equity (a) / (b)
9.88%
9.43%
9.70%
9.51%
9.67%
Basel III -
Estimated Tier 1 common equity ratio
September
June
2013
2013
Tier 1 common equity (Basel I)
$11,320
$10,587
Add:
$88
$86
Estimated Tier 1 common equity under final Basel III rules without AOCI (opt out)(c)
$11,408
$10,673
Add:
Adjustment
related
to
AOCI
3
$218
$149
Estimated Tier 1 common equity under final Basel III rules with AOCI (non opt out)(d)
$11,626
$10,822
Estimated
risk-weighted
assets
under
final
Basel
III
rules
4
(e)
120,447
117,366
Estimated
Tier
1
common
equity
ratio
under
final
Basel
III
rules
(opt
out)
(c)
/
(e)
9.47%
9.09%
Estimated
Tier
1
common
equity
ratio
under
final
Basel
III
rules
(non
opt
out)
(d)
/
(e)
9.65%
9.22%
1
2
3
4
Adjustments
related
to
capital
components
include
MSRs
and
deferred
tax
assets
subject
to
threshold
limitations
and
deferred
tax
liabilities
related
to
intangible
assets,
which
were
deductions
to capital under Basel I capital rules.
Under final Basel III rules, non-advanced approach banks are permitted to make a
one-time election to opt out of the requirement to include AOCI in Tier I common equity.
For the Three Months Ended
Under the banking agencies’
risk-based capital guidelines, assets and credit equivalent amounts of derivatives and
off-balance sheet exposures are assigned to broad risk categories. The aggregate
dollar amount in each risk category is multiplied by the associated risk weight of the category. The resulting weighted values are added together, along with the measure
for market risk, resulting in the Bancorp’s total risk-weighted assets.
Key differences under Basel III in the calculation of risk-weighted assets compared to
Basel I include: (1) Risk weighting for commitments under 1 year; (2) Higher risk weighting
for exposures to securitizations, past due loans, foreign banks and certain commercial real
estate; (3) Higher risk weighting for MSRs and deferred tax assets that are under certain
thresholds as a percent of Tier I capital;
and
(4)
Derivatives
are
differentiated between
exchange
clearing
and
over-the-counter
and
the
50%
risk-weight
cap
is
removed.
©
Fifth Third Bank | All Rights Reserved
Adjustment
related
to
capital components
2 |