Attached files
| file | filename |
|---|---|
| 8-K - 8-K - FEDERAL HOME LOAN MORTGAGE CORP | d620722d8k.htm |
| EX-99.1 - EXHIBIT 99.1 - FEDERAL HOME LOAN MORTGAGE CORP | d620722dex991.htm |
 Third
Quarter 2013 Financial Results
Supplement
November 7, 2013
Exhibit 99.2 |
 2
Table of contents
Business Results
Credit Supplement
3 -
Quarterly Financial Results
20 -
National Home Prices
4 -
Comprehensive Income (Loss)
21 -
State-by-State Home Prices: June 2006 to September 2013
5 -
Senior Preferred Stock Purchase Agreement with Treasury
22 -
State-by-State Home Prices: September 2012 to September 2013
6 -
Treasury Draw Requests and Dividend Payments
23 -
Mortgage Market and Freddie Mac Serious Delinquency Rates
7 -
Total Equity and Senior Preferred Stock Activity
24 -
8 -
Single-Family Guarantee Fees Charged on New Acquisitions
25 -
9 -
Loan Loss Reserves
26 -
10 -
27 -
11 -
28 -
12 -
29 -
13 -
30 -
14 -
31 -
15 -
32 -
Multifamily Portfolio Composition
16 -
33 -
Multifamily New Business Volume by State
17 -
34 -
Multifamily Mortgage Portfolio UPB Concentration by State
18 -
35 -
Multifamily Mortgage Portfolio by Attribute
36 -
Multifamily Mortgage Portfolio by Attribute, Continued
37 -
Multifamily Market and Freddie Mac Delinquency Rates
Loan Purpose of Single-Family Credit Guarantee Portfolio
Purchases
Credit Quality of Single-Family Credit Guarantee Portfolio Purchases
Single-Family Credit Guarantee Portfolio Characteristics
Single-Family 3Q 2013 Credit Losses and REO by Region and State
Single-Family Credit Profile by Book Year and Product Feature
Single-Family Serious Delinquency Rates by State and Region
Aging of Single-Family Seriously Delinquent Loans by Judicial and
Non-Judicial States
Real Estate Owned
Single-Family Cumulative Foreclosure Transfer and Short Sale
Rates by Book Year
Market Liquidity Provided
Single-Family Refinance Activity
Performance of Single-Family Modified Loans
Single-Family Loan Modifications
Single-Family Loan Workouts
Administrative Expenses
Repurchase Requests
Purchase Agreement Portfolio Limits |
  3
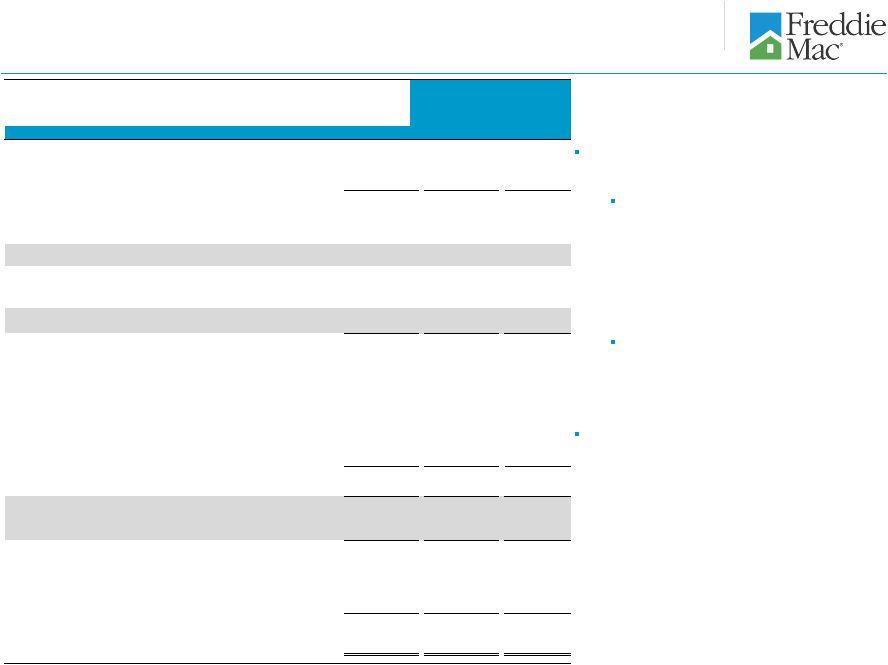
Quarterly financial results
Line 12:
Pre-tax income increased in 3Q13 primarily
due to:
Line 6:
Gains on securities in the company’s
mortgage-related investments portfolio, gains on
multifamily mortgages loans and settlement
proceeds related to private label securities
litigation.
Line 4:
A shift from derivative gains in 2Q13 to
derivative losses in 3Q13 as long-term interest
rates increased less during 3Q13 as compared
to 2Q13.
Line 13:
Income tax benefit in 3Q13 includes a benefit
for federal income taxes of $23.9 billion that resulted
from the company’s conclusion to release the valuation
allowance against its net deferred tax assets.
($ Billions)
3Q 2013
vs
2Q 2013
3Q 2013
2Q 2013
1
Net interest income
$4.1
$4.3
$0.1
2
Benefit for credit losses
0.6
1.1
0.5
3
Net interest income after benefit for credit losses
4.8
5.4
0.6
Non-interest income (loss)
4
Derivative gains (losses)
1.4
(0.1)
(1.4)
5
Net impairment of available-for-sale securities
recognized in earnings
(0.0)
(0.1)
(0.1)
6
Other non-interest income (loss)
(0.6)
1.9
2.5
7
Non-interest income
0.7
1.7
1.0
Non-interest expense
8
Total administrative expenses
(0.4)
(0.5)
(0.0)
9
Real estate owned operations income
0.1
0.1
(0.0)
10
Other expenses
(0.2)
(0.2)
(0.0)
11
Non-interest expense
(0.5)
(0.6)
(0.1)
12
Pre-tax income
4.9
6.5
1.6
13
Income tax benefit
0.0
24.0
23.9
14
Net income
5.0
30.5
25.5
15
Total other comprehensive income (loss),
net of taxes
(0.6)
(0.0)
0.6
16
Comprehensive income
$4.4
$30.4
$26.1
Partially offset by: |
 4
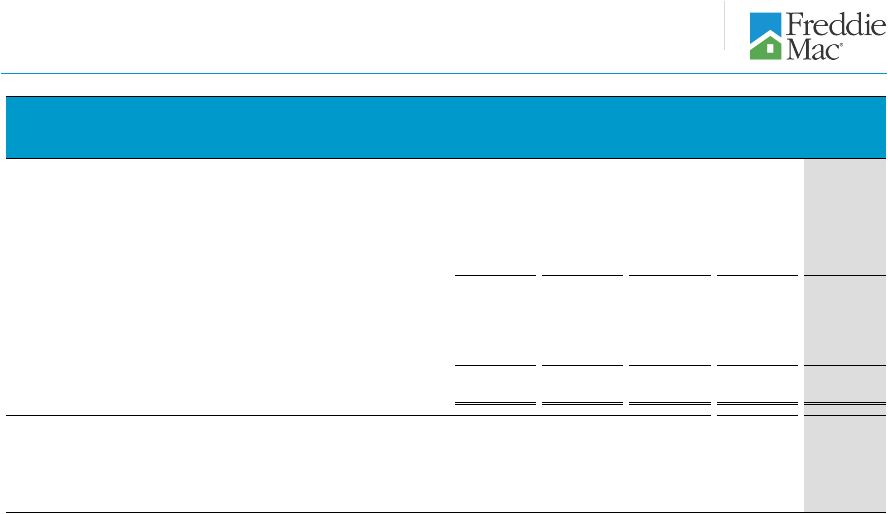
Comprehensive income (loss)
1
Consists of the after-tax changes in: (a) the unrealized gains and losses on
available-for-sale securities; (b) the effective portion of derivatives previously designated as cash flow
hedges; and (c) defined benefit plans.
A
B
C = A + B
(10)
(5)
0
5
10
15
20
25
30
35
3Q
2011
4Q
2011
1Q
2012
2Q
2012
3Q
2012
4Q
2012
1Q
2013
2Q
2013
3Q
2013
$ Billions
Net income (loss)
Comprehensive income (loss)
Includes
$23.9 billion
benefit from
releasing the
valuation
allowance on
deferred tax
assets
1
Total
other
comprehensive
income
(loss),
net
of
taxes |
 Senior
Preferred Stock Purchase Agreement with Treasury
Senior
preferred
stock
outstanding
and
held
by
Treasury
remained
$72.3
billion
at
September 30, 2013.
1
Dividend payments do not reduce prior Treasury draws.
Any future draws will increase the balance of senior preferred stock
outstanding. Since entering conservatorship in September 2008, Freddie Mac
has: Received cumulative draws of $71.3 billion from Treasury. No draws
have been requested for the past six quarters; last draw request was $19
million for first quarter 2012.
Freddie Mac’s net worth was $33.4 billion at September 30, 2013. As a
result: Dividend obligation to Treasury will be $30.4 billion in
December 2013. Aggregate cash dividends paid to Treasury will
total $71.345 billion including the December dividend obligation, versus
cumulative cash draws of $71.336 billion received from Treasury through
September 30, 2013. The amount of remaining Treasury funding currently
available to Freddie Mac under the Purchase Agreement is $140.5
billion. Any future draws will reduce this amount. 5
1
Senior preferred stock outstanding of $72.3 billion at September 30, 2013 includes cumulative draws of
$71.3 billion plus the initial liquidation preference of $1 billion. |
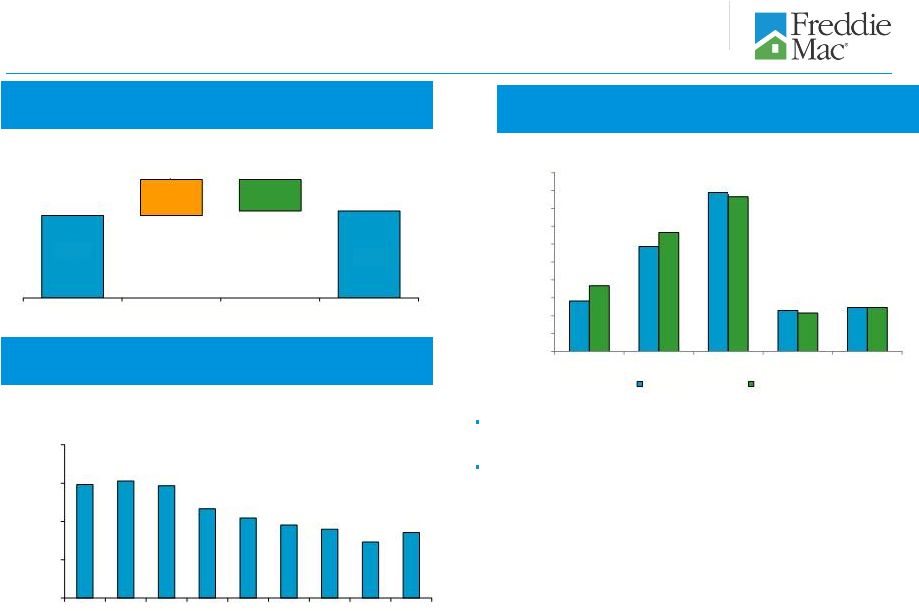
 Dividend Payment to Treasury
Draw Request from Treasury
6
Treasury draw requests and dividend payments
1
2
Data as of September 30, 2013.
3
Amount does not include the December 2013 dividend obligation of $30.4 billion.
4
Annual amounts represent the total draws requested based on Freddie Mac’s
quarterly net deficits for the periods presented. Draw requests are funded in the subsequent quarter
(e.g., $19 million draw request for 1Q 2012 was funded in 2Q 2012).
5
Represents quarterly cash dividends paid by Freddie Mac to Treasury during the
periods presented. Through December 31, 2012, Treasury was entitled to receive cumulative
quarterly cash dividends at the annual rate of 10% per year on the liquidation
preference of the senior preferred stock. However, the fixed dividend rate was replaced with a net
worth sweep dividend payment beginning in the first quarter of 2013. See the
company’s Quarterly Report on Form 10-Q for the quarter ended September 30, 2013 for more
information.
$ Billions
5
4
2, 3
2
Draws From Treasury
Dividend Payments to Treasury
$44.6
$6.1
$13.0
$7.6
$0.02
$0.0
2008
2009
2010
2011
2012
YTD
3Q 2013
$0.2
$4.1
$5.7
$6.5
$7.2
$17.2
2008
2009
2010
2011
2012
YTD
3Q 2013
($ Billions)
Cumulative
Total
Dividend Payments as of 9/30/13
$40.909
4Q 2013 Dividend Obligation
$30.436
Total Dividend Payments
$71.345
($ Billions)
Cumulative
Total
$1.000
Treasury Draws
$71.336
Total Senior Preferred Stock
Outstanding
$72.336
The initial $1 billion liquidation preference of senior preferred stock was issued to Treasury in
September 2008 as consideration for Treasury’s funding commitment. The company
received no cash proceeds as a result of issuing this initial $1 billion liquidation preference of senior preferred stock.
|
 7
Total equity and Senior Preferred Stock activity
1
See the company’s Quarterly Report on Form 10-Q for the quarter ended
September 30, 2013 for a description of the company’s dividend obligation to Treasury.
2
Includes the initial liquidation preference of Freddie Mac’s senior preferred
stock of $1.0 billion. ($ Billions)
3Q 2012
4Q 2012
1Q 2013
2Q 2013
3Q 2013
1
Beginning
balance
-
Total
equity
/
GAAP
net
worth
$1.1
$4.9
$8.8
$10.0
$7.4
2
Capital draw funded by Treasury
-
-
-
-
-
3
Net income
2.9
4.5
4.6
5.0
30.5
4
Total other comprehensive income (loss), net of taxes
2.7
1.3
2.4
(0.6)
(0.0)
5
Comprehensive income
5.6
5.7
7.0
4.4
30.4
6
Dividends paid to Treasury
(1.8)
(1.8)
(5.8)
(7.0)
(4.4)
7
Other
-
-
-
-
-
8
Ending
balance
-
Total
equity / GAAP
net
worth
1
$4.9
$8.8
$10.0
$7.4
$33.4
9
Aggregate
liquidation
preference
of
the
senior
preferred
stock
2
$72.3
$72.3
$72.3
$72.3
$72.3
10
Remaining senior preferred stock funding beginning in 2013
N/A
N/A
$140.5
$140.5
$140.5 |
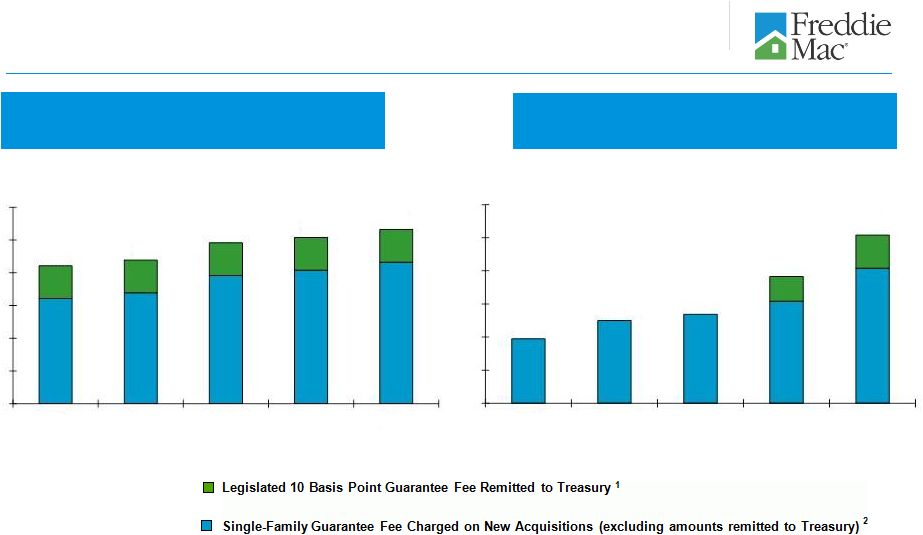 8
Single-family guarantee fees charged on new
acquisitions
1
2
Quarterly
In Basis Points, Annualized
Annual
In Basis Points
1
42
44
49
51
53
0
10
20
30
40
50
60
3Q
2012
4Q
2012
1Q
2013
2Q
2013
3Q
2013
20
25
27
38
51
0
10
20
30
40
50
60
2009
2010
2011
2012
YTD 2013
Represents the estimated rate of management and guarantee fees for new acquisitions during the period
assuming amortization of delivery fees using the estimated life of the related loans rather
than the original contractual maturity date of the related loans. Also includes the effect of pricing adjustments that are based on the relative
performance of our PCs compared to comparable Fannie Mae securities.
Effective April 1, 2012, guarantee fees charged on single-family loans sold to Freddie Mac were
increased by 10 basis points. Under the Temporary Payroll Tax Cut Continuation Act of
2011, Freddie Mac is required to remit the proceeds from this increase to Treasury. Given the April 1, 2012 effective date, the impact of the increase on
average guarantee fees for full-year 2012 was 7.5 basis points.
|
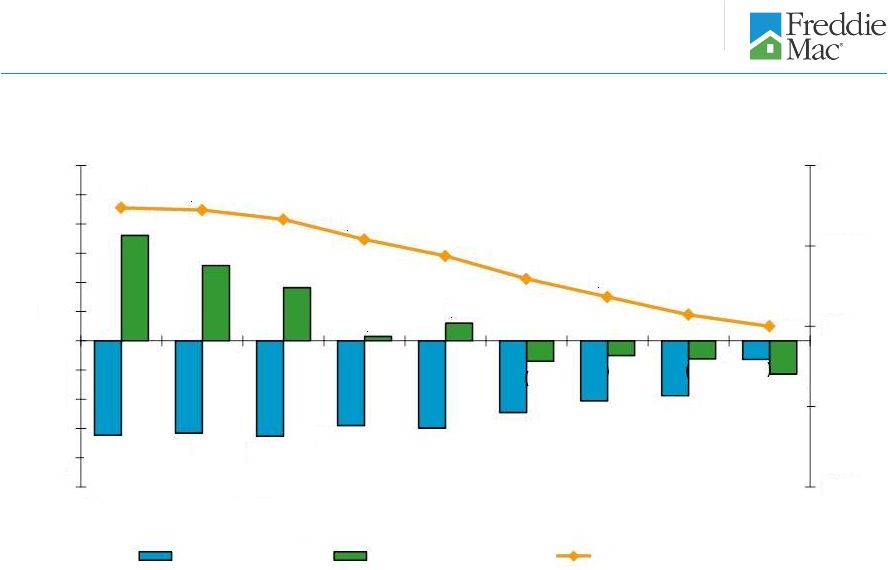 9
Loan loss reserves
1
1
Includes amounts related to certain loans purchased under financial guarantees and
reflected within other expenses on the company’s consolidated statements of comprehensive
income.
2
Consists of the allowance for loan losses and the reserve for guarantee losses.
2
($3.2)
($3.2)
($3.3)
($2.9)
($3.0)
($2.5)
($2.1)
($1.9)
($0.6)
$3.6
$2.6
$1.8
$0.2
$0.6
($0.7)
($0.5)
($0.6)
($1.1)
$39.7
$39.5
$38.3
$35.8
$33.8
$30.9
$28.6
$26.4
$25.0
$5.0
$15.0
$25.0
$35.0
$45.0
($5.0)
($4.0)
($3.0)
($2.0)
($1.0)
$0.0
$1.0
$2.0
$3.0
$4.0
$5.0
$6.0
3Q 2011
4Q 2011
1Q 2012
2Q 2012
3Q 2012
4Q 2012
1Q 2013
2Q 2013
3Q 2013
Period End Balances
$ Billions
$ Billions
Net Charge-offs
Provision (Benefit)
Loan Loss Reserves |
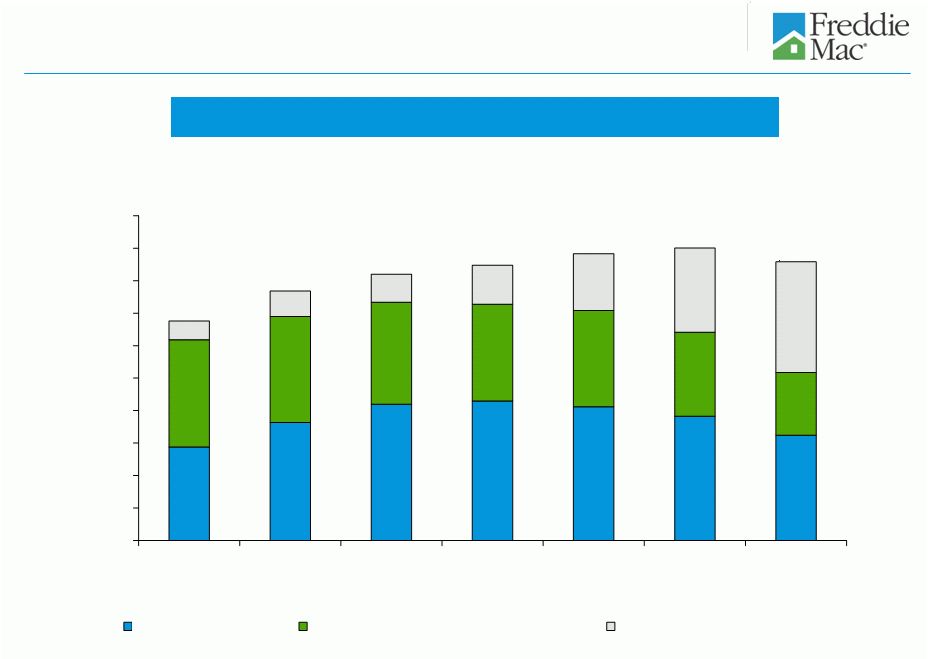
 10
Real
estate
owned
Property Inventory
3Q 2013 Activity
Geographic Distribution
Based on Number of Properties in Inventory
Historical Trend
Ending Property Inventory
1
Includes single-family and multifamily REO. Multifamily ending property
inventory was 5 properties as of June 30, 2013 and 1 property as of September 30, 2013.
2
Region designation: West (AK, AZ, CA, GU, HI, ID, MT, NV, OR, UT, WA); Northeast
(CT, DE, DC, MA, ME, MD, NH, NJ, NY, PA, RI, VT, VA, WV); Southeast (AL, FL, GA, KY, MS,
NC, PR, SC, TN, VI); North Central (IL, IN, IA, MI, MN, ND, OH, SD, WI); and
Southwest (AR, CO, KS, LA, MO, NE, NM, OK, TX, WY).
((Number of Properties)
In 3Q13, REO inventory increased as foreclosure activity increased in judicial
states and disposition activity moderated.
The North Central region comprised 37 percent of our REO property inventory
at September 30, 2013. This region generally has experienced more
challenging
economic
conditions,
and
includes
a
number
of
states
with
longer
foreclosure timelines due to the local laws and foreclosure process in the
region. Seven of the nine states in the North Central region require a
judicial foreclosure process. Foreclosures generally take longer to
complete in states where judicial foreclosures (those conducted under the
supervision of a court) are required than in states where non-judicial
foreclosures are permitted. 44,628
47,120
19,441
(16,949)
6/30/13
Inventory
Acquisitions
Dispositions
9/30/13
Inventory
60k
45k
61k
59k
53k
51k
49k
48k
47k
30,000
40,000
50,000
60,000
70,000
3Q
2011
4Q
2011
1Q
2012
2Q
2012
3Q
2012
4Q
2012
1Q
2013
2Q
2013
3Q
2013
Number of
Properties
6k
12k
18k
5k
5k
7k
13k
17k
4k
5k
0
2,000
4,000
6,000
8,000
10,000
12,000
14,000
16,000
18,000
20,000
Northeast
Southeast
North Central
Southwest
West
Number of
Properties
6/30/2013
9/30/2013
1
2 |
 11
Market liquidity provided
Number of Families Freddie Mac
Helped
to
Own
or
Rent
a
Home
1
In Thousands
Purchase and Issuance Volume
2, 3
(Single-Family and Multifamily)
$ Billions
1
For the periods presented, a borrower may be counted more than once if the company
purchased more than one loan (purchase or refinance mortgage) relating to the same
borrower.
2
Includes cash purchases of single-family and multifamily mortgage loans,
issuances of Freddie Mac mortgage-related securities through the company’s guarantor swap program,
issuances of other guarantee commitments and purchases of non-Freddie Mac
mortgage-related securities. 3
In the first quarter of 2013, Freddie Mac made certain changes to more closely
align the presentation of the company’s single-family and multifamily securitization activities. As a
result, the purchase and issuance volumes for all prior periods have been revised
to conform with the current period presentation. 2,480
2,089
1,830
2,472
2,011
600
755
723
743
545
0
500
1,000
1,500
2,000
2,500
3,000
2009
2010
2011
2012
YTD
2013
3Q
2012
4Q
2012
1Q
2013
2Q
2013
3Q
2013
$546
$406
$349
$456
$382
$110
$140
$138
$138
$106
0
100
200
300
400
500
600
2009
2010
2011
2012
YTD
2013
3Q
2012
4Q
2012
1Q
2013
2Q
2013
3Q
2013
Number
of
Families
Freddie
Mac
Helped
to
Own
or
Rent
a
Home
1
(In Thousands)
Refinance borrowers (includes HARP)
Purchase borrowers
Multifamily rental units
Freddie Mac Purchase and Issuance Volume
2
Cumulative Totals
Since 2009
10,882
$2.1 Trillion
7,492
1,898
1,492 |
 12
Single-family
refinance
activity
1
1
Consists of all single-family refinance mortgage loans that the company either
purchased or guaranteed during the period, including those associated with other guarantee commitments and
Other Guarantee Transactions.
2
Some
loans
have
multiple
borrowers,
but
the
company
has
counted
them
as
one
borrower
for
this
purpose.
For
the
periods
presented,
a
borrower
may
be
counted
more
than
once
if
the
company purchased more than one refinance loan relating to the same borrower.
3
The relief refinance mortgage initiative is Freddie Mac’s implementation of
the Home Affordable Refinance Program (HARP). Under the program, the company allows eligible borrowers who
have mortgages with high current LTV ratios to refinance their mortgages without
obtaining new mortgage insurance in excess of what was already in place. HARP is targeted at borrowers
with current LTV ratios above 80%; however, Freddie Mac’s program also allows
borrowers with LTV ratios at or below 80% to participate. 2009
2010
2011
2012
1Q
2013
2Q
2013
3Q
2013
Cumulative
Total
Number of Borrowers
2
(In
Thousands)
Other Refinance
1,595
947
740
996
343
308
190
5,119
Relief Refinance -
LTV 80%
83
324
268
253
84
89
61
1,162
Relief Refinance -
LTV > 80% to 100% (HARP)
3
72
166
126
191
52
54
38
699
Relief Refinance -
LTV > 100% to 125% (HARP)
3
14
43
59
144
37
36
24
357
Relief Refinance -
LTV > 125% (HARP)
3
0
0
0
99
24
20
12
155
Total Number of Borrowers
1,764
1,480
1,193
1,683
540
507
325
7,492
$
Volume
(In
Billions)
Other Refinance
$345
$200
$168
$228
$78
$68
$42
$1,129
Relief Refinance -
LTV 80%
$15
$58
$42
$36
$11
$12
$9
$183
Relief Refinance -
LTV > 80% to 100% (HARP)
3
$17
$38
$27
$37
$10
$10
$6
$145
Relief Refinance -
LTV > 100% to 125% (HARP)
3
$3
$10
$13
$30
$7
$7
$5
$75
Relief Refinance -
LTV > 125% (HARP)
3
$0
$0
$0
$20
$5
$3
$2
$30
Total $ Volume
$380
$306
$250
$351
$111
$100
$64
$1,562 |
 Repayment plans
13
Loan modifications
Forbearance agreements
Short sales and deed-in-lieu of foreclosure transactions
Single-family loan workouts
Home Retention Actions
1
Foreclosure Alternatives
1
133
275
45
208
43
46
1
These categories are not mutually exclusive and a borrower in one category may also
be included within another category in the same period. For the periods presented,
borrowers helped through home retention actions in each period may subsequently
lose their home through foreclosure or a short sale or deed-in-lieu transaction.
41
169
41
128
Number of Families Avoiding Foreclosure
1
(In Thousands)
Families Retaining Homes
Cumulative Totals Since
2009
913
8 out of every 10
0
30
60
3Q 2012
4Q 2012
1Q 2013
2Q 2013
3Q 2013
Number of Loans
(000)
0
50
100
150
200
250
300
2009
2010
2011
2012
YTD
2013
Number of Loans
(000) |
 No change in terms
Term extension
Reduction of contractual interest rate, and in certain cases,
term extension
Rate reduction, term extension and principal forbearance
2
14
Single-family loan modifications
Single-family Loan Modifications
(HAMP and non-HAMP)
1
65
170
109
21
20
21
70
19
21
60
1
Includes completed loan modifications under HAMP and under the company’s other modification
programs. Excludes those loan modification activities for which the borrower has started
the required process, but the modification has not been made permanent or effective, such as loans in a modification trial
period.
2
Principal forbearance is a change to a loan’s terms to designate a portion of the principal as
non-interest bearing and non-amortizing.
0
10
20
30
3Q 2012
4Q 2012
1Q 2013
2Q 2013
3Q 2013
Number of
Loans
(000)
0
40
80
120
160
200
2009
2010
2011
2012
YTD
2013
Number of
Loans
(000) |
 15
Quarterly Percentages of Modified Single-Family Loans
(HAMP and non-HAMP)
1
Performance of single-family modified loans
1
2
Represents the percentage of loans that are current and performing (no payment is 30 days or more past
due) or have been paid in full. Excludes loans in modification trial periods. Loan modifications are recognized as completed in the quarterly period in which the servicer
has reported the modification as effective and the agreement has been accepted by the company.
For loans that have been remodified (e.g., where a borrower has received a new modification after defaulting on the prior modification) the rates reflect the status of
each modification separately. For example, in the case of a remodified loan where the borrower is
performing, the previous modification would be presented as being in default in the applicable
period.
Time Since Modification
3Q 2011
4Q 2011
1Q 2012
2Q 2012
3Q 2012
4Q 2012
1Q 2013
2Q 2013
3 to 5 months
81%
86%
85%
87%
84%
85%
86%
85%
6 to 8 months
79%
80%
80%
83%
82%
81%
81%
N/A
9 to 11 months
75%
75%
77%
81%
78%
78%
N/A
N/A
12 to 14 months
71%
73%
76%
78%
76%
N/A
N/A
N/A
15 to 17 months
69%
73%
74%
77%
N/A
N/A
N/A
N/A
18 to 20 months
69%
71%
73%
N/A
N/A
N/A
N/A
N/A
21 to 23 months
67%
70%
N/A
N/A
N/A
N/A
N/A
N/A
24 to 26 months
67%
N/A
N/A
N/A
N/A
N/A
N/A
N/A
% Current and Performing
Quarter
of
Loan
Modification
Completion
2 |
 16
1
The amount the company expects to collect on outstanding requests is significantly
less than the unpaid principal balance (UPB) of the loans subject to repurchase requests primarily
because many of these requests are likely to be satisfied by reimbursement of the
company’s realized credit losses by seller/servicers, or rescinded in the course of the contractual appeals
process. Based on historical loss experience and the fact that many of these
loans are covered by credit enhancements (e.g., mortgage insurance), Freddie Mac expects the actual credit
losses experienced by the company should it fail to collect on these repurchase
requests to also be less than the UPB of the loans. 2
Approximately $0.6 billion of the total amount of repurchase requests outstanding
at September 30, 2013 were issued due to mortgage insurance rescission or mortgage insurance claim
denial.
3
Repurchase requests outstanding more than four months include repurchase requests
for which appeals were pending. 4
Requests collected are based on the UPB of the loans associated with the repurchase
request, which in many cases is more than the amount of payments received for reimbursement of
losses for requests associated with foreclosed mortgage loans, negotiated
settlements and other alternative remedies. Includes $0.9 billion in the nine months ended September 30, 2013
related to agreements with certain seller/servicers to release specified loans with
certain repurchase obligations in exchange for one-time cash payments.
5
Year-to-date September 30, 2013, repurchase requests related to $4.4
billion of UPB of loans were cancelled, primarily as a result of the servicer providing missing documentation or a
successful appeal of the request. In addition, requests cancelled includes
$0.2 billion of other items that affect the UPB of the loan while the repurchase request is outstanding, such as a
change in UPB due to payments made on the loan, as well as requests deemed
uncollectible due to the insolvency or other failure of the counterparty.
Repurchase requests
Trend in Repurchase Requests Outstanding
YTD September 2013 Repurchase Request Activity
$ Billions
2
3
5
4
$3.6
$4.2
$3.8
$2.7
$3.0
$3.4
20%
20%
34%
39%
41%
31%
0
5
10
15
20
25
30
35
40
45
50
0
1
2
3
4
5
6
12/31/2008
12/31/2009
12/31/2010
12/31/2011
12/31/2012
Percent
(%)
UPB
$ Billions
Outstanding repurchase requests
Requests outstanding more than 4 months
$3.0
$3.4
$8.3
($3.4)
($4.6)
UPB of
outstanding
requests at
12/31/2012
New Requests
Issued
Requests
Collected
Requests
Cancelled
UPB of
outstanding
requests at
9/30/2013
9/30/2013
1 |
 17
Administrative expenses
Annual
Quarterly
$1,685
$1,597
$1,506
$1,561
$1,331
400
600
800
1,000
1,200
1,400
1,600
1,800
2,000
2009
2010
2011
2012
YTD
2013
$ Millions
$401
$422
$432
$444
$455
0
200
400
600
3Q
2012
4Q
2012
1Q
2013
2Q
2013
3Q
2013
$ Millions |
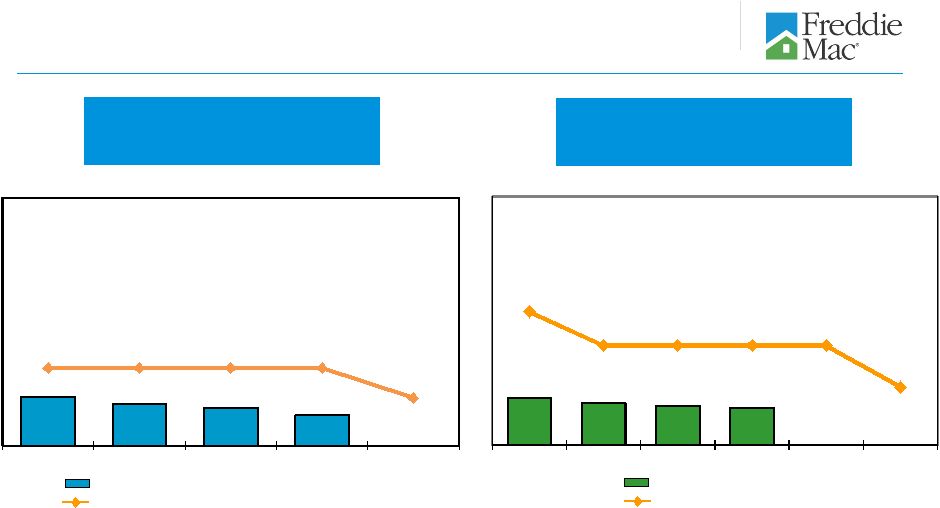 Mortgage-related investments portfolio ending balance
Mortgage-related investments portfolio limit
18
Purchase Agreement portfolio limits
Indebtedness
1, 3
($ Billions)
Mortgage Assets
1, 2
($ Billions)
1
The
company’s
Purchase
Agreement
with
Treasury
limits
the
amount
of
mortgage
assets
the
company
can
own
and
indebtedness
it
can
incur.
Under
the Purchase Agreement,
mortgage assets and indebtedness are calculated without giving effect to the
January 1, 2010 change in the accounting guidance related to the transfer of financial assets and
consolidation of variable interest entities (VIEs). See the company’s
Quarterly Report on Form 10-Q for the quarter ended September 30, 2013 for more information.
2
Represents the unpaid principal balance (UPB) of the company’s
mortgage-related investments portfolio. The company discloses its mortgage assets on this basis monthly in its
Monthly Volume Summary reports, which are available on its Web site and in Current
Reports on Form 8-K filed with the Securities and Exchange Commission (SEC).
3
Represents the par value of the company’s unsecured short-term and
long-term debt securities issued to third parties to fund its business activities. The company discloses its
indebtedness on
this
basis
monthly
in
its
Monthly
Volume
Summary
reports,
which
are
available
on
its
Web
site
and
in
Current
Reports
on
Form
8-K
filed
with
the
SEC.
4
Limit under the Purchase Agreement, as amended on August 17, 2012.
Indebtedness limit
Total debt outstanding
4
4
4
4
$558
$534
$521
$498
$650
$650
$650
$650
$553
12/31/2012
3/31/2013
6/30/2013
9/30/2013
12/31/2013
$552
$535
$526
$520
$874.8
$780
$780
$780
$780
$663
12/31/2012
3/31/2013
6/30/2013
9/30/2013
12/31/2013
1/1/2014 |
 19
Credit
Supplement |
 1
Source: Freddie Mac.
20
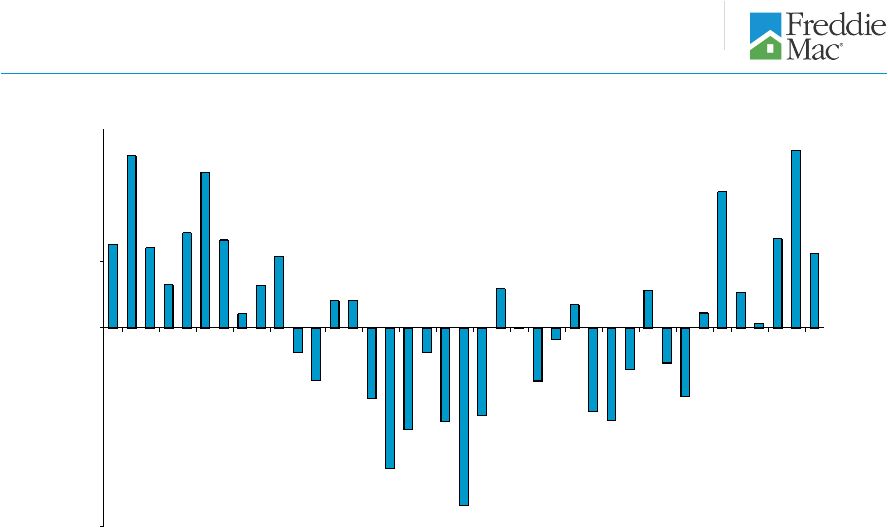
National home prices have experienced a cumulative
decline of 14% since June 2006
1
2.5
5.2
2.4
1.3
2.9
4.7
2.7
0.4
1.3
2.2
(0.8)
(1.6)
0.8
0.8
(2.1)
(4.3)
(3.1)
(0.7)
(2.8)
(5.4)
(2.6)
1.2
(0.0)
(1.6)
(0.4)
0.7
(2.5)
(2.8)
(1.2)
1.1
(1.1)
(2.1)
0.4
4.1
1.1
0.1
2.7
5.4
2.2
(6)
(4)
(2)
0
2
4
6
1Q
2004
3Q
2004
1Q
2005
3Q
2005
1Q
2006
3Q
2006
1Q
2007
3Q
2007
1Q
2008
3Q
2008
1Q
2009
3Q
2009
1Q
2010
3Q
2010
1Q
2011
3Q
2011
1Q
2012
3Q
2012
1Q
2013
3Q
2013
Percent
(%)
National home prices use the Freddie Mac House Price Index for the U.S., which is a
value-weighted average of the state indexes where the value weights are based on Freddie
Mac’s single-family credit guarantee portfolio. Other indices of home prices may have
different results, as they are determined using different pools of mortgage loans and
calculated under different conventions than Freddie Mac’s. The Freddie Mac House Price
Index for the U.S. is a non-seasonally adjusted monthly series; quarterly growth rates are
calculated as a 3-month change based on the final month of each quarter. Seasonal factors
typically result in stronger house-price appreciation during the second and third
quarters. Historical quarterly growth rates change as new data becomes available. Values for the
most recent periods typically see the largest changes. Cumulative decline calculated as
the percent change from June 2006 to September 2013.
-
-
-
- |
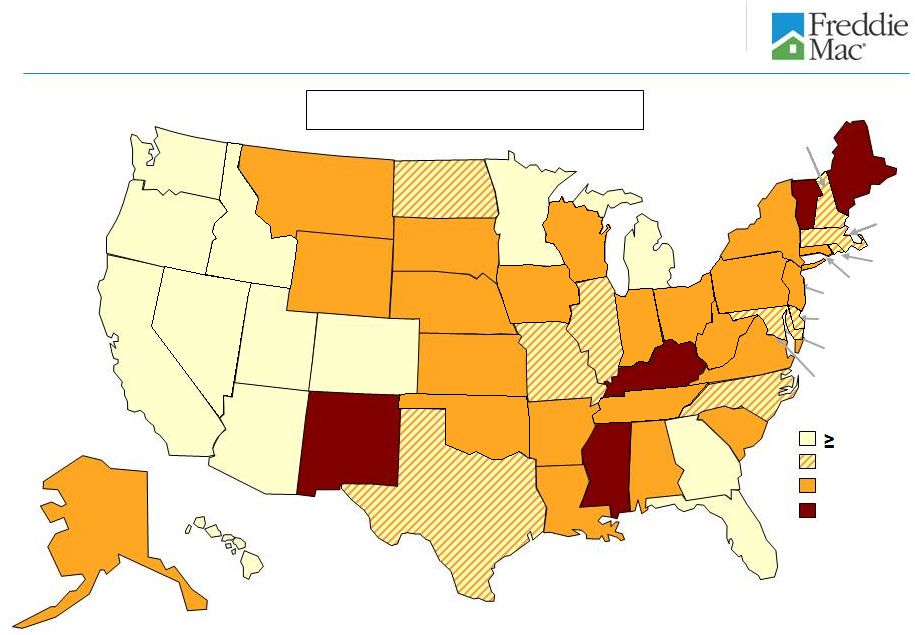
 Home
Price Performance By State June
2006
to
September
2013
1
United States -14%
1
Source: Freddie Mac
21
-7%
AL
8%
AK
0%
-11 to -1%
-21%
-20 to -12%
-2%
AR
-29%
AZ
-23%
CA
6%
CO
CT -18%
DC 23%
DE -14%
-36%
FL
-16%
GA
0%
HI
3%
IA
-11%
ID
-22%
IL
-2%
IN
2%
KS
KY -1%
3%
LA
-11%
-20%
-10%
ME
-20%
MI
-13%
MN
-10%
MO
-6%
MS
2%
MT
NC -4%
38%
ND
3%
NE
-11%
NM
-42%
NV
-9%
NY
-12%
OH
8%
OK
-12%
OR
-6%
PA
RI -25%
-7%
SC
11%
SD
TN -2%
15%
TX
0%
UT
-12%
VA
-3%
VT
-13%
WA
-12%
WI
5%
WV
9%
WY
NH
MA
MD
NJ -21%
The Freddie Mac House Price Index for the U.S. is a value-weighted average of the state indexes
where the value weights are based on Freddie Mac’s single-family credit guarantee
portfolio. Other indices of home prices may have different results, as they are determined using different pools of mortgage loans and calculated under different
conventions. The Freddie Mac House Price Index for the U.S. is a non-seasonally adjusted monthly
series. -17% |
 5%
AL
5%
AK
10%
7 to 9%
0 to 3%
4 to 6%
4%
AR
17%
AZ
23%
CA
11%
CO
CT 4%
DC 13%
DE 7%
14%
FL
14%
GA
13%
HI
5%
IA
14%
ID
9%
IL
5%
IN
5%
KS
KY 3%
5%
LA
7%
3%
ME
14%
MI
11%
MN
7%
MO
3%
MS
6%
MT
NC 7%
8%
ND
5%
NE
NJ 4%
2%
NM
30%
NV
4%
NY
5%
OH
4%
OK
14%
OR
4%
PA
RI 8%
6%
SC
6%
SD
TN 6%
9%
TX
13%
UT
6%
VA
12%
WA
6%
WI
6%
WV
6%
WY
8%
2%
VT
8%
MD
MA
NH
Home Price Performance By State
September 2012 to September 2013
1
United States 11%
1
The Freddie Mac House Price Index for the U.S. is a value-weighted average of
the state indexes where the value weights are based on Freddie Mac’s single-family credit
guarantee portfolio. Other indices of home prices may have different results, as
they are determined using different pools of mortgage loans and calculated under different
conventions.
The
Freddie
Mac
House
Price
Index
for
the
U.S.
is
a
non-seasonally
adjusted
monthly
series.
Source: Freddie Mac
22 |
 23
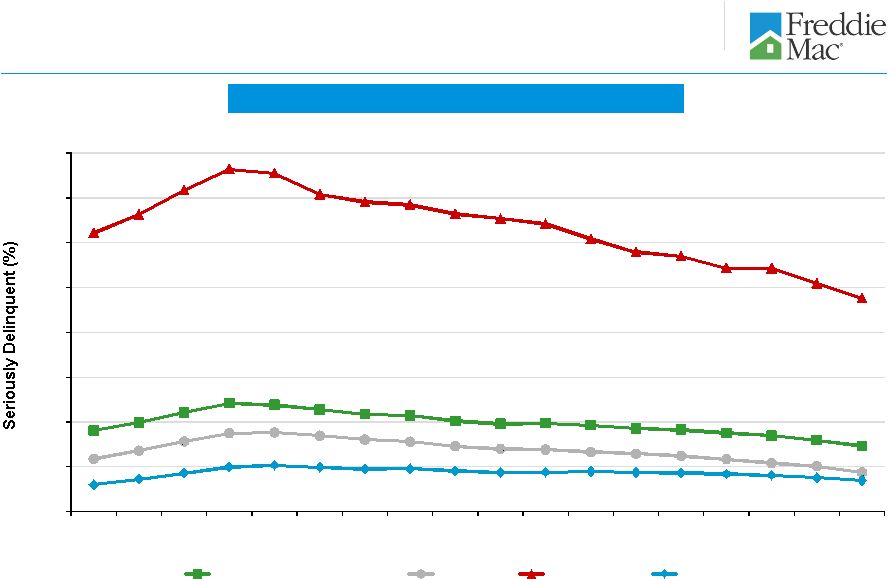
Single-family Serious Delinquency Rates
Mortgage market and Freddie Mac serious delinquency
rates
0
4
8
12
16
20
24
28
32
Mar-
09
Jun-
09
Sep-
09
Dec-
09
Mar-
10
Jun-
10
Sep-
10
Dec-
10
Mar-
11
Jun-
11
Sep-
11
Dec-
11
Mar-
12
Jun-
12
Sep-
12
Dec-
12
Mar-
13
Jun-
13
Total Mortgage Market
Prime
Subprime
Freddie Mac
19.05%
5.88%
2.79%
3.50%
1
1
1
2
Source: National Delinquency Survey from the Mortgage Bankers Association. Categories represent
first lien single-family loans. Data is not yet available for the third quarter of 2013.
See “MD&A – RISK MANAGEMENT – Credit Risk – Mortgage Credit Risk –
Single-Family Mortgage Credit Risk – Credit Performance – Delinquencies” in Freddie Mac’s Form 10-K for
the year ended December 31, 2012, for information about the company’s reported delinquency
rates. The single-family serious delinquency rate at September 30, 2013 was 2.58%.
1
2 |
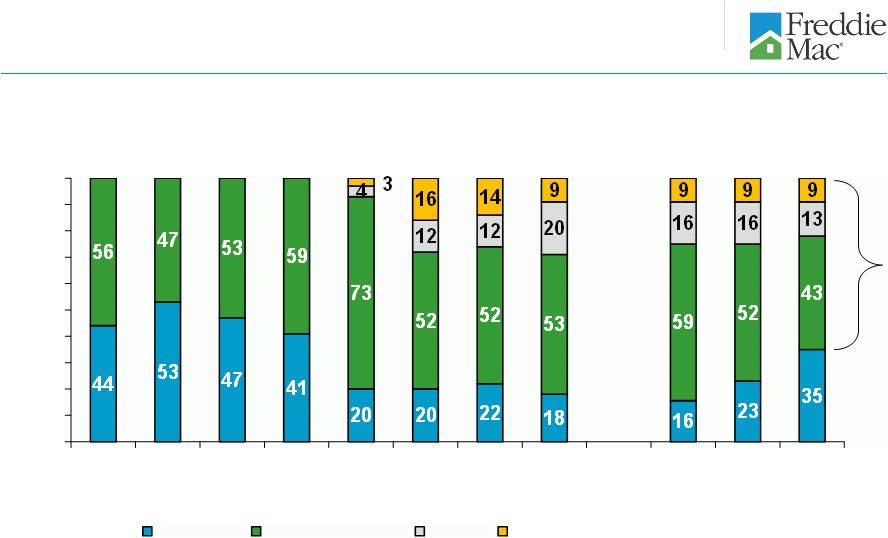 24
Loan purpose of single-family credit guarantee
portfolio purchases
1
The relief refinance mortgage initiative is Freddie Mac’s implementation of
the Home Affordable Refinance Program (HARP). Under the program, the company allows eligible
borrowers who have mortgages with high current LTV ratios to refinance their
mortgages without obtaining new mortgage insurance in excess of what was already in place. HARP is
targeted at borrowers with current LTV ratios above 80%; however, Freddie
Mac’s relief refinance initiative also allows borrowers with LTV ratios at or below 80% to participate.
1
1
0
10
20
30
40
50
60
70
80
90
100
2005
2006
2007
2008
2009
2010
2011
2012
1Q
2013
2Q
2013
3Q
2013
Percent
(%)
Purchase
Other Refinance
HARP
Relief Refinance (Non-HARP)
65% |
 25
Credit quality of single-family credit guarantee
portfolio purchases
2009
2010
2011
2012
1Q
2013
2Q
2013
3Q
2013
Weighted Average Original LTV Ratio
1
Relief refinance (includes HARP)
80%
77%
77%
97%
93%
91%
89%
All other
66%
67%
67%
68%
68%
70%
72%
Total purchases
67%
70%
70%
76%
74%
75%
76%
Weighted Average Credit Score
2
Relief refinance (includes HARP)
738
747
744
740
731
729
723
All other
757
758
759
762
760
757
754
Total purchases
756
755
755
756
753
750
747
2009
2010
2011
2012
1Q
2013
2Q
2013
3Q
2013
Purchase of Relief Refinance Mortgages > 80% LTV (HARP loans)
$ Billions
$19.6
$47.9
$39.7
$86.9
$21.5
$20.3
$13.2
% of single-family credit guarantee portfolio purchases
4%
12%
12%
20%
16%
16%
13%
3
1
2
3
Original LTV ratios are calculated as the unpaid principal balance (UPB) of the mortgage Freddie Mac
guarantees including the credit-enhanced portion, divided by the lesser of the appraised
value of the property at the time of mortgage origination or the mortgage borrower’s purchase price. Second liens not owned or guaranteed by Freddie Mac are excluded
from the LTV ratio calculation. The existence of a second lien mortgage reduces the
borrower’s equity in the home and, therefore, can increase the risk of default.
Credit score data is based on FICO scores at the time of origination and may not be indicative of the
borrowers’ creditworthiness at September 30, 2013. FICO scores can range between
approximately 300 to 850 points. HARP is the portion of the company’s relief refinance initiative targeted at borrowers with
current LTV ratios above 80%. In April 2013, HARP was extended to December 31, 2015.
|
 26
Single-family 3Q 2013 credit losses and REO
by region and state
1
Based on the unpaid principal balance (UPB) of the single-family credit
guarantee portfolio at September 30, 2013. 2
UPB amounts exclude $435 million of Other Guarantee Transactions since these
securities are backed by non-Freddie Mac issued securities for which loan characteristic data
was not available.
3
Based on the number of loans that are three monthly payments or more past due or in
the process of foreclosure. 4
Based
on
the
UPB
of
loans
at
the
time
of
REO
acquisition.
5
Consist
of
the
aggregate
amount
of
charge-offs,
net
of
recoveries,
and
REO
operations
(income)
expense
for
3Q
2013.
6
Region designation: West (AK, AZ, CA, GU, HI, ID, MT, NV, OR, UT, WA); Northeast
(CT, DE, DC, MA, ME, MD, NH, NJ, NY, PA, RI, VT, VA, WV); Southeast (AL, FL, GA, KY, MS,
NC, PR, SC, TN, VI); North Central (IL, IN, IA, MI, MN, ND, OH, SD, WI); and
Southwest (AR, CO, KS, LA, MO, NE, NM, OK, TX, WY). 7
States presented are those with the highest credit losses during the three months
ended September 30, 2013. ($ Billions)
% of Total
UPB
2
($ Millions)
% of Total
Serious
Delinquency
Rate
3
(%)
3Q 2013
Acquisitions
($ Millions)
REO
Inventory
($ Millions)
% of Total
Inventory
($ Millions)
% of Total
Region
6
1
West
$462
28%
$9,991
21%
1.94%
$458
$1,030
14%
($21)
(4%)
2
Northeast
430
26
16,641
35
3.39%
588
1,323
18
136
24
3
North Central
292
18
6,149
13
1.93%
687
2,320
32
168
30
4
Southeast
274
17
11,906
25
3.78%
990
2,025
28
285
51
5
Southwest
194
11
2,616
6
1.44%
201
558
8
(4)
(1)
6
Total
$1,652
100%
$47,303
100%
2.58%
$2,924
$7,256
100%
$564
100%
7
7
Florida
$93
6%
$8,252
18%
7.26%
$618
$1,239
17%
246
44%
8
Illinois
83
5
2,975
6
3.05%
290
907
12
131
23
9
Washington
55
3
1,628
3
2.68%
97
213
3
29
5
10
Maryland
51
3
1,871
4
3.48%
206
409
6
70
12
11
Ohio
47
3
932
2
2.16%
101
295
4
38
7
12
All other
1,323
80
31,645
67
2.17%
1,612
4,193
58
50
9
13
Total
$1,652
100%
$47,303
100%
2.58%
$2,924
$7,256
100%
$564
100%
Total Portfolio UPB
Credit
Losses
(Gains)
5
REO Acquisitions & Balance
4
Seriously Delinquent Loans
1
State |
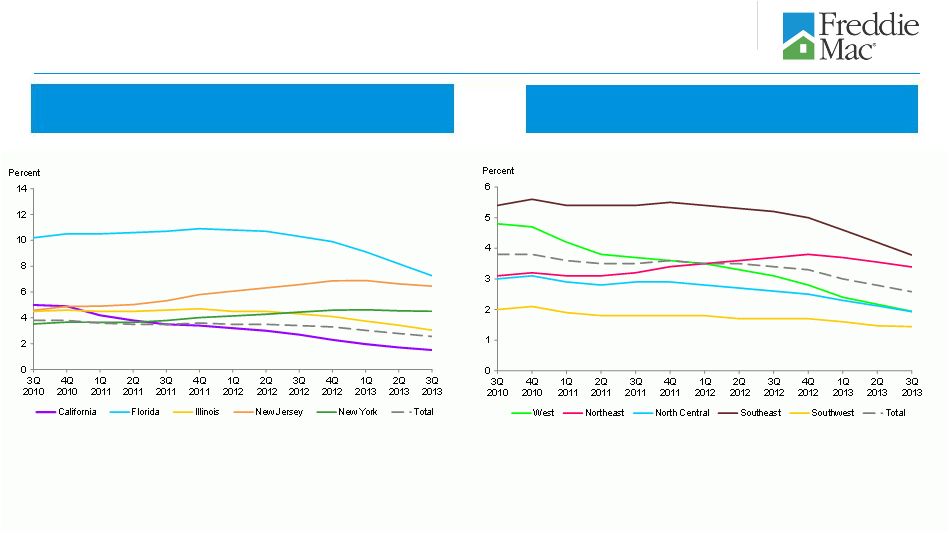 1.5%
Single-family serious delinquency rates by state and
region
27
Single-family Serious Delinquency Rates
By State
1,2
Single-family Serious Delinquency Rates
By Region
1,3
2
States presented are those with the highest number of seriously delinquent loans as
of September 30, 2013. 3
Region designation: West (AK, AZ, CA, GU, HI, ID, MT, NV, OR, UT, WA); Northeast
(CT, DE, DC, MA, ME, MD, NH, NJ, NY, PA, RI, VT, VA, WV); Southeast
(AL,
FL,
GA,
KY,
MS,
NC,
PR,
SC,
TN,
VI);
North
Central
(IL,
IN,
IA,
MI,
MN,
ND,
OH,
SD,
WI);
and
Southwest
(AR,
CO,
KS,
LA,
MO,
NE,
NM,
OK,
TX,
WY).
1.4%
1.9%
1.9%
2.6%
3.4%
3.8%
7.3%
6.5%
2.6%
3.1%
4.5%
1
Based on the number of loans that are three monthly payments or more past due or in the process
of foreclosure. See “MD&A – RISK MANAGEMENT – Credit Risk – Mortgage
Credit Risk – Single-Family Mortgage Credit Risk – Credit Performance – Delinquencies” in Freddie Mac’s Form 10-K for the year ended
December 31, 2012, for information about the company’s reported delinquency rates. |
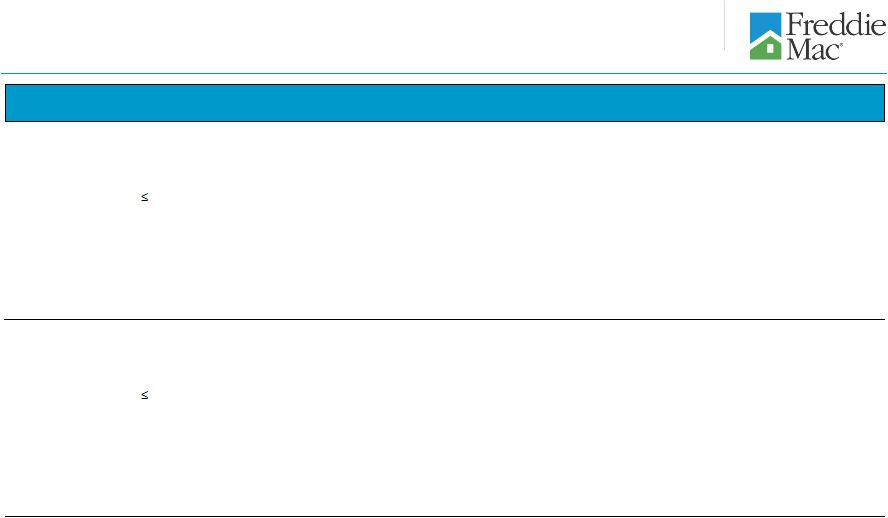
 Aging
of single-family seriously delinquent loans by judicial and
non-judicial states 28
1
# of Seriously
Delinquent
Loans
Percent
# of Seriously
Delinquent
Loans
Percent
# of Seriously
Delinquent
Loans
Percent
Judicial
Review
States
Less than or equal to 1 year
82,458
22%
64,772
22%
60,943
22%
More than 1 year and less than or equal to 2 years
54,525
15%
39,054
13%
33,756
12%
More than 2 years
77,122
21%
71,789
24%
67,306
25%
Non-Judicial States
1
Less than or equal to 1 year
94,059
26%
72,185
24%
66,405
25%
More than 1 year and less than or equal to 2 years
33,838
9%
25,360
9%
22,063
8%
More than 2 years
24,158
7%
24,133
8%
22,998
8%
Combined
Less than or equal to 1 year
176,517
48%
136,957
46%
127,348
47%
More than 1 year and less than or equal to 2 years
88,363
24%
64,414
22%
55,819
20%
More than 2 years
101,280
28%
95,922
32%
90,304
33%
Total
366,160
100%
297,293
100%
273,471
100%
As of 9/30/2012
2
As of 6/30/2013
As of 9/30/2013
1
1
2
Excludes loans underlying single-family Other Guarantee Transactions since the geographic
information is not available to us for these loans. As of September 30, 2013, the states
and territories classified as having a judicial foreclosure process consist of: CT, DE, FL, HI, IA, IL, IN, KS, KY, LA, ME, ND, NE,
NJ, NM, NY, OH, OK, PA, PR, SC, SD, VI, VT and WI. All other states are classified as having a
non-judicial foreclosure process. Judicial foreclosures are those conducted under the
supervision of a court. Prior periods revised to reflect changes made in second quarter 2013 to
states and territories classified as having a judicial foreclosure process. |
 29
Single-family
credit
guarantee
portfolio
characteristics
1
Option
FICO
FICO
Original
LTV
FICO < 620 &
Original
Attribute
Alt-A²
Interest-only
3
ARM
< 620
4
620 -
659
4
> 90%
LTV > 90%
4
1
UPB $ Billions
$1,652
$60
$37
$7
$49
$97
$252
$13
2
Percent of Total Portfolio
100%
4%
2%
0%
3%
6%
15%
1%
3
Average UPB per loan
$154,101
$154,152
$226,775
$200,975
$126,148
$132,680
$169,261
$135,900
4
Fixed Rate (% of total portfolio)
94%
63%
19%
0%
95%
93%
98%
98%
5
Owner Occupied
90%
82%
81%
76%
95%
94%
91%
96%
6
Original Loan-to-Value (OLTV)
74%
73%
74%
71%
81%
80%
107%
106%
7
OLTV > 90%
15%
4%
3%
2%
26%
23%
100%
100%
8
Current Loan-to-Value (CLTV)
70%
89%
95%
89%
84%
81%
100%
103%
9
CLTV > 90%
18%
48%
56%
45%
38%
34%
64%
69%
10
CLTV > 100%
11%
35%
40%
32%
26%
23%
38%
50%
11
CLTV > 110%
7%
24%
26%
22%
18%
15%
24%
34%
12
Average FICO Score
4
739
711
718
711
585
643
725
583
13
FICO < 620
4
3%
5%
3%
4%
100%
0%
5%
100%
Book Year
5
14
2013
18%
0%
0%
0%
9%
10%
21%
14%
15
2012
24%
0%
0%
0%
10%
10%
34%
22%
16
2011
11%
0%
0%
0%
5%
5%
11%
7%
17
2010
11%
0%
1%
0%
5%
6%
10%
6%
18
2009
9%
0%
1%
0%
4%
5%
5%
4%
19
2008
3%
7%
9%
0%
6%
6%
2%
3%
20
2007
5%
30%
35%
2%
19%
15%
6%
17%
21
2006
4%
27%
28%
11%
11%
11%
2%
6%
22
2005
5%
20%
21%
58%
9%
11%
2%
4%
23
2004 and prior
10%
16%
5%
29%
22%
21%
7%
17%
24
% of Loans with Credit Enhancement
13%
12%
9%
15%
23%
20%
49%
55%
25
% Seriously Delinquent
6
2.58%
10.74%
13.49%
13.25%
10.41%
7.56%
3.45%
10.12%
Total Portfolio
as of
September 30, 2013
Note: Individual categories are not mutually exclusive, and therefore are not additive across columns. 1
Portfolio characteristics are based on the unpaid principal balance (UPB) of the single-family
credit guarantee portfolio. Approximately $1 billion in UPB for Other Guarantee
Transactions is included in total UPB and percentage seriously delinquent but not included in the
calculation of other statistics since these securities are backed by non-Freddie Mac issued
securities for which loan characteristic data was not available.
2
For a description of Alt-A, see the “Glossary” in the company’s Quarterly Report on
Form 10-Q for the quarter ended September 30, 2013.
3
Beginning September 1, 2010, the company fully discontinued purchases of interest-only loans.
4
Represents the FICO score of the borrower at loan origination. The company estimates that less
than 1% of loans within the portfolio are missing origination FICO scores and as such are
excluded.
5
Indicates year of loan origination. Calculated based on the loans remaining in the portfolio as of
September 30, 2013, rather than all loans originally guaranteed by the company and originated
in the respective year. Each Book Year category represents the percentage of loans referenced in line 1 of the same vertical column.
6
Based on the number of loans that are three monthly payments or more past due or in the process of
foreclosure. |
 30
Single-family credit profile by book year and product
feature
1
Attribute
2013
2012
2011
2010
2009
2008
2007
2006
2005
2004 and
prior
1
UPB $ Billions
$1,652
$296
$388
$183
$185
$148
$54
$89
$67
$76
$166
2
Original Loan-to-Value (OLTV)
74%
75%
78%
72%
72%
71%
74%
77%
75%
73%
72%
3
OLTV > 90%
15%
18%
22%
15%
14%
9%
10%
16%
9%
7%
11%
4
Current Loan-to-Value (CLTV)
70%
74%
70%
63%
64%
65%
81%
97%
94%
80%
51%
5
CLTV > 100%
11%
9%
9%
3%
3%
3%
18%
42%
38%
20%
3%
6
CLTV > 110%
7%
6%
6%
1%
1%
1%
9%
29%
26%
13%
2%
7
Average FICO Score
3
739
749
754
751
750
748
715
696
702
709
712
8
FICO < 620
3
3%
1%
1%
1%
1%
1%
5%
11%
8%
6%
7%
9
Adjustable-rate
6%
4%
4%
6%
3%
1%
7%
11%
18%
21%
11%
10
Interest-only
4
2%
0%
0%
0%
0%
0%
7%
15%
16%
10%
1%
11
Investor
6%
8%
6%
5%
4%
3%
8%
7%
6%
5%
5%
12
Condo
8%
8%
6%
6%
6%
7%
11%
11%
12%
11%
8%
Geography
5
13
Florida
6%
5%
5%
4%
4%
4%
8%
10%
12%
11%
8%
14
Illinois
5%
5%
5%
5%
6%
5%
5%
4%
5%
5%
5%
15
Maryland
3%
3%
3%
3%
3%
3%
3%
4%
3%
3%
2%
16
Ohio
3%
3%
3%
3%
3%
3%
1%
2%
2%
3%
4%
17
Washington
3%
3%
3%
4%
4%
4%
4%
3%
3%
3%
2%
18
All other
80%
81%
81%
81%
80%
81%
79%
77%
75%
75%
79%
19
% of Loans with Credit Enhancement
13%
16%
13%
10%
8%
8%
24%
25%
14%
12%
11%
20
% Seriously Delinquent
6
2.58%
0.02%
0.15%
0.37%
0.63%
1.05%
7.05%
11.73%
10.61%
6.86%
3.29%
Total Portfolio
as of
September 30, 2013
Book Year
2
1
Portfolio characteristics are based on the unpaid principal balance (UPB) of the single-family
credit guarantee portfolio. Approximately $1 billion in UPB for Other Guarantee Transactions is
included in total UPB and percentage seriously delinquent but not included in the calculation of other
statistics since these securities are backed by non-Freddie Mac issued securities for which
loan characteristic data was not available.
2
Indicates year of loan origination. Calculated based on the loans remaining in the portfolio as of
September 30, 2013, rather than all loans originally guaranteed by the company and originated
in the respective year.
3
Represents the average of the borrowers’ FICO scores at origination. The company estimates
that less than 1% of loans within the portfolio are missing FICO scores and as such are
excluded.
4
Beginning September 1, 2010, the company fully discontinued purchases of interest-only loans.
5
States presented are those with the highest percentage of the company’s single-family credit
losses during the three months ended September 30, 2013.
6
Based on the number of loans that are three monthly payments or more past due or in the process of
foreclosure. |
 31
Single-family cumulative foreclosure transfer and
short sale rates
1
by book year
2007
2006
2005
2004
2003
2008
2009
2010
2011
2013
1
Rates are calculated for each year of origination as the number of loans that have proceeded to
foreclosure transfer or short sale and resulted in a credit loss, excluding any subsequent
recoveries, divided by the number of loans originated in that year that were acquired in the company’s single-family credit guarantee portfolio. Includes Other Guarantee
Transactions where loan characteristic data is available.
0.00%
1.00%
2.00%
3.00%
4.00%
5.00%
6.00%
7.00%
8.00%
9.00%
10.00%
11.00%
12.00%
Yr1
Q1
Yr1
Q3
Yr2
Q1
Yr2
Q3
Yr3
Q1
Yr3
Q3
Yr4
Q1
Yr4
Q3
Yr5
Q1
Yr5
Q3
Yr6
Q1
Yr6
Q3
Yr7
Q1
Yr7
Q3
Yr8
Q1
Yr8
Q3
Yr9
Q1
Yr9
Q3
Yr10
Q1
Yr10
Q3
Yr11
Q1
Yr11
Q3
Quarter Post Origination
2003
2004
2005
2006
2007
2008
2009
2010
2011
2012
2013
2012 |
 32
Total Multifamily (MF) Portfolio
Multifamily portfolio composition
$172
$135
$154
$164
$169
$177
$180
0
20
40
60
80
100
120
140
160
180
200
12/31/2007
12/31/2008
12/31/2009
12/31/2010
12/31/2011
12/31/2012
9/30/2013
MF loan portfolio
MF investment securities portfolio
MF guarantee portfolio
UPB
$ Billions |
 Multifamily
new
business
volume
by
state
1
(%)
AL
0.8%
AK
0.0%
> 5%
> 3% -
5%
1%
> 1% -
3%
MF New Business Volume $18.8B
Nine Months Ended September 30, 2013
AR
0.1%
AZ
3.4%
CA
15.6%
CO
2.8%
CT
0.7%
DC
0.2%
DE
0.4%
FL
9.7%
GA
5.3%
HI
<0.1%
IA
0.2%
ID
0.1%
IL
2.6%
IN
0.6%
KS
0.3%
KY
0.3%
LA
0.1%
MD
3.1%
ME
<0.1%
MI
1.5%
MN
0.5%
MO
0.8%
MS
0.1%
MT
0.0%
NC
2.5%
ND
<0.1%
NE
0.4%
NJ
5.6%
NM
0.1%
NV
0.8%
NY
8.0%
OH
1.5%
OK
0.3%
OR
1.3%
PA
3.7%
RI
0.4%
SC
0.3%
SD
0.0%
TN
0.5%
TX
13.0%
UT
1.1%
VA
6.7%
VT
0.0%
WA
3.0%
WI
0.4%
WV
0.0%
WY
<0.1%
NH
0.1%
33
MA 0.9%
1
Based on the unpaid principal balance (UPB) of the multifamily loan purchases and issuance of
other guarantee commitments. Percentages shown above are rounded to the nearest tenth of
a percent although classifications are based on unrounded figures. |
 Multifamily mortgage portfolio UPB concentration by
state
1
MF Mortgage Portfolio $132.1B
2
As of September 30, 2013
34
1
Based on the unpaid principal balance (UPB) of unsecuritized mortgage loans, other
guarantee commitments, and collateral underlying both Freddie Mac guaranteed mortgage-
related securities and related unguaranteed K Certificates. Percentages shown above
are rounded to the nearest tenth of a percent although classifications are based on unrounded
figures.
2
Consists of the UPB of unsecuritized multifamily loans, other guarantee
commitments, and guaranteed Freddie Mac mortgage-related securities. Excludes the UPB associated with
unguaranteed K Certificates.
AL
0.9%
AK
0.0%
AR
0.3%
AZ
2.4%
CA
16.4%
CO
3.0%
CT
0.9%
DC
0.7%
DE
0.2%
FL
7.1%
GA
4.6%
HI
0.2%
IA
0.2%
ID
0.1%
IL
2.5%
IN
0.6%
KS
0.8%
KY
0.5%
LA
0.7%
MA 1.9%
ME
<0.1%
MI
1.0%
MN
1.2%
MO
1.1%
MS
0.4%
MT
<0.1%
NC
2.8%
ND
0.1%
NE
0.5%
NJ
2.8%
NM
0.3%
NV
1.1%
NY
8.5%
OH
1.9%
OK
0.5%
OR
0.8%
PA
2.5%
RI
0.2%
SC
1.0%
SD
0.1%
TN
1.3%
TX
12.5%
UT
0.6%
VA
5.4%
VT
0.0%
WA
3.3%
WI
0.6%
WV
0.1%
WY
<0.1%
NH
0.2%
5%
2% -
5%
1%
1%
-
2% |
 35
Multifamily
mortgage
portfolio
by
attribute
1
1
Based
on
the
unpaid
principal
balance
(UPB)
of
the
multifamily
mortgage
portfolio.
2
Based
on
the
UPB
of
mortgages
two
monthly
payments
or
more
past
due
or
in
the
process
of
foreclosure.
3
4
Presents the six states with the highest UPB at September 30, 2013.
Year of Acquisition or Guarantee
3
1
2004 and prior
$10.4
0.26%
$7.6
0.06%
$6.5
0.03%
2
2005
6.7
0.56
6.0
-
5.8
-
3
2006
10.1
0.27
9.2
-
8.9
-
4
2007
19.3
0.96
16.1
0.53
15.8
0.29
5
2008
18.0
0.34
15.0
0.11
14.1
0.15
6
2009
12.8
-
11.8
-
11.5
-
7
2010
12.2
-
11.5
0.08
11.4
-
8
2011
17.4
-
16.6
-
16.4
-
9
2012
18.3
-
24.5
-
24.1
-
10
2013
N/A
N/A
13.5
-
17.6
-
Total
$125.2
0.27%
$131.8
0.09%
$132.1
0.05%
Maturity Dates
11
2013
$5.1
0.50%
$1.1
1.02%
$0.5
1.73%
12
2014
6.9
0.69
4.3
-
3.4
-
13
2015
10.3
0.19
8.7
-
7.8
-
14
2016
13.6
0.01
12.4
-
11.9
0.04
15
2017
10.7
0.38
10.5
0.45
10.4
0.17
16
Beyond 2017
78.6
0.26
94.8
0.06
98.1
0.04
Total
$125.2
0.27%
$131.8
0.09%
$132.1
0.05%
Geography
4
17
California
$21.3
0.24%
$21.5
0.04%
$21.9
-%
18
Texas
15.5
0.46
16.2
0.13
16.3
0.04
19
New York
10.2
0.09
11.3
0.09
11.3
0.09
20
Florida
8.2
0.04
9.2
-
9.3
-
21
Virginia
6.5
-
7.1
0.35
7.1
-
22
Maryland
6.5
-
6.8
-
6.8
-
23
All other states
57.0
0.36
59.7
0.09
59.4
0.09
Total
$125.2
0.27%
$131.8
0.09%
$132.1
0.05%
UPB
($ Billions)
September 30, 2013
UPB
($ Billions)
Delinquency
Rate
2
(%)
June 30, 2013
Delinquency
Rate
2
(%)
September 30, 2012
Delinquency
Rate
2
(%)
UPB
($ Billions)
Based
on
either:
(a)
the
year
of
acquisition,
for
loans
recorded
on
the
company’s
consolidated
balance
sheets;
or
(b)
the
year
that
the
company
issued
its
guarantee,
for
the
remaining loans in its multifamily mortgage portfolio.
|
 36
Multifamily
mortgage
portfolio
by
attribute,
continued
1
Based
on
the
unpaid
principal
balance
(UPB)
of
the
multifamily
mortgage
portfolio.
2
Based on the UPB of mortgages two monthly payments or more past due or in the
process of foreclosure. 3
Current Loan Size
1
> $25M
$46.3
0.12%
$49.9
0.05%
$50.8
-
%
2
> $5M & <= $25M
69.6
0.36
73.0
0.09
72.4
0.07
3
> $3M & <= $5M
5.9
0.35
5.8
0.22
5.8
0.23
4
> $750K & <= $3M
3.2
0.40
2.9
0.46
2.9
0.23
5
<= $750K
0.2
0.62
0.2
0.38
0.2
0.45
6
Total
$125.2
0.27%
$131.8
0.09%
$132.1
0.05%
Legal Structure
7
Unsecuritized Loans
$80.3
0.16%
$69.4
0.04%
$64.9
0.05%
8
Freddie Mac mortgage-related securities
35.4
0.49
53.1
0.17
58.1
0.07
9
Other guarantee commitments
9.5
0.40
9.3
-
9.1
-
10
Total
$125.2
0.27%
$131.8
0.09%
$132.1
0.05%
Credit Enhancement
11
Credit Enhanced
$42.7
0.45%
$59.3
0.15%
$64.1
0.06%
12
Non-Credit Enhanced
82.5
0.18
72.5
0.04
68.0
0.05
13
Total
$125.2
0.27%
$131.8
0.09%
$132.1
0.05%
Other
14
Original LTV > 80%
$6.2
2.75%
$5.5
0.51%
$5.2
0.33%
15
Original DSCR below 1.10
3
$2.7
3.18%
$2.1
0.91%
$2.0
0.30%
September 30, 2013
UPB
($ Billions)
Delinquency
Rate
2
(%)
June 30, 2013
Delinquency
Rate
2
(%)
September 30, 2012
Delinquency
Rate
2
(%)
UPB
($ Billions)
UPB
($ Billions)
1
DSCR –
Debt Service Coverage Ratio –
is an indicator of future credit performance for multifamily loans. DSCR estimates
a multifamily borrower’s ability to service its mortgage obligation
using the secured property’s cash flow, after deducting non-mortgage expenses from income. The higher the DSCR, the more
likely
a
multifamily
borrower
will
be
able
to
continue
servicing
its
mortgage
obligation. |
 0.00%
Multifamily market and Freddie Mac delinquency rates
Percent
1
37
7.38%
1.13%
0.09%
1
Freddie Mac (60+ day)
FDIC Insured Institutions (90+ day)
MF CMBS Market (60+ day)
ACLI Investment Bulletin (60+ day)
See “MD&A – RISK MANAGEMENT – Credit Risk – Mortgage Credit Risk –
Multifamily Mortgage Credit Risk ” in Freddie Mac’s Form 10-K for the year ended December 31,
2012, for information about the company’s reported multifamily delinquency rate. The
multifamily delinquency rate at September 30, 2013 was 0.05%.
Source: Freddie Mac, FDIC Quarterly Banking Profile, TREPP (CMBS multifamily 60+ delinquency rate,
excluding REOs), American Council of Life Insurers (ACLI). Non-Freddie Mac data is not
yet available for the third quarter of 2013. |
 38
Safe Harbor Statements
Freddie Mac obligations
Freddie Mac’s securities are obligations of Freddie Mac only. The securities,
including any interest or return of discount on the securities, are not
guaranteed by and are not debts or obligations of the United States or any federal agency or instrumentality other than Freddie
Mac.
No offer or solicitation of securities
This
presentation
includes
information
related
to,
or
referenced
in
the
offering
documentation
for,
certain
Freddie
Mac
securities,
including offering circulars and related supplements and agreements. Freddie Mac
securities may not be eligible for offer or sale in certain
jurisdictions
or
to
certain
persons.
This
information
is
provided
for
your
general
information
only,
is
current
only
as
of
its
specified
date and does not constitute an offer to sell or a solicitation of an offer to buy
securities. The information does not constitute a sufficient basis
for
making
a
decision
with
respect
to
the
purchase
or
sale
of
any
security.
All
information
regarding
or
relating
to
Freddie
Mac
securities
is
qualified
in
its
entirety
by
the
relevant
offering
circular
and
any
related
supplements.
Investors
should
review
the
relevant
offering circular and any related supplements before making a decision with respect
to the purchase or sale of any security. In addition, before purchasing any
security, please consult your legal and financial advisors for information about and analysis of the security, its
risks and its suitability as an investment in your particular circumstances.
Forward-looking statements
Freddie Mac's presentations may contain forward-looking statements, which may
include statements pertaining to the conservatorship, the company’s
current expectations and objectives for its efforts under the MHA Program, the servicing alignment initiative and other
programs to assist the U.S. residential mortgage market, future business plans,
liquidity, capital management, economic and market conditions and trends,
market share, the effect of legislative and regulatory developments, implementation of new accounting guidance,
credit
losses,
internal
control
remediation
efforts,
and
results
of
operations
and
financial
condition
on
a
GAAP,
Segment
Earnings
and
fair value basis. Forward-looking statements involve known and unknown risks
and uncertainties, some of which are beyond the company’s control.
Management’s expectations for the company’s future necessarily involve a number of assumptions, judgments and
estimates, and various factors, including changes in market conditions, liquidity,
mortgage-to-debt option-adjusted spread, credit outlook, actions
by FHFA, Treasury, the Federal Reserve, the SEC, HUD, other federal agencies, the Administration and Congress, and the
impacts of legislation or regulations and new or amended accounting guidance, could
cause actual results to differ materially from these expectations. These
assumptions, judgments, estimates and factors are discussed in the company’s Annual Report on Form 10-K for
the year ended December 31, 2012, Quarterly Reports on Form 10-Q for the
quarters ended March 31, 2013, June 30, 2013 and September 30, 2013 and
Current Reports on Form 8-K, which are available on the Investor Relations page of the company’s Web site at
www.FreddieMac.com/investors and the SEC’s Web site at www.sec.gov. The
company undertakes no obligation to update forward- looking statements it
makes to reflect events or circumstances after the date of this presentation. |